Article

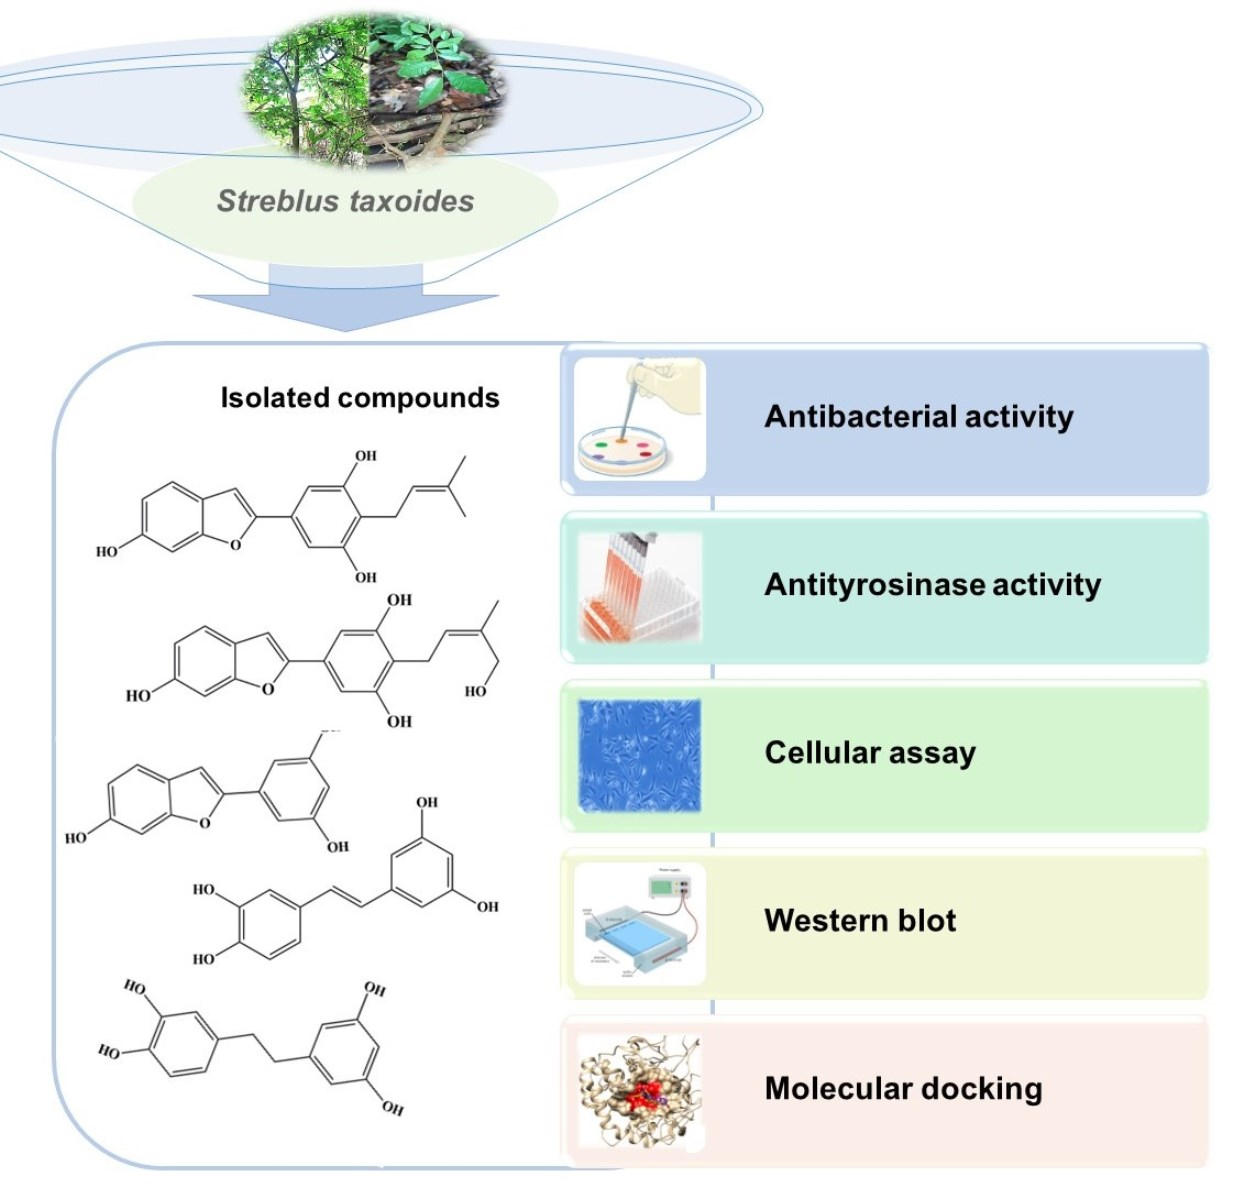
Chemical Constituents from Streblus taxoides Wood with Their Antibacterial and Antityrosinase Activities Plus in Silico Study

by
Kedsaraporn Parndaeng
1,
Thanet Pitakbut
2,
Chatchai Wattanapiromsakul
1,
Jae Sung Hwang
3,
Wandee Udomuksorn
4 and
Sukanya Dej-adisai
1,*
1
Department of Pharmacognosy and Pharmaceutical Botany, Faculty of Pharmaceutical Sciences, Prince of Songkla University, Hat-Yai 90112, Songkhla, Thailand
2
Pharmaceutical Biology, Department of Biology, Friedrich-Alexander-Universität Erlangen-Nürnberg (FAU), Staudtstr. 5, 91058 Erlangen, Germany
3
Department of Genetic Engineering & Graduate School of Biotechnology, College of Life Sciences, Kyung Hee University, Youngin 17104, Republic of Korea
4
Pharmacology Program, Division of Health and Applied Science, Faculty of Science, Prince of Songkla University, Hat-Yai 90112, Songkhla, Thailand
*
Author to whom correspondence should be addressed.
Antibiotics 2023, 12(2), 319; https://doi.org/10.3390/antibiotics12020319
Submission received: 27 December 2022 / Revised: 28 January 2023 / Accepted: 1 February 2023 / Published: 3 February 2023
(This article belongs to the Special Issue Antimicrobial Activity of Plant Extracts)

Abstract

:
Hyperpigmentation frequently occurs after inflammation from bacterial infection. Thus, the inhibition activity of tyrosinase, the key enzyme to catalyze the melanogenesis and/or inhibition of bacterial infection, could decrease melanin production. Hence, the potential inhibitors could be discovered from natural products. ω-Hydroxymoracin C (1), a new compound with two other 2-arylbenzofurans, i.e., moracin M (2) and moracin C (3), and two stilbenes, i.e., 3, 4, 3’, 5′-tetrahydroxybibenzyl (4) and piceatannol (5), were isolated from the wood of Streblus taxoides. Compound 4 showed a strong inhibitory activity against tyrosinase enzyme with an IC50 value of 35.65 µg/mL, followed by compound 2 with an IC50 value of 47.34 µg/mL. Conversely, compound 1, 3 and 5 showed moderate activity, with IC50 values of 109.64, 128.67 and 149.73 µg/mL, respectively. Moreover, compound 1 and 3 showed an antibacterial effect against some Staphylococcus spp. Thus, the isolated compounds exhibited potential antityrosine and antibacterial effects. Additionally, an in silico study was performed in order to predict theoretical molecular interactions between the obtained metabolites from S. taxoides and tyrosinase as an extended in vitro enzyme binding assay experiment.

Graphical Abstract

1. Introduction

Gram-positive pathogenic bacteria are the main cause of human skin diseases; for example, Staphylococcus aureus and S. epidermidis can be a cause of impetigo, folliculitis and furunculosis [1] and Cutibacterium acnes can be a cause of skin inflammation, such as papules, pustules and so on [2]. Acne vulgaris or acne inflammation is one of the dermal skin infection diseases which causes negative social and psychological effects on sufferers. The facial skin infection caused by Cutibacterium acnes, Malassezia furfur, S. epidermidis and S. aureus can cause acne inflammation [3,4]. Interleukins (ILs) and some inflammatory mediators can stimulate tyrosinase activity and melanin synthesis by modulating proliferation and differentiation of human epidermal melanocytes and can also promote melanogenesis-related gene expression directly or indirectly [5,6,7,8,9]. Prostaglandin E2 (PGE2) and PGF2α are involved in all types of skin inflammation, which can stimulate melanocyte dendrite formation through a cAMP-dependent pathway, activate tyrosinase in melanocytes, increase melanin secretion, and induce pigmentation [10,11]. Conversely, IL-18 increases tyrosinase activity and upregulates tyrosinase-related protein 1 (TRP-1) and TRP-2 expression, IL-33 promotes microphthalmia-associated transcription factor (MITF), (tyrosinase) TYR, TRP-1 and TRP-2 expression by activating the p38/mitogen-activated protein kinase (MAPK) and protein kinase A (PKA) pathways and IL-1α combines keratinocyte growth factor (KGF) to increase melanin deposition [10]. Moreover, histamine induces morphologic changes and melanin synthesis of human melanocytes by PKA activation via H₂ receptor-mediated cAMP accumulation [12].
Melanin is the main pigment in mammals, found in skin, hair and eyes [13,14]. The major function of melanin is to provide protection against ultraviolet (UV) radiation, but abnormal melanin (hyperpigmentation) can lead to skin disorders [14]. Melanin is synthesized through a complex pathway, i.e., melanogenesis in melanosomes [15]. The regulation of melanogenesis is controlled by a variety of paracrine cytokines, including α-melanocyte-stimulating hormone (α-MSH), stem cell factor (SCF), endothelin-1 (ET-1), nitric oxide (NO), adrenocorticotropic hormone (ACTH), prostaglandins, thymidine dinucleotide and histamine. All factors induce melanogenesis through diverse signaling pathways by activating the expression and activation of pigment-related proteins such as microphthalmia-associated transcription factor (MITF); the master regulator of melanogenesis in melanocytes via binding to the M box of a promoter region and regulating the gene expression of tyrosinase (TYR), tyrosine-related protein-1 (TRP-1) and tyrosine-related protein-2 (TRP-2) [8,9,10]. There are three enzymes involved in the melanogenesis pathway: tyrosinase (TYR), tyrosinase-related protein 1 (TRP1) and DOPAchrome tautomerase (DCT) or tyrosinase-related protein 2 (TRP2). However, only tyrosinase (TYR) is absolutely necessary for melanogenesis, because it is a key enzyme in the process [16,17].
The biologically active compounds from plants have always provided scientists with new sources of useful drugs against infectious diseases. Many plants of the Moraceae family are used in the treatment of infectious diseases [18,19,20,21,22,23,24,25,26,27,28,29,30,31,32,33,34,35,36,37,38,39,40,41,42,43] and hyperpigmentation by inhibition of the tyrosinase enzyme [26,34,41,42,43,44,45,46,47,48,49,50,51,52,53,54,55,56,57,58,59]. Streblus taxoides has been reported to have potential antibacterial and antityrosinase activities [42]. The aim of this investigation was to evaluate the antibacterial and antityrosinase activities of the crude extracts and isolated compounds from S. taxoides.

2. Results and Discussion

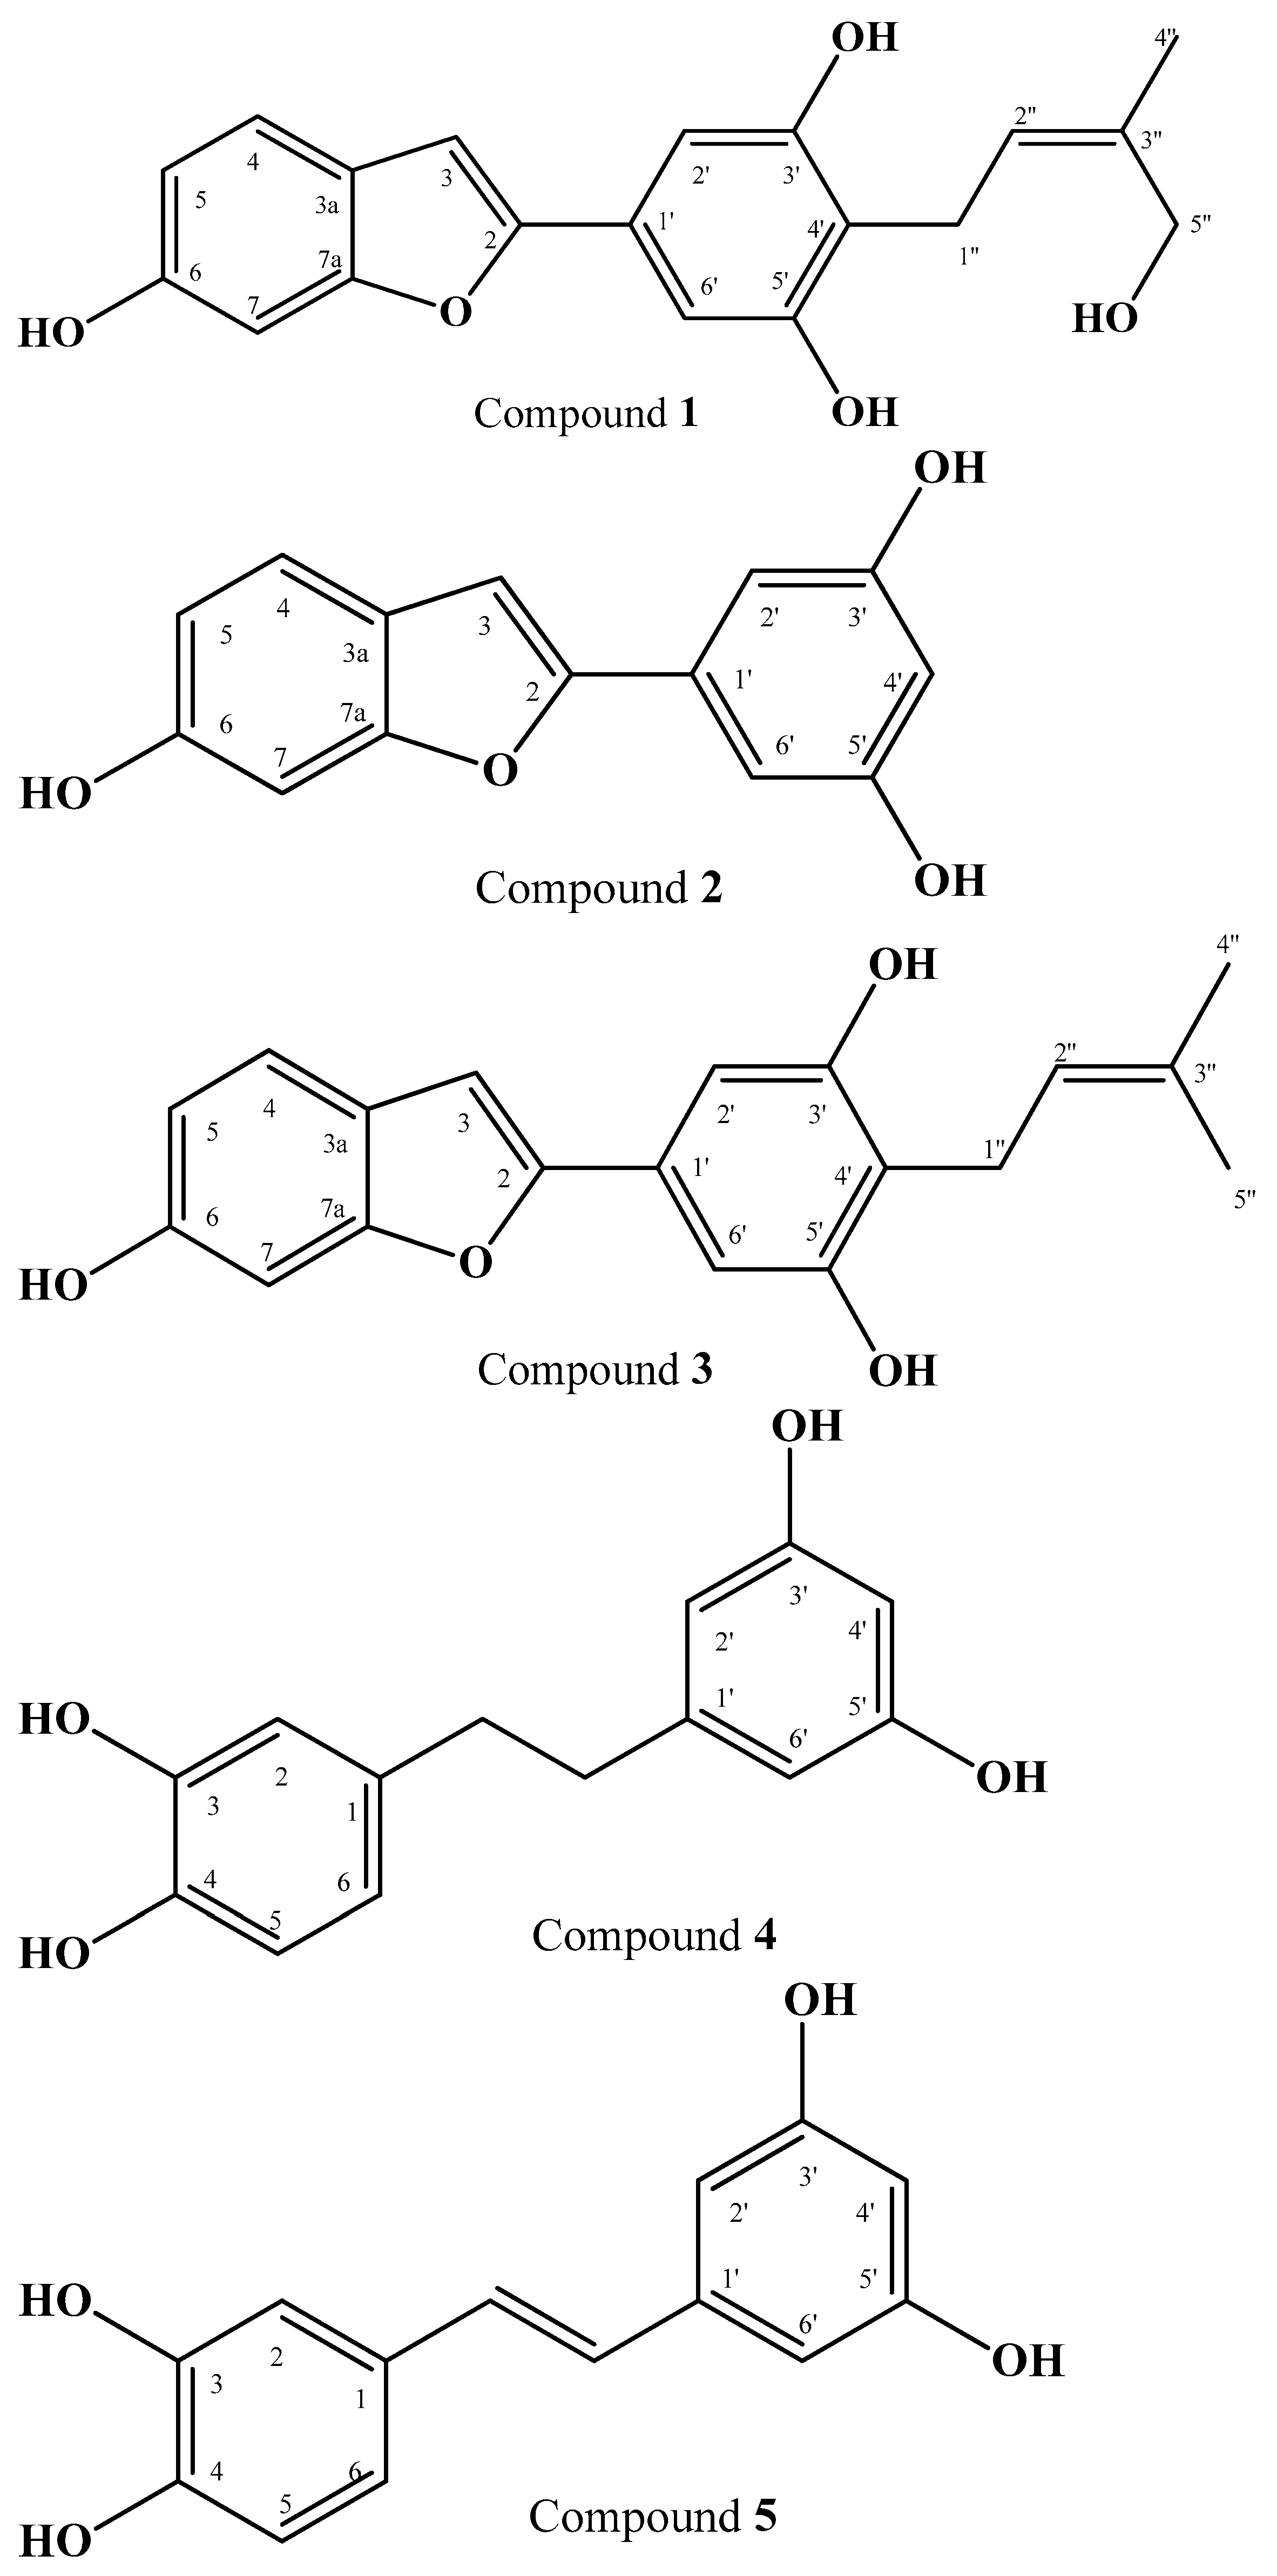
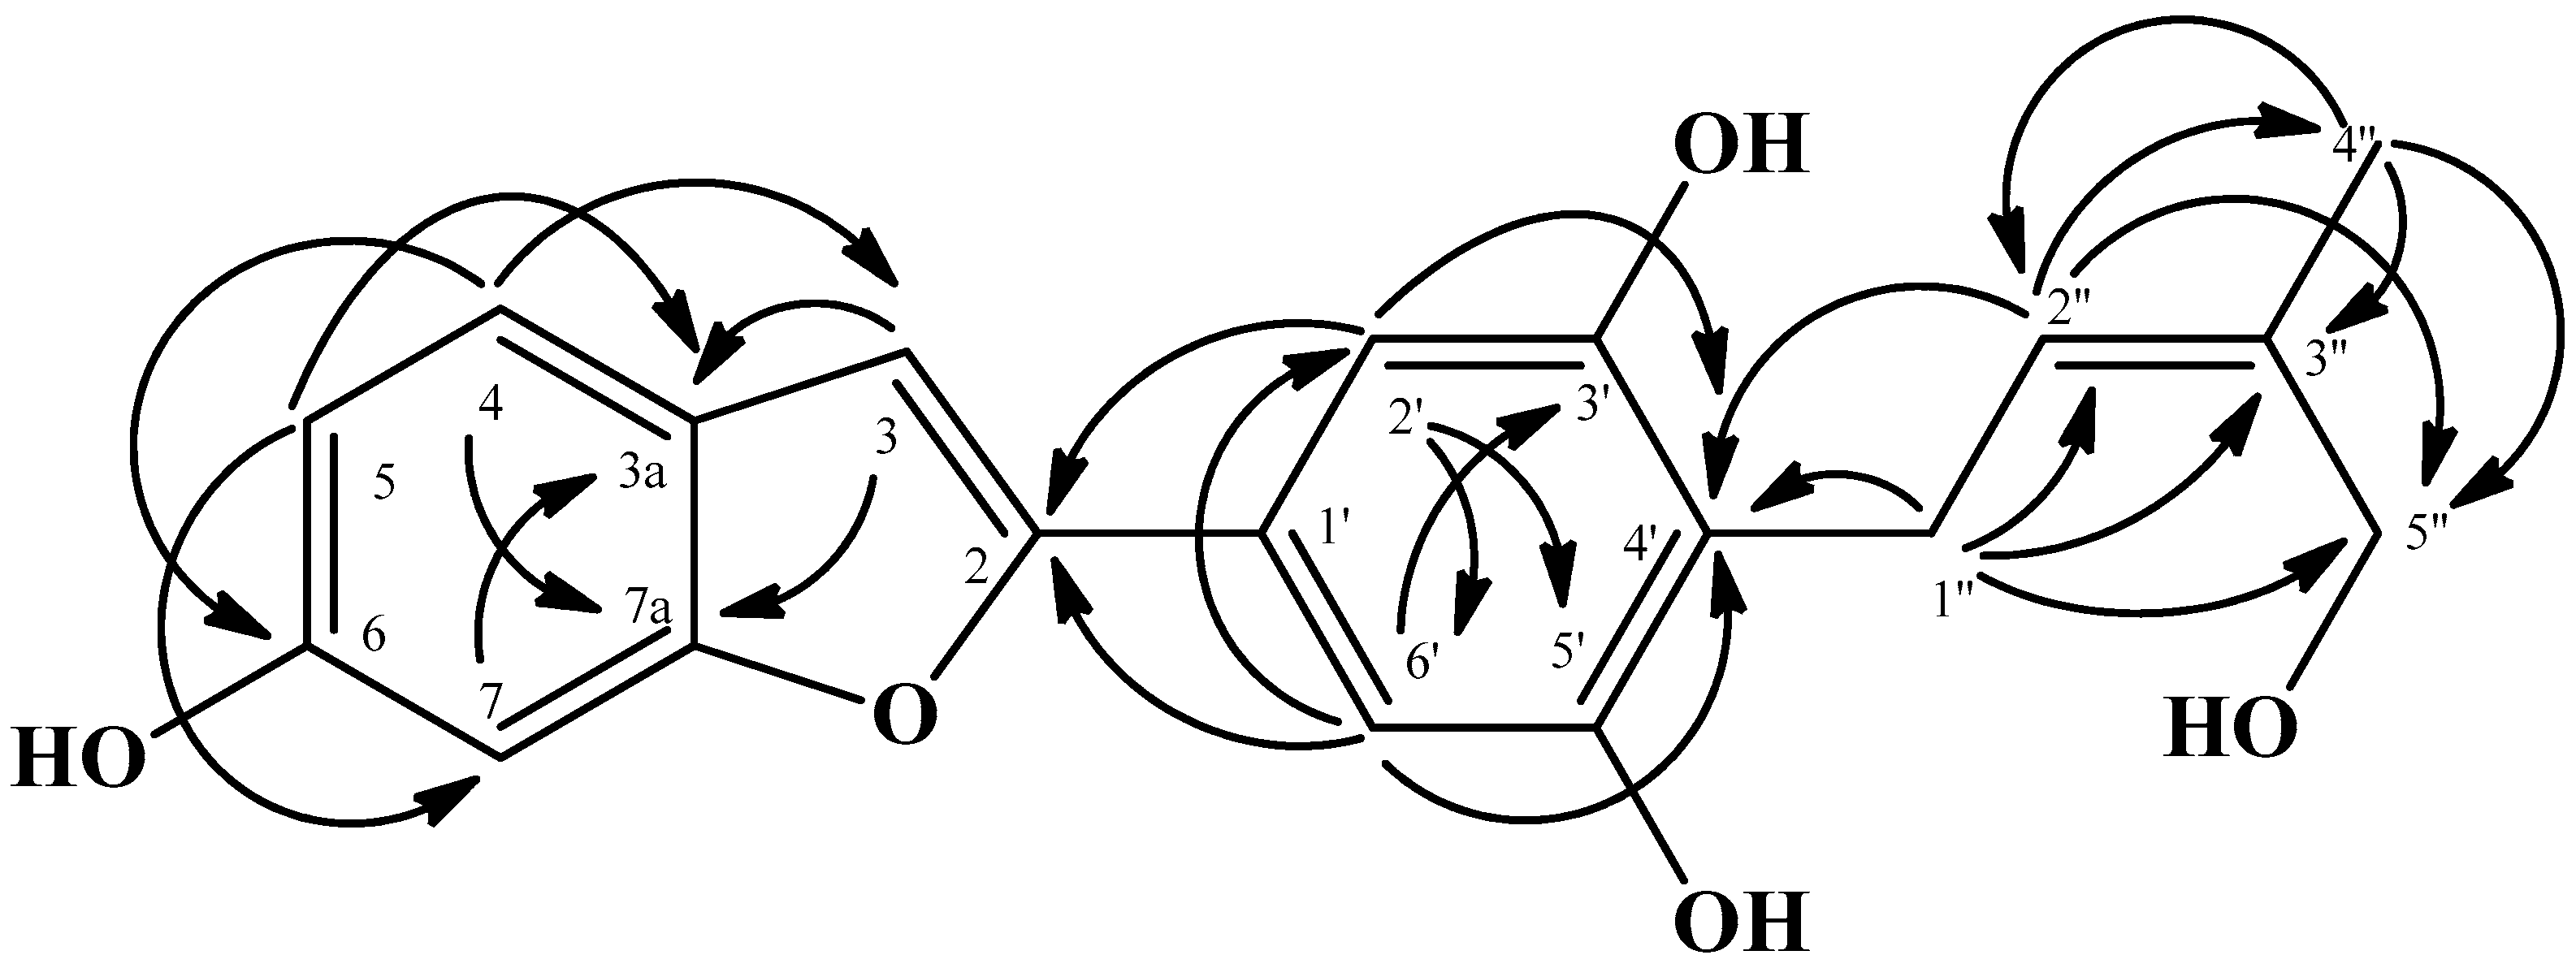
2.1. Structure Elucidation of Isolated Compounds

Repeated open column chromatography (SiO2, ODS and Sephadex LH-20 resins) of the ethyl acetate and methanol fractions from the Streblus taxoides wood resulted in the isolation of three 2-arylbenzofuran compounds, including one new compound, named ω-Hydroxymoracin C (1), two known arylbenzofuran compounds (23) and two known stilbene compounds (45) (Figure 1). The chemical structures of the isolated compounds were elucidated based on the 1D-NMR and 2D-NMR, MS and IR spectroscopic data. The known compounds were finally identified to be moracin M ( 2), moracin C (3), 3, 4, 3′, 5′-tetrahydroxybibenzyl (4) and piceatannol (5) by comparing the spectroscopic data with those previously reports [41,60,61,62]. 1H-NMR and 13C-NMR spectra of new compounds are available for the spectroscopic data.
ω-Hydroxymoracin C
Compound 1 was obtained as a brown amorphous powder, soluble in methanol. The UV spectrum in methanol showed absorptions at λmax 210, 317 and 329 nm. The IR spectrum showed the absorption bands at 3216, 1620, 1489, 1444, 1351, 1308, 1150, 1002 and 825 cm−1. The EIMS showed a molecular ion peak at m/z 362 corresponding to C19H18O5. The 1H-NMR spectrum exhibited five signals of 2-arylbenzofuran and 4 signals of ω-hydroxy prenyl moiety. Three olefinic proton signals of typical ortho- and meta-coupled patterns of ring A at δH 7.32 (1H, d, J = 8.3 Hz, H-4), 6.72 (1H, dd, J = 8.3, 2.2 Hz, H-5) and 6.87 (1H, d, J = 2.2 Hz, H-7) with one olefinic proton signal of ring C at δH 6.82 (1H, d, 0.9, H-3) were identified as a 2-substituted-6-hydroxybenzofuran. One olefinic proton signal at δH 6.76 (2H, s, H-2′, H-6′) indicated the characteristics of a symmetrical 4-substituted-3,5-dihydroxyphenyl. The ω-hydroxy prenyl moiety proton signals consisted of; one olefinic proton at δH 5.55 (1H, m, H-2″), two methylenes protons at δH 3.90 (2H, s, H-5″) and 3.38 (2H, brd, J = 7.32 Hz, H-1″) and one methyl proton at δH 1.81 (3H, s, H-4″). The abovementioned evidence suggests that Compound 1 is a 2-arylbenzofuran with a ω-hydroxy prenyl moiety. The 13C-NMR spectrum showed 17 carbon signals. The 2-arylbenzofuran moiety showed: four oxygenated olefinic quaternary signals at δC 157.61 (C-3′, 5′), 157.17 (C-6) a 156.64 (C-2) and 156.46 (C-7a), five olefinic methine signals at δC 121.77 (C-4), 113.12 (C-5), 103.81 (C-2′, 6′), 101.33 (C-3) and 98.45 (C-7) and three methylenes signals at δC 130.45 (C-1′), 123.19 (C-3a) and 116.26 (C-4′). In addition, the following signals of a ω-hydroxy prenyl moiety, confirmed by a previous report [63], were observed: one olefinic quaternary signals at δC 135.07 (C-3″), one olefinic methines at δC 125.89 (C-2″), one oxygenated methylenes signal at δC 69.32 (C-5″), one methylenes signal at δC 22.95 (C-1″) and one methyls signal at δC 13.83 (C-4″). The 2-arylbenzofuran structure and the location of the ω-hydroxy prenyl moiety were proven by HMBC-NMR experiments, which suggested all positions and the substitution of the ω-hydroxy prenyl moiety could be formed at the C-4′ of ring B, which was confirmed by the key correlations in the HMBC spectrum (Figure 2).

2.2. Antimicrobial Activity

The isolated compounds from S. taxoides showed antimicrobial activity against S. epidermidis, S. aureus, MRSA and C. acnes. The MIC and MBC values of the isolated compounds are presented in Table 1. Moracin M showed a weak inhibitory effect against S. epidermidis, S. aureus and MRSA. Conversely, moracin M derivative such as ω-hydroxymoracin C and moracin C showed a stronger inhibitory effect against S. epidermidis, S. aureus and MRSA. Moracin M is the arylbenzofuran, while moracin C and ω-hydroxymoracin C are the moracin M derivatives which connect with prenyl and hydroxyprenyl, respectively. The non-prenylated arylbenzofurans exhibited weaker antimicrobial activity than prenylated arylbenzofurans, because the prenyl group could increase the antimicrobial activity of arylbenzofurans [64]. Moreover, moracin C exhibited the effect against S. aureus by protein biosynthesis inhibition [63].

2.3. Enzymatic Antityrosinase Activity
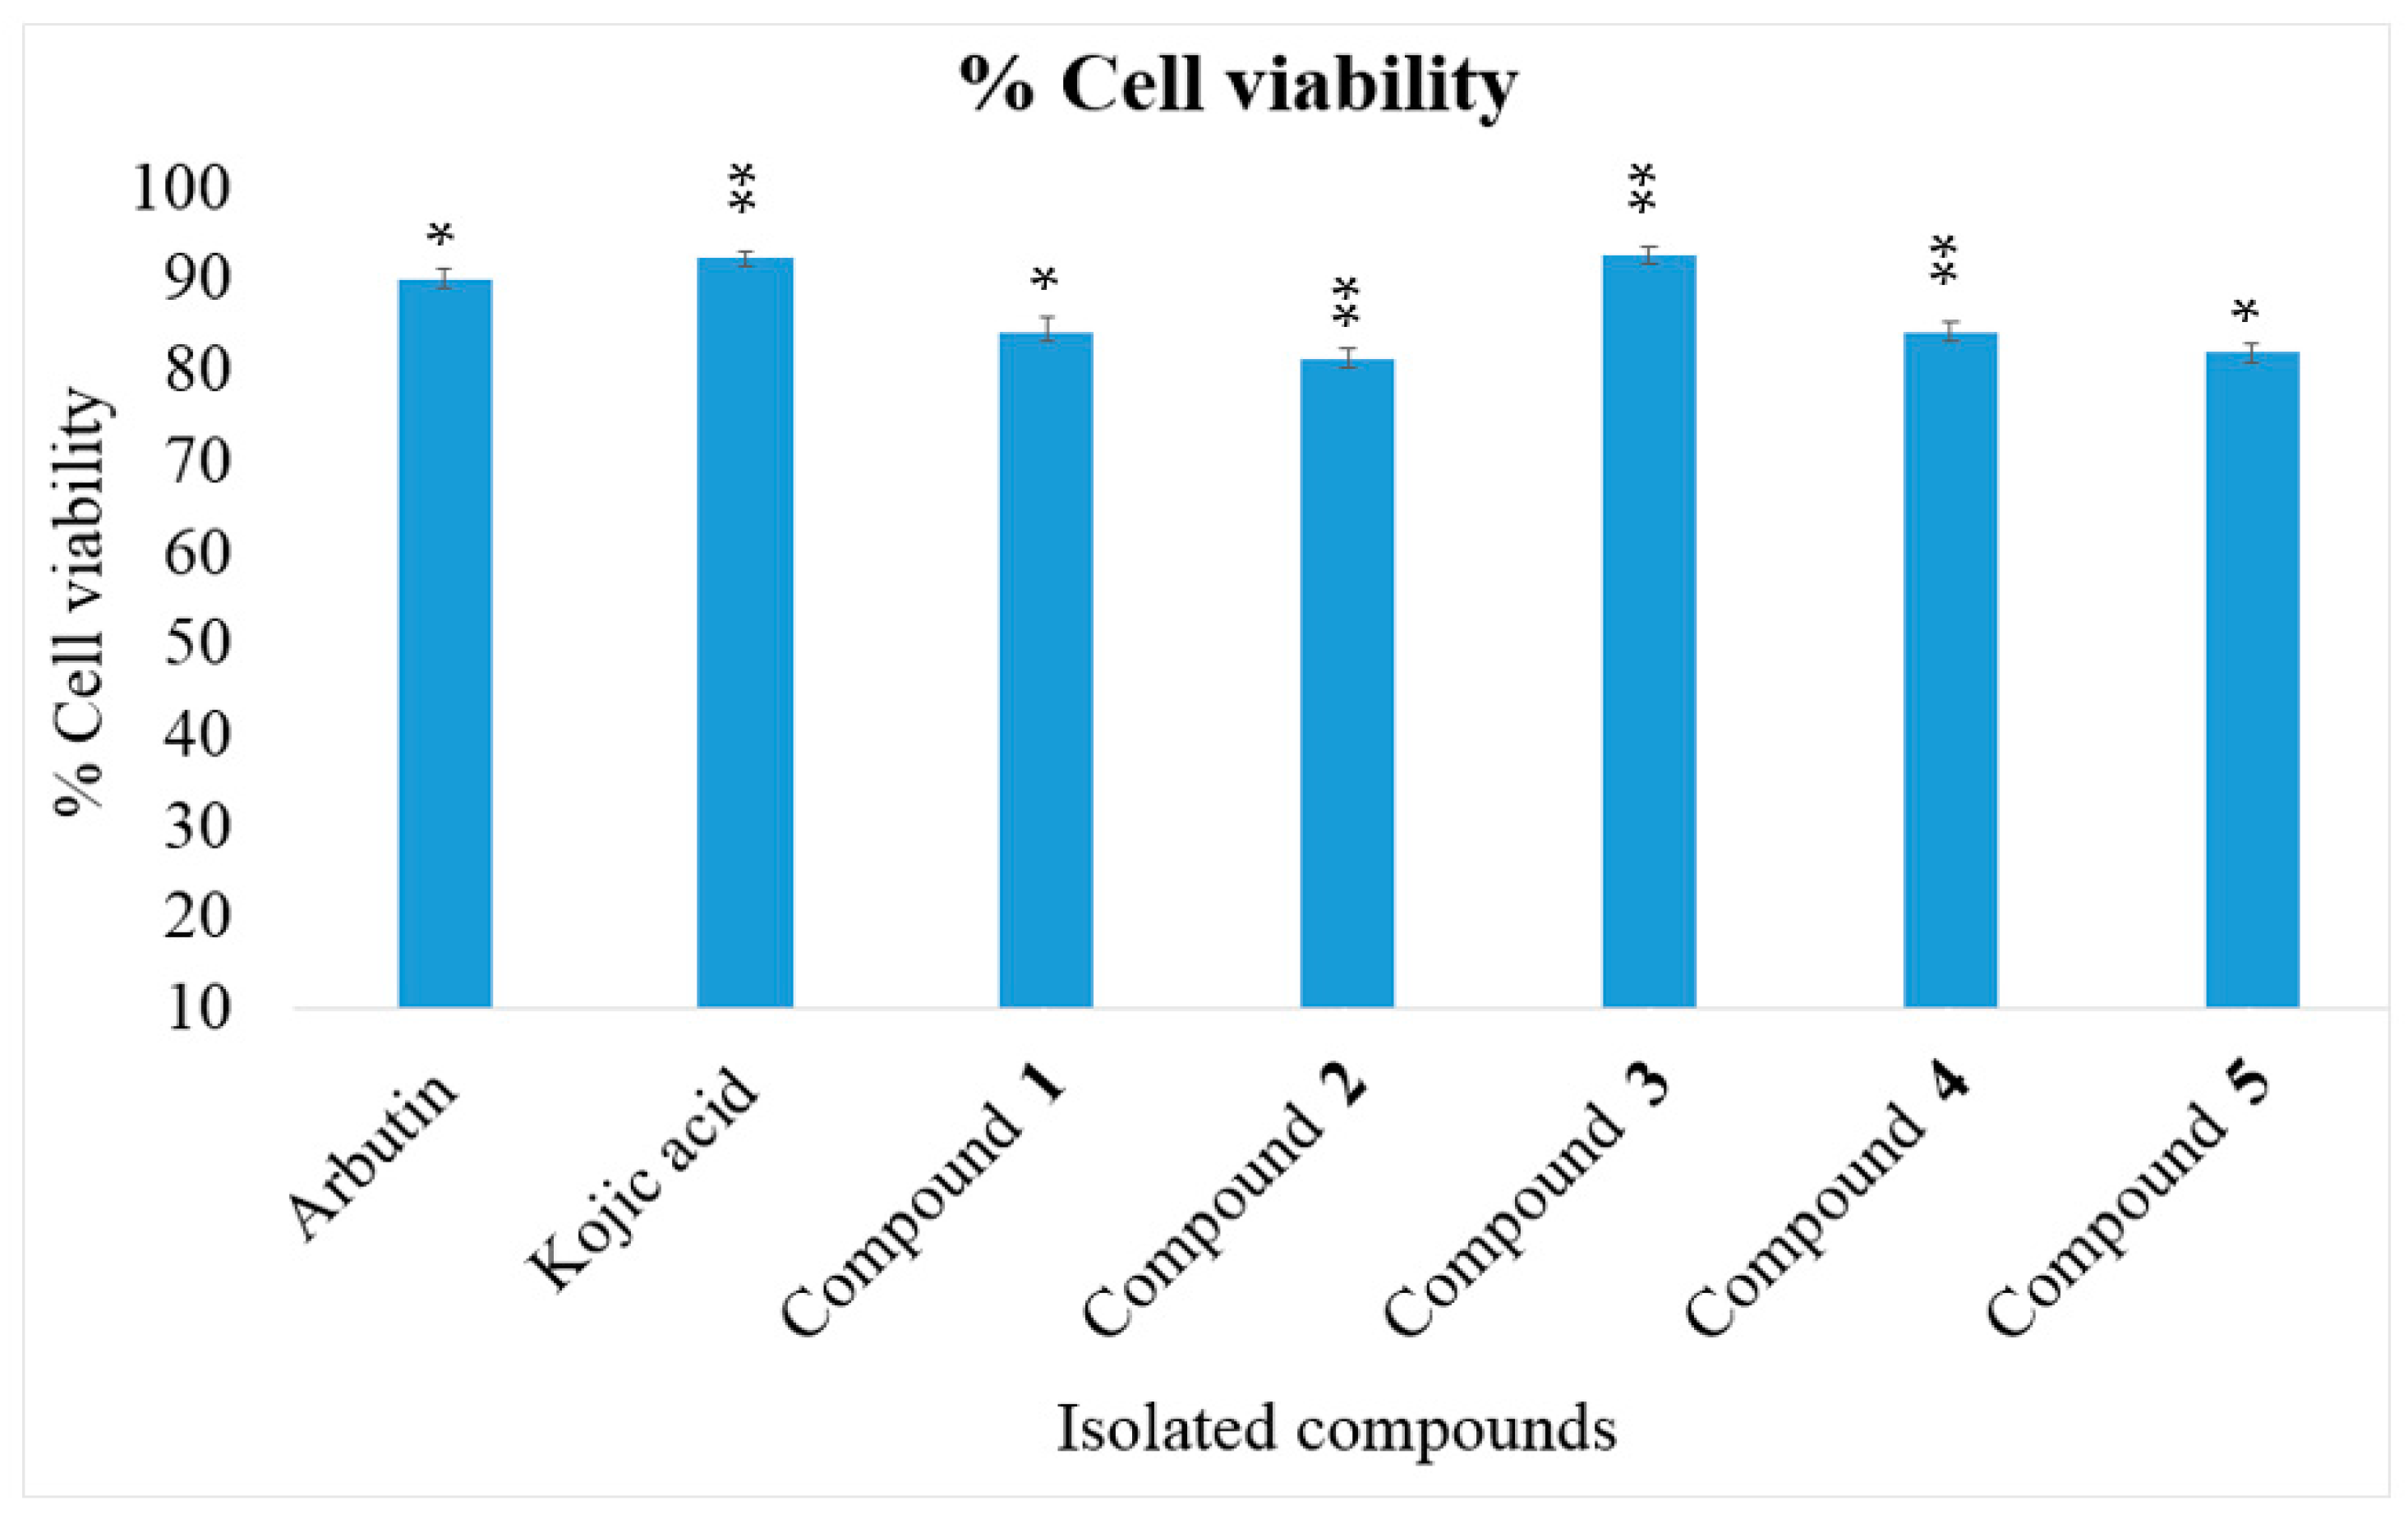
The isolated compounds were determined on antityrosinase activity by Dopachrom method. 3, 4, 3′, 5′-tetrahydroxybibenzyl (4) showed the highest activity against tyrosinase enzyme with a IC50 value of 35.65 µg/mL, followed by moracin M (2) with a IC50 value of 47.34 µg/mL. Conversely, ω-hydroxymoracin C (1), moracin C (3) and piceatannol (5) showed a moderate tyrosinase activity, with IC50 values of 109.64, 128.67 and 149.73 µg/mL, respectively. The results are shown in Table 2.
The stilbene group showed an inhibitory effect against tyrosinase enzyme, because it was substituted with the polyhydroxy group, especially at C-2, C-4, C-3′ and C-5′, and a 4-substituted resorcinol structure is important for the tyrosinase inhibitory activity of several stilbenes [65]. Oxyresveratrol has a 4-substituted resorcinol structure and is a substituent with a hydroxy group at C-2, C-4, C-3′ and C-5′, while piceatannol is substituted with a hydroxy group at C-3, C-4, C-3′ and C-5′. Thus, oxyresveratrol showed an antityrosinase activity higher than piceatannol [66]. Moreover, the bibenzyl structure, 2, 4, 3′, 5′-tetrahydroxybibenzyl, which can be obtained from oxyresveratrol through a single-step reduction reaction, showed an inhibitory effect against tyrosinase activity that was higher than oxyresveratrol [47]; similarly, 3, 4, 3′, 5′-tetrahydroxybibenzyl showed an activity higher than piceatannol. Conversely, ω-hydroxymoracin C, moracin M and moracin C are the stilbene derivatives (2-arylbenzofuran), which showed direct activity against the tyrosinase enzyme. The hydroxyl or methoxy group at the C-6 position might mediate the inhibitory activity compared with other 2-arylbenzofurans, i.e., moracin B, moracin J, moracin N and moracin VN [67,68,69,70]. Moreover, the hydroxyl group at the C-3′ and C-5′ position might be important for the tyrosinase inhibitory activity of several 2-arylbenzofuran compared with moracin D, of which the isoprenyl group forms a six-membered ring with a hydroxyl group at C-3′. Thus, moracin D did not display antityrosinase activity [68]. Conversely, the presence or absence of substituent at C-4′ did not affect the tyrosinase inhibitory activity of 2-arylbenzofuran group, so ω-hydroxymoracin C and moracin C which substituted by hydroprenyl and prenyl group, respectively could compare with moracin VN which substituted by dihydroxymethylbutyl [69].

2.4. Cell Viability

From the results of the enzymatic investigation, the isolated compounds from S. taxoides wood showed antityrosinase activity. Thus, the investigation was extended to cellular experiments. The cell viability was measured first. The results indicated that all sample extracts were not considerable cytotoxic in B16-F1 melanoma cells. Cell viability was still more than 80% at the highest concentration, i.e., 50 μg/mL. The results are shown in Figure 3.

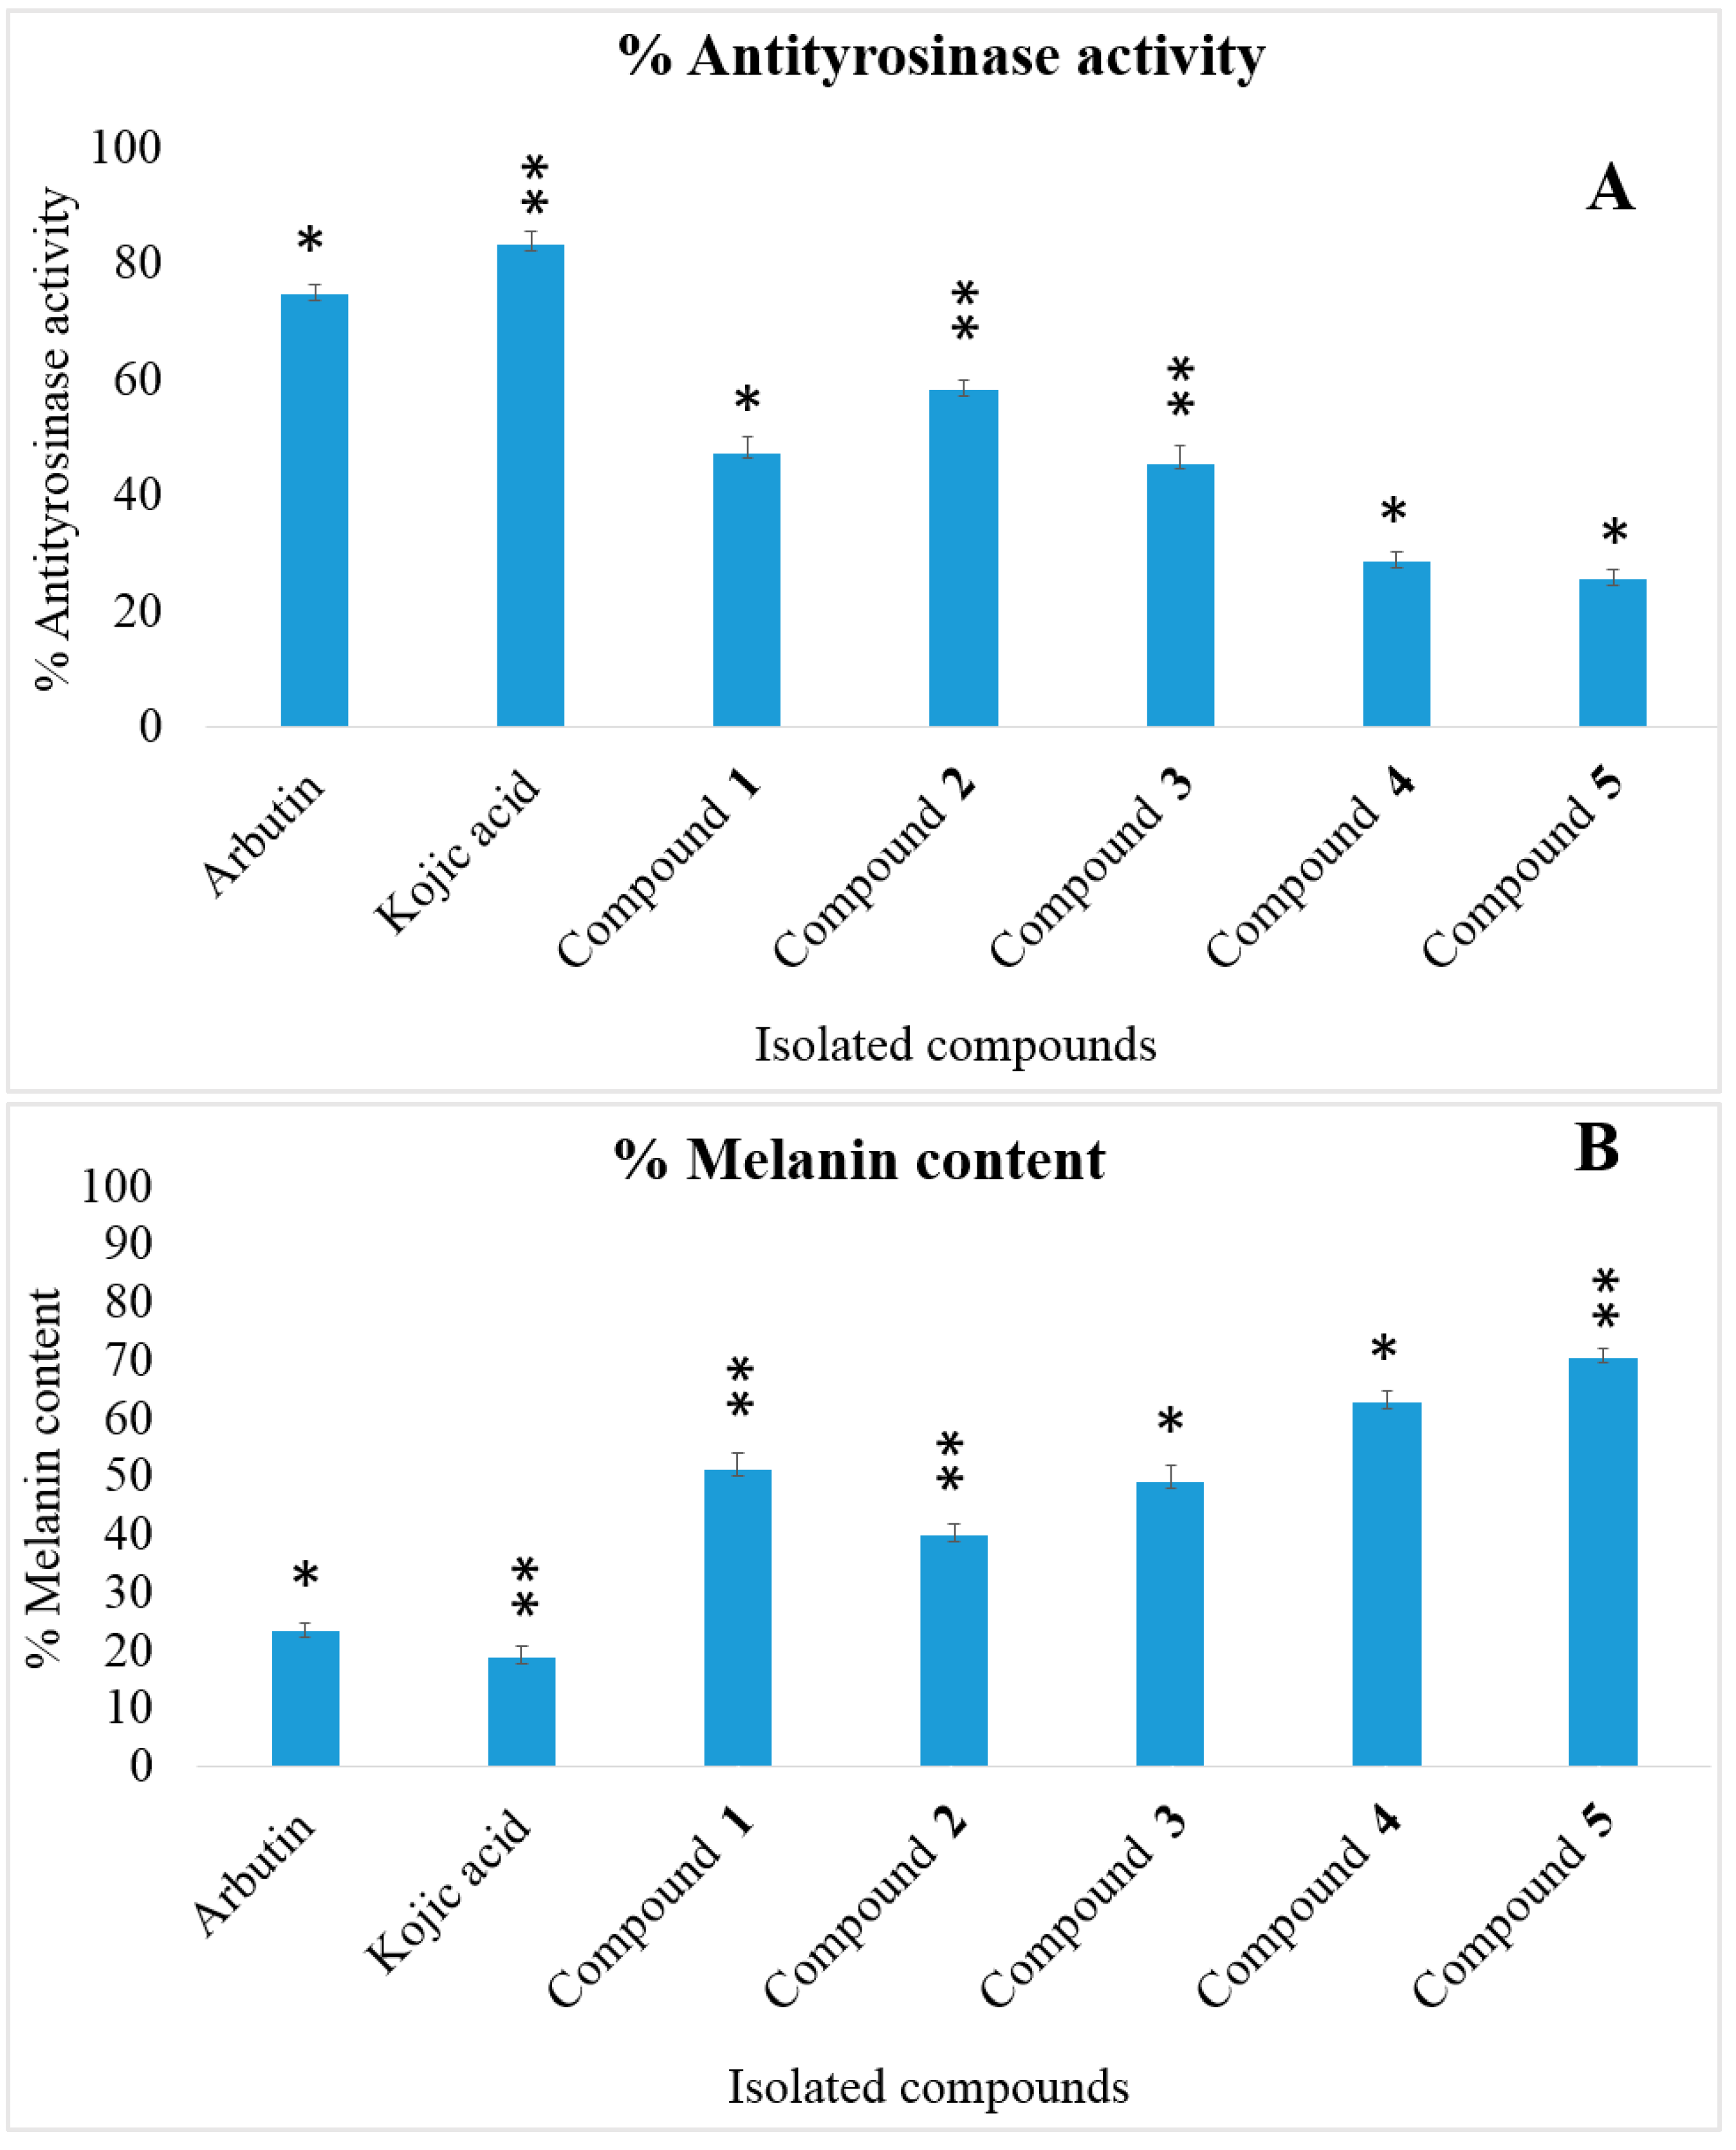
2.5. Intracellular Antityrosinase Activity and Melanin Content
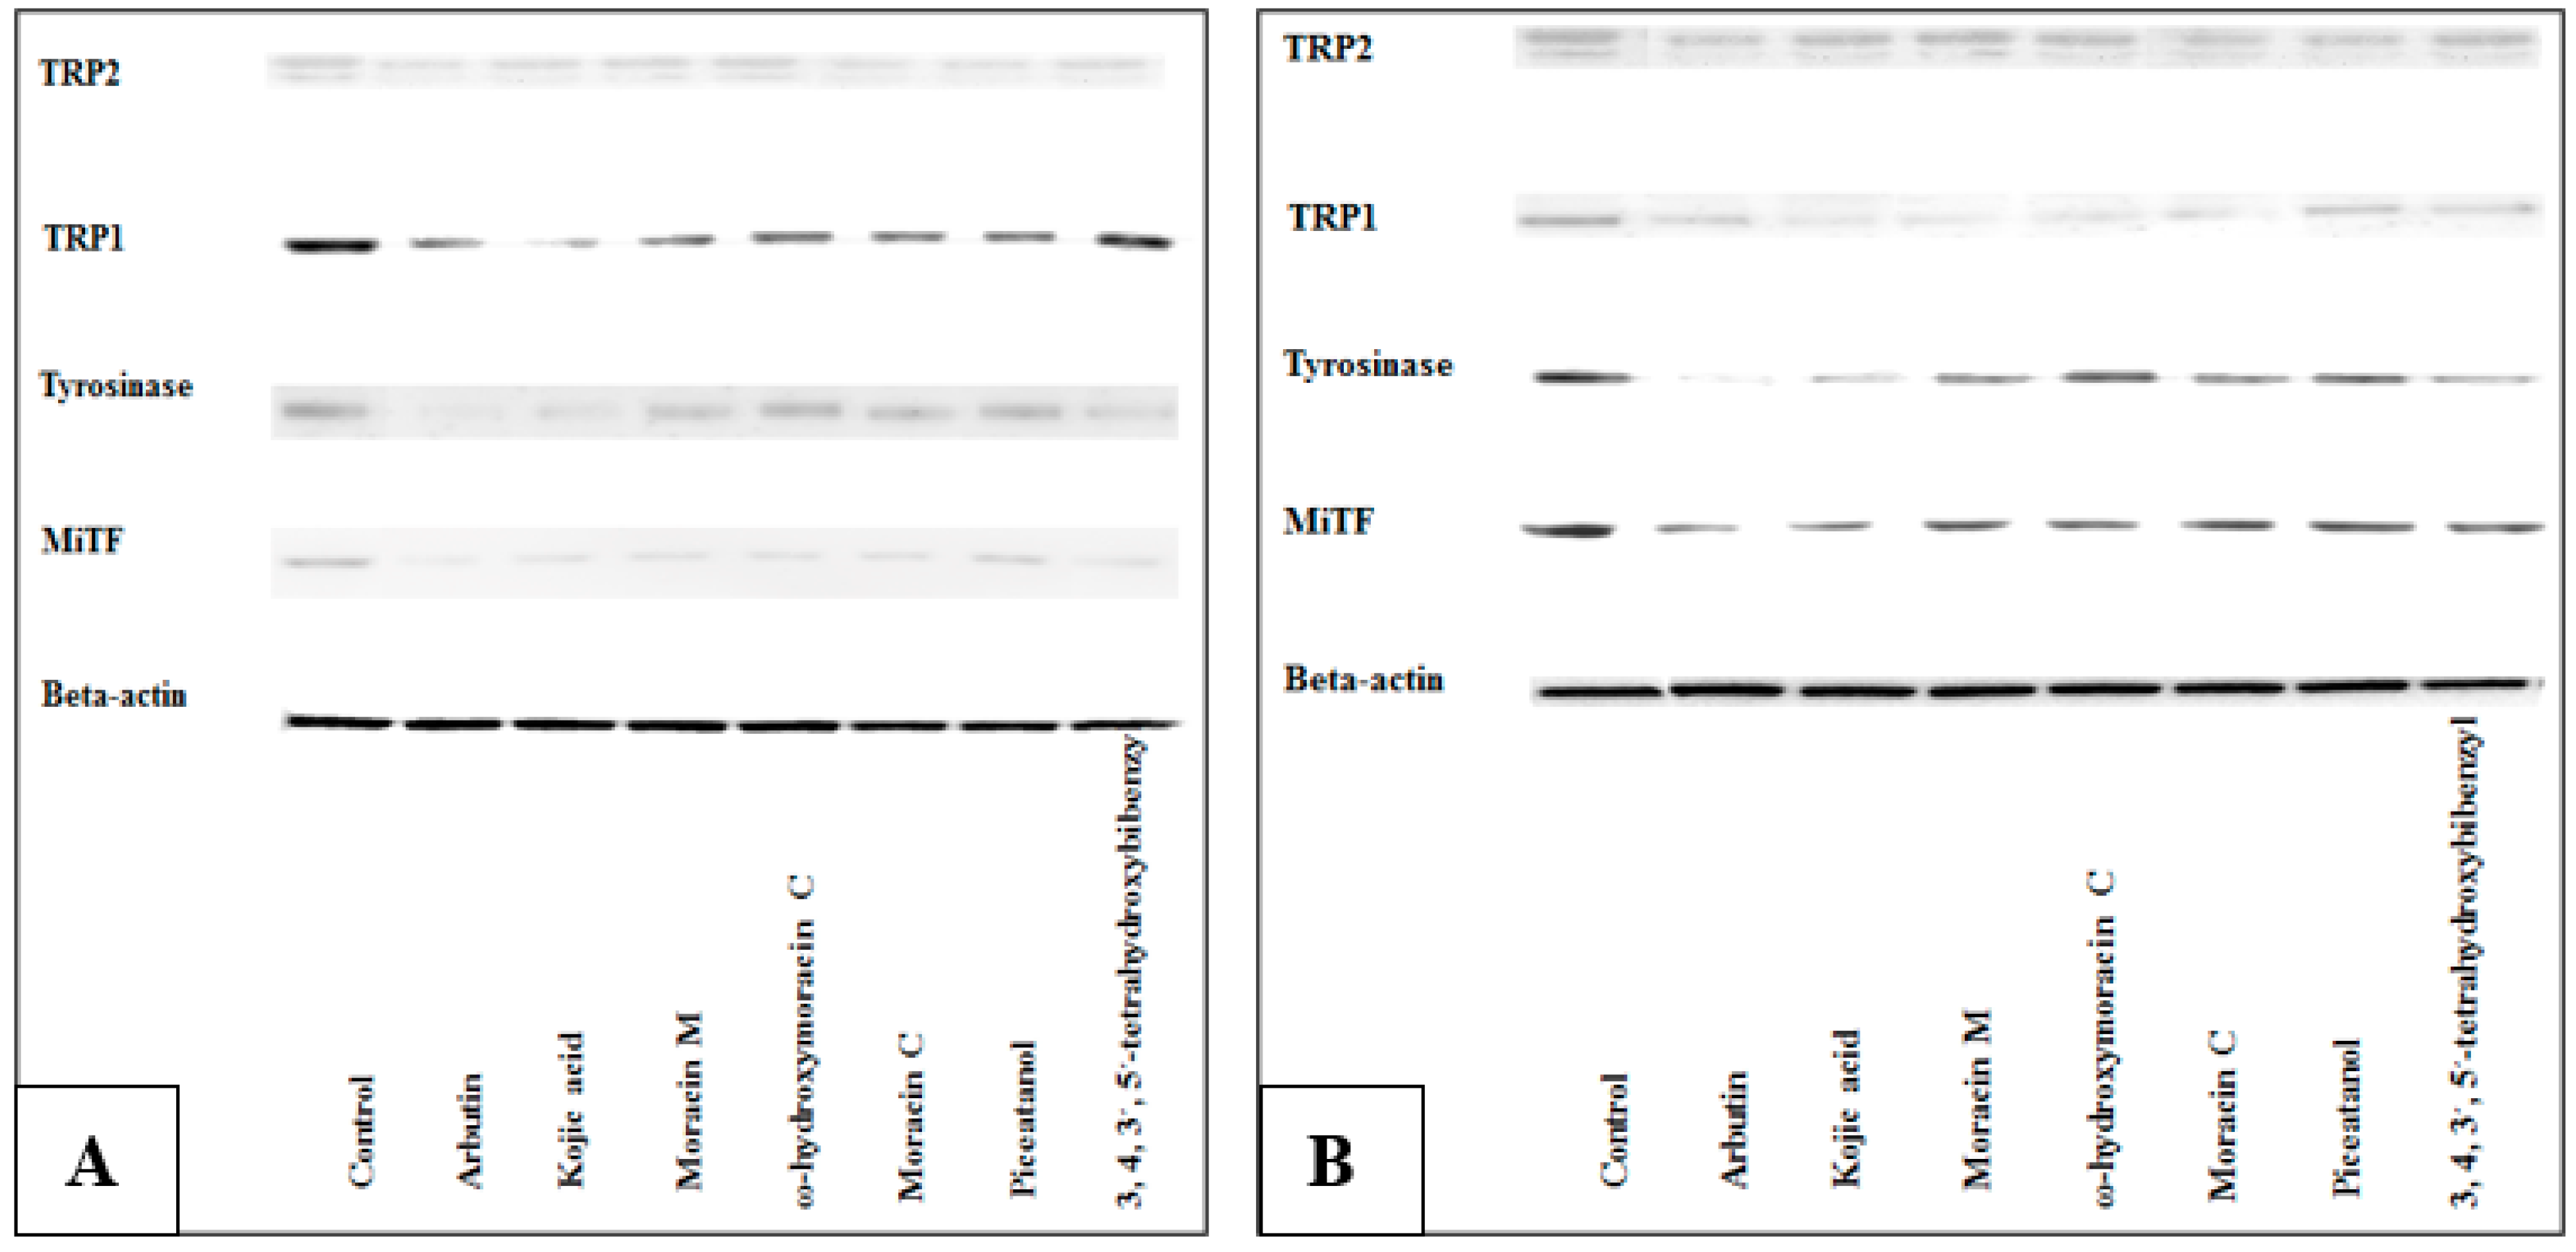
The isolated compounds at concentration as 50 µg/mL demonstrated intracellular antityrosinase activity and influenced the melanin content on B16-F1 melanoma cells. The results showed that ω-hydroxymoracin C (1), moracin M (2) and moracin C (3) exhibited antityrosinase activity (Figure 4A). Moreover, the melanin content showed an inverse relationship with antityrosinase activity; an increase of antityrosinase activity could decrease the amount of melanin content (Figure 4B).
The compounds which exhibited enzymatic tyrosinase inhibitory activity showed two different mechanisms in B16-F1 cells. ω-Hydroxymoracin C, moracin M and moracin C showed potential activity with enzymetic antityrosinase and could decrease the melanin content. Conversely, 3, 4, 3′, 5′-tetrahydroxybibenzyl and piceatannol showed potential activity with enzymetic antityrosinase, but increased the melanin content. This might be because ω-hydroxymoracin C, moracin M and moracin C could inhibit the expression and activation of pigment-related proteins, such as the microphthalmia-associated transcription factor [15,17,71,72,73].

2.6. Western Blot

The isolated compounds from S. taxoides which showed a potential effect of enzymatic antityrosinase activity and were of sufficient quantity to be used for testing were selected to study the melanogenic protein expression in B16-F1 cells.
The results of ω-hydroxymoracin C, moracin M, moracin C, 3, 4, 3′, 5′-tetrahydroxybibenzyl and piceatannol from S. taxoides are shown in Figure 5.
The inhibition of melanogenic proteins related to the Wnt-β-catenin-signaling pathway, phosphatidylinositol 3-kinase-Protein Kinase B or PI3K-Akt signaling pathway, cAMP/PKA signaling pathway and mitogen-activated protein kinases or MAPK signaling pathway could decrease melanogenesis. However, the expression of melanogenic proteins of 2-arylbenzofuran group was not clear. The results from the Western blot analysis revealed that moracin M, ω-hydroxymoracin C and moracin C seemed to decrease the melanin content by decreasing microphthalmia-associated transcription factor (MITF), tyrosinase (TYR), tyrosinase-related protein 1 (TRP1) and tyrosinase-related protein 2 (TRP2). Conversely, piceatannol and 3, 4, 3′, 5′-tetrahydroxybibenzyl, a stilbene compound, increased melanin production by increasing microphthalmia-associated transcription factor (MITF) and tyrosinase (TYR), as confirmed with previous reports, since piceatannol exerted its stimulatory effect on melanogenesis by MAP kinase activation and MITF induction of tyrosinase [17,74].

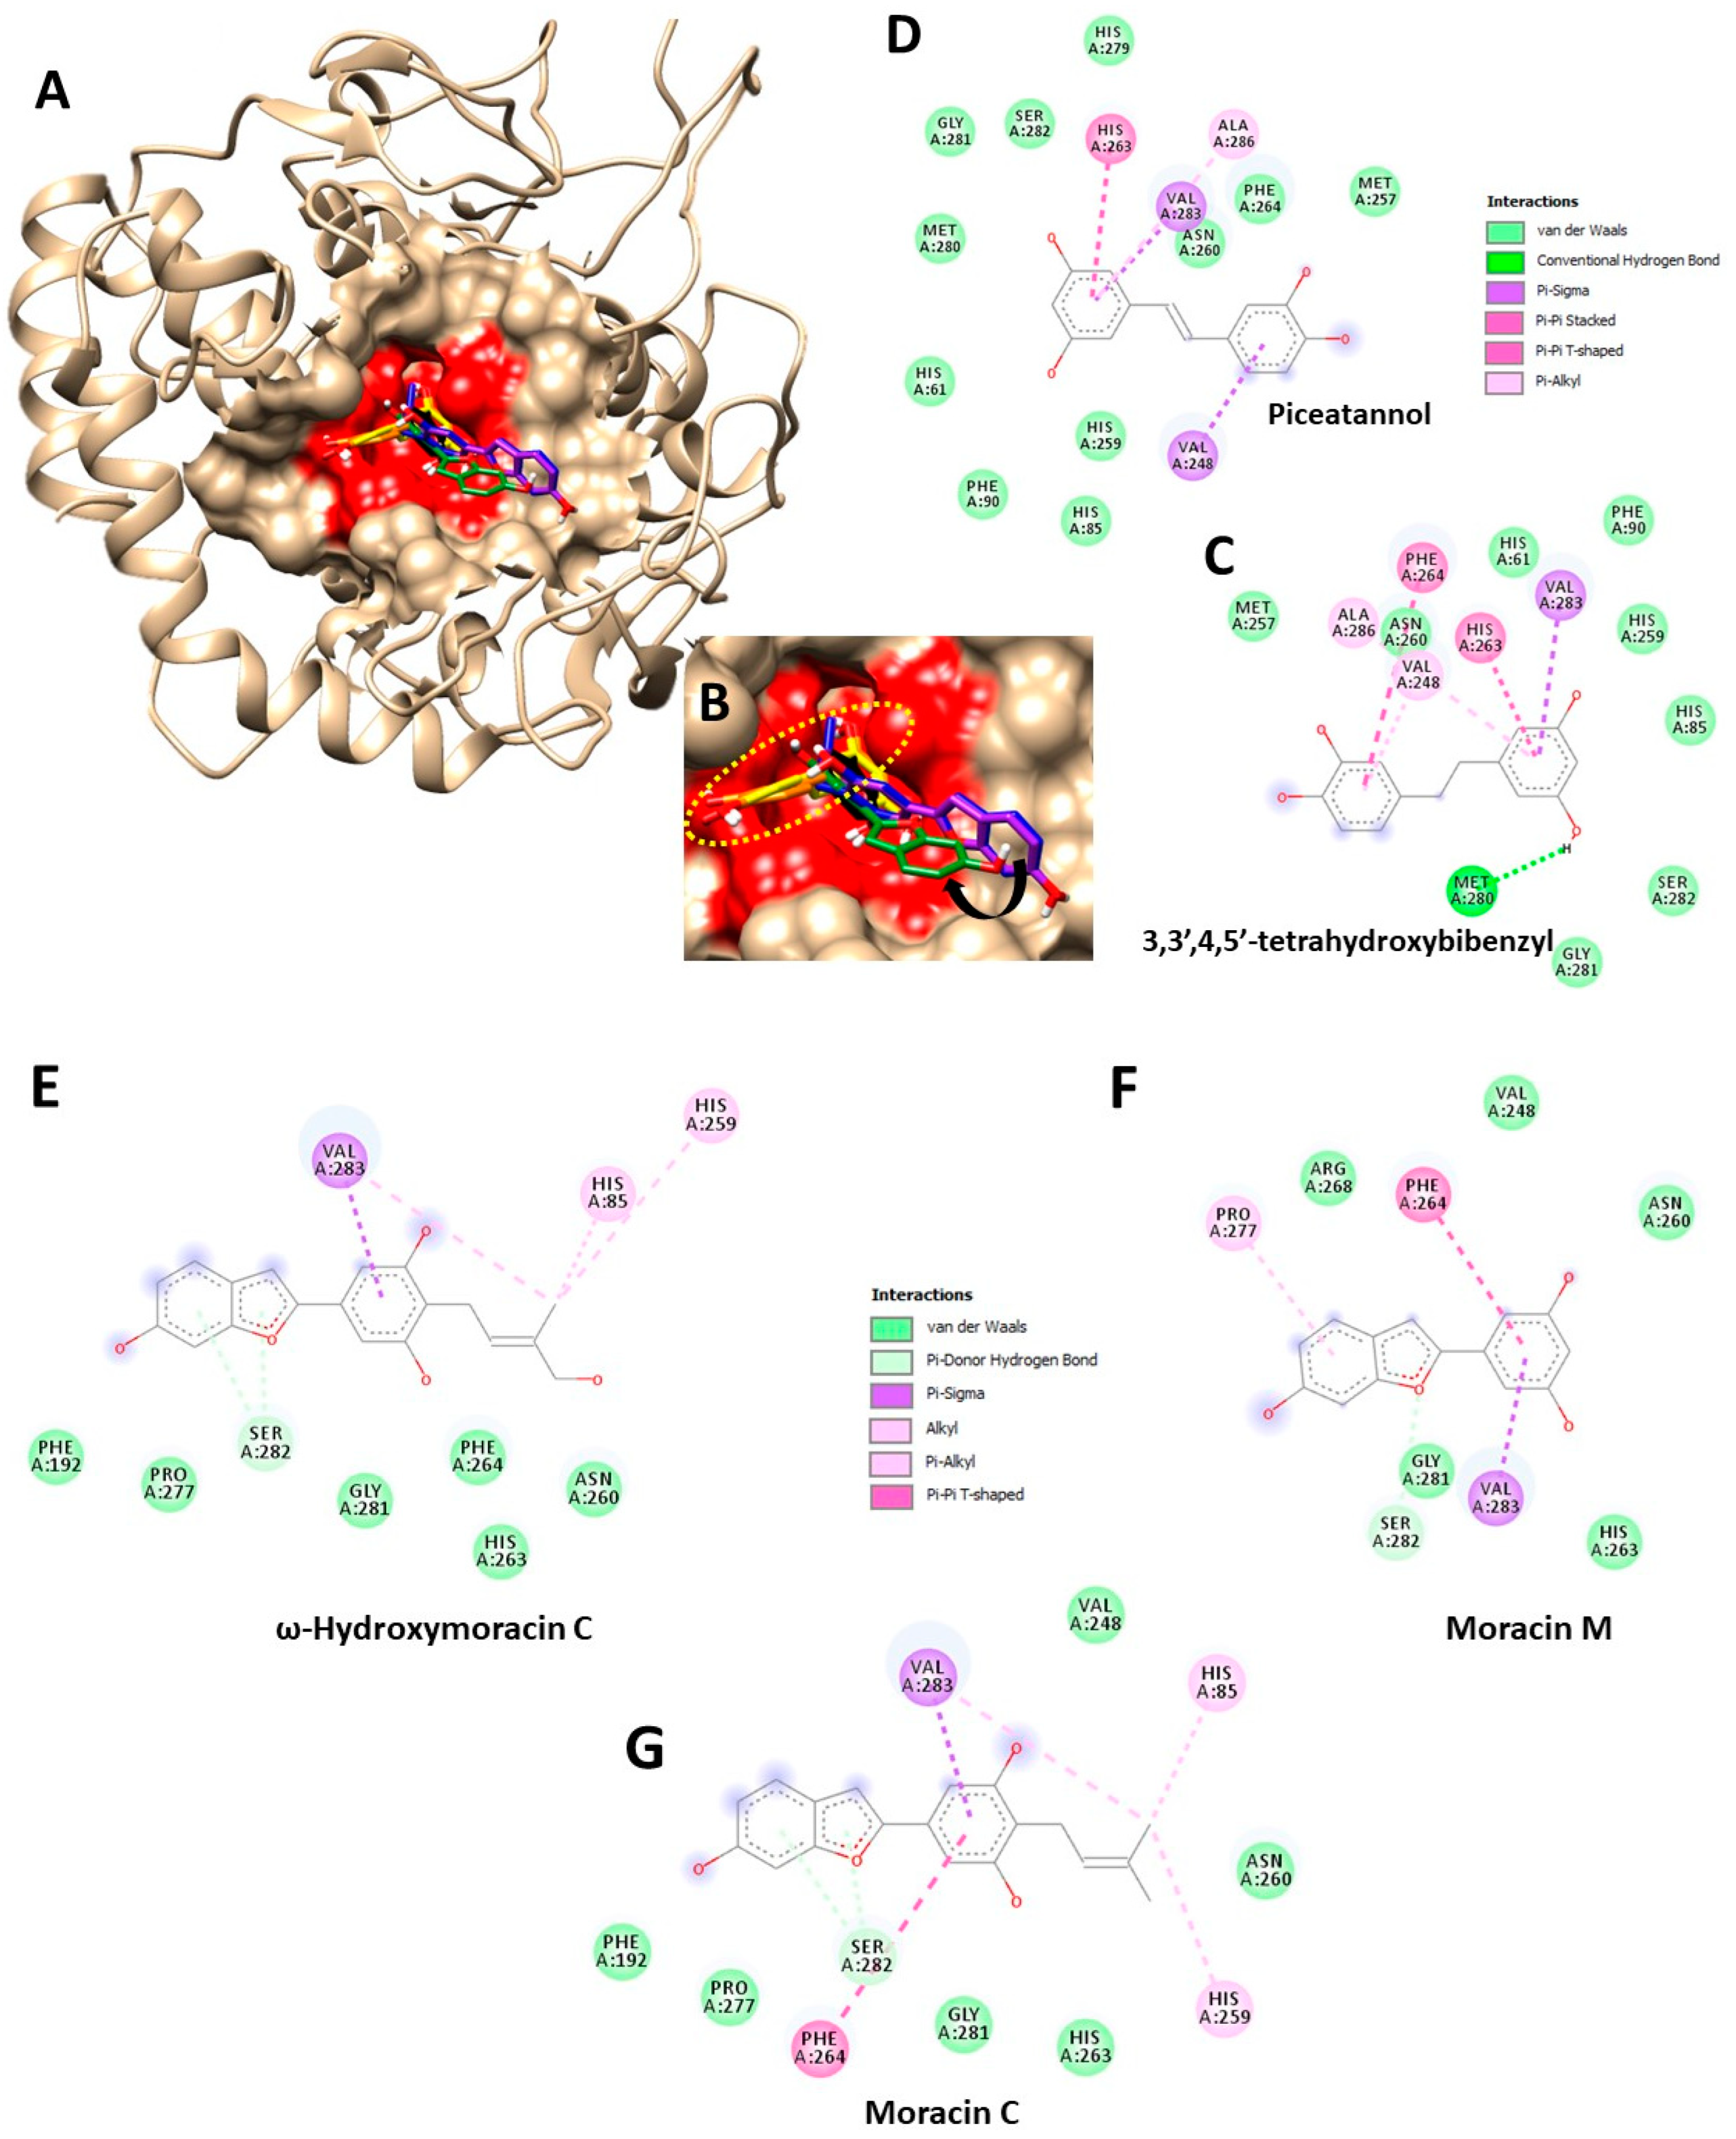
2.7. Molecular Docking Experiment

The authors performed this in silico study to predict theoretical molecular interactions between obtained metabolites from S. taxoides and tyrosinase, as found in an in vitro enzyme binding assay. In this computational experiment, the authors aim to investigate a possible molecular mode of inhibition. As presented in Figure 6A,B, the authors proposed two different enzyme binding modes from the obtained metabolites found in S. taxoides. One was a specific binding mode for moracin derivatives (1 to 3), while another was a unique docking site specific to the bibenzyl metabolites group (4 and 5), Figure 6B, yellow dot circle.
Integrating visuals from Figure 6A–D with Table 3 showed that the bibenzyl metabolites group entirely docked into an active site of the mushroom tyrosinase (Figure 6A,B, highlighted red area). In detail, these two metabolites also interacted with His263 (one of the histidines holding copper ions) and Ala286 (an amino acid inside the active site). Therefore, the result theoretically hinted at a bibenzyl metabolites’ mode of inhibition as a competitive inhibitor.
On the other hand, in Figure 6A,B,E–G and Table 3, all three moracins derivatives interacted with Ser282, an active residual in a catalytic domain. Furthermore, ω-hydroxymoracin C and moracin C formed chemical bonds with His85 and His259. These two histidines are members of six residues holding copper ions, contributing a catalytic mechanism during enzymatic reaction. Additionally, moracins C and M were chemically bound with neighboring amino acids such as Phe264 and Pro277. This information indicated a possible inhibition mode of predominantly competitive behavior. Interestingly, the authors found that Val283, an amino acid residue at the entrance of the active site, was conserved among all test compounds (Table 3).
Notably, the authors’ molecular docking result was in line with previous experimental reports of moracin and bibenzyl derivatives’ mode on inhibition against mushroom tyrosinase [41,75]. Therefore, the authors’ theoretical simulation through molecular docking proved reliable.
Furthermore, the three-dimensional chemical structure (Figure 6A,B) showed an outstanding alignment of moracin M (2, green color) compared to moracin C (3, purple color) and ω-hydroxymoracin C (1, the new moracin derivative found in this study, blue color). The difference in docked molecular alignment between moracin derivatives agreed with an earlier in vitro antimushroom tyrosinase activity, showing that moracin M was the most potent inhibitor above moracin C and ω-hydroxymoracin C. Additionally, dimethylallyl moiety, found in both moracin C (3) and ω-hydroxymoracin C (1), shifted the structural alignment way from moracin M (2), the most potent inhibitor, presented in Figure 6B (black arrow). Furthermore, an extra hydroxy group attached to the dimethylallyl moiety of ω-hydroxymoracin C (new derivative) did not impact the molecular alignment based on the authors’ simulation here. It was incorporated with an interaction diagram (Figure 6E,G). No extra hydrogen bond was found in an interaction between ω-hydroxymoracin C (1) and amino acid residues, similar to moracin C (3).
Later, the authors rescored the estimated binding energy through Autodock 4 for a more comprehensive energy analysis, as shown in Table 4. The authors found two critical issues after rescoring the energy procedure. First, the estimated docking energy of moracin M (2) did not represent the experimental enzyme-binding data. Therefore, the authors did not analyze the obtained energy or compare moracin M’s energy to the other compounds’ docking energy. Second, a default estimated binding energy obtained from Autodock 4 was poorly correlated (R2 = 0.46) with the experimental enzyme-binding data presented earlier. Therefore, the authors manually modified the estimated binding energy obtained from the program by ignoring torsion-free energy. The authors ignored the torsion-free energy function, because it did not agree with the experimental data the most. As a result, ignoring a torsion-free function, a correlation coefficient was improved from R2 of 0.46 to R2 of 0.89. Therefore, the author used a modified binding energy instead of a default one obtained from the program for our analysis.
Based on Table 4, the total intermolecular interaction energies between ω-hydroxymoracin C (1) and moracin C (3) were similar. However, the significant energy function contributing to a more favorable binding energy (without the torsion-free function mentioned earlier) from ω-hydroxymoracin C (1) was a lower total internal energy. This function describes an advantage of the internal flexibility of a small molecule with rotatable bonds. Referring to an interaction diagram earlier, since no extra intermolecular interaction was found, an internal factor was a rational explanation for a superior inhibitory effect of ω-hydroxymoracin C over moracin C (2).
On the other hand, in bibenzyl derivatives, the total internal energies between 3,3′,4,5′-tetrahydroxybibenzyl (4) and piceatannol (5) were similar. This indicated that an intermolecular factor contributed to a more favorable binding affinity of 3,3′,4,5′-tetrahydroxybibenzyl (4). The authors found that a van der Waal and hydrogen bond (vdW+Hbond) function was the significant factor. Additionally, the vdW+Hbond energy function corresponded to interaction diagrams (Figure 6C,D). Based on the diagram, 3,3′,4,5′-tetrahydroxybibenzyl (4) formed six intermolecular bonds with amino acids in the active site. Four bonds, i.e., pi-alkyl, pi-pi stacked, pi-pi T-shaped and pi-sigma, were similar to piceatannol (5). Two extra bonds were unique and only presented in the 3,3′,4,5′-tetrahydroxybibenzyl interaction. One was pi-alkyl (pink dash line in Figure 6C) and another was a hydrogen bond (green dash line in Figure 6C). Therefore, these two outstanding bonds provided an explanation of why 3,3′,4,5′-tetrahydroxybibenzyl (4) was more favorably bound with tyrosinase than piceatannol (5).
In conclusion, the authors’ simulation experiment provided a theoretical explanation supporting an in vitro enzyme-binding experimental outcome found earlier. To sum up, the simulation showed that structural variation affected enzyme-inhibitor binding structurally and energetically, either internally or externally.

3. Materials and Methods

3.1. Plant Materials

The wood of Streblus taxoides (Heyne ex Roth) Kurz was collected from Rajjaprabha Dam, Surat Thani Province, Thailand. It was identified by a botanist of the Southern Literature Botanical Garden, and the voucher specimen number was SKP 117 19 20 01. The sample specimen was deposited at the Department of Pharmacognosy and Pharmaceutical Botany, Faculty of Pharmaceutical Sciences, Prince of Songkla University, Thailand.

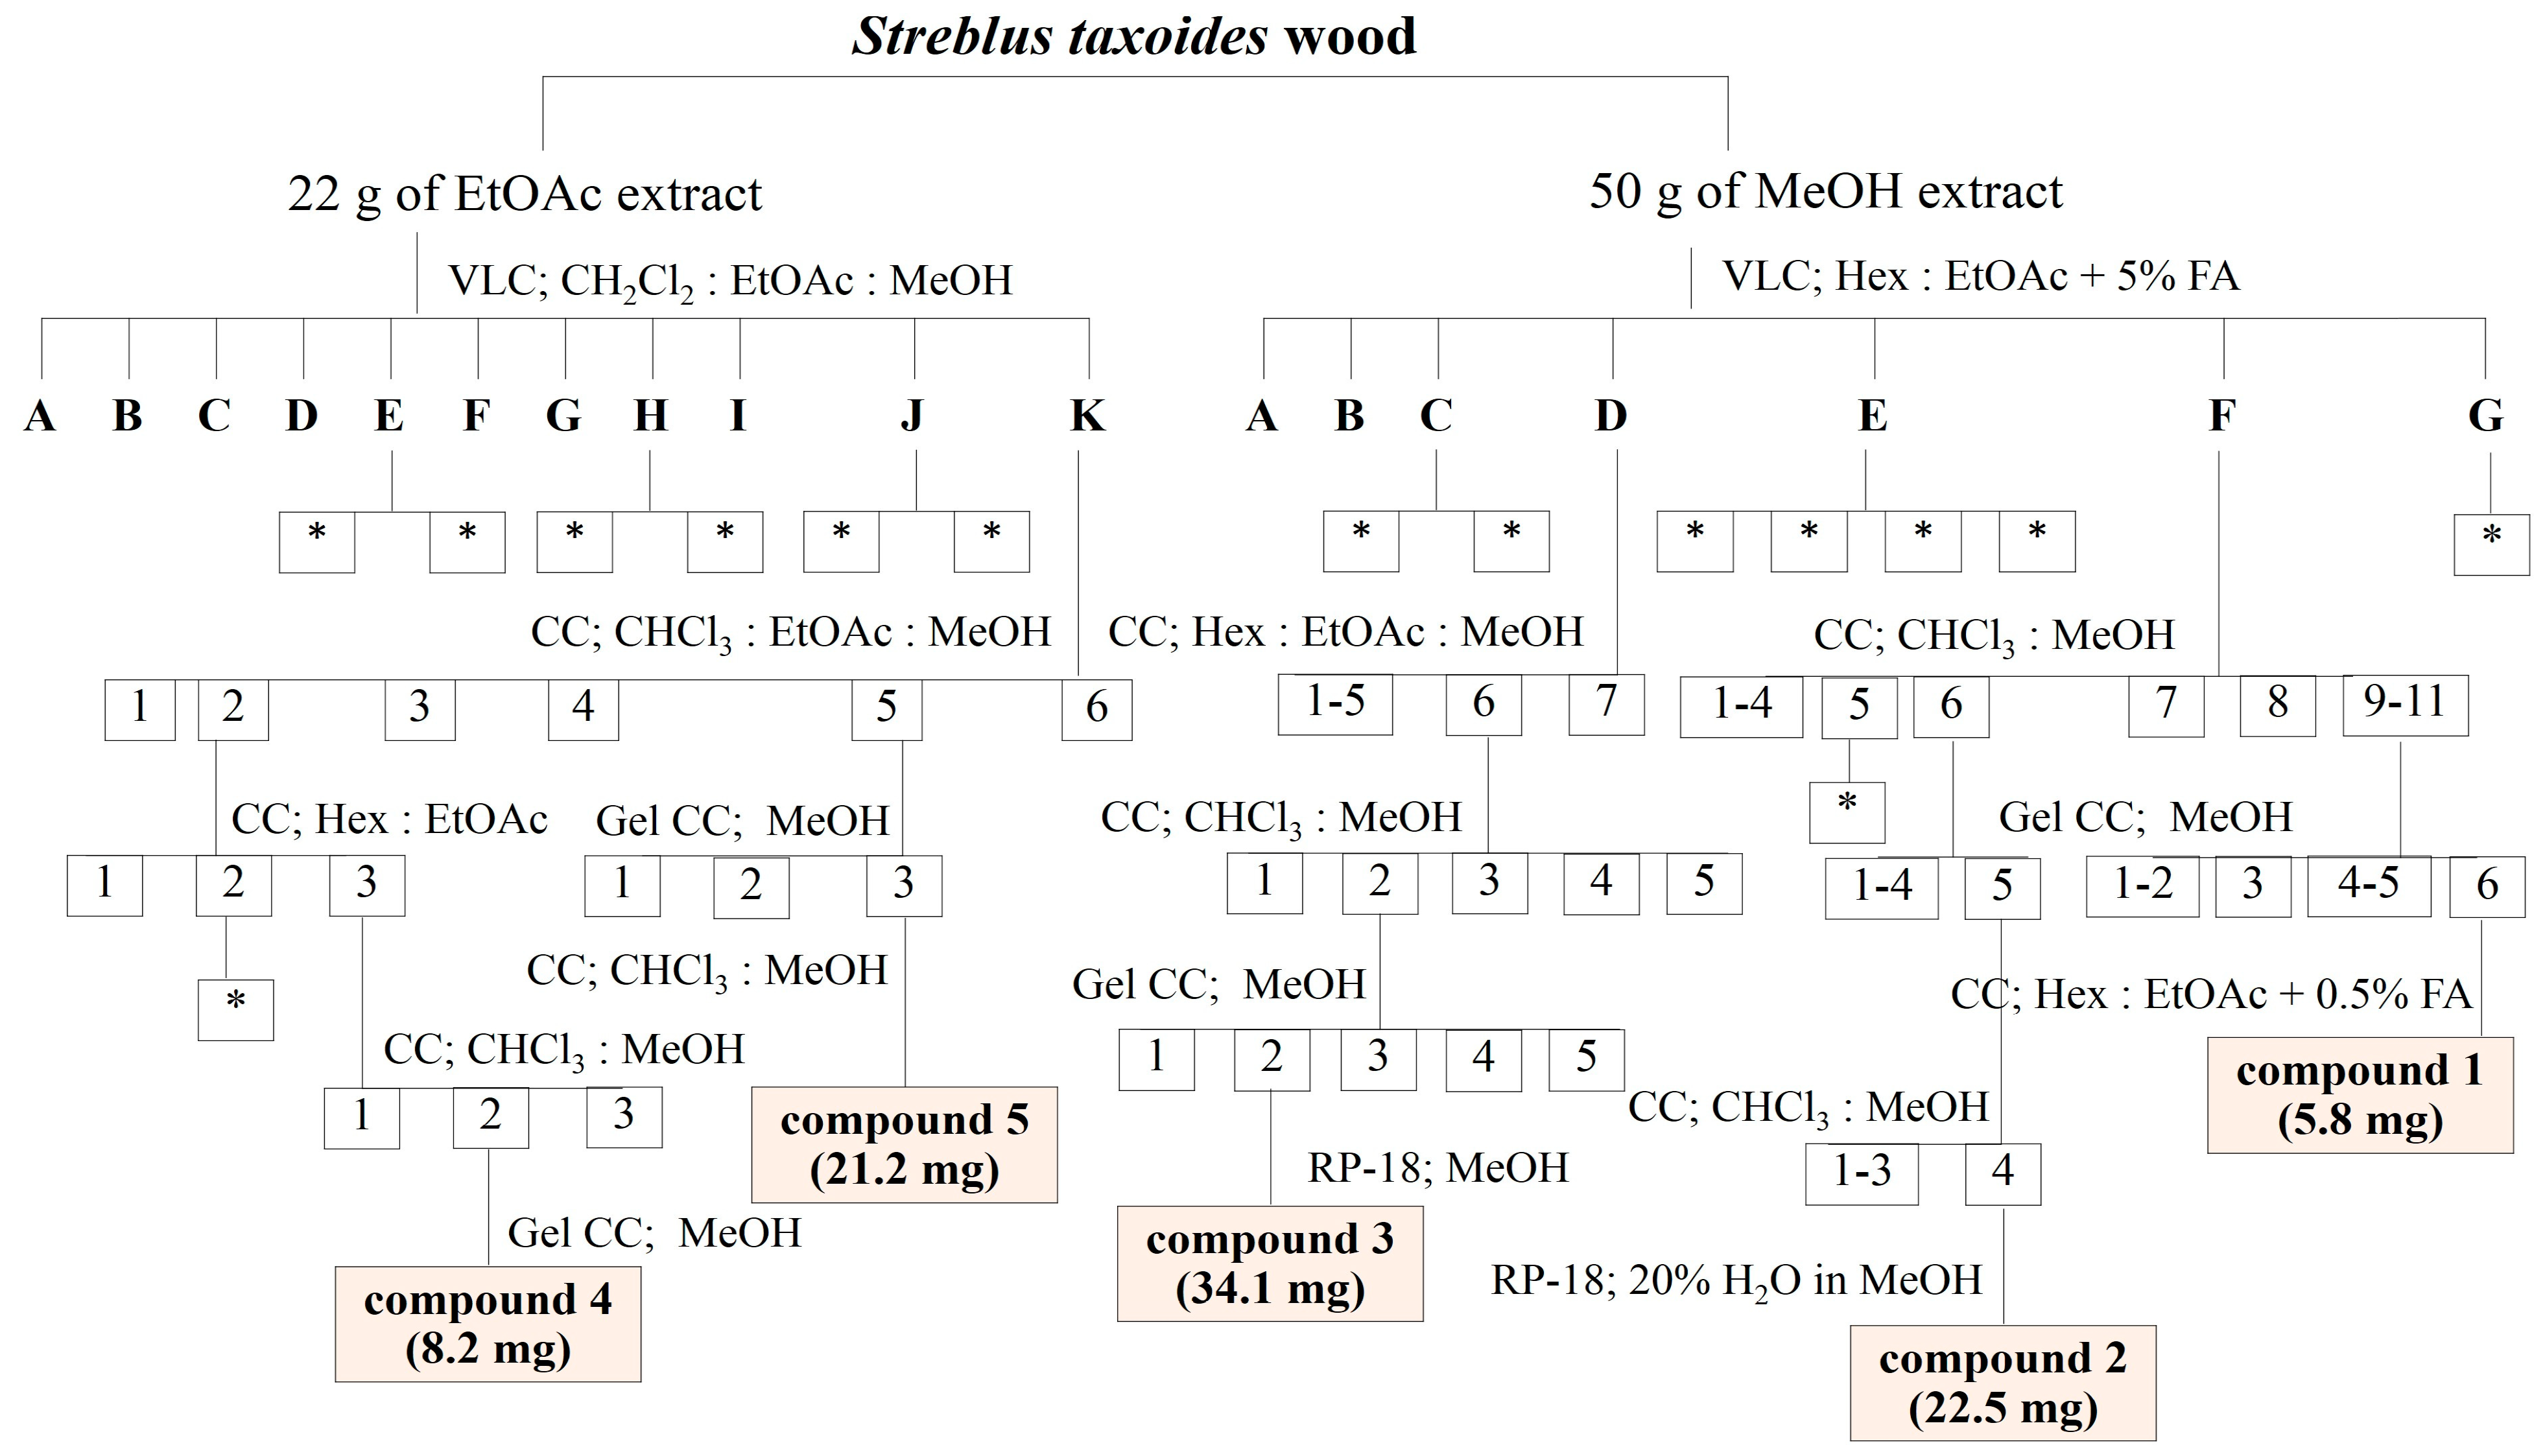
3.2. Extraction and Isolation

In total, 18 kg of dried powder from S. taxoides wood was macerated repeatedly with petroleum ether for 3 days, which was repeated three times. The filtrated sample was evaporated by rotary evaporator under reduced pressure at below 40 °C to yield a petroleum ether extract. Then, the marc was macerated with ethyl acetate and methanol for 3 days, which was repeated three times each, and boiled with H2O, respectively. Removal of organic solvents gave an ethyl acetate extract, methanol extract and H2O extract, respectively.
From the screening result [42], the ethyl acetate and methanol crude extracts showed activity against tyrosinase enzyme and microbe. Thus, these crude extracts were selected for further phytochemical investigation by using chromatographic techniques. Initially, 22 g of ethyl acetate extract was isolated by quick column chromatography, while the gradient of dichloromethane, ethyl acetate and methanol were used as an eluent. The interesting fractions were E, H, J and K. Moreover, fraction C, D, E and F were the interesting fractions which were fractionated by quick column chromatography from 50 g of methanol extract, using the gradient of hexane, ethyl acetate and formic acid as an eluent. All interesting fractions were selected to further isolation and purification. However, many isolated compounds from interesting fractions did not stable, they were easy to degrade. The steps of isolation are summarized in Scheme 1.

3.3. Spectroscopic Data

IR spectra were obtained from a Perkin Elmer FT-IR Spectrum One spectrometer, using Potassium bromide disc to determine the spectra.
Electron Impact Mass Spectra (EIMS) were measured on a Thermo Finnigan MAT 95 XL mass spectrometer.
1H and 13C spectra were obtained with a Fourier Transform NMR Spectrometer (1H-NMR 500 MHz and 13C-NMR 125 MHz), model UNITY INNOVA Varian.
(1)
ω-Hydroxymoracin C; C19H18O5
The IR spectrum showed the absorption bands at 3216, 1620, 1489, 1444, 1351, 1308, 1150, 1002 and 825 cm−1 and gave a molecular ion at 326 m/z in the EIMS. 1H-NMR (500 MHz, CD3OD, δH); 7.32 (1H, d, J = 8.3 Hz, H-4), 6.87 (1H, d, J = 2.2 Hz, H-7), 6.82 (1H, d, J = 0.9 Hz, H-3), 6.78 (2H, s, H-2′, H-6′), 6.72 (1H, dd, J = 8.3, 2.2 Hz, H-5), 5.55 (1H, m, H-2″), 3.90 (2H, s, H-5″), 3.38 (2H, brd, J = 7.32 Hz, H-1″), 1.81 (3H, s, H-4″); 13C-NMR (125 MHz, CD3OD, δC); 157.61 (C-3′, 5′), 157.17 (C-6), 156.64 (C-7a), 156.46 (C-2), 135.07 (C-3″), 130.45 (C-1′), 125.89 (C-2″), 123.19 (C-3a), 121.77 (C-4), 116.27 (C-4′), 113.12 (C-5), 103.81 (C-2′, 6′), 101.33 (C-3), 98.45 (C-7), 69.32 (C-5″), 22.95 (C-1″), 13.83 (C-4″).
(2)
Moracin M; C14H10O4 [41]
The IR spectrum showed the absorption bands at 3246, 2925, 1613, 1489, 1292 and 1149 cm−1. 1H-NMR (500 MHz, DMSO, δH); 7.38 (1H, d, J = 8.5 Hz, H-4), 7.06 (1H, d, J = 0.98 Hz, H-3), 6.91 (1H, dd, J = 2.2, 0.97 Hz, H-7), 6.72 (1H, dd, J = 8.5, 2.2 Hz, H-5), 6.67 (2H, d, J = 1.9 Hz, H-2′, H-6′), 6.20 (1H, t, J = 2.2 Hz, H-4′); 13C-NMR (125 MHz, CD3OD, δC); 158.94 (C-3′, 5′), 155.87 (C-6), 155.42 (C-7a), 154.12 (C-2), 131.82 (C-1′), 121.25 (C-4), 120.94 (C-3a), 112.61 (C-5), 102.80 (C-4′), 102.47 (C-2′, C-6′), 101.69 (C-3), 97.62 (C-7).
(3)
Moracin C; C19H18O4 [60]
The IR spectrum showed the absorption bands at 3216, 2693, 1606, 1489, 1357 and 1150 cm−1. 1H-NMR (500 MHz, DMSO, δH); 9.51 (1H, s, 4-OH), 9.29 (2H, s, 3′-OH, 5′-OH), 7.37 (1H, d, J = 8.2 Hz, H-4), 6.90 (1H, brd, J = 1.9 Hz, H-7), 6.89 (1H, d, J = 0.7 Hz, H-3), 6.73 (2H, s, H-2′, H-6′), 6.71 (1H, dd, J = 8.3, 1.9 Hz, H-5), 5.17 (1H, m, H-2″), 3.19 (2H, brd, J = 6.8 Hz, H-1″), 1.70 (3H, brs, H-4″), 1.60 (3H, brs, H-5″); 13C-NMR (125 MHz, CD3OD, δC); 156.39 (C-3′, C-5′), 155.69 (C-6), 155.30 (C-7a), 154.34 (C-2), 129.75 (C-3″), 128.14 (C-1′), 123.31 (C-2″), 121.09 (C-3a), 120.99 (C-4), 115.09 (C-4′), 112.48 (C-5), 102.43 (C-2′, C-6′), 100.65 (C-3), 97.55 (C-7), 25.64 (C-4″), 22.21 (C-1″), 17.84 (C-5″).
(4)
3, 4, 3′, 5′-Tetrahydroxybibenzyl; C14H14O4 [61]
The IR spectrum showed the absorption bands at 3435, 1616, 1521, 1468, 1285 and 1160 cm−1. 1H-NMR (500 MHz, DMSO, δH); 6.64 (1H, d, J = 8.0, H-5), 6.60 (1H, d, J = 1.9, H-2), 6.48 (1H, dd, J = 8.0, 2.2, H-6), 6.12 (2H, d, J = 2.4, H-2′, H-6′), 6.07 (1H, t, J = 2.2, H-4′), 2.67 (1H, 2, m, H-α′), 2.66 (1H, 2, m, H-α); 13C-NMR (125 MHz, CD3OD, δC); 159.29 (C-3′, C-5′), 146.01 (C-3), 145.70 (C-4), 144.26 (C-1′), 135.00 (C-1), 120.70 (C-6), 116.24 (C-5), 108.04 (C-2′, C-6′), 101.15 (C-4′), 39.51 (C-α′), 38.28 (C-α).
(5)
Piceatannol; C14H12O4 [62]
The IR spectrum showed the absorption bands at 3368, 1600, 1520, 1444, 1285 and 1160 cm−1. 1H-NMR (500 MHz, DMSO, δH); 6.96 (1H, d, J = 1.9 Hz, H-2), 6.87 (1H, d, J = 16.1 Hz, H-α′), 6.82 (1H, dd, J = 8.3, 1.9 Hz, H-6), 6.73 (1H, d, J = 16.1 Hz, H-α), 6.72 (1H, d, J = 8.3 Hz, H-5), 6.42 (2H, d, J = 2.2 Hz, H-2′, H-6′), 6.15 (1H, t, J = 2.2 Hz, H-4′).

3.4. Antimicrobial Activity Assay

Microorganisms that cause skin infection, such as Staphylococcus aureus (ATTC 25923), Staphylococcus epidermidis (TISTR 517), Cutibacterium acnes (DMST 14916) and methicillin-resistant Staphylococcus aureus (DMST20654), were selected for this study. The isolated compounds were determined for minimum inhibitory concentration (MIC) in a 96-well plate by modified broth microdilution method and minimum bactericidal concentration (MBC) [76,77]. Oxacillin was used as positive controls for S. aureus, S. epidermidis and C. acnes, while vancomycin was used for MRSA.

3.5. Enzymetic Antityrosinase Activity Assay

The tyrosinase activity was measured by the Dopachrom method [44,78] using L-DOPA as a substrate. Briefly, 140 μL phosphate buffer (pH 6.8), 20 μL sample solution, and 20 μL tyrosinase solution (203.3 unit/mL) were mixed at 25 °C for 10 min, after which 20 μL of 0.85 mM L-Dopa was added. The optical density (OD) was measured at 492 nm. After incubation at 25 °C for 20 min, the optical density was measured again. The percentage of tyrosinase inhibition was calculated with Equation (1):
Tyrosinase inhibition (%) = (1 − [OD492 of sample/OD492 of control]) × 100
Kojic acid and water extract of Artocarpus lacucha wood were used as positive controls and dimethyl sulfoxide (DMSO) was used as a negative control.

3.6. Cell Culture

The murine B16-F1 melanoma cells (CLS-400122, CLS Cell Lines Service GmbH, Germany) were cultured in Dulbecco’s modified Eagle’s medium, which was supplemented with 10% fetal bovine serum in a humidified incubator at 37 C with 5% CO2. When cells reached 70–80% confluence cell viability, cellular tyrosinase activity and melanin content were measured [79,80,81,82].

3.7. Cell Viability Assay

Cell viability was determined by sulforhodamine B (SRB) assay. Briefly, the B16-F1 cells were seeded at a density of 5 × 10³ cells/well on 96-well plates and cultured for 24 h. Then, the cells were treated with test samples and 0.5% DMSO for negative control. After 48 h of incubation, cells were fixed with 10% trichloroacetic acid (TCA) and incubated at 4 °C, for 1 h. After that, cells were strained with 0.45% SRB. Then, 10 mM Tris base was added on strained cells, after which SRB color was dissolved by shaking. Optical densities were determined at 492 nm. The percentage of cell viability was calculated.

3.8. Intracellular Antityrosinase Activity and Melanin Content Assays

The B16-F1 cells were seeded at a density of 3 × 10⁵ cells/well on 12-well plates and cultured for 12 h. Cells were treated with test samples and control (0.5% DMSO). After 48 h of incubation, cells were lysed with RIPA and centrifuged at 14,000 rpm for 20 min (4 °C) to separate the cell pellet and supernatant. The supernatant was collected and the protein content was determined by the Bradford method using bovine serum albumin as standard [83]. The supernatant was incubated and 2 mg/mL L-Dopa was added to a 96-well plate at 25 °C for 1 h. After that, optical densities were measured at 492 nm. Then, tyrosinase inhibition was calculated, while the cell pellet was dissolved with 1 M NaOH and incubated at 55 °C for 1 h. Melanin concentration was calculated by comparing the absorbance at 475 nm using a standard curve of synthetic melanin.

3.9. Western Blot Analysis

The protein content of the supernatant was quantified by the Bradford method using bovine serum albumin as standard. Equal amounts of protein were separated by 40% acrylamide/Bissolution (InvitrogenThermoFisher Scientific, Waltham, MA, USA) and transferred onto nitrocellulose membranes (BIO-RAD Laboratories, Feldkirchen, Germany). The membranes were probed with antibodies against microphthalmia-associated transcription factor; MITF (ThermoFisher Scientific #MA5-16214, Waltham, MA, USA), tyrosinase (ThermoFisher Scientific #35-6000, Waltham, MA, USA), tyrosinase-related protein 1; TRP1 (ThermoFisher Scientific #OSR00085W, Waltham, MA, USA) and tyrosinase-related protein 2; TRP2 (ThermoFisher Scientific #PA5-36485, Waltham, MA, USA). The proteins were detected using an enhanced chemiluminescence kit (BIO-RAD Laboratories, Hercules, CA, USA). Quantitative analysis was performed using a digital imager (UPV UVP, VisionWorkT LS, Image Acquisition & Analysis Software). The method applied was modified from Western Blot analysis for UGT1A family by the co-author, Asst. Prof. Dr. Wandee Udomuksorn, Pharmacology Program, Division of Health and Applied Science, Faculty of Science, Prince of Songkla University, Thailand., Department of Clinical Pharmacology, Flinders Medical Center.

3.10. Molecular Docking Experiment

The authors downloaded nearly all compounds’ structures from the PubChem database (https://pubchem.ncbi.nlm.nih.gov/, accessed on 15 December 2022), except for ω-hydroxymoracin C (a new derivative). Therefore, the authors created ω-hydroxymoracin C from moracin C (Compound 2, Pubchem CID 155248) using the Avogadro program, version 1.2.0. [84]. In addition, the authors provided all PubChem CIDs of all obtained compound structures in a supplementary file (Table S1). Finally, before the docking experiment, all compounds were geometrical and force field (MMFF94s) optimizations through the same Avogadro program used earlier, following the authors’ previous publications [85,86,87].
On the other hand, the authors obtained the mushroom tyrosinase crystal structure, PDB ID: 2y9x, from the Protein Databank or PDB (https://www.rcsb.org/, accessed on 15 December 2022) [88]. After that, the authors used Autodock Tools version 1.5.6 to prepare tyrosinase properly for the docking experiment [89]. Next, the authors extracted a native ligand (tropolone) that came with the tyrosinase crystal structure. Later, the authors used it to navigate a catalytic pocket and validate an established docking protocol via a re-docking approach. Only the docking protocol provided a root-mean-square deviation (RMSD) value less than 2 Å was used after redocking tropolone back to its original position. Finally, the authors provided the validated docking protocol that passed the criterion in a supplementary file (Figure S1).
The authors used Autodock Vina version 1.1.2 to perform the docking experiment in this study [90]. All docking parameters were set as a default value. However, some parameters were changed, such as the exhaustiveness value adjusted up to twenty-four and the corrected numbers of docking pose sets to twenty. Finally, the authors designed a docking grid box as x = −10.1, y = −28.7 and z = −43.4 with a size of 18 Å × 18 Å × 18 Å.
For post-docking analysis, the authors used the Chimera program version 1.11.2 for ligand-protein three-dimensional visualization [91] and applied Discovery Studio free version 20.1.0.19295 for the intermolecular interactions diagram [92].

4. Conclusions

The two new compounds 2-arylbenzofuran and ω-hydroxymoracin C and four known compounds, i.e., moracin M, moracin C, 3, 4, 3′, 5′-tetrahydroxybibenzyl and piceatannol, were isolated from the S. taxoides wood. All isolated compounds showed potential activity with enzymatic antityrosinase, consistent with the data from molecular docking, indicating a possible inhibition mode of predominantly competitive behavior.
The isolated compounds which exhibited enzymatic tyrosinase inhibitory activity consisted of two different mechanisms in B16-F1 cell as Western blot confirmation. ω-Hydroxymoracin C, moracin M and moracin C showed potential activity with enzymatic antityrosinase and could decrease melanin content by downregulated the melanogenic protein expression. Conversely, 3, 4, 3′, 5′-tetrahydroxybibenzyl and piceatannol showed potential activity with enzymatic antityrosinase but increase melanin content by upregulating the melanogenic protein expression.
Moreover, ω-hydroxymoracin C and moracin C exhibited potential effects on antimicrobial activity. This is the first report of the phytochemical composition of S. taxoides, with new compounds and their bioactivities. The results indicated the high potential of some isolated compounds, which might be utilized as the new alternative lead compounds for further research of whitening and/or antiacne agents.

Supplementary Materials

The following supporting information can be downloaded at: https://www.mdpi.com/article/10.3390/antibiotics12020319/s1. Figure S1: Docking protocol validation. Native tropolone structure (black color) locates in its original position. Re-docked tropolone (blue color) into its original pose overlays over native tropolone structure. The RMSD value of the re-docked tropolone is 1.038 Å; Figure S2: IR spectrum of ω-hydroxymoracin C (KBr disc); Figure S3: EI mass spectrum of ω-hydroxymoracin C; Figure S4: 1H NMR spectrum of ω-hydroxymoracin C; Figure S5: 13C NMR spectrum of ω-hydroxymoracin C; Figure S6: HMQC spectrum of ω-hydroxymoracin C; Figure S7: HMBC spectrum of ω-hydroxymoracin C; Figure S8: IR spectrum of moracin M (KBr disc); Figure S9: 1H NMR spectrum of moracin M; Figure S10: 13C NMR spectrum of moracin M; Figure S11: IR spectrum of moracin C (KBr disc); Figure S12: 1H NMR spectrum of moracin C; Figure S13: 13C NMR spectrum of moracin C; Figure S14: IR spectrum of 3, 4, 3´, 5´-tetrahydroxybibenzyl (KBr disc); Figure S15: 1H NMR spectrum of 3, 4, 3´, 5´-tetrahydroxybibenzyl; Figure S16: 13C NMR spectrum of 3, 4, 3´, 5´-tetrahydroxybibenzyl; Figure S17: IR spectrum of piceatanol (KBr disc); Figure S18: 1H NMR spectrum of piceatanol.

Author Contributions

Conceptualization and supervision, S.D.-a.; methodology, S.D.-a., K.P., T.P., J.S.H. and W.U.; investigation, K.P. and T.P.; writing—original draft preparation, K.P., T.P. and S.D.-a.; writing—review and editing, S.D.-a.; co-supervision, C.W.; funding acquisition, S.D.-a. All authors have read and agreed to the published version of the manuscript.

Funding

This study was financially supported by the Plant Genetic Conservation Project under the Royal Initiative of Her Royal Highness Princess Maha Chakri Sirindhorn (RSPG project), the Prince of Songkla University (PSU), Ph.D. scholarship (PSU/95000201/2557) and Discipline of Excellence (DOE) in Pharmacy through the Faculty of Pharmaceutical Sciences, funded by the Research and Development Office, Prince of Songkla University.

Institutional Review Board Statement

Not applicable.

Informed Consent Statement

Not applicable.

Data Availability Statement

Data sharing is not applicable.

Acknowledgments

The authors would like to thank the Department of Pharmacognosy and Pharmaceutical Botany and the Pharmaceutical Laboratory Service Center, Faculty of Pharmaceutical Sciences, Prince of Songkla University for the laboratory space and equipment.

Conflicts of Interest

We declare that there is no conflict of interest.

References

  1. Cushnie, T.P.T.; Lamb, A.J. Antimicrobial activity of flavonoids. Int. J. Antimicrob. Agents 2005, 26, 343–356. [Google Scholar] [CrossRef]
  2. Drott, J.B.; Alexeyev, O.; Bergstrom, P.; Elgh, F.; Olsson, J. Propionibacterium acnes infection induces upregulation of inflammatory genes and cytokine secretion in prostate epithelial cells. BMC Microbiol. 2010, 10, 126. [Google Scholar] [CrossRef] [PubMed]
  3. Kumar, G.S.; Jayaveera, K.N.; Kumar, C.K.A.; Sanjay, U.P.; Swamy, B.M.V.; Kumar, D.V.K. Antimicrobial effects of Indian medicinal plants against acne-inducing bacteria. J. Pharm. Res. 2007, 6, 717–723. [Google Scholar] [CrossRef]
  4. Athikomkulchai, S.; Watthanachaiyingcharoen, R.; Tunvichien, S.; Vayumhasuwan, P.; Karnsomkiet, P.; Sae-Jong, P.; Ruangrungsi, N. The development of anti-acne products from Eucalyptus globulus and Psidium guajava oil. J. Health Res. 2008, 22, 109–113. [Google Scholar]
  5. Swope, V.B.; Abdel-Malek, Z.; Kassem, L.M.; Nordlund, J.J. Interleukins 1 alpha and 6 and tumor necrosis factor-alpha are paracrine inhibitors of human melanocyte proliferation and melanogenesis. J. Investig. Dermatol. 1991, 96, 180–185. [Google Scholar] [CrossRef] [PubMed]
  6. Petit, L.; Piérard, G.E. Skin-lightening products revisited. Int. J. Cosmet. Sci. 2003, 25, 169–181. [Google Scholar] [CrossRef]
  7. Slominski, A.; Tobin, J.; Shibahara, S.; Wortsman, J. Melanin pigmentation in mammalian skin and its hormonal regulation. Physiol. Rev. 2004, 84, 1155–1228. [Google Scholar] [CrossRef] [PubMed]
  8. Choi, H.; Choi, H.; Han, J.; Jin, S.H.; Park, J.Y.; Shin, D.W.; Lee, T.R.; Kim, K.; Lee, A.Y.; Noh, M. IL-4 inhibits the melanogenesis of normal human melanocytes through the JAK2-STAT6 signaling pathway. J. Investig. Dermatol. 2013, 133, 528–536. [Google Scholar] [CrossRef]
  9. Hossain, M.R.; Ansary, T.M.; Komine, M.; Ohtsuki, M. Diversified stimuli-induced inflammatory pathways cause skin pigmentation. Int. J. Mol. Sci. 2021, 22, 3970. [Google Scholar] [CrossRef]
  10. Fu, C.; Chen, J.; Lu, J.; Yi, L.; Tong, X.; Kang, L.; Pei, S.; Ouyang, Y.; Jiang, L.; Ding, Y.; et al. Roles of inflammation factors in melanogenesis (Review). Mol. Med. Rep. 2020, 21, 1421–1430. [Google Scholar] [CrossRef]
  11. Meng, X.; Yang, Y.; Wu, Y.; Zhang, Y.; Zhang, H.; Zhou, W.; Guo, M.; Li, L. Inflammatory factor expression in HaCaT cells and melanin synthesis in melanocytes: Effects of Ganoderma lucidum fermentation broth containing Chinese medicine. Int. J. Food Prop. 2022, 25, 1604–1621. [Google Scholar] [CrossRef]
  12. Yoshida, M.; Takahashi, Y.; Inoue, S. Histamine induces melanogenesis and morphologic changes by protein kinase A activation via H2 receptors in human normal melanocytes. J. Investig. Dermatol. 2000, 114, 334–342. [Google Scholar] [CrossRef]
  13. Jimenez-Cervantes, C.; Garcia-Borron, J.C.; Lozano, J.A.; Solano, F. Effect of detergents and endogenous lipids on the activity and properties of tyrosinase and its related proteins. Biochim. Biophys. Acta (BBA) 1995, 1243, 421–430. [Google Scholar] [CrossRef]
  14. Kim, Y.J.; Uyama, H. Tyrosinase inhibitors from natural and synthetic sources: Structure, inhibition mechanism and perspective for the future. Cell. Mol. Life Sci. 2005, 62, 1707–1723. [Google Scholar] [CrossRef]
  15. Costin, G.E.; Hearing, V.J. Human skin pigmentation: Melanocytes modulate skin color in response to stress. FASEB J. 2007, 21, 976–994. [Google Scholar] [CrossRef] [PubMed]
  16. Chang, T.-S. Natural melanogenesis inhibitors acting through the down-regulation of tyrosinase activity. Materials 2012, 5, 1661–1685. [Google Scholar] [CrossRef]
  17. Niu, C.; Aisa, H.A. Upregulation of melanogenesis and tyrosinase activity: Potential agents for vitiligo. Molecules 2017, 22, 1303. [Google Scholar] [CrossRef] [PubMed]
  18. Taweechaisupapong, S.; Wongkham, S.; Chareonsuk, S.; Suparee, S.; Srilalai, P.; Chaiyarak, S. Selective activity of Streblus asper on Mutans streptococci. J. Ethnopharmacol. 2000, 70, 73–79. [Google Scholar] [CrossRef] [PubMed]
  19. Sohn, H.Y.; Son, K.H.; Kwon, C.S.; Kwon, G.S.; Kang, S.S. Antimicrobial and cytotoxic activity of 18 prenylated flavonoids isolated from medicinal plants: Morus alba L., Morus mongolica Schneider, Broussnetia papyrifera (L.) Vent., Sophora flavescens Ait. and Echinosophora koreensis Nakai. Phytomedicine 2004, 11, 666–672. [Google Scholar] [CrossRef] [PubMed]
  20. Fukai, T.; Kaitou, K.; Terada, S. Antimicrobial activity of 2-arylbenzofurans from Morus species against methicillin-resistant Staphylococcus aureus. Fitoterapia 2005, 76, 708–711. [Google Scholar] [CrossRef]
  21. Taweechaisupapong, S.; Choopan, T.; Singhara, S.; Chatrchaiwiwatana, S.; Wongkham, S. In vitro inhibitory effect of Streblus asper leaf-extract on adhesion of Candida albicans to human buccal epithelial cells. J. Ethnopharmacol. 2005, 96, 221–226. [Google Scholar] [CrossRef]
  22. Taweechaisupapong, S.; Klanrit, P.; Singhara, S.; Pitiphat, W.; Wongkham, S. Inhibitory effect of Streblus asper leaf-extract on adhesion of Candida albicans to denture acrylic. J. Ethnopharmacol. 2006, 106, 414–417. [Google Scholar] [CrossRef] [PubMed]
  23. Kummee, S.; Intaraksa, N. Antimicrobial activity of Desmos chinensis leaf and Maclura cochinchinensis wood extracts. Songklanakarin J. Sci. Technol. 2008, 30, 635–639. [Google Scholar]
  24. Pandey, A.; Bhatnagar, S.P. Preliminary phytochemical screening and antimicrobial studies on Artocarpus lakoocha Roxb. Anc. Sci. Life 2009, 28, 21–24. [Google Scholar] [PubMed]
  25. Sohn, H.Y.; Kwon, C.S.; Son, K.H. Fungicidal effect of prenylated flavonol, papyriflavonol A, isolated from Broussonetia papyrifera (L.) Vent. against Candida albicans. J. Microbiol. Biotechnol. 2010, 20, 1397–1402. [Google Scholar] [CrossRef]
  26. Hashim, N.M.; Rahmani, M.; Ee, G.C.; Sukari, M.A.; Yahayu, M.; Amin, M.A.; Ali, A.M.; Go, R. Antioxidant, antimicrobial and tyrosinase inhibitory activities of xanthones isolated from Artocarpus obtusus F.M. Jarrett. Molecules 2012, 17, 6071–6082. [Google Scholar] [CrossRef]
  27. Tsai, P.W.; de Castro-Cruz, K.A.; Shen, C.-C.; Ragasa, C.Y. Chemical constituents of Broussonetia luzonicus. Pharmacogn. J. 2012, 4, 1–4. [Google Scholar] [CrossRef]
  28. Kamal, T.; Muzammil, A.; Omar, M.N. Evaluation of antimicrobial activity of Artocarpus altilis on pathogenic microorganisms. Sci. Ser. Data Rep. 2012, 4, 41–48. [Google Scholar]
  29. Lamounier, K.C.; Cunha, L.C.; de Morais, S.A.; de Aquino, F.J.; Chang, R.; de Nascimento, E.A.; de Souza, M.G.; Martins, C.H.; Cunha, W.R. Chemical analysis and study of phenolics, antioxidant activity, and antibacterial effect of the wood and bark of Maclura tinctoria (L.) D. Don ex Steud. Evid.-Based Complement. Altern. Med. 2012, 2012, 451039. [Google Scholar] [CrossRef]
  30. Pradhan, C.; Mohanty, M.; Rout, A. Phytochemical screening and comparative bioefficacy assessment of Artocarpus altilis leaf extracts for antimicrobial activity. Front. Life Sci. 2012, 6, 71–76. [Google Scholar] [CrossRef]
  31. Dharmaratne, H.R.W.; Jacob, M.; Tekwani, B.L.; Nanayakkara, N.P.D. Antimicrobial and antileishmanial compounds from Maclura pomifera fruits. Planta Med. 2013, 79, PF1. [Google Scholar] [CrossRef]
  32. Madhavi, Y.; Rao, D.B.; Rao, T.R. Studies on phytochemical analysis and antimicrobial activity of Artocarpus communis fruit latex against selected pathogenic microorganisms. Indo Am. J. Pharm. Res. 2013, 3, 1458–1468. [Google Scholar]
  33. Swargiary, A.; Ronghang, B. Screening of phytochemicals constituents, antioxidannt and antibacterial properties of methanolic bark extracts of Maclura cochinchinensis (Lour.) Corner. Int. J. Pharma Bio Sci. 2013, 4, 449–459. [Google Scholar]
  34. Dej-adisai, S.; Meechai, I.; Puripattanavong, J.; Kummee, S. Antityrosinase and antimicrobial activities from Thai medicinal plants. Arch. Pharmacal Res. 2014, 37, 473–483. [Google Scholar] [CrossRef] [PubMed]
  35. Jamil, S.; Lathiff, S.M.A.; Abdullah, S.A.; Jemaon, N.; Sirat, H.M. Antimicrobial flavonoids from Artocarpus anisophyllus Miq. and Artocarpus lowii King. J. Teknol. 2014, 71, 95–99. [Google Scholar] [CrossRef] [Green Version]
  36. Llagas, M.C.D.L.; Santiago, L.; Ramos, J.D. Antibacterial activity of crude ethanolic extract and solvent fractions of Ficus pseudopalma Blanco leaves. Asian Pac. J. Trop. Dis. 2014, 4, 367–371. [Google Scholar] [CrossRef]
  37. Teanpaisan, R.; Senapong, S.; Puripattanavong, J. In vitro antimicrobial and activity of Artocarpus lakoocha (Moraceae) extract against some oral pathogens. Trop. J. Pharm. Res. 2014, 13, 1149–1155. [Google Scholar] [CrossRef]
  38. Fongang, Y.S.F.; Bankeu, J.J.K.; Ali, M.S.; Awantu, A.F.; Zeeshan, A.; Assob, C.N.; Mehreen, L.; Lenta, B.N.; Ngouela, S.A.; Tsamo, E. Flavonoids and other bioactive constituents from Ficus thonningii Blume (Moraceae). Phytochem. Lett. 2015, 11, 139–145. [Google Scholar] [CrossRef]
  39. Weli, A.M.; Al-Blushi, A.A.M.; Hossain, M.A. Evaluation of antioxidant and antimicrobial potential of different leaves crude extracts of Omani Ficus carica against food borne pathogenic bacteria. Asian Pac. J. Trop. Dis. 2015, 5, 13–16. [Google Scholar] [CrossRef]
  40. Yessoufou, K.; Elansary, H.O.; Mahmoud, E.A.; Skalicka-Woźniak, K. Antifungal, antibacterial and anticancer activities of Ficus drupacea L. stem bark extract and biologically active isolated compounds. Ind. Crop. Prod. 2015, 74, 752–758. [Google Scholar] [CrossRef]
  41. Dej-adisai, S.; Parndaeng, K.; Wattanapiromsakul, C. Determination of phytochemical compounds, and tyrosinase inhibitory and antimicrobial activities of bioactive compounds from Streblus ilicifolius (S Vidal) Corner. Trop. J. Pharm. Res. 2016, 15, 497–506. [Google Scholar] [CrossRef]
  42. Dej-adisai, S.; Parndaeng, K.; Wattanapiromsakul, C.; Nuankaew, W.; Kang, T.H. Effects of selected moraceae plants on tyrosinase enzyme and melanin content. Pharmacogn. Mag. 2019, 15, 708–714. [Google Scholar] [CrossRef]
  43. Dej-adisai, S.; Parndaeng, K.; Wattanapiromsakul, C.; Hwang, J.S. Three new isoprenylated flavones from Artocarpus chama stem and their bioactivities. Molecules 2021, 27, 3. [Google Scholar] [CrossRef] [PubMed]
  44. Sritularak, B. Chemical Constituents of Artocarpus lakoocha and A. gomezianus. Master’s Thesis, Chulalongkorn University, Bangkok, Thailand, 1998. [Google Scholar]
  45. Likhitwitayawuid, K.; Sritularak, B.; De-Eknamkul, W. Tyrosinase inhibitors from Artocarpus gomezianus. Planta Med. 2000, 66, 275–277. [Google Scholar] [CrossRef]
  46. Shimizu, K.; Kondo, R.; Sakai, K. Inhibition of tyrosinase by flavonoids, stilbenes and related 4-substituted resorcinols: Structure-activity investigations. Planta Med. 2000, 66, 11–15. [Google Scholar] [CrossRef]
  47. Likhitwitayawuid, K.; Sornsute, A.; Sritularak, B.; Ploypradith, P. Chemical transformations of oxyresveratrol (trans-2,4,3′,5′-tetrahydroxystilbene) into a potent tyrosinase inhibitor and a strong cytotoxic agent. Bioorg. Med. Chem. Lett. 2006, 16, 5650–5653. [Google Scholar] [CrossRef] [PubMed]
  48. Tengamnuay, P.; Pengrungruangwong, K.; Pheansri, I.; Likhitwitayawuid, K. Artocarpus lakoocha heartwood extract as a novel cosmetic ingredient: Evaluation of the in vitro anti-tyrosinase and in vivo skin whitening activities. Int. J. Cosmet. Sci. 2006, 28, 269–276. [Google Scholar] [CrossRef]
  49. Ko, H.H.; Chang, W.L.; Lu, T.M. Antityrosinase and antioxidant effects of ent-kaurane diterpenes from leaves of Broussonetia papyrifera. J. Nat. Prod. 2008, 71, 1930–1933. [Google Scholar] [CrossRef]
  50. Zheng, Z.P.; Cheng, K.W.; Chao, J.; Wu, J.; Wang, M. Tyrosinase inhibitors from paper mulberry (Broussonetia papyrifera). Food Chem. 2008, 106, 529–535. [Google Scholar] [CrossRef]
  51. Zheng, Z.P.; Cheng, K.W.; To, J.T.; Li, H.; Wang, M. Isolation of tyrosinase inhibitors from Artocarpus heterophyllus and use of its extract as antibrowning agent. Mol. Nutr. Food Res. 2008, 52, 1530–1538. [Google Scholar] [CrossRef]
  52. Baek, Y.S.; Ryu, Y.B.; Curtis-Long, M.J.; Ha, T.J.; Rengasamy, R.; Yang, M.S.; Park, K.H. Tyrosinase inhibitory effects of 1,3-diphenylpropanes from Broussonetia kazinoki. Bioorg. Med. Chem. 2009, 17, 35–41. [Google Scholar] [CrossRef] [PubMed]
  53. Zheng, Z.P.; Chen, S.; Wang, S.; Wang, X.C.; Cheng, K.W.; Wu, J.J.; Yang, D.; Wang, M. Chemical components and tyrosinase inhibitors from the twigs of Artocarpus heterophyllus. J. Agric. Food Chem. 2009, 57, 6649–6655. [Google Scholar] [CrossRef] [PubMed]
  54. Moon, J.Y.; Yim, E.Y.; Song, G.; Lee, N.H.; Hyun, C.G. Screening of elastase and tyrosinase inhibitory activity from Jeju island plants. EurAsian J. Biosci. 2010, 4, 41–53. [Google Scholar] [CrossRef]
  55. Chang, L.W.; Juang, L.J.; Wang, B.S.; Wang, M.Y.; Tai, H.M.; Hung, W.J.; Chen, Y.J.; Huang, M.H. Antioxidant and antityrosinase activity of mulberry (Morus alba L.) twigs and root bark. Food Chem. Toxicol. 2011, 49, 785–790. [Google Scholar] [CrossRef] [PubMed]
  56. Loizzo, M.R.; Tundis, R.; Menichini, F. Natural and synthetic tyrosinase inhibitors as antibrowning agents: An update. Compr. Rev. Food Sci. Food Saf. 2012, 11, 378–398. [Google Scholar] [CrossRef]
  57. Kang, Y.; Choi, J.-U.; Lee, E.-A.; Park, H.-R. Flaniostatin, a new isoflavonoid glycoside isolated from the leaves of Cudrania tricuspidata as a tyrosinase inhibitor. Food Sci. Biotechnol. 2013, 22, 1–4. [Google Scholar] [CrossRef]
  58. Zheng, Z.P.; Tan, H.Y.; Chen, J.; Wang, M. Characterization of tyrosinase inhibitors in the twigs of Cudrania tricuspidata and their structure-activity relationship study. Fitoterapia 2013, 84, 242–247. [Google Scholar] [CrossRef]
  59. Chen, X.X.; Shi, Y.; Chai, W.M.; Feng, H.L.; Zhuang, J.X.; Chen, Q.X. Condensed tannins from Ficus virens as tyrosinase inhibitors: Structure, inhibitory activity and molecular mechanism. PLoS ONE 2014, 9, e91809. [Google Scholar] [CrossRef]
  60. Kim, Y.J.; Sohn, M.J.; Kim, W.G. Chalcomoracin and moracin C, new inhibitors of Staphylococcus aureus enoyl-acyl carrier protein reductase from Morus alba. Biol. Pharm. Bull. 2012, 35, 791–795. [Google Scholar] [CrossRef]
  61. Mannila, E.; Talvitie, A.; Kolehmainen, E. Anti-leukaemic compounds derived from stibenes in Picea abies bark. Phytochemistry 1993, 33, 813–816. [Google Scholar] [CrossRef]
  62. Thakkar, K.; Geahlen, R.L.; Cushman, M. Synthesis and protein-tyrosine kinase inhibitory activity of polyhydroxylated stilbene analogues of piceatannol. J. Med. Chem. 1993, 36, 2950–2955. [Google Scholar] [CrossRef] [PubMed]
  63. Matsuyama, S.; Kuwahara, Y.; Suzuki, T. A New 2-arylbenzofuran, ω -hydroxy moracin N, from mulberry leaves. Agric. Biol. Chem. 1991, 55, 1409–1410. [Google Scholar] [CrossRef]
  64. Kuete, V.; Fozing, D.C.; Kapche, W.F.; Mbaveng, A.T.; Kuiate, J.R.; Ngadjui, B.T.; Abegaz, B.M. Antimicrobial activity of the methanolic extract and compounds from Morus mesozygia stem bark. J. Ethnopharmacol. 2009, 124, 551–555. [Google Scholar] [CrossRef]
  65. Likhitwitayawuid, K. Stilbenes with tyrosinase inhibitory activity. Curr. Sci. 2008, 94, 44–52. [Google Scholar]
  66. Deguchi, T.; Tamai, A.; Asahara, K.; Miyamoto, K.; Miyamoto, A.; Nomura, M.; Kawata, T.T.; Yoshioka, Y.; Murata, K. Anti-tyrosinase and anti-oxidative activities by asana: The heartwood of Pterocarpus marsupium. Nat. Prod. Commun. 2019, 14, 1–9. [Google Scholar]
  67. Zheng, Z.P.; Cheng, K.W.; Zhu, Q.; Wang, X.C.; Lin, Z.X.; Wang, M. Tyrosinase inhibitory constituents from the roots of Morus nigra: A structure-activity relationship study. J. Agric. Food Chem. 2010, 58, 5368–5373. [Google Scholar] [CrossRef]
  68. Zhang, L.; Tao, G.; Chen, J.; Zheng, Z.P. Characterization of a new flavone and tyrosinase inhibition constituents from the twigs of Morus alba L. Molecules 2016, 21, 1130. [Google Scholar] [CrossRef] [Green Version]
  69. Le, T.H.; Nguyen, H.X.; Do, T.V.N.; Dang, P.H.; Nguye, N.T.; Nguyena, M.T.T.N. Moracin VN, a new tyrosinase and xanthine oxidase inhibitor from the woods of Artocarpus heterophyllus. Nat. Prod. Commun. 2017, 12, 925–927. [Google Scholar] [CrossRef]
  70. Jeon, Y.H.; Choi, S.W. Isolation, identification, and quantification of tyrosinase and alpha-glucosidase inhibitors from UVC-irradiated mulberry (Morus alba L.) leaves. Prev. Nutr. Food Sci. 2019, 24, 84–94. [Google Scholar] [CrossRef]
  71. Huang, Y.C.; Liu, K.C.; Chiou, Y.L. Melanogenesis of murine melanoma cells induced by hesperetin, a Citrus hydrolysate-derived flavonoid. Food Chem. Toxicol. 2012, 71, 653–659. [Google Scholar] [CrossRef]
  72. Ohguchi, K.; Ahao, Y.; Nozawa, Y. Stimulation of melanogenesis by the citrus flavonoid naringenin in mouse B16 melanoma cells. Biosci. Biotechnol. Biochem. 2006, 70, 1499–1501. [Google Scholar] [CrossRef] [PubMed]
  73. Ye, Y.; Wang, H.; Chu, J.H.; Chou, G.X.; Yu, Z.L. Activation of p38 MAPK pathway contributes to the melanogenic property of apigenin in B16 cells. Exp. Dermatol. 2011, 20, 755–757. [Google Scholar] [CrossRef] [PubMed]
  74. Aneklaphakij, C.; Chamnanpuen, P.; Bunsupa, S.; Satitpatipan, V. Recent Green Technologies in Natural Stilbenoids Production and Extraction: The Next Chapter in the Cosmetic Industry. Cosmetics 2022, 9, 91. [Google Scholar] [CrossRef]
  75. Wang, S.; Liu, X.-M.; Zhang, J.; Zhang, Y.-Q. An efficient preparation of mulberroside A from the branch bark of mulberry and its effect on the inhibition of tyrosinase activity. PLoS ONE 2014, 9, e109396. [Google Scholar] [CrossRef]
  76. Lorian, V. Antibiotics in Laboratory Medicine, 5th ed.; Lippincott Williams & Wilkins: Philadelphia, PA, USA, 2005. [Google Scholar]
  77. Clinical and Laboratory Standards Institute (CLSI). Methods for Dilution Antimicrobial Susceptibility Testes for Bacterial That Grow Aerobically: Approved Standards, 7th ed.; Clinical and Laboratory Standards Institute (CLSI): Wayne, PA, USA, 2006. [Google Scholar]
  78. Sritularak, B.; De-Eknamkul, W.; Likhitwitayawuid, K. Tyrosinase inhibitors from Artocarpus lakoocha. Thai J. Pharm Sci. 1998, 22, 149–155. [Google Scholar]
  79. Skehan, P.; Storeng, R.; Scudiero, D.; Monks, A.; McMahon, J.; Vistica, D. New colorimetric cytotoxicity assay for anticancer-drug screening. J. Natl. Cancer Inst. 1990, 82, 1107–1112. [Google Scholar] [CrossRef]
  80. Takahashi, H.; Parsons, P.G. Rapid and reversible inhibition of tyrosinase activity by glucosidase inhibitors in human melanoma cells. J. Investig. Dermatol. 1992, 98, 481–487. [Google Scholar] [CrossRef]
  81. Hunt, G.; Todd, C.; Cresswell, J.E.; Thody, A.J. Alpha-melanocyte stimulating hormone and its analogue Nle4DPhe7 alpha-MSH affectmorphology, tyrosinase activity and melanogenesis in cultured human melanocytes. J. Cell Sci. 1994, 107, 205–211. [Google Scholar] [CrossRef]
  82. Ye, Y.; Chou, G.X.; Mu, D.D.; Wang, H.; Chu, J.H.; Leung, A.K. Screening of Chinese herbal medicines for antityrosinase activity in a cell free system and B16 cells. J. Ethnopharmacol. 2010, 129, 387–390. [Google Scholar] [CrossRef]
  83. Bradford, M.M. A rapid and sensitive method for the quantitation of microgram quantities of protein utilizing the principle of protein-dye binding. Anal Biochem. 1976, 72, 248–254. [Google Scholar] [CrossRef]
  84. Hanwell, M.D.; Curtis, D.E.; Lonie, D.C.; Vandermeersch, T.; Zurek, E.; Hutchison, G.R. Avogadro: An advanced semantic chemical editor, visualization, and analysis platform. J. Cheminformatics 2012, 4, 17. [Google Scholar] [CrossRef]
  85. Phoopha, S.; Wattanapiromsakul, C.; Pitakbut, T.; Dej-Adisai, S. A New stilbene derivative and isolated compounds from Bauhinia Pottsii Var. Pottsii with their anti-alpha-glucosidase activity. Pharmacogn. Mag. 2020, 16, 161. [Google Scholar]
  86. Pitakbut, T.; Nguyen, G.-N.; Kayser, O. Activity of THC, CBD, and CBN on human ACE2 and SARS-CoV1/2 main protease to understand antiviral defense mechanism. Planta Med. 2022, 88, 1047–1059. [Google Scholar] [CrossRef] [PubMed]
  87. Sakulkeo, O.; Wattanapiromsakul, C.; Pitakbut, T.; Dej-adisai, S. Alpha-glucosidase inhibition and molecular docking of isolated compounds from traditional Thai medicinal plant, Neuropeltis Racemosa Wall. Molecules 2022, 27, 639. [Google Scholar] [CrossRef]
  88. Ismaya, W.T.; Rozeboom, H.J.; Weijn, A.; Mes, J.J.; Fusetti, F.; Wichers, H.J.; Dijkstra, B.W. Crystal structure of Agaricus bisporus mushroom tyrosinase: Identity of the tetramer subunits and interaction with tropolone. Biochemistry 2011, 50, 5477–5486. [Google Scholar] [CrossRef]
  89. Morris, G.M.; Huey, R.; Lindstrom, W.; Sanner, M.F.; Belew, R.K.; Goodsell, D.S.; Olson, A.J. AutoDock4 and AutoDockTools4: Automated docking with selective receptor flexibility. J. Comput. Chem. 2009, 30, 2785–2791. [Google Scholar] [CrossRef]
  90. Trott, O.; Olson, A.J. AutoDock Vina: Improving the speed and accuracy of docking with a new scoring function, efficient optimization, and multithreading. J. Comput. Chem. 2010, 31, 455–461. [Google Scholar] [CrossRef]
  91. Pettersen, E.F.; Goddard, T.D.; Huang, C.C.; Couch, G.S.; Greenblatt, D.M.; Meng, E.C.; Ferrin, T.E. UCSF Chimera—A visualization system for exploratory research and analysis. J. Comput. Chem. 2004, 25, 1605–1612. [Google Scholar] [CrossRef] [PubMed] [Green Version]
  92. Biovia Discovery Studio. Discovery Studio Visualizer, version v21.1.0.20298; Biovia Discovery Studio: San Diego, CA, USA, 2017. [Google Scholar]
Figure 1. Isolated compounds from S. taxoides wood.
Antibiotics 12 00319 g001
Figure 2. HMBC correlations (from H to C) of compound 1.
Antibiotics 12 00319 g002
Figure 3. Cell viability of the isolated compounds at a concentration as 50 μg/mL. Data were expressed as mean ± SD from three independent experiments. * p < 0.05 and ** p < 0.01 indicated a significant difference from the control group. Compound 1 = ω-hydroxymoracin C; Compound 2 = moracin M; Compound 3 = moracin C; Compound 4 = 3, 4, 3′, 5′-tetrahydroxybibenzyl; Compound 5 = piceatannol; positive controls = arbutin and kojic acid.
Antibiotics 12 00319 g003
Figure 4. Intracellular antityrosinase activity (A) and melanin content (B) in B16-F1 cells. Data were expressed as mean ± SD from three independent experiments. * p < 0.05 and ** p < 0.01 indicated a significant difference from the positive control group. Compound 1 = ω-hydroxymoracin C; Compound 2 = moracin M; Compound 3 = moracin C; Compound 4 = 3, 4, 3′, 5′-tetrahydroxybibenzyl; Compound 5 = piceatannol; positive controls = arbutin and kojic acid.
Antibiotics 12 00319 g004
Figure 5. Effect of the isolated compounds from S. taxoides on the melanogenic protein expression in B16-F1 cells. Cells were treated with 25 µg/mL (A) and 50 µg/mL (B) of the isolated compounds. Whole cell lysates were subjected to Western blot analysis using specific antibodies against MITF, tyrosinase, TRP1 and TRP2.
Antibiotics 12 00319 g005
Figure 6. Theoretical binding mode of the isolated bioactive metabolites obtained from S. taxoides simulated by molecular docking. The blue ligand represents ω-hydroxymoracin C, Compound 1, while the green indicates moracin M, Compound 2, in the active site on mushroom tyrosinase. Additionally, the purple ligand is moracin C, Compound 3. On the other hand, the orange ligand indicates 3,3′,4,5′-tetrahydroxybibenzyl, Compound 4, and the yellow ligand represents piceatannol, Compound 5. (A) demonstrates an overall view of ligand-tyrosinase interaction, while (B) exhibits a close-up view of an active site of tyrosinase colored in red color. (C,D) reveal intermolecular interactions of 3,3′,4,5′-tetrahydroxybibenzyl, piceatannol and catalytic amino acid residues on the mushroom tyrosinase. Finally, (EG) exhibit intermolecular interactions between ω-hydroxymoracin C, moracin M, moracin C and tyrosinase’s catalytic amino acid residues.
Antibiotics 12 00319 g006
Scheme 1. Phytochemical investigation from ethyl acetate and ethanol extracts of S. taxoides wood. VLC = vacuum liquid chromatography; CC = classical column chromatography; Gel CC = Sephadex LH-20; FA = formic acid; Hex= Hexane; CH2Cl2 = dichloromethane; CHCl3 = chloroform; EtOAc = ethyl acetate; MeOH = Methanol; H2O= water; * = unstable compounds.
Antibiotics 12 00319 sch001
Table 1. MIC and MBC of the isolated compounds against S. epidermidis, S. aureus, MRSA and C. acnes.
CompoundsS. epidermidisS. aureusMRSAC. acnes
MIC
(µg/mL)
MBC
µg/mL)
MIC
(µg/mL)
MBC
(µg/mL)
MIC
(µg/mL)
MBC
(µg/mL)
MIC
(µg/mL)
MBC
(µg/mL)
11632163216>256128>256
264>256256>25664>256>256>256
3128>25632643264128>256
4128>25612825664256>256>256
564128>256>256128>256>256>256
Oxa P0.50.50.1250.125NTNT0.50.5
Van PNTNTNTNT0.1250.5NTNT
P for positive controls; Oxa = Oxacillin; Van = Vancomycin; NT = not determined; Compound 1 = ω-hydroxymoracin C; Compound 2 = moracin M; Compound 3 = moracin C; Compound 4 = 3, 4, 3′, 5′-tetrahydroxybibenzyl; Compound 5 = piceatannol.
Table 2. IC50 values of the isolated compounds from S. taxoides on tyrosinase inhibitory activity.
CompoundNameIC50 (µg/mL)
1ω-hydroxymoracin C109.64 ± 0.89
2moracin M47.34 ± 0.78
3moracin C128.67 ± 1.21
43, 4, 3′, 5′-tetrahydroxybibenzyl35.65 ± 0.98
5piceatannol149.73 ± 0.86
Std.Kojic acid P38.67 ± 0.94
Std.Water extract of A. lacucha wood P8.73 ± 0.69
P = positive control.
Table 3. Molecular interaction obtained from molecular docking of compounds 1 to 5 and conserved amino acids interacting with compounds of interest.
ResiduesCompound 1Compound 2Compound 3Compound 4Compound 5Conserve
ω-Hydroxymoracin CMoracin MMoracin C3, 4, 3´, 5´-TetrahydroxybibenzylPiceatannol
His61
His85 MM
Phe90
Phe192
Val248 SS
Met257
His259 MM
Asn260
His263 SS
Phe264 MMS
Arg268
Pro277 MM
His279
Met280
Gly281
Ser282 MMM
Val283XXXXX
Ala286 SS
S indicates conserved amino acids interacting within the stilbene group (Compounds 4 and 5). Additionally, M exhibits conserved residues interacting within the moracin group (Compounds 1, 2, and 3). Finally, X demonstrates conserved amino acid residues in all compounds found in this study.
Table 4. Estimated binding energy from a refining docking score through Autodock 4.2.6, including relevance energies, and a correlation with estimated binding energy and IC50 value from the enzyme binding experiment.
Autodock 4.2.6Experiment
CmpvdW+
Hbond (1)
Elec
Stat.
Energy
(2)
Desol.
Energy
(3)
Total
Intermol.
Interact.
Energy
(4; 1 + 2 + 3)
Total
Internal
Energy
(5)
Tors.
Free
Energy
(6)
Unbound’s
Energy (7)
Estimated
Binding
Energy
(Kcal/mol)
(8; 4 + 5 + 6 + 7)
Modified
Estimated
Binding
Energy
(Kcal/mol)
(9; 4 + 5 + 7)
IC50 Values
1−7.470.012.75−4.71−0.742.390.00−3.06−5.45109.64
2 *−6.090.082.29−3.73−0.081.190.00−2.62 *−3.81 *47.34
3−6.830.022.08−4.73−0.371.790.00−3.31−5.10128.67
4−8.700.043.21−5.45−0.342.090.00−3.70−5.7938.67
5−8.080.073.06−4.94−0.361.790.00−3.51−5.30149.73
0.460.891
Correlation to the IC50 value
Cmp is an abbreviation for a compound. (1) represents van der Waals and hydrogen interactions. (2) indicates electrostatic energy. (3) demonstrates desolvation energy. (5) refers to total internal energy. (6) is torsion-free energy. (8) exhibits estimated binding energy, combing all mentioned energy earlier. Finally, (9) shows the authors’ modified estimated binding energy by ignoring torsion energy. Bold and asterisk (*) indicate compound 2′s obtained energies that are not included in a correlation calculation. A correlation value presents in the range of 0 to 1, showing no to high correlation. The IC50 values are used as a reference in a calculation.
Disclaimer/Publisher’s Note: The statements, opinions and data contained in all publications are solely those of the individual author(s) and contributor(s) and not of MDPI and/or the editor(s). MDPI and/or the editor(s) disclaim responsibility for any injury to people or property resulting from any ideas, methods, instructions or products referred to in the content.

