Article

Effect of Glycerol on Fosfomycin Activity against Escherichia coli

by
Miriam Ortiz-Padilla
1,2,3,
Inés Portillo-Calderón
1,3,4,
Ana Velázquez-Escudero
1,
Jesús Rodríguez-Baño
1,3,4,5,
Álvaro Pascual
1,2,3,4,
José Manuel Rodríguez-Martínez
2,3,4,* and
Fernando Docobo-Pérez
2,3,4,*
1
Unidad Clínica de Enfermedades Infecciosas y Microbiología, Hospital Universitario Virgen Macarena, 41009 Sevilla, Spain
2
Departamento de Microbiología, Facultad de Medicina, Universidad de Sevilla, 41009 Sevilla, Spain
3
Instituto de Biomedicina de Sevilla IBIS, Hospital Universitario Virgen Macarena/CSIC/Universidad de Sevilla, 41009 Sevilla, Spain
4
Centro de Investigación Biomédica en Red en Enfermedades Infecciosas (CIBERINFEC), 28029 Madrid, Spain
5
Departamento de Medicina, Facultad de Medicina, Universidad de Sevilla, 41009 Sevilla, Spain
*
Authors to whom correspondence should be addressed.
Antibiotics 2022, 11(11), 1612; https://doi.org/10.3390/antibiotics11111612
Submission received: 21 October 2022 / Revised: 7 November 2022 / Accepted: 10 November 2022 / Published: 12 November 2022
(This article belongs to the Section Mechanisms and Structural Biology of Antibiotic Action)

Abstract

:
Fosfomycin is an antimicrobial that inhibits the biosynthesis of peptidoglycan by entering the bacteria through two channels (UhpT and GlpT). Glycerol is clinically used as a treatment for elevated intracranial pressure and induces the expression of glpT in Escherichia coli. Glycerol might offer synergistic activity by increasing fosfomycin uptake. The present study evaluates the use of glycerol at physiological concentrations in combination with fosfomycin against a collection of isogenic mutants of fosfomycin-related genes in E. coli strains. Induction of fosfomycin transporters, susceptibility tests, interaction assays, and time-kill assays were performed. Our results support the notion that glycerol allows activation of the GlpT transporter, but this induction is delayed over time and is not homogeneous across the bacterial population, leading to contradictory results regarding the enhancement of fosfomycin activity. The susceptibility assays showed an increase in fosfomycin activity with glycerol in the disk diffusion assay but not in the agar dilution or broth microdilution assays. Similarly, in the time-kill assays, the effect of glycerol was absent by the emergence of fosfomycin-resistant subpopulations. In conclusion, glycerol may not be a good candidate for use as an adjuvant with fosfomycin.

1. Introduction

Bacterial resistance has been steadily increasing in recent decades, along with the lack of new active drugs, leading to the need to reuse old antimicrobial agents as an alternative strategy [1,2] to combat increased morbidity and mortality worldwide [3]. Fosfomycin is a broad-spectrum antimicrobial approved for the treatment of uncomplicated urinary tract infections, soft tissue infections, and sepsis caused by Enterobacteriaceae [4,5]. The bactericidal action of fosfomycin is achieved by interrupting the first step of peptidoglycan biosynthesis by blocking the MurA enzyme, thus requiring entry into the cytoplasm. This entry is mediated by the GlpT (glycerol-3-phosphate transporter) and UhpT transporters (hexose phosphate transporter), which belong to the major facilitator superfamily [6]. The expression of these transporters is regulated by many factors. As many other genes involved in the catabolism of secondary carbon sources, both are controlled by the concentration of cyclic AMP (cAMP, synthesized by adenylate cyclase encoded by the cyaA gene) bound to its transcriptional dual regulator CRP (cAMP receptor protein receptor) [7]. Therefore, the absence of the cyaA gene leads to increased resistance to fosfomycin [8]. Moreover, each transporter is induced by its own substrate. UhpT is induced by the presence of G6P, which is detected in the periplasmic space by the two-component system UhpBC, where UhpB phosphorylates UhpA acting as a transcriptional activator of uhpT. Thus, mutations in any gene in this system lead to increased resistance to fosfomycin [9]. With regard to GlpT, this transporter is induced by the presence of G3P, which binds to GlpR, a transcriptional repressor of glpT, causing a loss of affinity for the promoter, thus inducing its transcription. Loss of function of this gene would increase the sensitivity to fosfomycin [10]. In this sense, the main mechanism of resistance in E. coli clinical isolates is the loss of function of these transporters or genes involved in their regulation [6]. Thus, to fully observe fosfomycin activity, glucose-6-phosphate (G6P, inductor of UhpT) is added for fosfomycin susceptibility assays according to the CLSI or EUCAST guidelines. However, the role of the GlpT transporter in susceptibility testing remains unclear. Although the addition of glycerol-3-phosphate induces the GlpT transporter, it also reduces the transport of fosfomycin by occupancy of the transporter site [11]. Alternative activators should be explored to overcome this problem in order to increase the activity of fosfomycin. In this sense, glycerol could be a good candidate for this function. Glycerol is a triol that can be used by E. coli as a carbon source and has also been used orally or intravenously in clinical practice as a potent osmotic dehydrating agent in the treatment of elevated intracranial pressure [12]. In E. coli, glycerol enters the bacterium through passive diffusion or through the glycerol facilitator, the GlpF transporter [13]. Once inside, it is phosphorylated by GlpK kinase, producing intracellular glycerol-3-phosphate. This endogenous glycerol-3-phosphate can remove the GlpR repressor from the glpT promoter region, activating its transcription [13,14,15]. The use of this carbon source could solve the problem of activating the glpT transporter without reducing the intake of fosfomycin. However, fosfomycin activity has not been previously studied in combination with glycerol. Therefore, the objective of the present study is to characterize and evaluate the activity of fosfomycin using glycerol at clinically physiological concentrations for the activation of the GlpT transporter.

2. Results

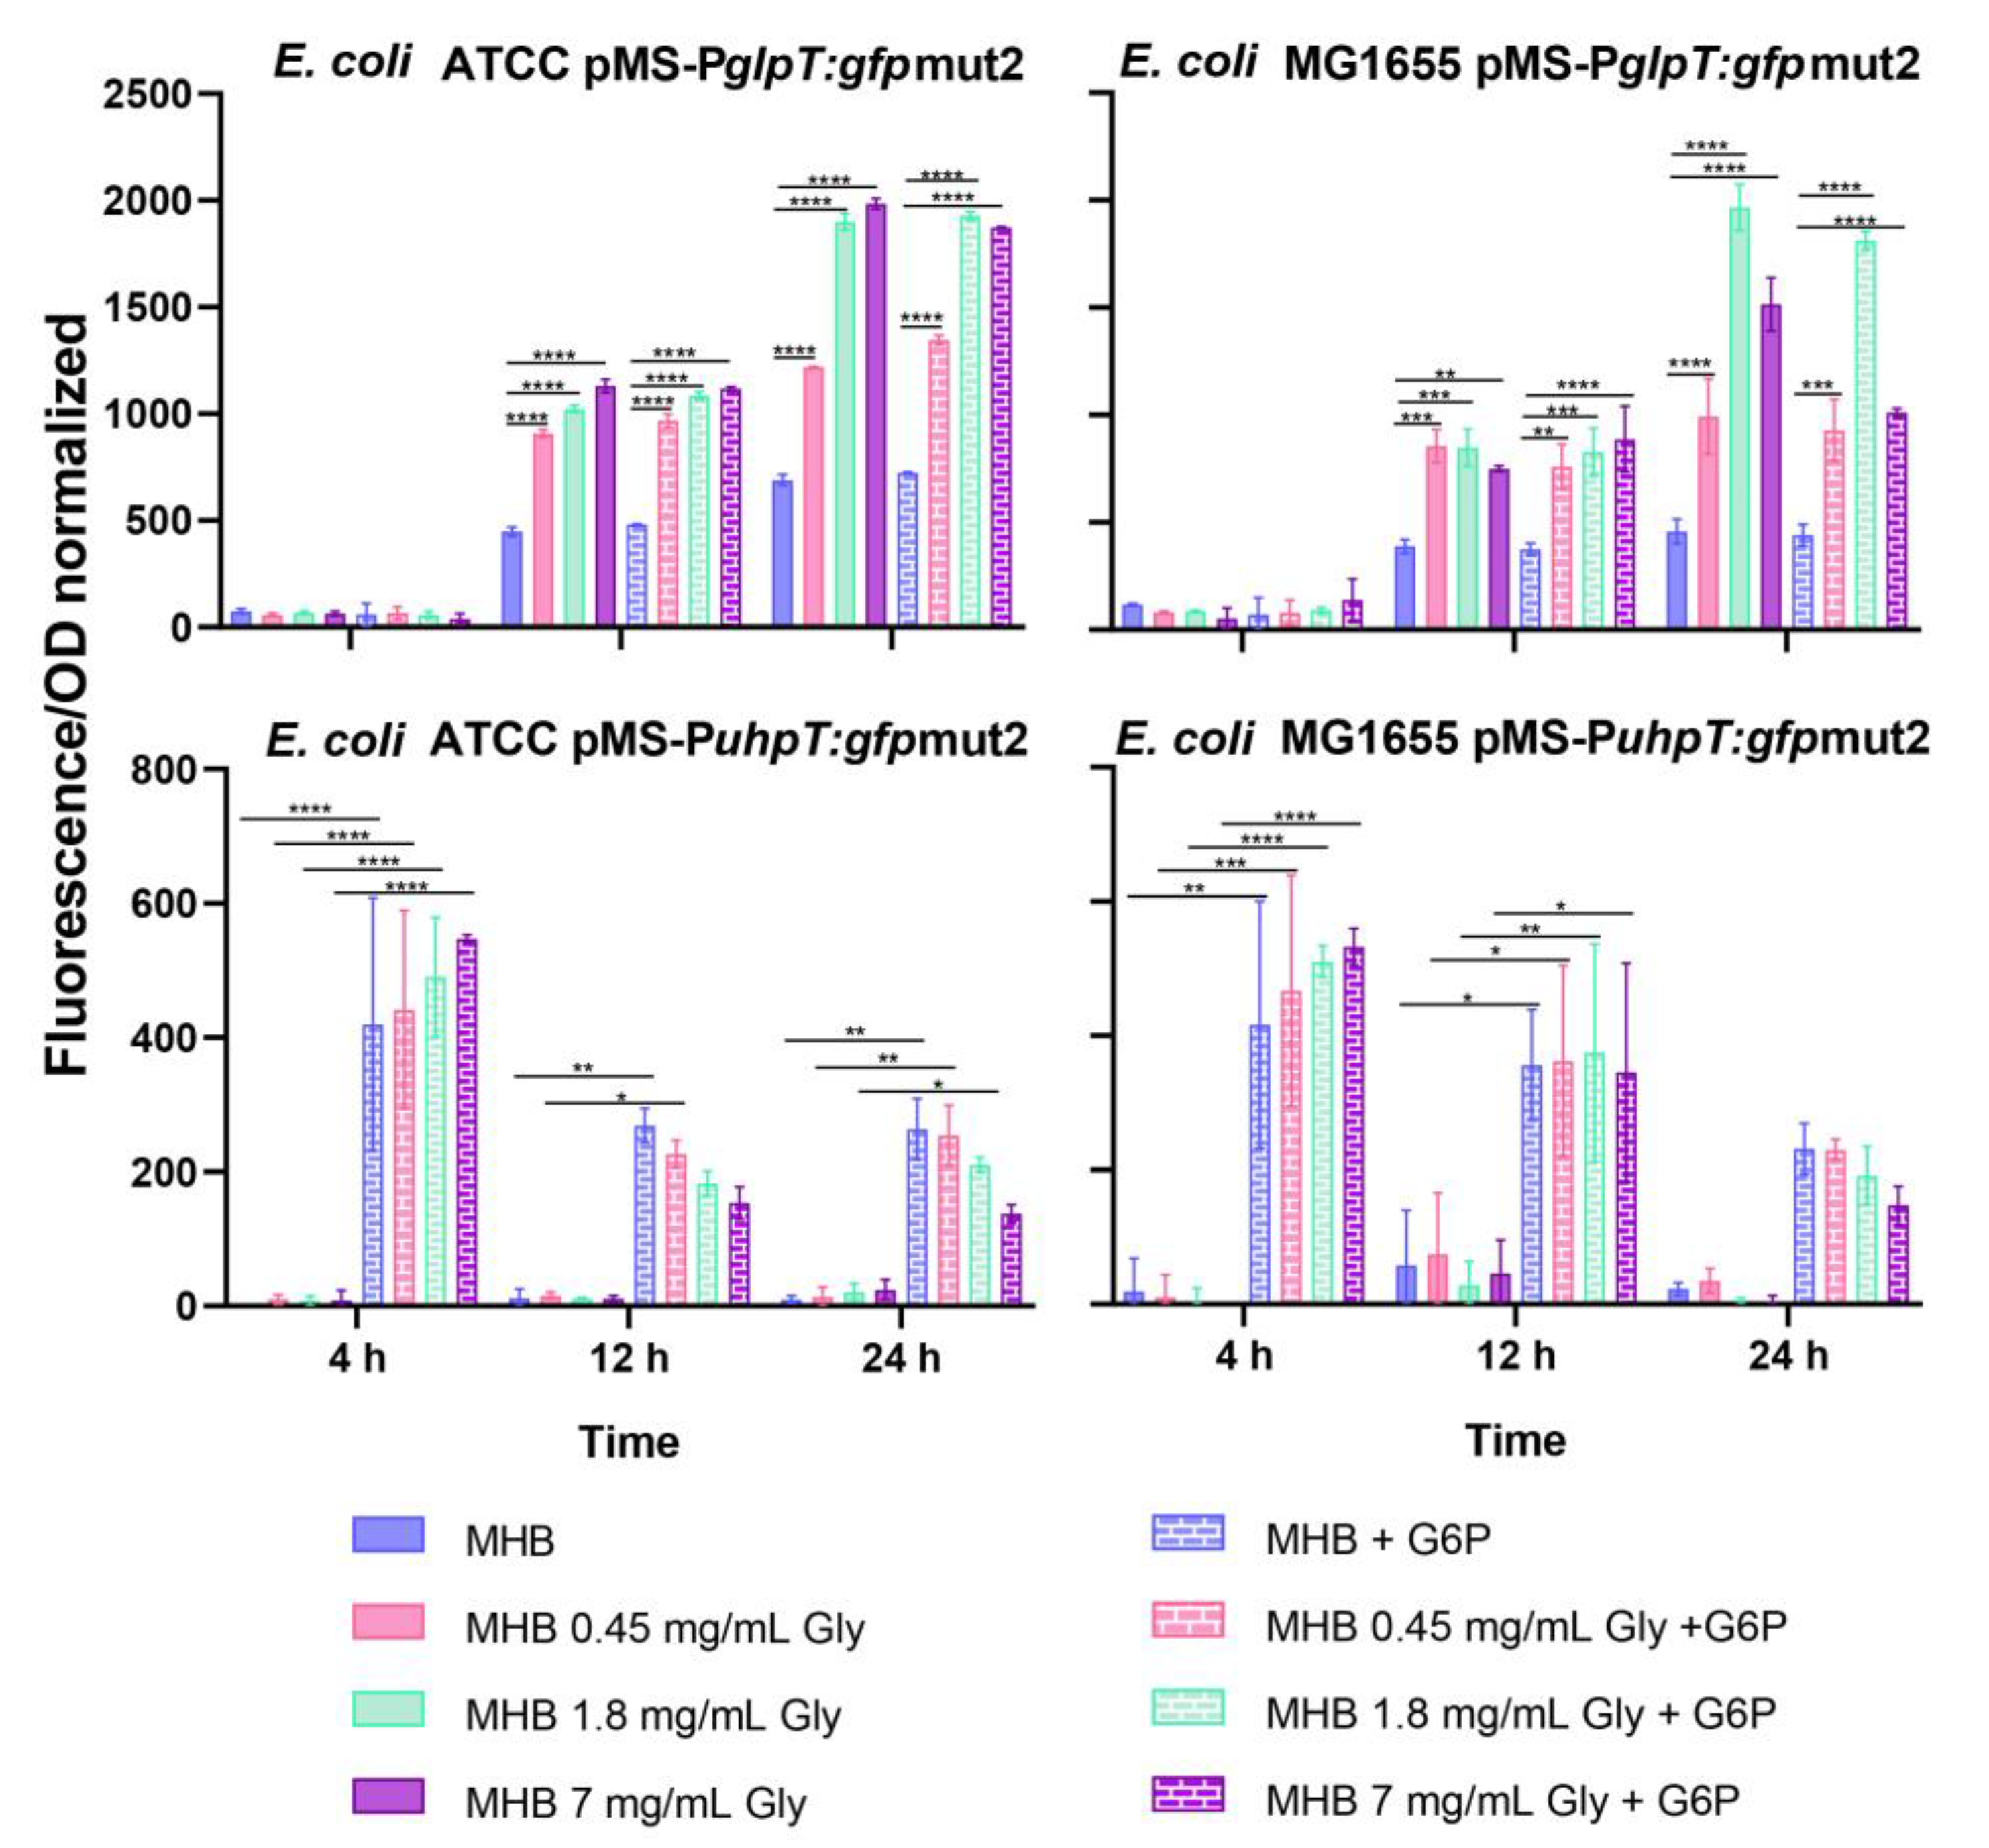
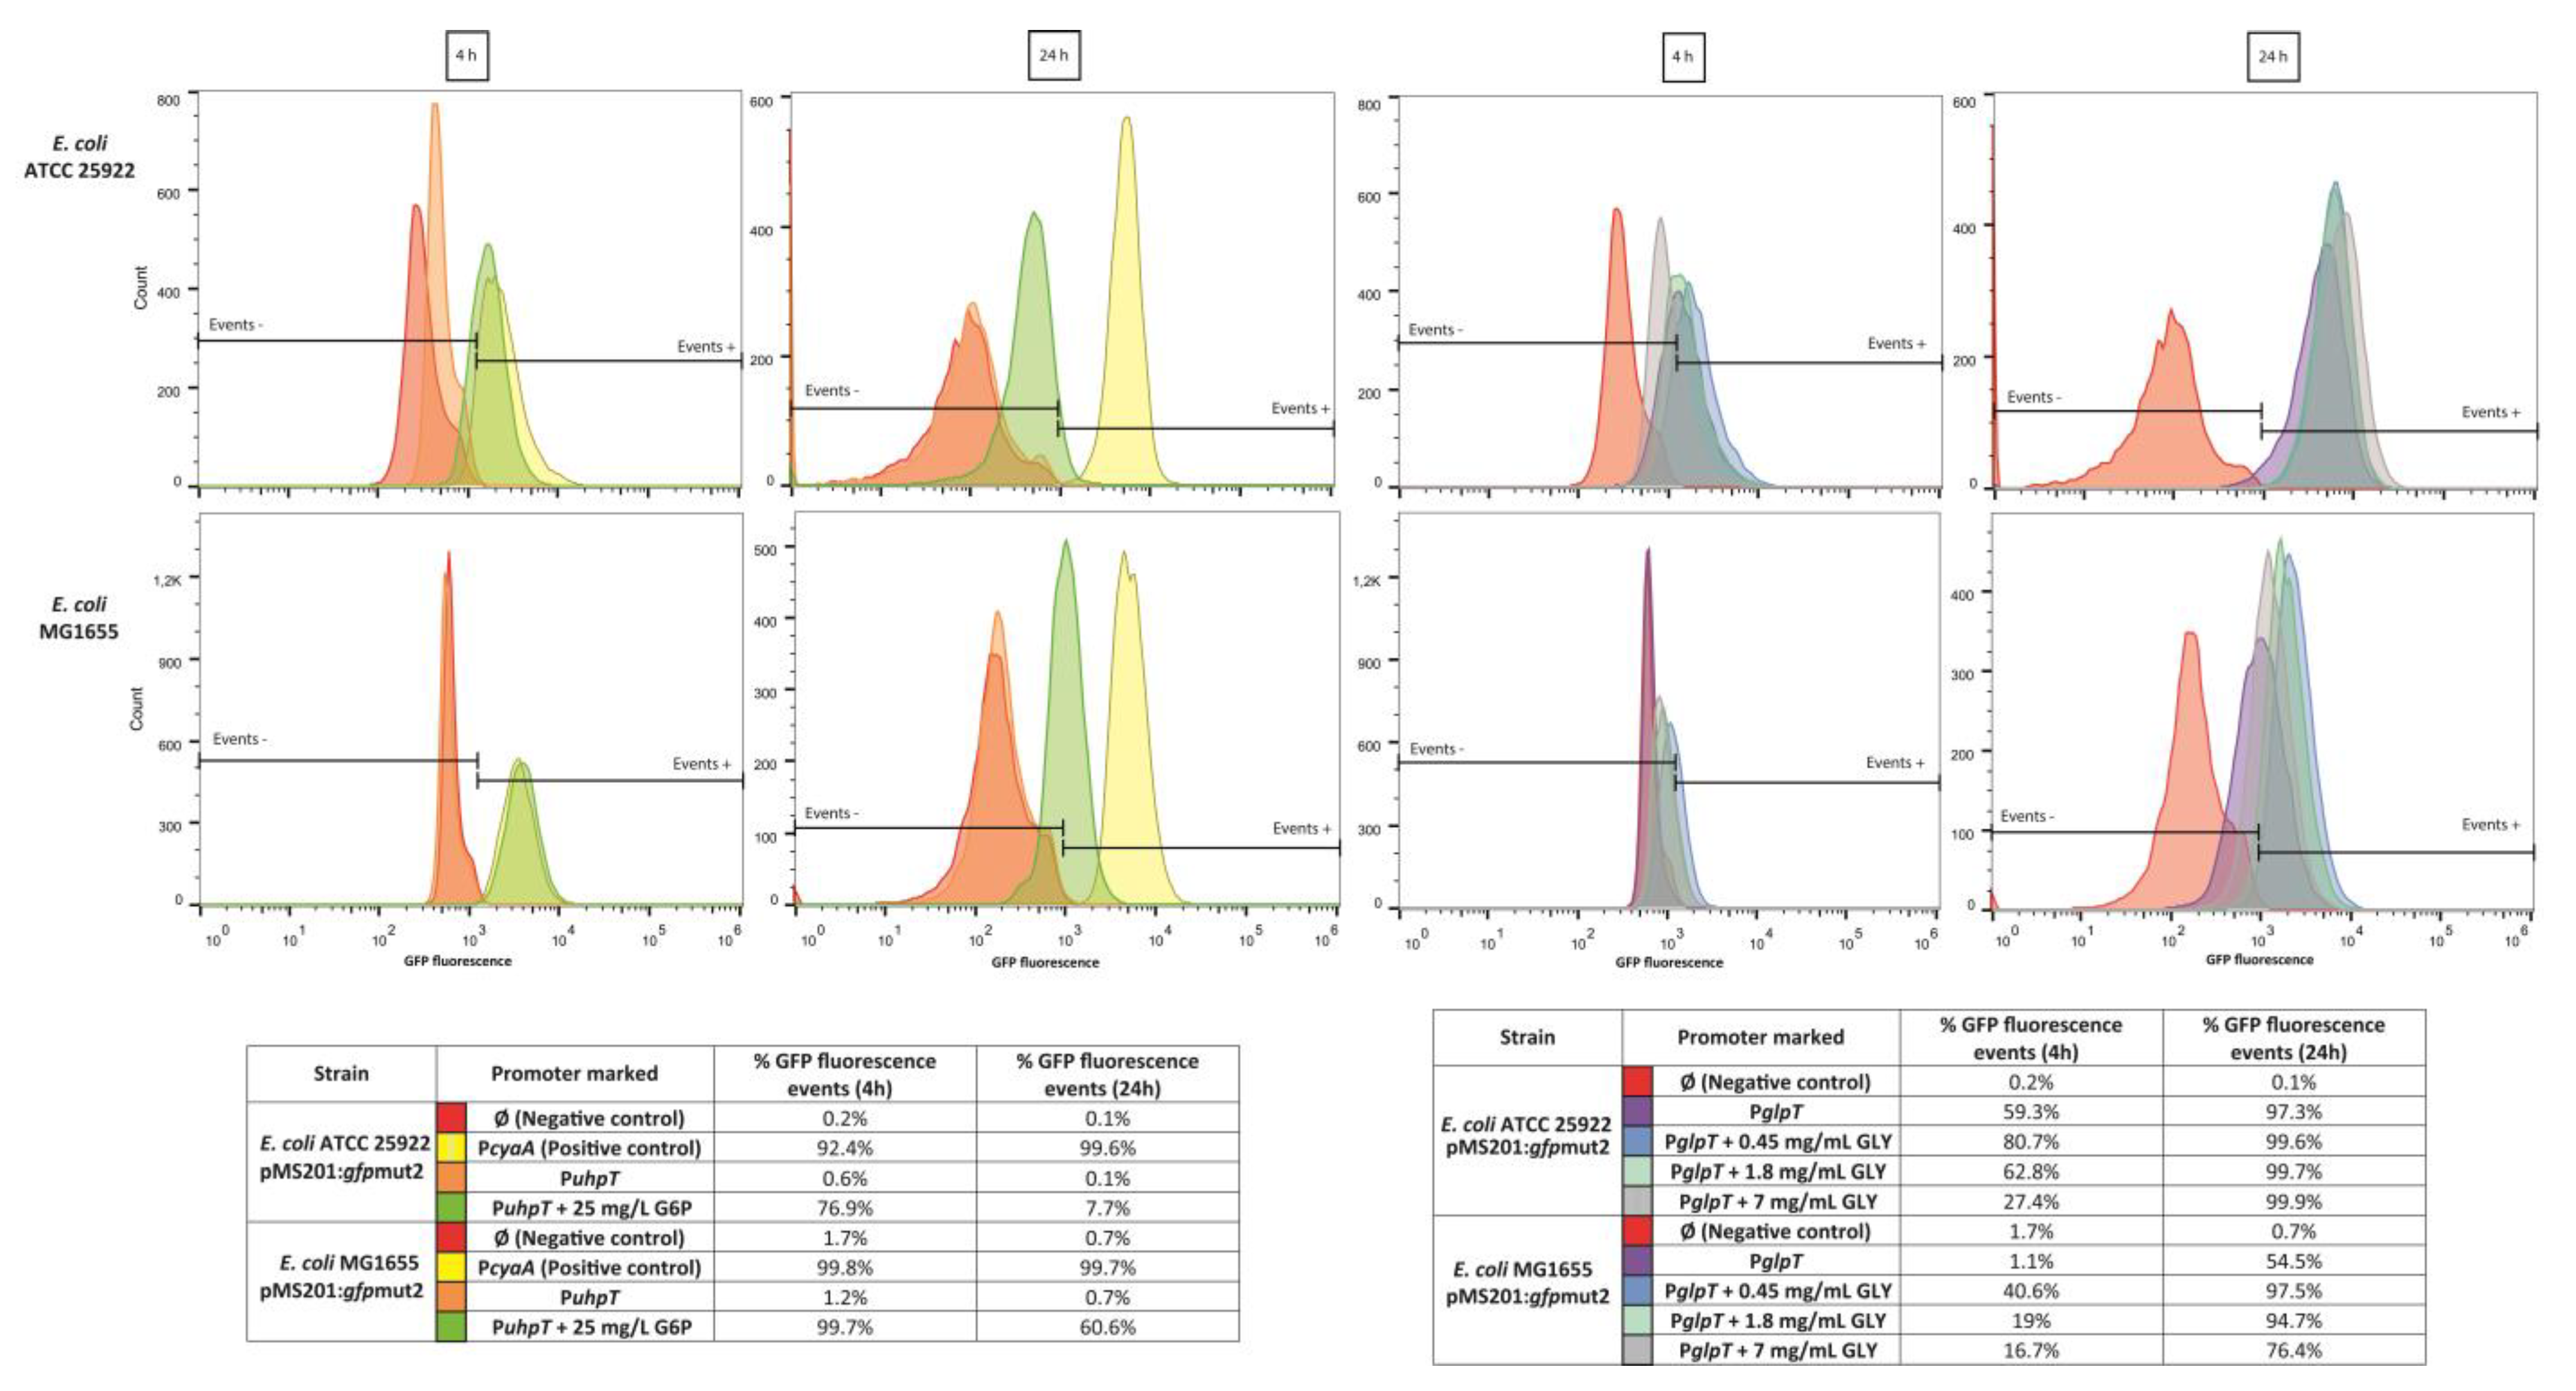
2.1. Fosfomycin Transporters Promoters Activity

The results on the promoter activity of glpT and uhpT at the time points 4 h, 12 h, and 24 h are shown in Figure 1. Furthermore, the 24-h fluorescence kinetics is shown in the Supplementary Materials (Figure S1). The presence of glycerol produced a significant increase in glpT transcription for both strains at 12 and 24 h. This increase was minimal or absent within the first 4 h, but after this initial lag period, glpT transcription increased during the remainder of the assay. In the case of E. coli ATCC25922, the highest transcription of glpT was observed at the maximum glycerol concentration of 7 mg/mL. While in the case of E. coli MG1655, the maximum activity of the glpT promoter was observed at a glycerol concentration of 1.8 mg/mL. The addition of G6P did not modify the expression of glpT. Regarding the promoter activity of uhpT, the addition of G6P, but not glycerol, increased the expression of uhpT within the first 4 h, followed by a gradual decline.
The results of flow cytometry are shown in Figure 2. In the absence of glycerol and G6P, no expression of the uhpT gene was observed for E. coli ATCC25922 and E. coli MG1655. The addition of G6P increased the percentage of positive events at 4 h (76.9% and 99.7%). However, the fluorescence decreased to 7.7% and 60% after 24 h. Regarding the expression of the glpT gene in MHB alone at 4 h, 59.3% of the E. coli ATCC25922 population and 1.1% of the E. coli MG1655 population showed glpT expression. The addition of glycerol increased the percentage of positive events for both strains, except for the case of E. coli ATCC25922 with 7 mg/mL of glycerol. At 24 h, almost all the population of E. coli ATCC25922 (97.3%) and half of the population of E. coli MG1655 (54.5%) showed fluorescence. The addition of glycerol increased the percentage of positive events for both strains, reaching almost 100% of positive events in E. coli ATCC25922 and nearly 95% in E. coli MG1655, except with 7 mg/mL of glycerol. The fluorescence intensity was higher in the case of the E. coli ATCC25922 strain, closer to the intensity obtained by the positive control (pMS201-PcyaA::gfpmut2).

2.2. Susceptibility Testing

The fosfomycin MICs, performed with the reference method, for the isogenic collection are shown in Table 1, and the results of disk diffusion are shown in Figure 3.
With the agar dilution assay, the fosfomycin MIC for E. coli ATCC25922 was 2 mg/L with the addition of G6P. The absence of G6P increased the MIC to >64 mg/L, and the addition of 7 mg/mL glycerol did not restore fosfomycin susceptibility. With respect to the E. coli MG1655 strain, similar results were observed with a MIC of 2 mg/L with G6P, 64 mg/L without G6P, and 32 mg/L without G6P but with the addition of glycerol. The fosfomycin MIC for the single uhpT and the double-gene mutant for both transporters (ΔglpT-uhpT) were >64 mg/L for all the assayed conditions. For the remaining mutant strains, the MIC ranged from 1–4 mg/L with the addition of G6P, ≥32 mg/L in the absence of G6P, regardless of the addition of glycerol, except the mutant for ΔglpR gene (2 and 4 mg/L).
Regarding the results observed by the agar dilution method, the addition of glycerol did not improve fosfomycin activity (MIC drop of ≥2 log2 dilution) with respect to fosfomycin alone or in combination with G6P.
Regarding the disk diffusion assays, considering the main inhibition zone, the results showed that the wild-type strains significantly increased their fosfomycin susceptibility with the addition of glycerol. This increase occurred with and without the addition of G6P for both wild-type strains, except for the E. coli ATCC25922 strain with glycerol (0.45 mg/mL) with G6P.
The use of fosfomycin without G6P generated a reduced inhibition zone for the E. coli ATCC25922 but not for the E. coli MG1655 strains. It should be noted that the addition of glycerol also generated this reduced inhibition zone under certain conditions. The addition of glycerol did not modify the size of the reduced inhibition zone for the E. coli ATCC25922 strain but produced a reduced inhibition zone with the addition of G6P, also observed for the E. coli MG1655.
With respect to the ∆glpT mutant, a significant increase in susceptibility was observed with the addition of 1.8 and 7 mg/mL of glycerol. This increase did not occur with the addition of G6P. Regarding the reduced inhibition zone, no changes were observed with the addition of the different concentrations of glycerol, with or without G6P.
The E. coli MG1655 ∆uhpT mutant showed, in the reduced inhibition zone, a significant increase in susceptibility with 1.8 and 7 mg/mL of glycerol, with and without G6P. Furthermore, the addition of any concentration of glycerol significantly increased the main inhibition zone, with or without G6P.
E. coli MG1655∆cyaA strain showed a significant increase in susceptibility with 0.45 and 1.8 mg/mL of glycerol. The addition of 7 mg/mL of glycerol did not produce any effect, regardless of the addition of G6P.
E. coli MG1655 ∆glpT-uhpT,glpR, and ∆glpK strains did not show any significant increase in susceptibility in any of the conditions evaluated.

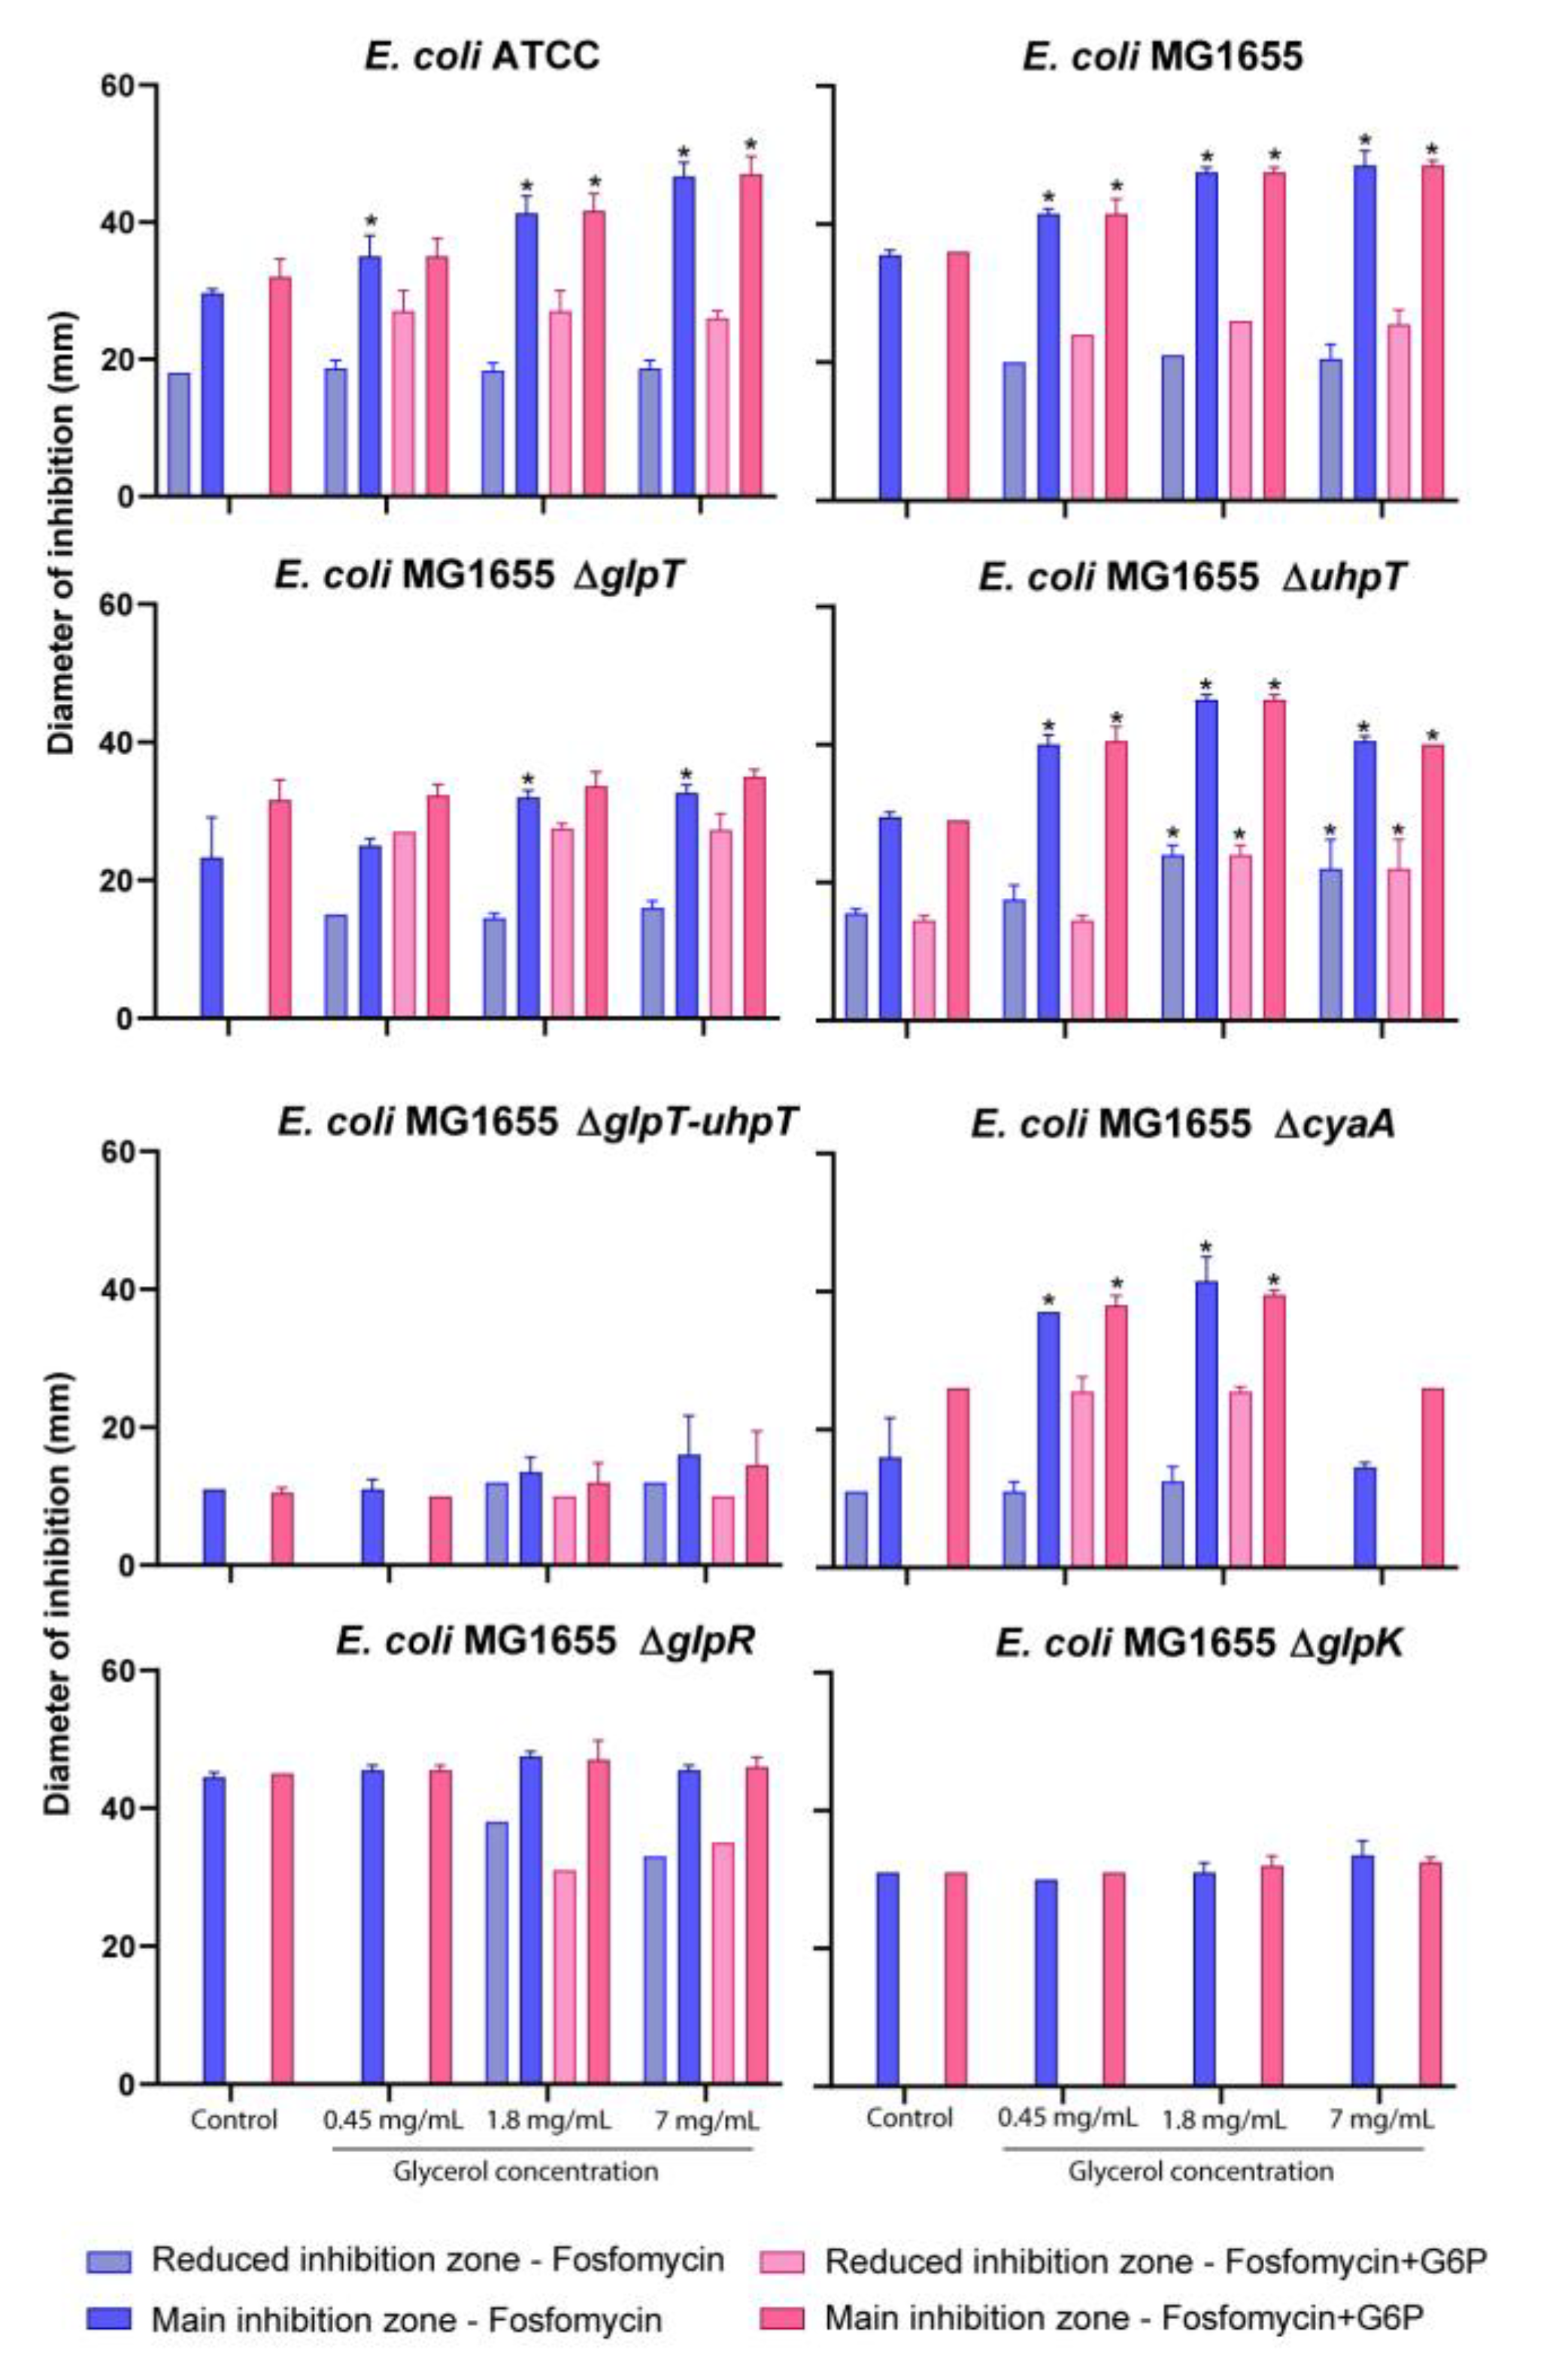
2.3. Fosfomycin and Glycerol Interaction Assay

The result of the interaction assay is shown in Table 2 and Figure S2. The combination of fosfomycin and glycerol showed synergistic activity (ZIP score > +10) G6P for the wild-type strains (E. coli ATCC25922: 16.3 ± 1.2 and E. coli MG1655: 16.5 ± 1.9), and for E. coli MG1655 ∆uhpT strain with G6P (12.3 ± 3.6) and without (11.3 ± 2.9). The most synergistic area occurred between 7–28 mg/mL of glycerol and 0.5–2 mg/L of fosfomycin for the E. coli ATCC25922 strain. Similar results were observed for the E. coli MG1655 strain, but at 0.25–1 mg/L of fosfomycin. In the case of E. coli MG1655 ∆uhpT, the greatest synergy was observed at the same concentration as that observed for the E. coli ATCC25922 strain with and without G6P.
Antagonism (ZIP score < −10) was observed against the E. coli MG1655 ∆glpT-uhpT strain under any condition (−12.8 ± 5.4 and −21 ± 3.8). The addition of glycerol did not interact with the rest of the evaluated strains.

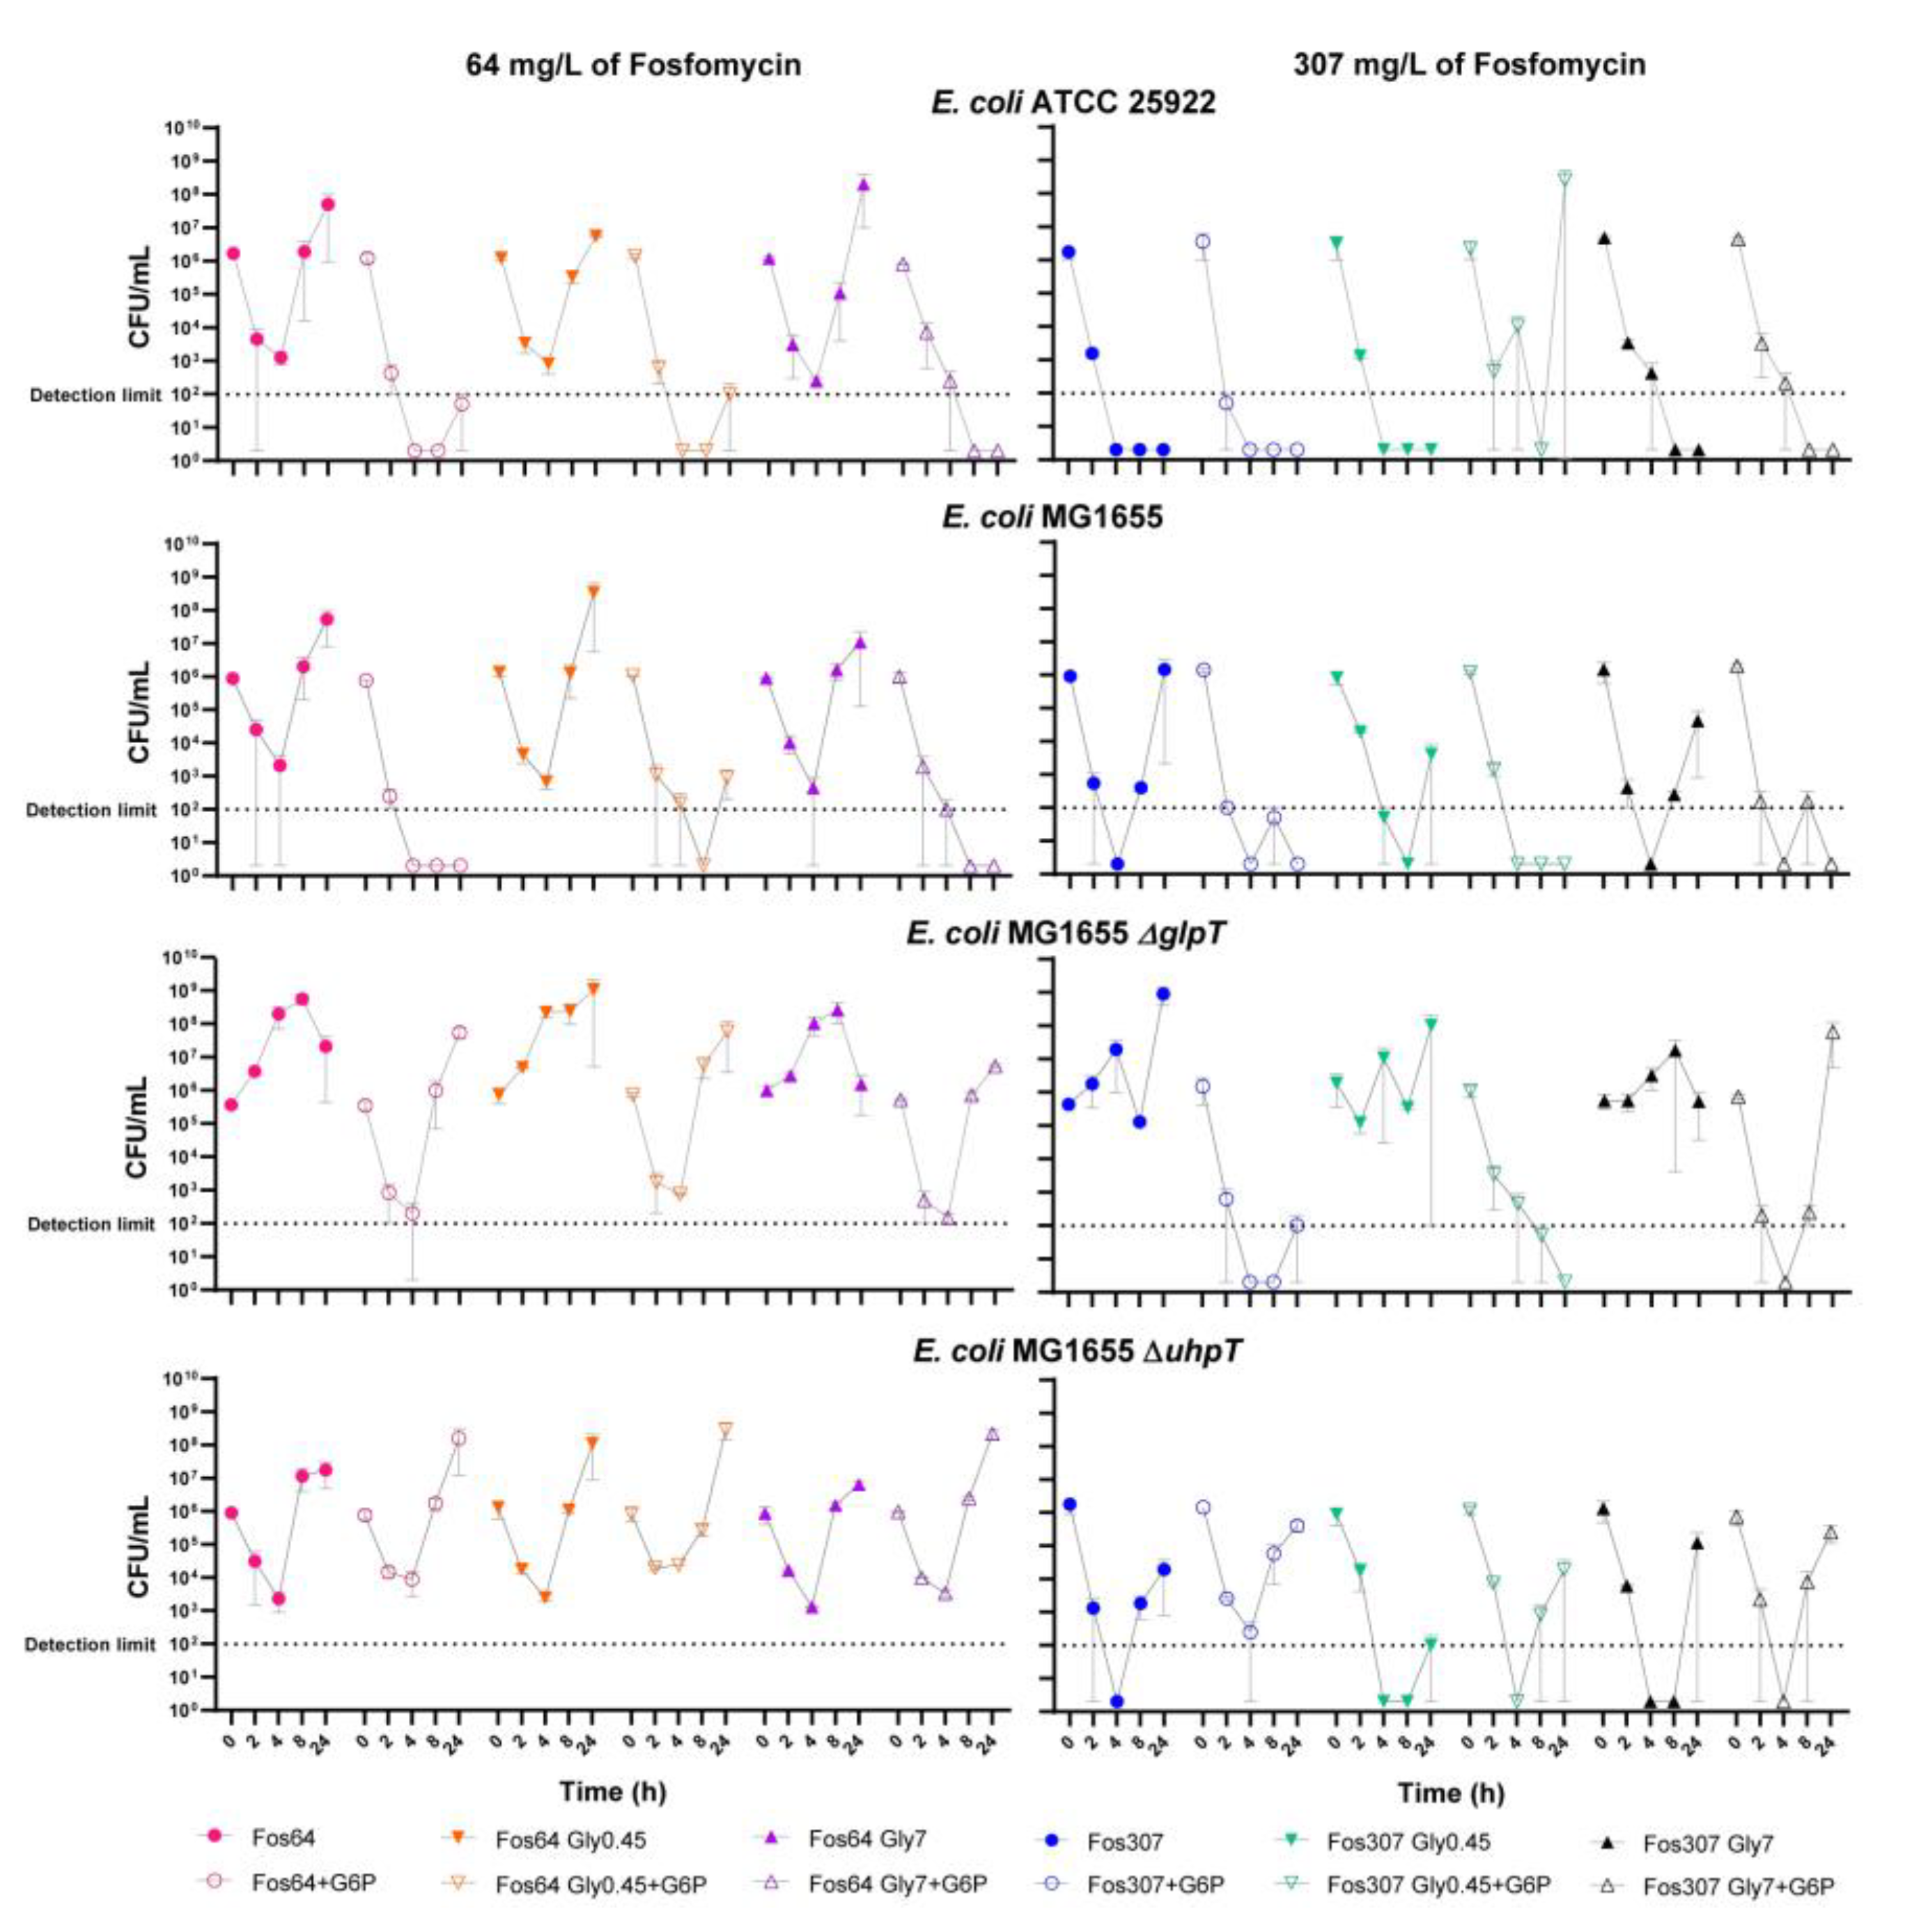
2.4. Fosfomycin and Glycerol Time-Kill Assays

E. coli E. coli ATCC25922, E. coli MG1655, and their mutant derivatives were evaluated at two concentrations of fosfomycin (64 and 307 mg/L), without glycerol, and with two concentrations (0.45 and 7 mg/mL). The results are shown in Figure 4 and Figure S3 (for E. coliglpT-uhpT,cyaA,glpR, andglpK strains).
The addition of glycerol and G6P did not modify growth under control conditions (without fosfomycin, data not shown). Fosfomycin alone at 64 mg/L showed a bactericidal effect (decreased the bacterial burden ≥3 log10 CFU/mL) within the first 4 h against the wild-type and the E. coli MG1655 ∆uhpT mutant strains, but bacterial regrowths were observed at 8 and 24 h. The addition of G6P also showed a bactericidal effect within the first 4–8 h in all strains except E. coli MG1655 ∆uhpT and ∆glpT-uhpT and prevented the bacterial regrowth for the wild-type strains and the E. coli MG1655 ∆glpR and ∆glpK mutant strains. The addition of glycerol at both tested concentrations did not improve the bactericidal effect against any of the evaluated strains.
Except for E. coli MG1655 ∆glpT and ∆glpT-uhpT strains, fosfomycin alone at 307 mg/L showed a bactericidal effect against all the strains within the first hours. However, bacterial regrowth was observed except for the wild-type E. coli ATCC and MG1655 ∆glpR strains. The addition of G6P improved the bactericidal effect and prevented the regrowth in all the strains except for E. coli MG1655 ∆uhpT and ∆glpT-uhpT. The addition of glycerol at both concentrations did not improve the bactericidal effect in any of the evaluated strains. Only against E. coli MG1655 ∆uhpT strain fosfomycin combined with 0.45 mg/mL of glycerol showed an initial improved activity; however, bacterial regrowth was observed after 24 h.

3. Discussion

The present study evaluates the role of glycerol in enhancing fosfomycin activity against wild-type strains of E. coli and strains that harbor specific determinants of resistance to fosfomycin.
In general, the activation of the GlpT transporter using glycerol as an internal activator showed contradictory results on the activity of fosfomycin.
The present study shows that glycerol, at physiological concentrations, can activate the glpT promoter, increasing glpT expression [13,16]. This result agrees with previous works showing the activation of genes (glpACB, glpD glpFKX, glpTQ, etc.) involved in the glycerol catabolism and regulated by the glpR repressor in E. coli, P. aeruginosa or P. putida [14,15,17]. However, this glycerol induction of glpT shows a delayed initiation in contrast to the rapid activation of the hexoses-6-phosphate transporter (uhpT) with the addition of G6P. These effects have been observed using GFP promoter fusions in real-time fluorescence monitoring and flow cytometry assays for glpT and uhpT genes.
A possible explanation for this behavior was given by Nikel et al. [14], who observed a protracted lag phase in cultures of P. putida KT2440 growing in glycerol.
The regulatory network of the glp genes needs the product of the first biochemical reaction (sn-glycerol-3-P) to derepress gene expression, which is otherwise inhibited by GlpR. However, the genes that encode the glycerol transporter and the kinase that produces G3P from glycerol are repressed by the GlpR protein. Thus, to get the transcription started is the low-probability effector-independent stochastic lifting of the repression. While the derepression process is taking place, this transcriptional architecture translates into different levels of metabolic activity (representing, in this context, the ability of the cells to catabolize glycerol). It is important to note that while the glpT gene is absent in P. putida, the regulation network is conserved in E. coli and P. aeruginosa. [1,15,18]
With regard to fosfomycin activity with the addition of glycerol, the present study shows distinct results depending on the characteristics of the assay.
In the disk diffusion assays, secondary and reduced inhibition zones were observed, suggesting the presence of subpopulations with different fosfomycin susceptibility, even with the use of glycerol and G6P. The maximum fosfomycin activity was observed against the glpR repressor mutant because the glpT transporter is fully derepressed and insensitive to the addition of glycerol. Additionally, the addition of glycerol did not show any effect in glpK mutant due to the inability to transform glycerol into glycerol-3-phosphate [16].
However, fosfomycin activity was observed, similar to that observed against the E. coli MG1655 wild-type strain without glycerol, and this could be partially explained by the intracellular biosynthesis of sn-glycerol-3-phosphate as a precursor of phospholipid synthesis [19]. The absence of activity was observed in the double-gen mutant ΔglpT-uhpT strain, indicating that the activation of the fosfomycin transporters is the main control factor of fosfomycin activity, as previously observed by Ballesteros et al. [1].
It is also important to note that the reduced inhibition zones remained unchanged, irrespective of the glycerol concentration or the addition of G6P, suggesting the presence of baseline defects in the complex regulatory networks of the fosfomycin transporters glpT and uhpT [6,20].
In the present study, discrepancies between disk diffusion and agar dilution susceptibility assays have been observed. These results agree with our previous studies in which fosfomycin susceptibility showed inconsistent results between broth and agar dilutions and agar diffusion techniques in collections of clinical isolates and isogenic mutants related to fosfomycin resistance, including heteroresistant strains [1,21,22]. Although there were no differences in the MIC of fosfomycin when glycerol was added to the assay, it must be noted that lower bacterial densities were observed (data not shown), indicating a mild synergistic effect not measurable with the assay. Regarding the interaction assays between fosfomycin and glycerol, only the wild-type strains and E. coli MG1655 ∆uhpT mutant showed synergistic activity. However, the time-kill assays did not show sensitization with the combination of fosfomycin and glycerol. It is important to note that in the time-kill assays, divergent results were observed between the replicates for wild-type strains and for the E. coli MG1655 ∆uhpT. For these strains, one replicate of the time-kill assay showed a total bacterial clearance and the other a bacterial regrowth after 24 h, which partially agrees with the results observed in the interaction assay. This divergence found between these replicates could be explained considering the rapid bactericidal activity of fosfomycin in contrast to our previous results showing the delayed activation of the glpT transporter, increasing the probability of the emergence of fosfomycin-resistant subpopulations as commonly observed in previous studies [1,23].
In conclusion, glycerol showed increased expression of the fosfomycin transporter glpT and a synergistic effect with fosfomycin in the interaction and disk diffusion assays. However, this molecule does not appear to be a good candidate as an adjuvant to fosfomycin therapy since the delay in the induction of glpT allows the selection of resistant subpopulations. It would therefore be necessary to perform further in vitro and in vivo studies aimed at overcoming these problems.

4. Materials and Methods

4.1. Bacterial Strains

E. coli ATCC25922 and E. coli MG1655 were used as the reference strain, and six isogenic mutants from E. coli MG1655 mutants (∆glpT,uhpT,glpT-uhpT,cyaA,glpR, and ∆glpK) were used in the assays. Isogenic mutants were generated from the KEIO collection [24] using phage P1vir transduction (Coli Genetic Stock Center [CGSC], Yale University, New Haven, CT, USA) as previously described [25].

4.2. Activation Kinetic of Fosfomycin Transporters Promoters

The activity of the fosfomycin transporter promoters glpT and uhpT was evaluated by monitoring the fluorescence accumulation in E. coli ATCC25922 and E. coli MG1655 carrying pMS201-PglpT::gfpmut2 or pMS201-PuhpT::gfpmut2 reporters, as described by Zaslaver et al. [26]. Bacterial culture fluorescence was determined after transferring overnight cultures in MHB to 96-well plates (Nunclon Delta Surface, Thermo Scientific, Waltham, MA, USA) with 200µL of MHB per well. Starting bacterial concentrations were adjusted to 5 × 10⁵ CFU/mL. The assays were carried out in Mueller Hinton Broth II (MHB) alone or supplemented with 0.45 mg/mL, 1.8 mg/mL, and 7 mg/mL of glycerol with and without G6P (Sigma-Aldrich, Madrid, Spain). Low, medium, and high glycerol physiological concentrations were assayed in combination with fosfomycin. The low glycerol concentration of 0.45 mg/mL corresponded to a target effective concentration to reduce the intracranial pressure [12]. The high glycerol concentration of 7 mg/mL corresponded to steady-state serum concentrations in patients with normal hepatic and renal function following constant intravenous infusion of 0.87 g/kg/h [27]. Finally, the medium glycerol concentration of 1.8 mg/mL was selected, corresponding to an intermediate concentration between 0.45 and 7 mg/mL in a log2 dilution scale. Green fluorescence (excited at 485 nm and measured at 540 nm) and bacterial growth (measured at 595 nm) were monitored each hour for 24 h with an Infinite200 Pro plate reader (Tecan Group AG, Männedorf, Switzerland). The assays were performed in duplicate. The OD:fluorescence ratio of the promoterless construction (pMS201-Ø::gfpmut2) was used as background for all experiments under the different growth conditions. Fluorescence was normalized to the OD, and the background was subtracted. The results were compared with ANOVA and Tukey’s multiple comparison test.

4.3. Population Analysis of Fosfomycin Transporters Promoters Induction

Flow cytometry assays were conducted to assess the population distribution of glpT and uhpT expressions (pMS201-PglpT::gfpmut2 or pMS201-PuhpT::gfpmut2 reporters) in E. coli ATCC25922 and E. coli MG1655. Furthermore, a negative expression control (pMS201-Ø::gfpmut2) and positive expression control (pMS201-PcyaA::gfpmut2) were used as described. Overnight cultures were diluted in 20 mL adjusting a bacterial concentration of 5 × 10⁵ CFU/mL. Bacterial growths were carried out in MHB, MHB supplemented with 25 mg/L of G6P, and MHB supplemented with glycerol: 0.45 mg/mL, 1.8 mg/mL, and 7 mg/mL. A milliliter sample of each condition was taken, and fluorescence was monitored at 4 and 24 h. The Beckman Coulter FC500 cytometer (Beckman Coulter, United States) was used for size (FSC) and complexity (SSC) measurements to define the bacterial population. Green fluorescence was excited using a blue laser (488 nm) and measured at 530/30 nm. The promoterless construction (pMS201-Ø::gfpmut2) was used as a negative control, and pMS201-PcyaA::gfpmut2 was used as a positive control.

4.4. Susceptibility Testing

Fosfomycin MIC was performed using the reference method, the agar dilution assay, following EUCAST standards [28]. Mueller Hinton II agar (MHA) plates (Sigma-Aldrich, Madrid, Spain), with and without 25 mg/L of G6P, with and without 7 mg/mL of glycerol. The fosfomycin (Sigma-Aldrich) concentration ranged from 0.5 to 64 mg/L. Plates were dried and incubated for 20 h at 35 °C. The assays were performed in duplicate.
Fosfomycin susceptibility was also determined using the disk diffusion method using blank antimicrobial disks loaded with 200µg of fosfomycin alone or with 50µg of G6P, following EUCAST recommendations [28]. Additionally, fosfomycin activity was assayed by supplementing MHA plates with the addition of 0.45 mg/mL, 1.8 mg/mL, and 7 mg/mL of glycerol. The diameter of the main and any other reduced inhibition zone was measured. The addition of glycerol was compared with respect to the negative control (MHA with or without G6P). The results were compared with ANOVA and Tukey’s multiple comparison test. The assays were performed in triplicate.

4.5. Fosfomycin and Glycerol Interaction Assay

The interaction between fosfomycin and glycerol was studied using the checkerboard assay in duplicate. Briefly, the interaction assay was performed with an inoculum of 5 × 10⁵ CFU/mL in 96-well plates with a final volume of 200 µL per well. Assays were performed with MHB with and without 25 mg/L G6P. Fosfomycin concentrations ranged from 0.125 to 128 mg/L, and glycerol concentrations from 0.45 to28.8 mg/mL. Wells without fosfomycin or glycerol were used as single-drug assays or growth controls. Bacterial densities were quantified spectrophotometrically by measuring optical density at 595 nm using an Infinite200 Pro plate reader. Bacterial viability was calculated as the ratio of the final bacterial OD to the final bacterial OD of the control growth well (without drug). A four-parameter log-logistic model was fitted to the data to generate dose–response curves for fosfomycin and glycerol. The degree of drug synergy across the entire dose–response matrix was analyzed using the response surface model, zero interaction potential (ZIP) [29]. The ZIP model assumes that two noninteracting drugs are expected to incur minimal changes in their dose–response curves. A delta score was calculated to quantify the deviation from the expectation of ZIP for a given dose pair and used the average delta over a dose–response matrix as a summary interaction score for a drug combination. Model construction and synergy studies were performed with the Synergyfinder package for R [29]. A synergy score of <−10 was considered antagonistic, a range from −10 to 10 as additive, and >10 as synergistic.

4.6. Fosfomycin and Glycerol Time-Kill Assays

Time-kill assays were performed in duplicate using fosfomycin concentrations of 0 (as growth control), 64, and 307 mg/L with and without 25 mg/L G6P, with and without 0.45 and 7 mg/mL of glycerol. The activity of fosfomycin alone at concentrations of 64 mg/L (lowest concentrations of fosfomycin in the non-susceptible category according to EUCAST breakpoints) and at 307 mg/L (mean maximum plasma concentrations in humans at steady-state after a dose of fosfomycin 8 g/Q8h), respectively, was determined [28,30].
Briefly, isolated colonies overnight of each strain were used to prepare the pre-inoculum in MHB and incubated overnight with shaking at 37 °C. The starting inoculum was set at 5 × 10⁵ CFU/mL in a final volume of 20 mL, and bacterial cultures were incubated at 37 °C with shaking. The number of viable CFUs was determined at 0, 2, 4, 8, and 24 h by serial dilution, followed by plating on MH agar plates with or without 64 mg/L fosfomycin and 25 mg/L G6P. The number of colonies was counted after 24 h of incubation.

Supplementary Materials

The following supporting information can be downloaded at: https://www.mdpi.com/article/10.3390/antibiotics11111612/s1, Figure S1: Assay of promoter activities in response to glycerol (GLY) and glucose-6-phosphate (G6P). Time-course quantification of GFP expression as a measure of induction of the glpT and uhpT genes in the ATCC25922 and MG1655 strains after 4, 12, and 24 h of exposure. The data were normalized to promoterless strains. Error bars represent standard deviations. Concentrations of glycerol (Gly) of 0.45, 1.8, and 7 mg/mL and glucose-6-phosphate (G6P) of 25 mg/L were used as inductors; Figure S2: Interaction assay of fosfomycin in combination with glycerol against Escherichia coli ATCC25922 and MG1655 strains, represented as heat maps. The red and green areas represent synergy and antagonism, respectively. The white rectangles show the maximum synergistic area. The concentration–response curves for fosfomycin and glycerol alone are found on the left side of each heatmap. Figure S3: Time-kill assays of fosfomycin alone and in combination with glycerol (0.45 and 7 mg/L) and/or glucose-6-phosphate (G6P, 25 mg/L) against E. coli wild-type E. coli MG1655 mutant derivative strains (∆glpT-uhpT,cyaA,glpR, and ∆glpK), at 0, 2, 4, 8, and 24 h. Bacterial concentrations (CFU/mL) are represented as symbols for mean and range.

Author Contributions

Conceptualization: M.O.-P., I.P.-C. and F.D.-P.; methodology: M.O.-P., J.M.R.-M. and F.D.-P.; validation: M.O.-P., I.P.-C. and F.D.-P.; formal analysis: M.O.-P. and F.D.-P.; investigation: M.O.-P. and A.V.-E.; resources: Á.P., J.M.R.-M. and F.D.-P.; writing-original draft preparation: M.O.-P. and F.D.-P.; writing—review and editing: M.O.-P., I.P.-C., J.R.-B. and F.D.-P.; visualization: M.O.-P. and F.D.-P.; supervision: Á.P., J.M.R.-M. and F.D.-P.; project administration: J.M.R.-M. and F.D.-P.; funding acquisition: J.R.-B., Á.P., and F.D.-P. All authors have read and agreed to the published version of the manuscript.

Funding

This study has been funded by Instituto de Salud Carlos III through the projects PI19/01645 and REIPI RD16/0016/0001 (co-funded by European Regional Development Fund “Away to Make Europe”). Miriam Ortiz-Padilla is supported by a PFIS grant from the Instituto de Salud Carlos III (FI17/00235). Inés Portillo-Calderón is supported by a Rio Hortega grant from the Instituto de Salud Carlos III (CM20/0092). (Co-funded by European Social Fund “Investing in your future”). The funders had no role in the design, collection of data, analysis, and writing of the manuscript or the decision to publish.

Institutional Review Board Statement

Not applicable.

Informed Consent Statement

Not applicable.

Data Availability Statement

The datasets used and/or analyzed during the current study are available from the corresponding author upon reasonable request.

Acknowledgments

This study was presented in part at ECCMID 2022, Lisbon, Portugal (Poster Presentation P0794).

Conflicts of Interest

The authors declare no conflict of interest.

References

  1. Ballestero-Téllez, M.; Docobo-Pérez, F.; Portillo-Calderón, I.; Rodríguez-Martínez, J.M.; Racero, L.; Ramos-Guelfo, M.S.; Blázquez, J.; Rodríguez-Baño, J.; Pascual, A. Molecular insights into fosfomycin resistance in Escherichia coli. J. Antimicrob. Chemother. 2017, 72, 1303–1309. [Google Scholar] [CrossRef] [Green Version]
  2. Prestinaci, F.; Pezzotti, P.; Pantosti, A. Antimicrobial resistance: A global multifaceted phenomenon. Pathog Glob Health 2015, 109, 309–318. [Google Scholar] [CrossRef] [PubMed] [Green Version]
  3. Cassini, A.; Högberg, L.D.; Plachouras, D.; Quattrocchi, A.; Hoxha, A.; Simonsen, G.S.; Colomb-Cotinat, M.; Kretzschmar, M.E.; Devleesschauwer, B.; Cecchini, M.; et al. Attributable deaths and disability-adjusted life-years caused by infections with antibiotic-resistant bacteria in the EU and the European Economic Area in 2015: A population-level modelling analysis. Lancet Infect. Dis. 2019, 19, 56–66. [Google Scholar] [CrossRef] [Green Version]
  4. Docobo-Pérez, F.; Drusano, G.L.; Johnson, A.; Goodwin, J.; Whalley, S.; Ramos-Martín, V.; Ballestero-Tellez, M.; Rodriguez-Martinez, J.M.; Conejo, M.C.; van Guilder, M.; et al. Pharmacodynamics of fosfomycin: Insights into clinical use for antimicrobial resistance. Antimicrob. Agents Chemother. 2015, 59, 5602–5610. [Google Scholar] [CrossRef] [PubMed] [Green Version]
  5. Falagas, M.E.; Maraki, S.; Karageorgopoulos, D.E.; Kastoris, A.C.; Mavromanolakis, E.; Samonis, G. Antimicrobial susceptibility of multidrug-resistant (MDR) and extensively drug-resistant (XDR) Enterobacteriaceae isolates to fosfomycin. Int. J. Antimicrob. Agents 2010, 35, 240–243. [Google Scholar] [CrossRef] [Green Version]
  6. Marger, M.D.; Saier, M.H.J. A major superfamily of transmembrane facilitators that catalyse uniport, symport and antiport. Trends Biochem. Sci. 1993, 18, 13–20. [Google Scholar] [CrossRef]
  7. Franchini, A.G.; Ihssen, J.; Egli, T. Effect of Global Regulators RpoS and Cyclic-AMP/CRP on the Catabolome and Transcriptome of Escherichia coli K12 during Carbon- and Energy-Limited Growth. PLoS ONE 2015, 10, e0133793. [Google Scholar] [CrossRef] [Green Version]
  8. Sakamoto, Y.; Furukawa, S.; Ogihara, H.; Yamasaki, M. Fosmidomycin resistance in adenylate cyclase deficient (cya) mutants of Escherichia coli. Biosci. Biotechnol. Biochem. 2003, 67, 2030–2033. [Google Scholar] [CrossRef] [Green Version]
  9. Kadner, R.J.; Shattuck-Eidens, D.M. Genetic control of the hexose phosphate transport system of Escherichia coli: Mapping of deletion and insertion mutations in the uhp region. J. Bacteriol. 1983, 155, 1052–1061. [Google Scholar] [CrossRef] [PubMed] [Green Version]
  10. Yang, B.; Gerhardt, S.G.; Larson, T.J. Action at a distance for glp repressor control of glpTQ transcription in Escherichia coli K-12. Mol. Microbiol. 1997, 24, 511–521. [Google Scholar] [CrossRef]
  11. Santoro, A.; Cappello, A.R.; Madeo, M.; Martello, E.; Iacopetta, D.; Dolce, V. Interaction of fosfomycin with the Glycerol 3-phosphate Transporter of Escherichia coli. Biochim. Biophys. Acta (BBA)-Gen. Subj. 2011, 1810, 1323–1329. [Google Scholar] [CrossRef] [PubMed]
  12. Frank, M.S.; Nahata, M.C.; Hilty, M.D. Glycerol: A review of its pharmacology, pharmacokinetics, adverse reactions, and clinical use. Pharmacotherapy 1981, 1, 147–160. [Google Scholar] [CrossRef] [PubMed]
  13. Lin, E.C. Glycerol dissimilation and its regulation in bacteria. Annu. Rev. Microbiol. 1976, 30, 535–578. [Google Scholar] [CrossRef]
  14. Nikel, P.I.; Romero-Campero, F.J.; Zeidman, J.A.; Goñi-Moreno, Á.; de Lorenzo, V. The glycerol-dependent metabolic persistence of Pseudomonas putida KT2440 reflects the regulatory logic of the GlpR repressor. MBio 2015, 6, e00340-15. [Google Scholar] [CrossRef] [PubMed] [Green Version]
  15. Koch, J.P.; Hayashi, S.; Lin, E.C. The Control of Dissimilation of Glycerol and L-α-Glycerophosphate in Escherichia coli. J. Biol. Chem. 1964, 239, 3106–3108. [Google Scholar] [CrossRef]
  16. Martínez-Gómez, K.; Flores, N.; Castañeda, H.M.; Martínez-Batallar, G.; Hernández-Chávez, G.; Ramírez, O.T.; Gosset, G.; Encarnación, S.; Bolivar, F. New insights into Escherichia coli metabolism: Carbon scavenging, acetate metabolism and carbon recycling responses during growth on glycerol. Microb. Cell Factories 2012, 11, 46. [Google Scholar] [CrossRef] [Green Version]
  17. Nikel, P.I.; Kim, J.; de Lorenzo, V. Metabolic and regulatory rearrangements underlying glycerol metabolism in Pseudomonas putidaKT2440. Environ. Microbiol. 2014, 16, 239–254. [Google Scholar] [CrossRef] [Green Version]
  18. Castañeda-García, A.; Rodríguez-Rojas, A.; Guelfo, J.R.; Blázquez, J. The Glycerol-3-Phosphate Permease GlpT Is the Only Fosfomycin Transporter in Pseudomonas aeruginosa. J. Bacteriol. 2009, 191, 6968–6974. [Google Scholar] [CrossRef] [Green Version]
  19. Edgar, J.R.; Bell, R.M. Biosynthesis in Escherichia coli of sn-glycerol-3-phosphate, a precursor of phospholipid. Further kinetic characterization of wild type and feedback-resistant forms of the biosynthetic sn-glycerol-3-phosphate dehydrogenase. J. Biol. Chem. 1980, 255, 3492–3497. [Google Scholar] [CrossRef]
  20. Castañeda-García, A.; Blázquez, J.; Rodríguez-Rojas, A. Molecular mechanisms and clinical impact of acquired and intrinsic fosfomycin resistance. Antibiotics 2013, 2, 217–236. [Google Scholar] [CrossRef]
  21. Ballestero-Téllez, M.; Docobo-Pérez, F.; Rodríguez-Martínez, J.; Conejo, M.; Ramos-Guelfo, M.; Blázquez, J.; Rodríguez-Baño, J.; Pascual, A. Role of inoculum and mutant frequency on fosfomycin MIC discrepancies by agar dilution and broth microdilution methods in Enterobacteriaceae. Clin. Microbiol. Infect. 2017, 23, 325–331. [Google Scholar] [CrossRef] [Green Version]
  22. Portillo-Calderón, I.; Ortiz-Padilla, M.; Rodríguez-Martínez, J.M.; De Gregorio-Iaria, B.; Blázquez, J.; Rodríguez-Baño, J.; Pascual, A.; Docobo-Pérez, F. Contribution of hypermutation to fosfomycin heteroresistance in Escherichia coli. J. Antimicrob. Chemother. 2020, 75, 2066–2075. [Google Scholar] [CrossRef]
  23. Portillo-Calderón, I.; Ortiz-Padilla, M.; de Gregorio-Iaria, B.; Merino-Bohorquez, V.; Blázquez, J.; Rodríguez-Baño, J.; Rodríguez-Martínez, J.M.; Pascual, A.; Docobo-Pérez, F. Activity of fosfomycin and amikacin against fosfomycin-heteroresistant Escherichia coli strains in a hollow-fiber infection model. Antimicrob. Agents Chemother. 2021, 65, e02213-20. [Google Scholar] [CrossRef]
  24. Baba, T.; Ara, T.; Hasegawa, M.; Takai, Y.; Okumura, Y.; Baba, M.; Datsenko, K.A.; Tomita, M.; Wanner, B.L.; Mori, H. Construction of Escherichia coli K-12 in-frame, single-gene knockout mutants: The Keio collection. Mol. Syst. Biol. 2006, 2, 2006.0008. [Google Scholar] [CrossRef] [PubMed] [Green Version]
  25. Thomason, L.C.; Costantino, N.; Court, D.L. E. coli genome manipulation by P1 transduction. Curr. Protoc. Mol. Biol. 2007, 79, 1.17.1–1.17.8. [Google Scholar] [CrossRef]
  26. Zaslaver, A.; Bren, A.; Ronen, M.; Itzkovitz, S.; Kikoin, I.; Shavit, S.; Liebermeister, W.; Surette, M.G.; Alon, U. A comprehensive library of fluorescent transcriptional reporters for Escherichia coli. Nat. Methods 2006, 3, 623–628. [Google Scholar] [CrossRef] [PubMed]
  27. Snyder, J.; Powner, D.; Grenvik, A. Neurologic intensive care. In Anesthesia and Neurosurgery; Cottrell, J., Turndorf, H., Eds.; Mosby: Maryland Heights, MI, USA, 1980; pp. 322–360. [Google Scholar]
  28. The European Committee on Antimicrobial Susceptibility Testing. Breakpoint Tables for Interpretation of MICs and Zone Diameters. Version 12.0. 2022. Available online: http://www.eucast.org (accessed on 21 May 2022).
  29. Yadav, B.; Wennerberg, K.; Aittokallio, T.; Tang, J. Searching for Drug Synergy in Complex Dose–Response Landscapes Using an Interaction Potency Model. Comput. Struct. Biotechnol. J. 2015, 13, 504–513. [Google Scholar] [CrossRef] [PubMed] [Green Version]
  30. Pfausler, B. Concentrations of fosfomycin in the cerebrospinal fluid of neurointensive care patients with ventriculostomy-associated ventriculitis. J. Antimicrob. Chemother. 2004, 53, 848–852. [Google Scholar] [CrossRef] [PubMed]
Figure 1. Induction of the glpT and uhpT genes in the ATCC25922 and MG1655 strains. Fold induction is GFP fluorescence after 4, 12, and 24 h of exposure, normalized to promoterless strains. Error bars represent standard deviation. Significant p-values compared to their corresponding (*: p < 0.05; **: p < 0.01; ***: p < 0.001; ****: p < 0.0001).
Antibiotics 11 01612 g001
Figure 2. Transcriptional analysis of glpT, uhpT, and cyaA expression in E. coli ATCC25922 and E. coli MG1655 at 4 h and 24 h. GFP fluorescence in E. coli cells carrying the transcriptional fusions (PglpT-gfp, PuhpT-gfp, and PcyaA-gfp) and grown in MHB alone or supplemented with glucose-6-phosphate (G6P) or glycerol (GLY). The red and yellow areas identify the regions considered negative and positive for the fluorescence signal, respectively (as assessed with cells carrying the empty pMS201vector or with Pcya-gfp fusion).
Antibiotics 11 01612 g002
Figure 3. Results of fosfomycin susceptibility by disk diffusion assay with the addition of 0.45, 1.8, and 7 mg/L of glycerol and/or 25 mg/L of glucose-6-phosphate (G6P). The dark-colored columns show the diameter of the main inhibition zone (mean, mm), and the light-colored columns show the diameter of the reduced inhibition zone (mean, mm). Error bars represent the standard deviation. * denotes p < 0.05 with respect to their respective control.
Antibiotics 11 01612 g003
Figure 4. Time-kill assays of fosfomycin alone and in combination with glycerol (0.45 and 7 mg/L) and/or glucose-6-phosphate (G6P, 25 mg/L) against E. coli wild-type E. coli ATCC25922 and E. coli MG1655 wild-type and mutant derivative strains (∆glpT and ∆uhpT), at 0, 2, 4, 8, and 24 h. Bacterial concentrations (CFU/mL) are represented as symbols for mean and range.
Antibiotics 11 01612 g004
Table 1. Fosfomycin MIC (mg/L) results by agar dilution without and with 7 mg/mL of glycerol and 25 mg/L of glucose-6-phosphate (G6P).
Fosfomycin MIC (mg/L)
No GlycerolGlycerol 7 mg/L
No G6PG6P 25 mg/LNo G6PG6P 25 mg/L
E. coliATCC25922>642642
E. coliMG1655Wild-type642322
ΔglpT>642>642
ΔuhpT>64>64>64>64
ΔcyaA>644>642
ΔglpR4121
ΔglpK>644324
ΔglpT-uhpT>64>64>64>64
Table 2. ZIP synergy scores for the combination of fosfomycin with glycerol, with and without glucose-6-phosphate (G6P). Green and red colors show synergistic and antagonistic results, respectively.
ZIP SYNERGY SCOREATCC25922MG1655
Wild-TypeΔglpTΔuhpTΔglpT-uhpTΔcyaAΔglpRΔglpK
Fosfomycin
+ Glycerol
16.4 ± 1.216.5 ± 1.92.5 ± 4.811.3 ± 2.9−12.8 ± 5.4−0.7 ± 6.42.7 ± 1.61.7 ± 1.9
Fosfomycin
+ Glycerol
+ G6P
6.8 ± 1.95.8 ± 2.66.9 ± 4.312.4 ± 3.6−21 ± 3.81.8 ± 6.66.1 ± 1.62.7 ± 3.7
Publisher’s Note: MDPI stays neutral with regard to jurisdictional claims in published maps and institutional affiliations.

