Complete Prevention of Bubbles in a PDMS-Based Digital PCR Chip with a Multifunction Cavity

 , , , , and
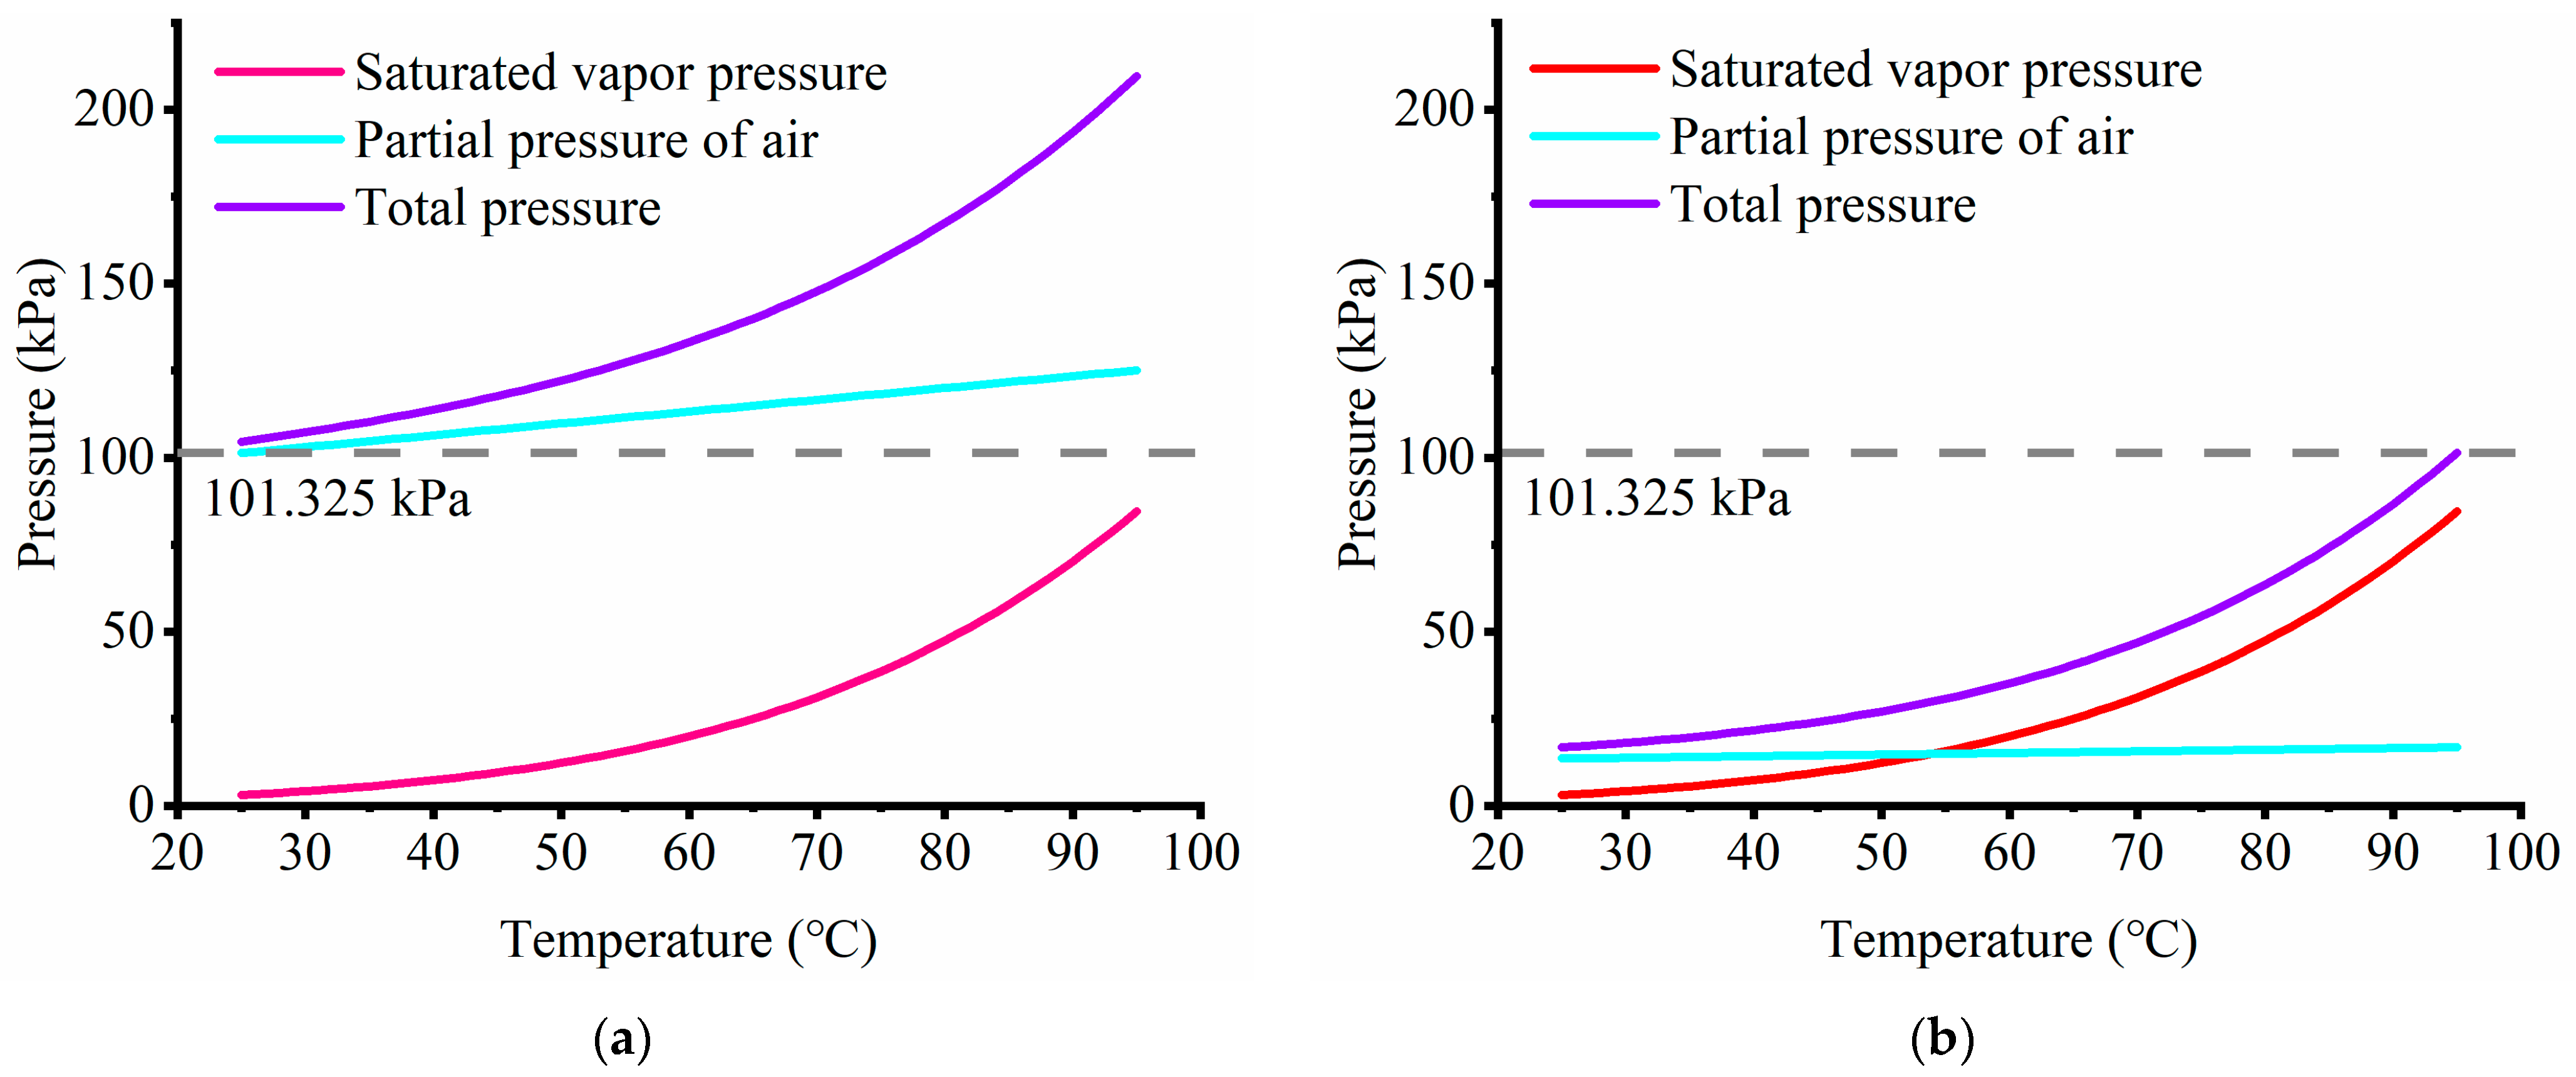
Abstract
:1. Introduction
2. Mechanism Analysis for Bubble Generation
3. Design and Modeling
3.1. Chip Design and Principle
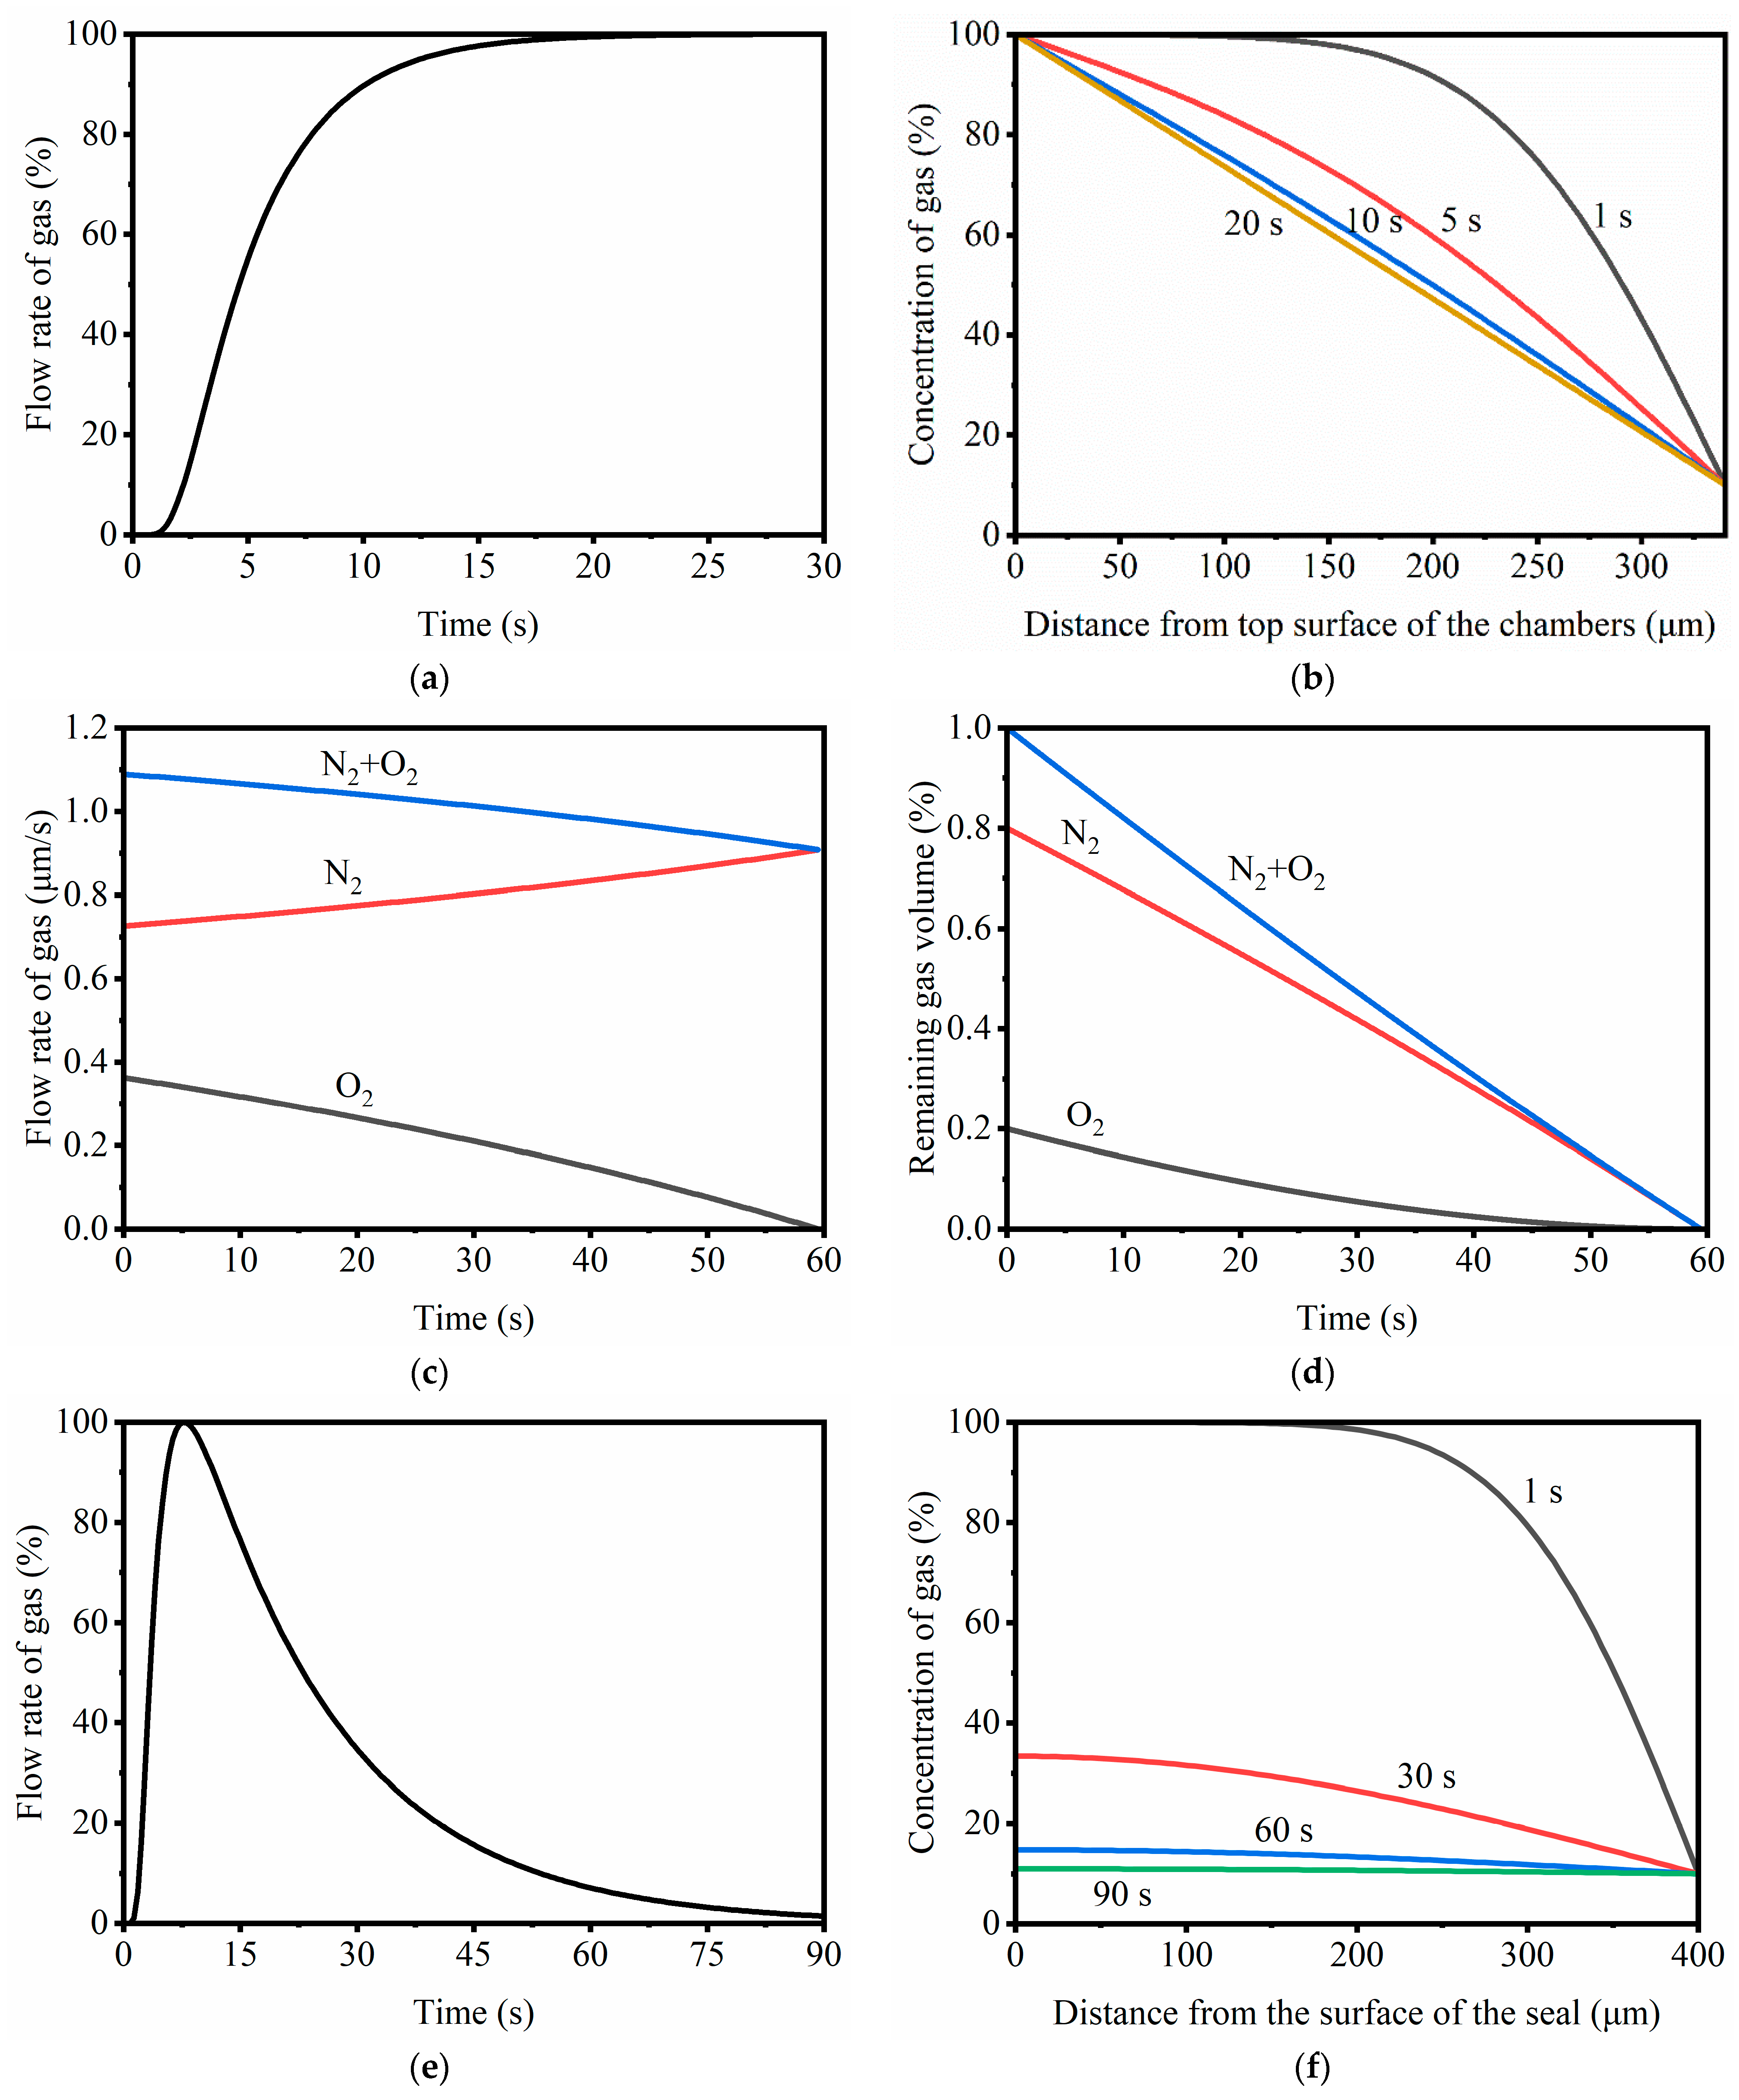
3.2. Chamber Filling and System Degassing Analysis

3.3. Stability of the PCR Solution Compensated for with the Water Cavity
4. Experiment
4.1. Chip Fabrication
4.2. Temperature Control Instruments for Real-Time Observation under Microscope
4.3. PCR Reaction
4.4. Data Acquisition and Analysis
5. Results and Discussion
5.1. Fast and Simple Sample Loading and Partition
5.2. Water Loss and Bubble Formation of the Chip in the Thermal Reaction
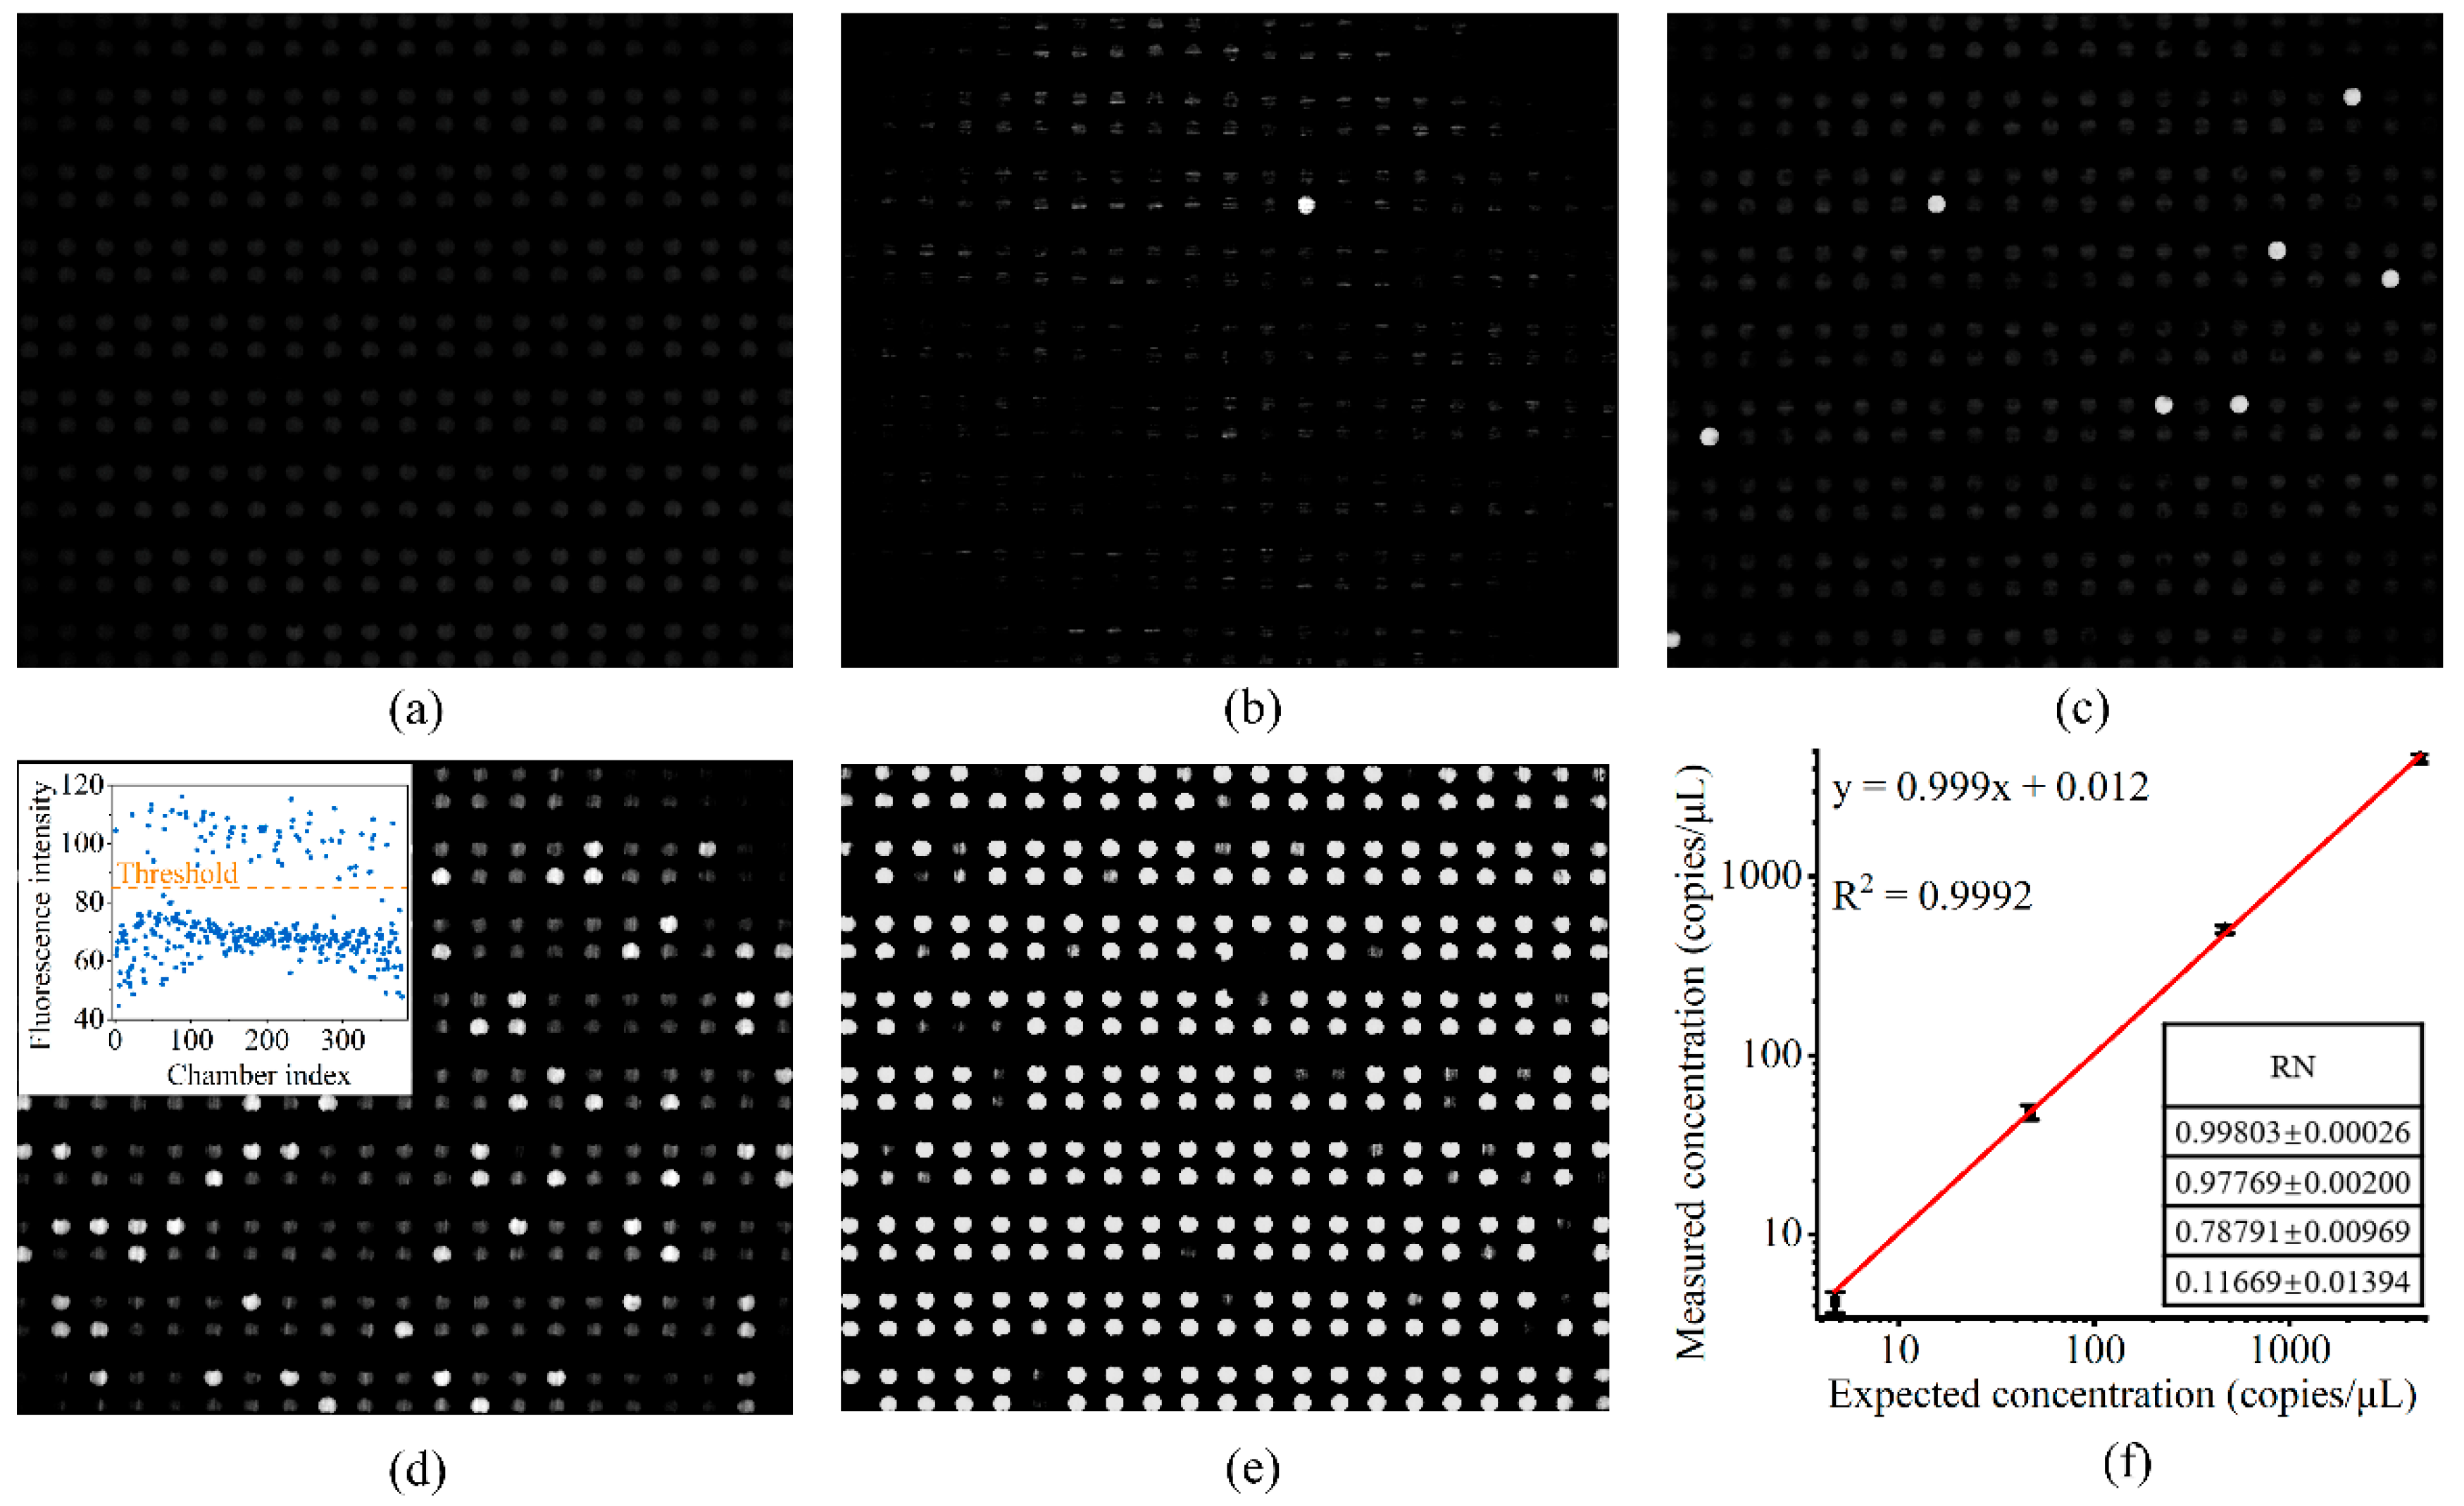
5.3. Digital PCR with the Chip
6. Conclusions
Supplementary Materials
Author Contributions
Funding
Institutional Review Board Statement
Informed Consent Statement
Data Availability Statement
Conflicts of Interest
References
- Saiki, R.K.; Scharf, S.; Faloona, F.; Mullis, K.B.; Horn, G.T.; Erlich, H.A.; Arnheim, N. Enzymatic Amplification of β-Globin Genomic Sequences and Restriction Site Analysis for Diagnosis of Sickle Cell Anemia. Science 1985, 230, 1350–1354. [Google Scholar] [CrossRef] [PubMed]
- Toriello, N.M.; Liu, C.N.; Mathies, R.A. Multichannel reverse transcription-polymerase chain reaction microdevice for rapid gene expression and biomarker analysis. Anal. Chem. 2006, 78, 7997–8003. [Google Scholar] [CrossRef] [PubMed]
- Rajagopal, A.; Yurk, D.; Shin, C.; Menge, K.; Jacky, L.; Fraser, S.; Tombrello, T.A.; Tsongalis, G.J. Significant Expansion of Real-Time PCR Multiplexing with Traditional Chemistries using Amplitude Modulation. Sci. Rep. 2019, 9, 1053. [Google Scholar] [CrossRef] [PubMed]
- Green, M.R.; Sambrook, J. Nested Polymerase Chain Reaction (PCR). Cold Spring Harb. Protoc. 2019, 2019, pdb-prot095182. [Google Scholar] [CrossRef]
- Heid, C.A.; Stevens, J.; Livak, K.J.; Williams, P.M. Real time quantitative PCR. Genome Res. 1996, 6, 986–994. [Google Scholar] [CrossRef] [PubMed]
- Ahrberg, C.D.; Manz, A.; Chung, B.G. Polymerase chain reaction in microfluidic devices. Lab. Chip 2016, 16, 3866–3884. [Google Scholar] [CrossRef]
- Vogelstein, B.; Kinzler, K.W. Digital PCR. Proc. Natl. Acad. Sci. USA 1999, 96, 9236–9241. [Google Scholar] [CrossRef]
- Salipante, S.J.; Jerome, K.R. Digital PCR—An Emerging Technology with Broad Applications in Microbiology. Clin. Chem. 2020, 66, 117–123. [Google Scholar] [CrossRef]
- Basu, A.S. Digital Assays Part I: Partitioning Statistics and Digital PCR. SLAS Technol. 2017, 22, 369–386. [Google Scholar] [CrossRef]
- Pattanayak, P.; Singh, S.K.; Gulati, M.; Vishwas, S.; Kapoor, B.; Chellappan, D.K.; Anand, K.; Gupta, G.; Jha, N.K.; Gupta, P.K.; et al. Microfluidic chips: Recent advances, critical strategies in design, applications and future perspectives. Microfluid. Nanofluidics 2021, 25, 99. [Google Scholar] [CrossRef]
- Sackmann, E.K.; Fulton, A.L.; Beebe, D.J. The present and future role of microfluidics in biomedical research. Nature 2014, 507, 181–189. [Google Scholar] [CrossRef]
- Sreejith, K.R.; Ooi, C.H.; Jin, J.; Dao, D.V.; Nguyen, N.-T. Digital polymerase chain reaction technology—Recent advances and future perspectives. Lab. A Chip 2018, 18, 3717–3732. [Google Scholar] [CrossRef]
- Heyries, K.A.; Tropini, C.; Vaninsberghe, M.; Doolin, C.; Petriv, O.I.; Singhal, A.; Leung, K.; Hughesman, C.B.; Hansen, C.L. Megapixel digital PCR. Nat. Methods 2011, 8, 649–651. [Google Scholar] [CrossRef]
- Miranda, I.; Souza, A.; Sousa, P.; Ribeiro, J.; Castanheira, E.M.S.; Lima, R.; Minas, G. Properties and Applications of PDMS for Biomedical Engineering: A Review. J. Funct. Biomater. 2021, 13, 2. [Google Scholar] [CrossRef] [PubMed]
- McDonald, J.C.; Whitesides, G.M. Poly(dimethylsiloxane) as a Material for Fabricating Microfluidic Devices. Acc. Chem. Res. 2002, 35, 491–499. [Google Scholar] [CrossRef] [PubMed]
- Tian, Q.; Yu, B.; Mu, Y.; Xu, Y.; Ma, C.; Zhang, T.; Jin, W.; Jin, Q. An integrated temporary negative pressure assisted microfluidic chip for DNA isolation and digital PCR detection. RSC Adv. 2015, 5, 81889–81896. [Google Scholar] [CrossRef]
- Zhou, X.; Ravichandran, G.C.; Zhang, P.; Yang, Y.; Zeng, Y. A microfluidic alternating-pull–push active digitization method for sample-loss-free digital PCR. Lab. A Chip 2019, 19, 4104–4116. [Google Scholar] [CrossRef] [PubMed]
- Ning, Y.; Cui, X.; Yang, C.; Jing, F.; Bian, X.; Yi, L.; Li, G. A self-digitization chip integrated with hydration layer for low-cost and robust digital PCR. Anal. Chim. Acta 2019, 1055, 65–73. [Google Scholar] [CrossRef] [PubMed]
- Xu, G.; Si, H.; Jing, F.; Sun, P.; Wu, D. A Self-Priming Microfluidic Chip with Cushion Chambers for Easy Digital PCR. Biosensors 2021, 11, 158. [Google Scholar] [CrossRef] [PubMed]
- Lee, S.H.; Song, J.; Cho, B.; Hong, S.; Hoxha, O.; Kang, T.; Kim, D.; Lee, L.P. Bubble-free rapid microfluidic PCR. Biosens. Bioelectron. 2019, 126, 725–733. [Google Scholar] [CrossRef]
- Liu, H.-B.; Gong, H.-Q.; Ramalingam, N.; Jiang, Y.; Dai, C.-C.; Hui, K.M. Micro air bubble formation and its control during polymerase chain reaction (PCR) in polydimethylsiloxane (PDMS) microreactors. J. Micromech. Microeng. 2007, 17, 2055–2064. [Google Scholar] [CrossRef]
- Karlsson, J.M.; Gazin, M.; Laakso, S.; Haraldsson, T.; Malhotra-Kumar, S.; Mäki, M.; Goossens, H.; van der Wijngaart, W. Active liquid degassing in microfluidic systems. Lab. A Chip 2013, 13, 4366–4373. [Google Scholar] [CrossRef]
- Nakayama, T.; Hiep, H.M.; Furui, S.; Yonezawa, Y.; Saito, M.; Takamura, Y.; Tamiya, E. An optimal design method for preventing air bubbles in high-temperature microfluidic devices. Anal. Bioanal. Chem. 2010, 396, 457–464. [Google Scholar] [CrossRef]
- Chen, J.; Chen, D.; Xie, Y.; Chen, X.; Wang, K.; Cui, D.; Du, H.; Wang, Z. Bubble generation and mechanism in polydimethylsiloxane based polymerase chain reaction chip. Appl. Phys. Lett. 2015, 106, 053507. [Google Scholar] [CrossRef]
- Shin, Y.S.; Cho, K.; Lim, S.H.; Chung, S.; Park, S.J.; Chung, C.; Han, D.C.; Chang, J.K. PDMS-based micro PCR chip with parylene coating. J. Micromech. Microeng. 2003, 13, 768–774. [Google Scholar] [CrossRef]
- Niu, Z.Q.; Chen, W.Y.; Shao, S.Y.; Jia, X.Y.; Zhang, W.P. DNA amplification on a PDMS–glass hybrid microchip. J. Micromech. Microeng. 2006, 16, 425–433. [Google Scholar] [CrossRef]
- Zhu, Q.; Qiu, L.; Yu, B.; Xu, Y.; Gao, Y.; Pan, T.; Tian, Q.; Song, Q.; Jin, W.; Jin, Q.; et al. Digital PCR on an integrated self-priming compartmentalization chip. Lab. Chip 2014, 14, 1176–1185. [Google Scholar] [CrossRef] [PubMed]
- Xu, T.G.; Wu, L.; Wang, X.F.; Zhu, X.Y.; Bao, Y.Y.; Cai, S.R.; Li, G.; Li, X.X. A PDMS-Based Digital PCR Chip with Vacuum Aspiration and Water-Filling Cavity Integrated for Sample Loading and Evaporation Reduction. In Proceedings of the 2018 IEEE Micro Electro Mechanical Systems (MEMS), Belfast, UK, 21–25 January 2018; pp. 1142–1145. [Google Scholar]
- Ottesen, E.A.; Hong, J.W.; Quake, S.R.; Leadbetter, J.R. Microfluidic digital PCR enables multigene analysis of individual environmental bacteria. Science 2006, 314, 1464–1467. [Google Scholar] [CrossRef] [PubMed]
- Fu, Y.; Zhou, H.; Jia, C.; Jing, F.; Jin, Q.; Zhao, J.; Li, G. A microfluidic chip based on surfactant-doped polydimethylsiloxane (PDMS) in a sandwich configuration for low-cost and robust digital PCR. Sens. Actuators B Chem. 2017, 245, 414–422. [Google Scholar] [CrossRef]
- Xu, T.G.; Wu, L.; Wang, X.F.; Zhu, X.Y.; Chen, J.Z.; Yao, F.L.; Zhou, H.B.; Li, X.X. A Seal-Free Valveless Digital PCR Chip Supported with a High-Pressure Water Circulation System. In Proceedings of the 2020 IEEE 33rd International Conference on Micro Electro Mechanical Systems (MEMS), Vancouver, BC, Canada, 18–22 January 2020; pp. 1079–1082. [Google Scholar]
- Ghosal, K.; Freeman, B.D. Gas separation using polymer membranes: An overview. Polym. Adv. Technol. 2003, 5, 673–697. [Google Scholar] [CrossRef]
- Xu, L.; Lee, H.; Jetta, D.; Oh, K.W. Vacuum-driven power-free microfluidics utilizing the gas solubility or permeability of polydimethylsiloxane (PDMS). Lab. A Chip 2015, 15, 3962–3979. [Google Scholar] [CrossRef] [PubMed]


Disclaimer/Publisher’s Note: The statements, opinions and data contained in all publications are solely those of the individual author(s) and contributor(s) and not of MDPI and/or the editor(s). MDPI and/or the editor(s) disclaim responsibility for any injury to people or property resulting from any ideas, methods, instructions or products referred to in the content. |
© 2024 by the authors. Licensee MDPI, Basel, Switzerland. This article is an open access article distributed under the terms and conditions of the Creative Commons Attribution (CC BY) license (https://creativecommons.org/licenses/by/4.0/).
Share and Cite
Gao, S.; Xu, T.; Wu, L.; Zhu, X.; Wang, X.; Chen, Y.; Li, G.; Li, X. Complete Prevention of Bubbles in a PDMS-Based Digital PCR Chip with a Multifunction Cavity. Biosensors 2024, 14, 114. https://doi.org/10.3390/bios14030114
Gao S, Xu T, Wu L, Zhu X, Wang X, Chen Y, Li G, Li X. Complete Prevention of Bubbles in a PDMS-Based Digital PCR Chip with a Multifunction Cavity. Biosensors. 2024; 14(3):114. https://doi.org/10.3390/bios14030114
Chicago/Turabian StyleGao, Shiyuan, Tiegang Xu, Lei Wu, Xiaoyue Zhu, Xuefeng Wang, Ying Chen, Gang Li, and Xinxin Li. 2024. "Complete Prevention of Bubbles in a PDMS-Based Digital PCR Chip with a Multifunction Cavity" Biosensors 14, no. 3: 114. https://doi.org/10.3390/bios14030114