Electrochemical Aptasensing Platform for the Detection of Retinol Binding Protein-4

 , and
, and
Abstract
:1. Introduction
2. Materials and Methods
2.1. Chemicals
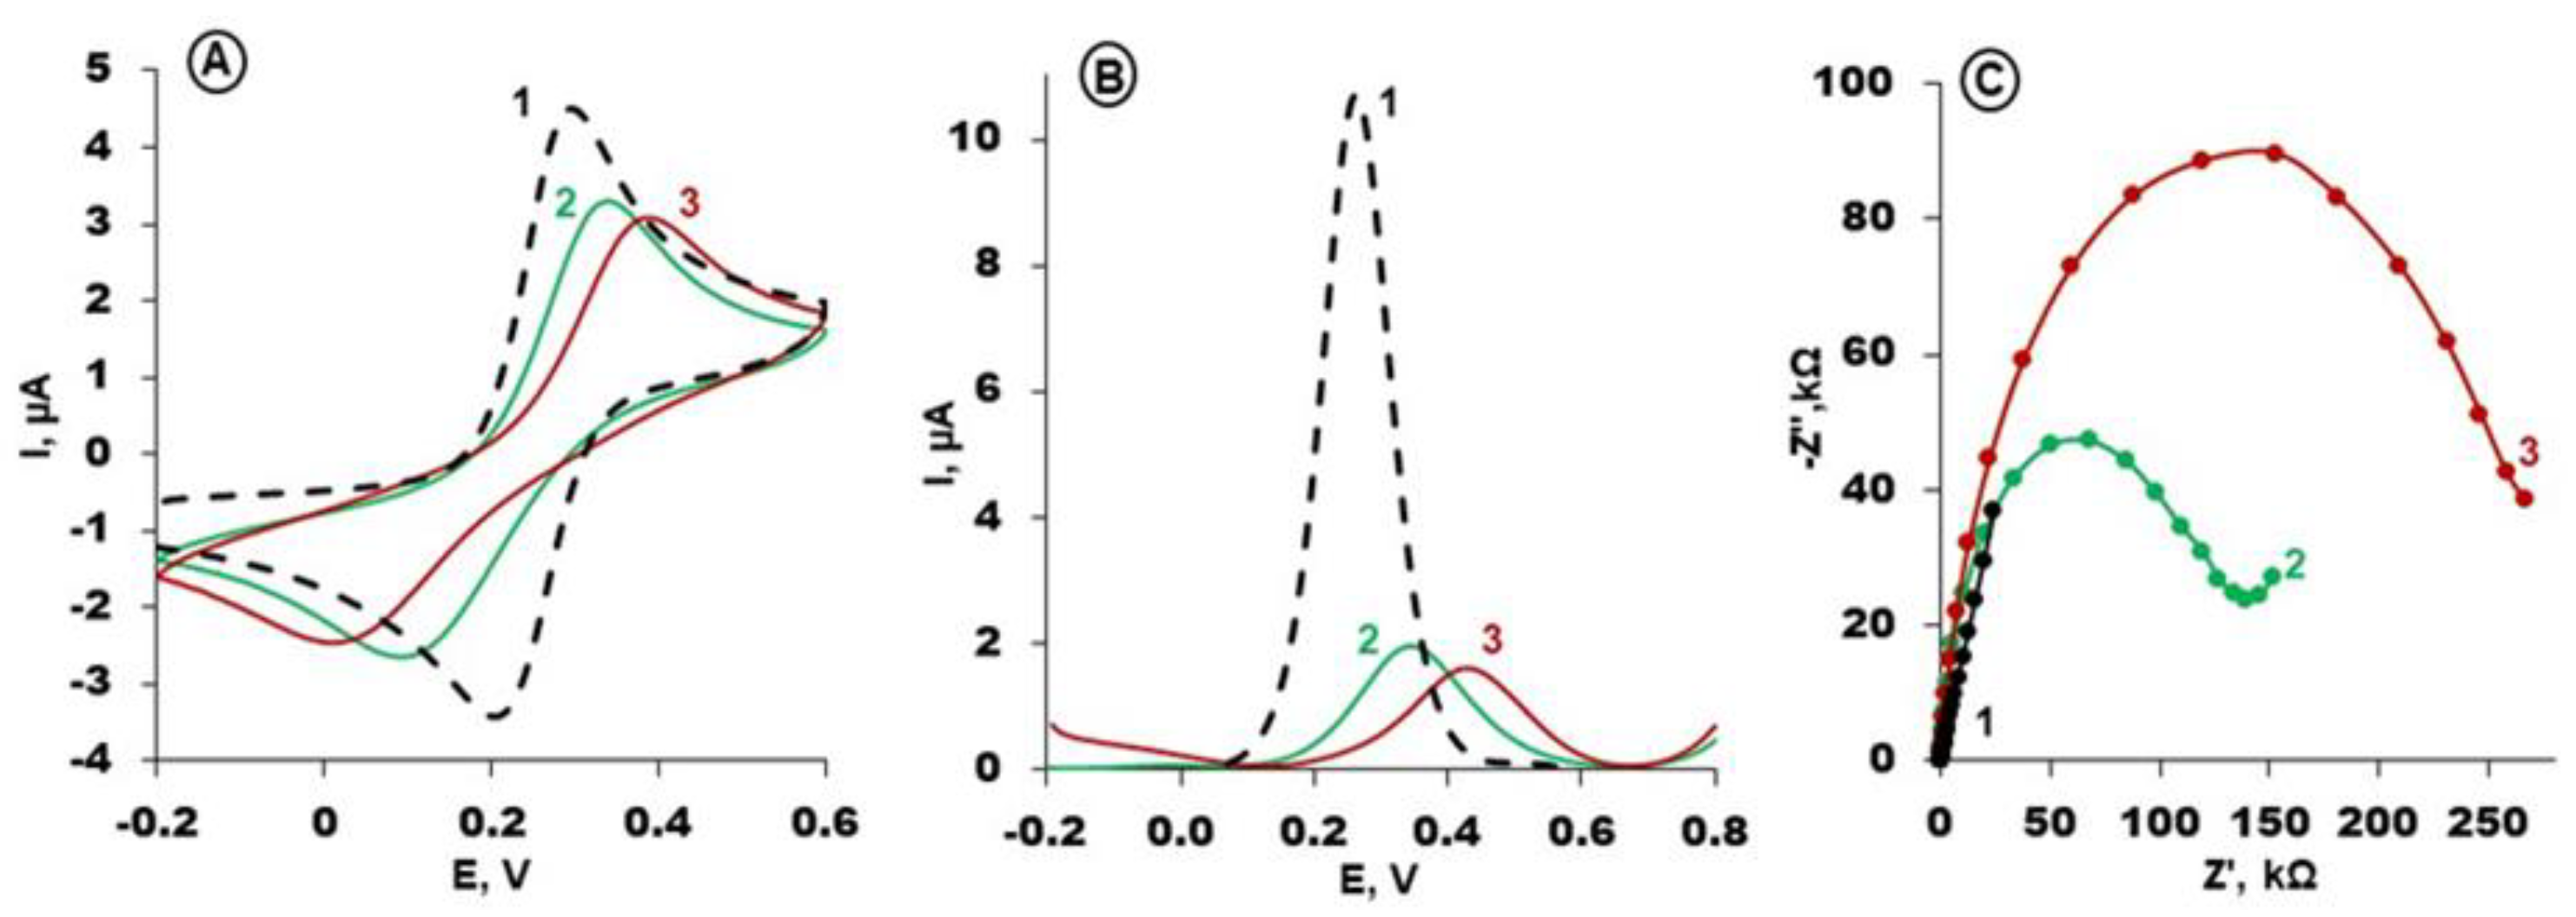
2.2. Electrochemical Measurements
- ΔE = (En − E0)/E0 × 100%;
- ΔI = (In − I0)/I0 × 100%;
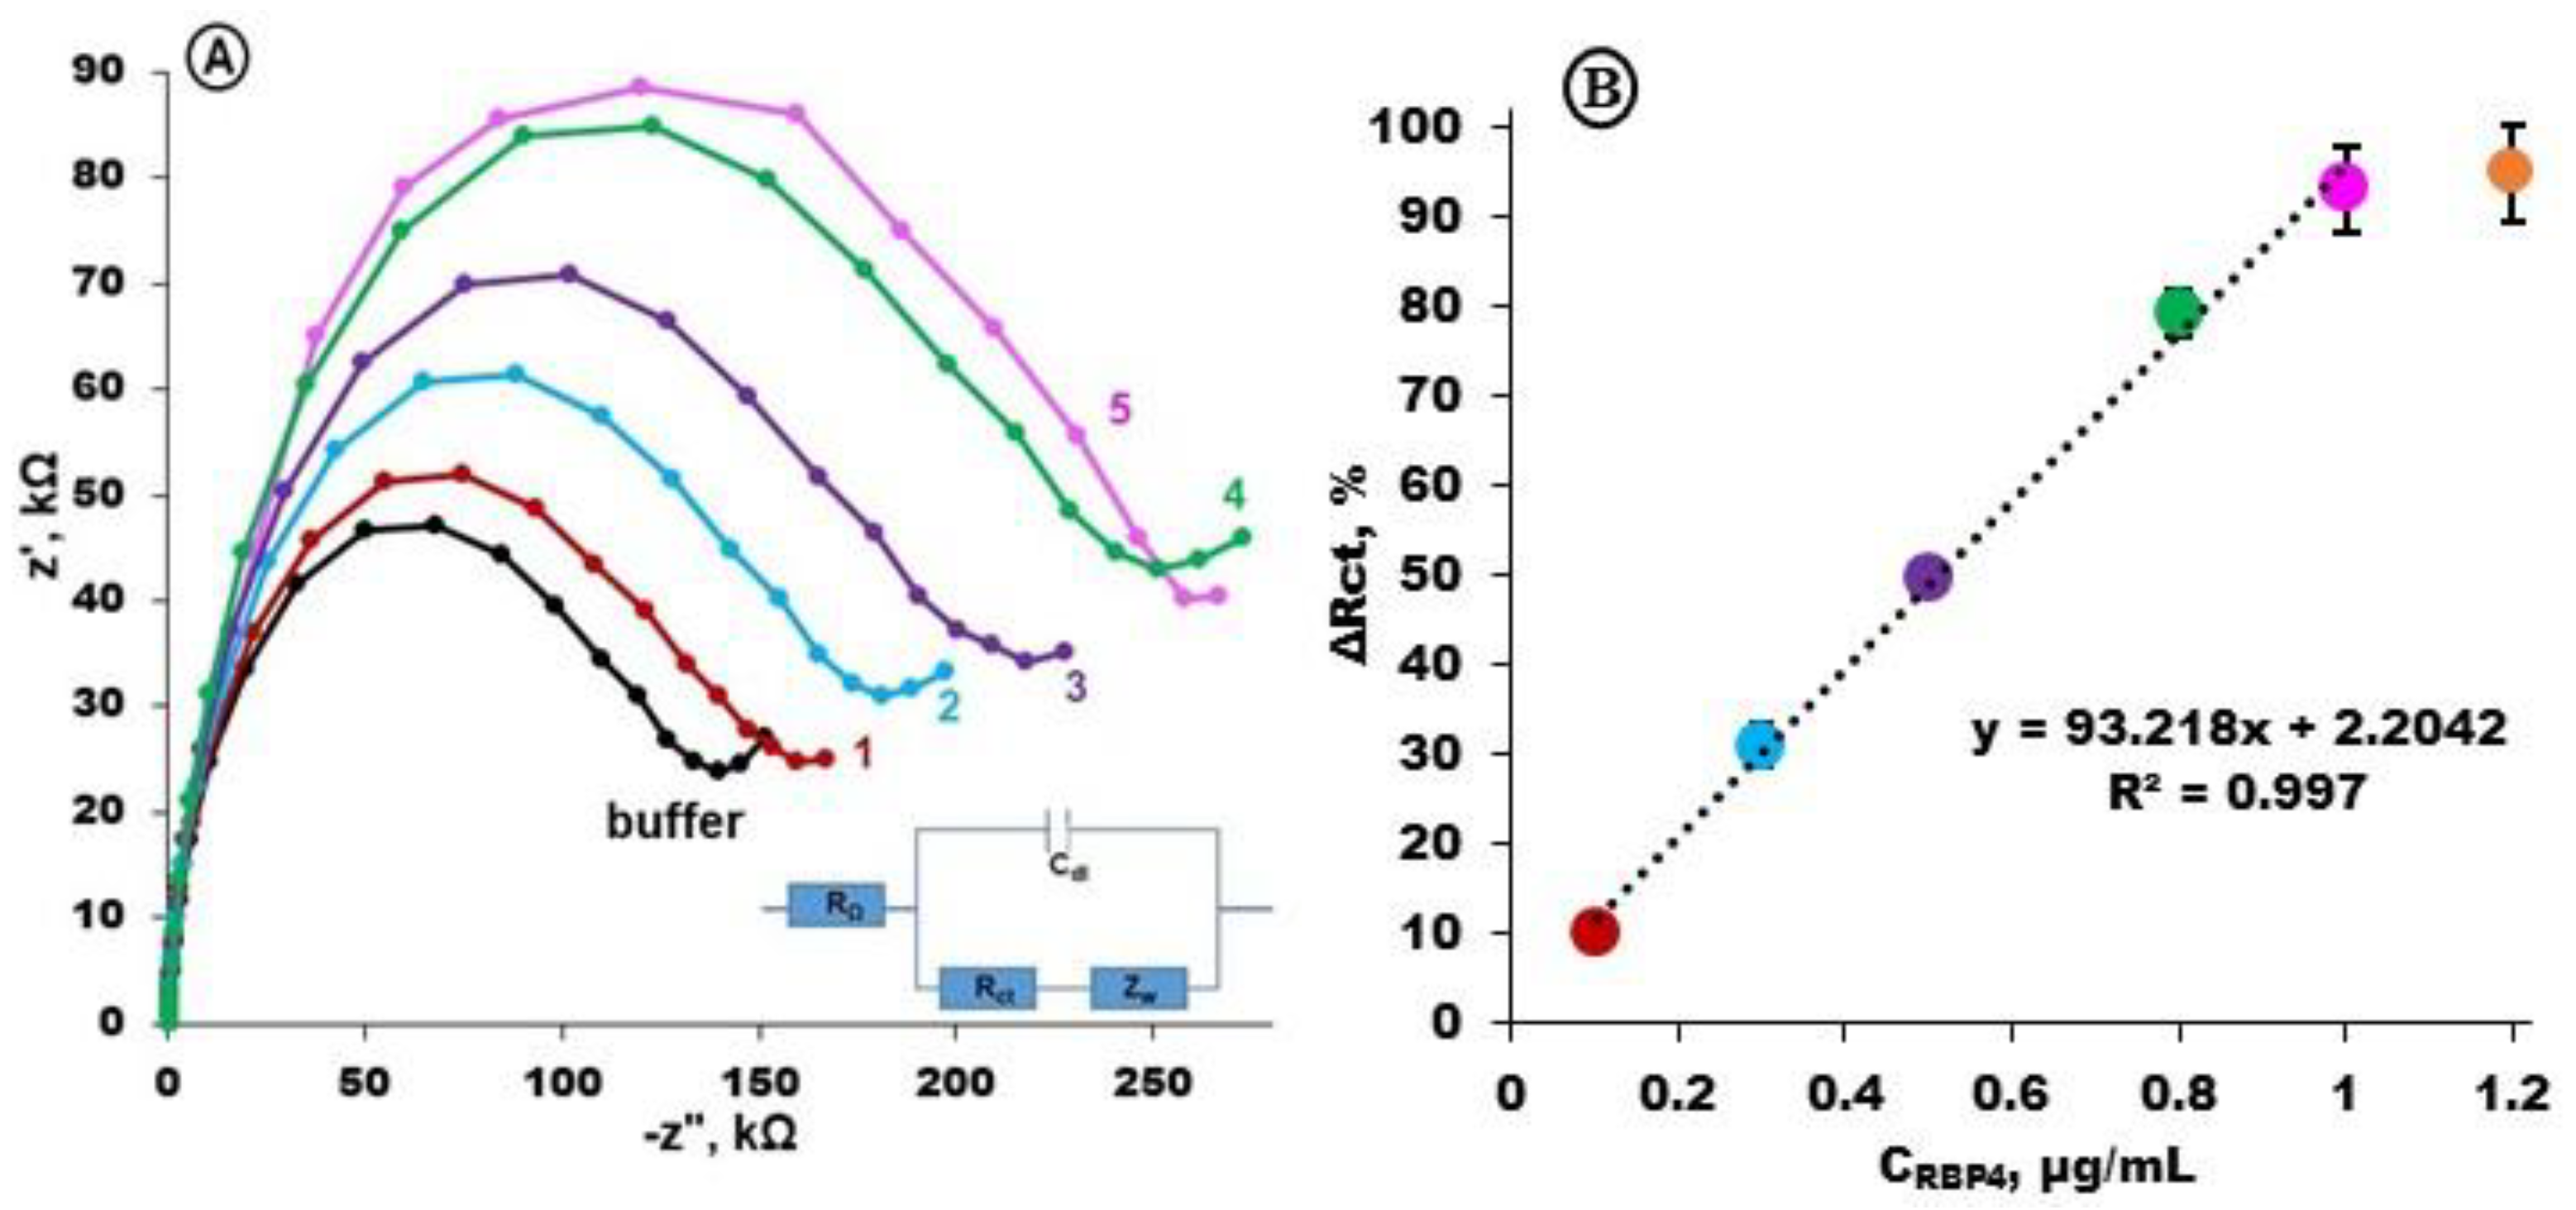
- ΔR = (Rn − R0)/R0 × 100%;
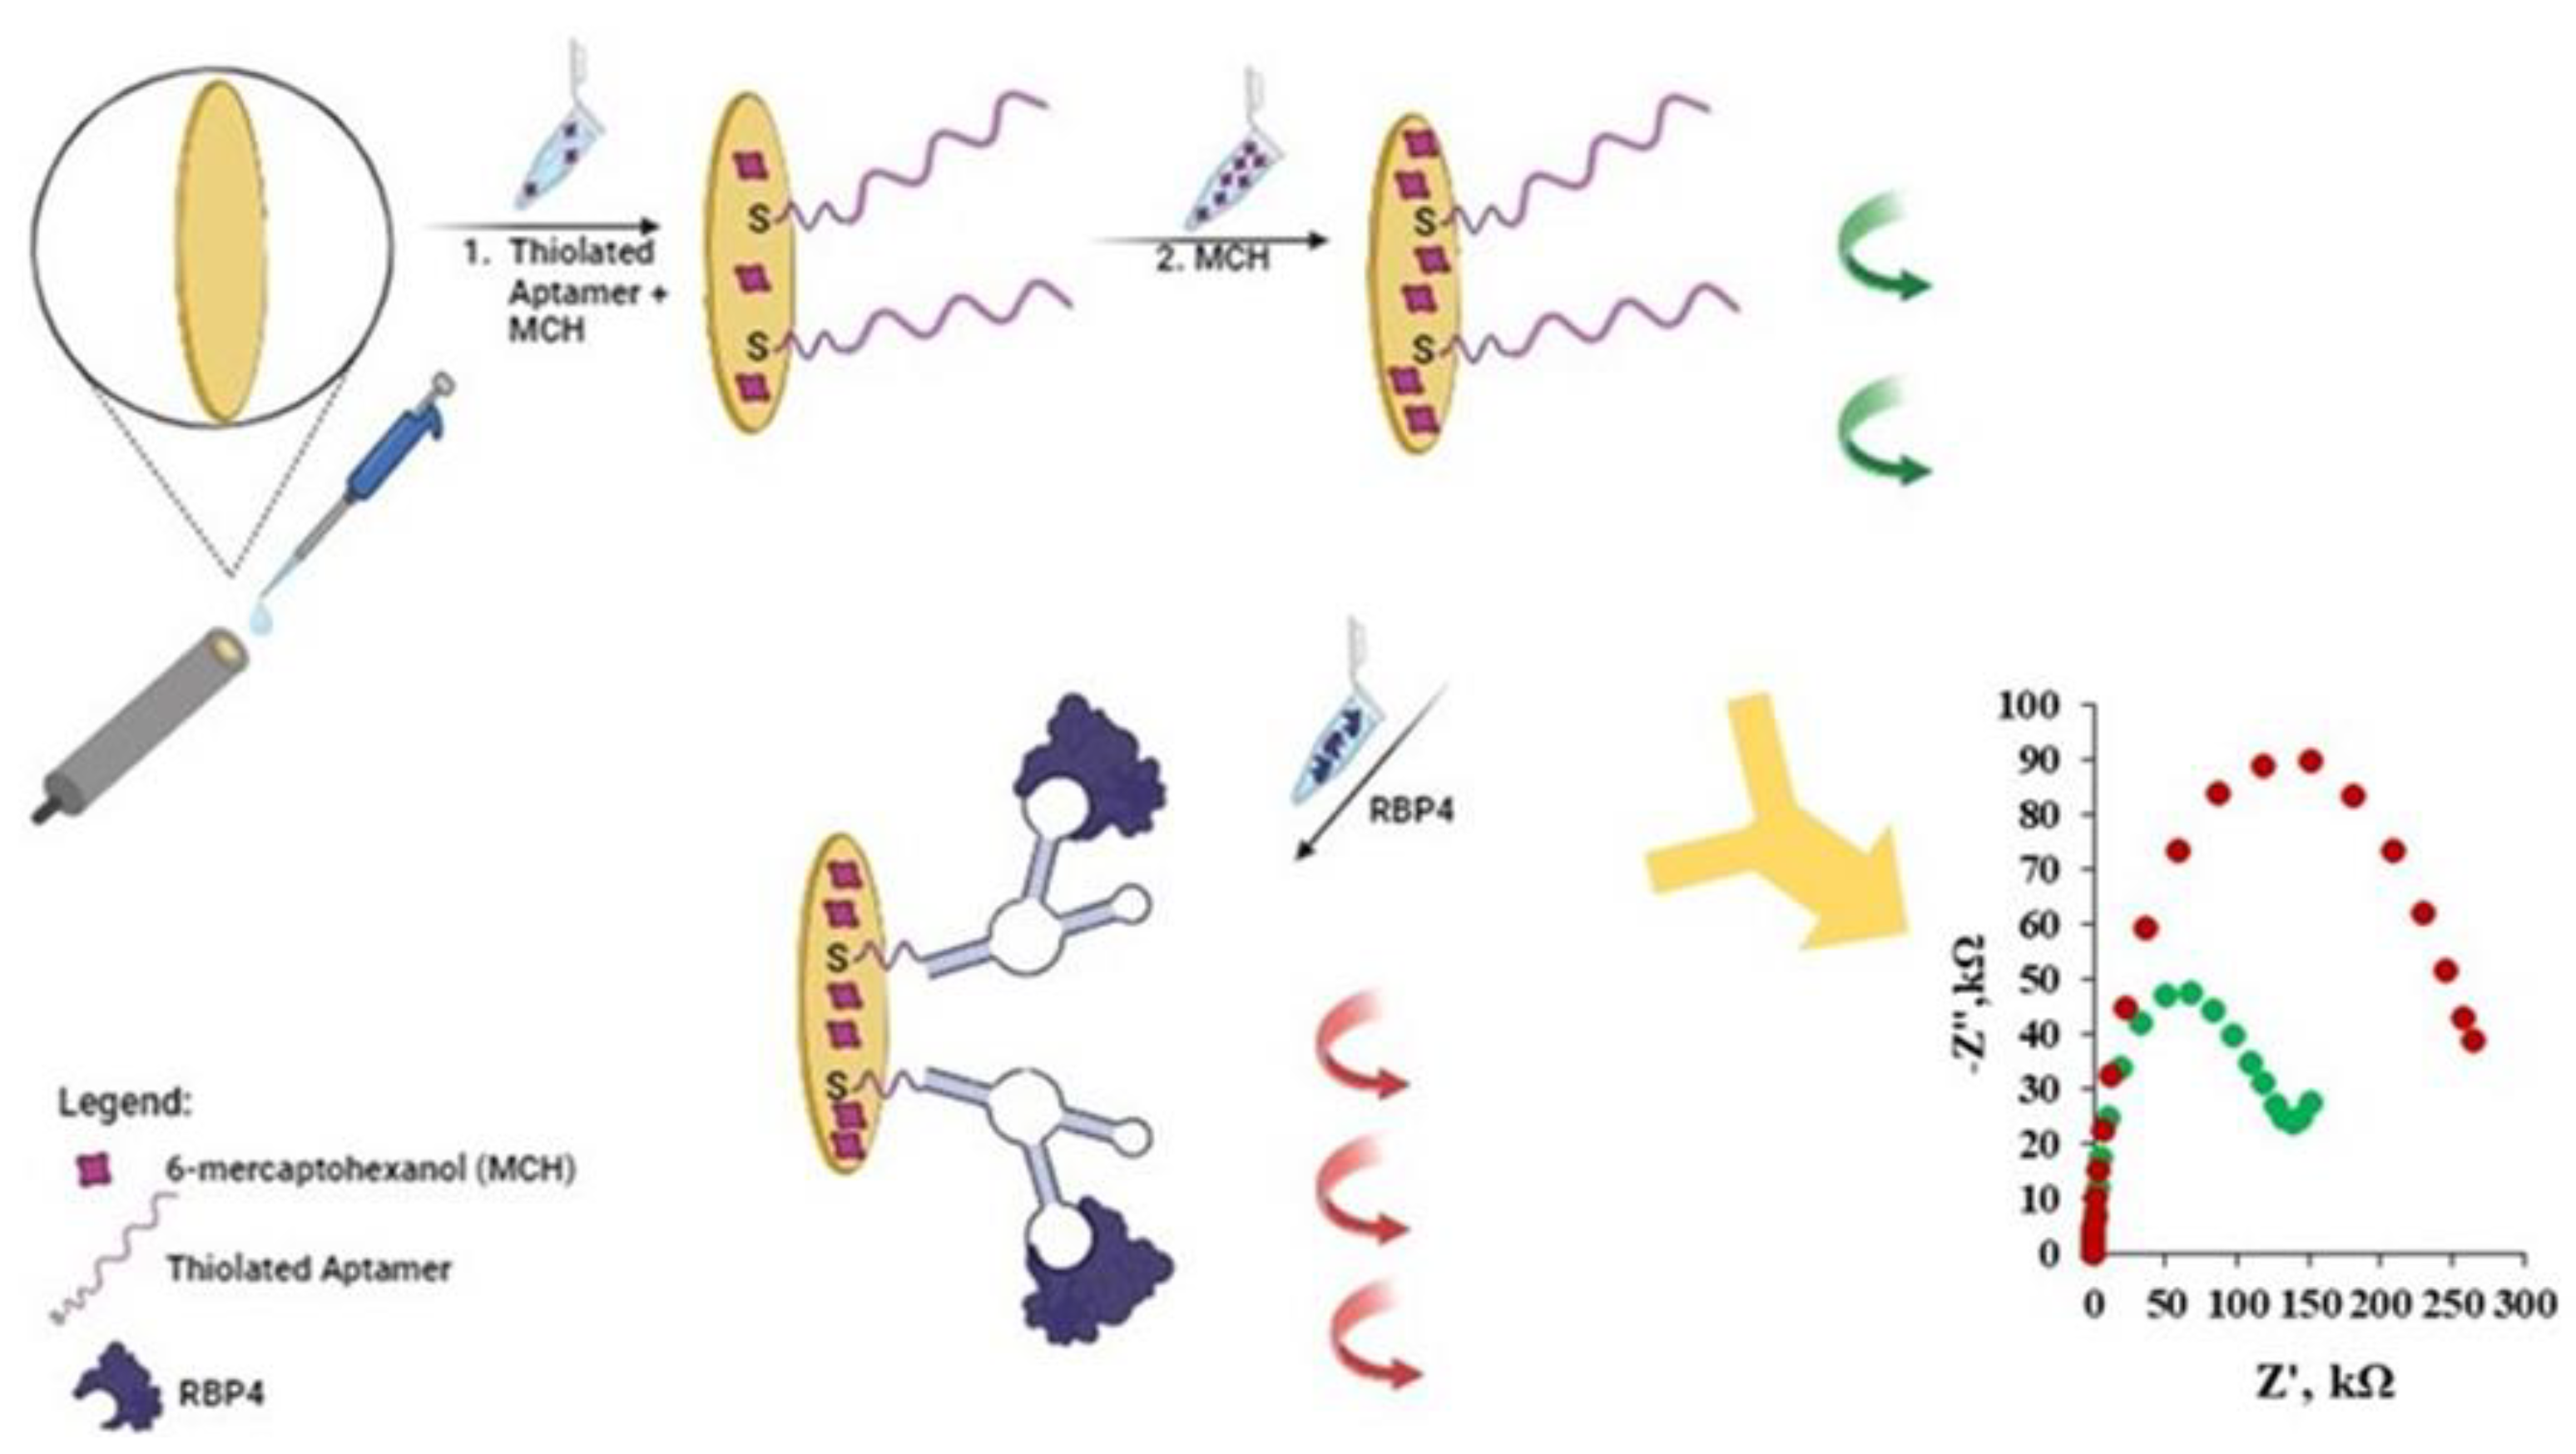
2.3. Fabrication of Electrochemical Aptasensor
- (1)
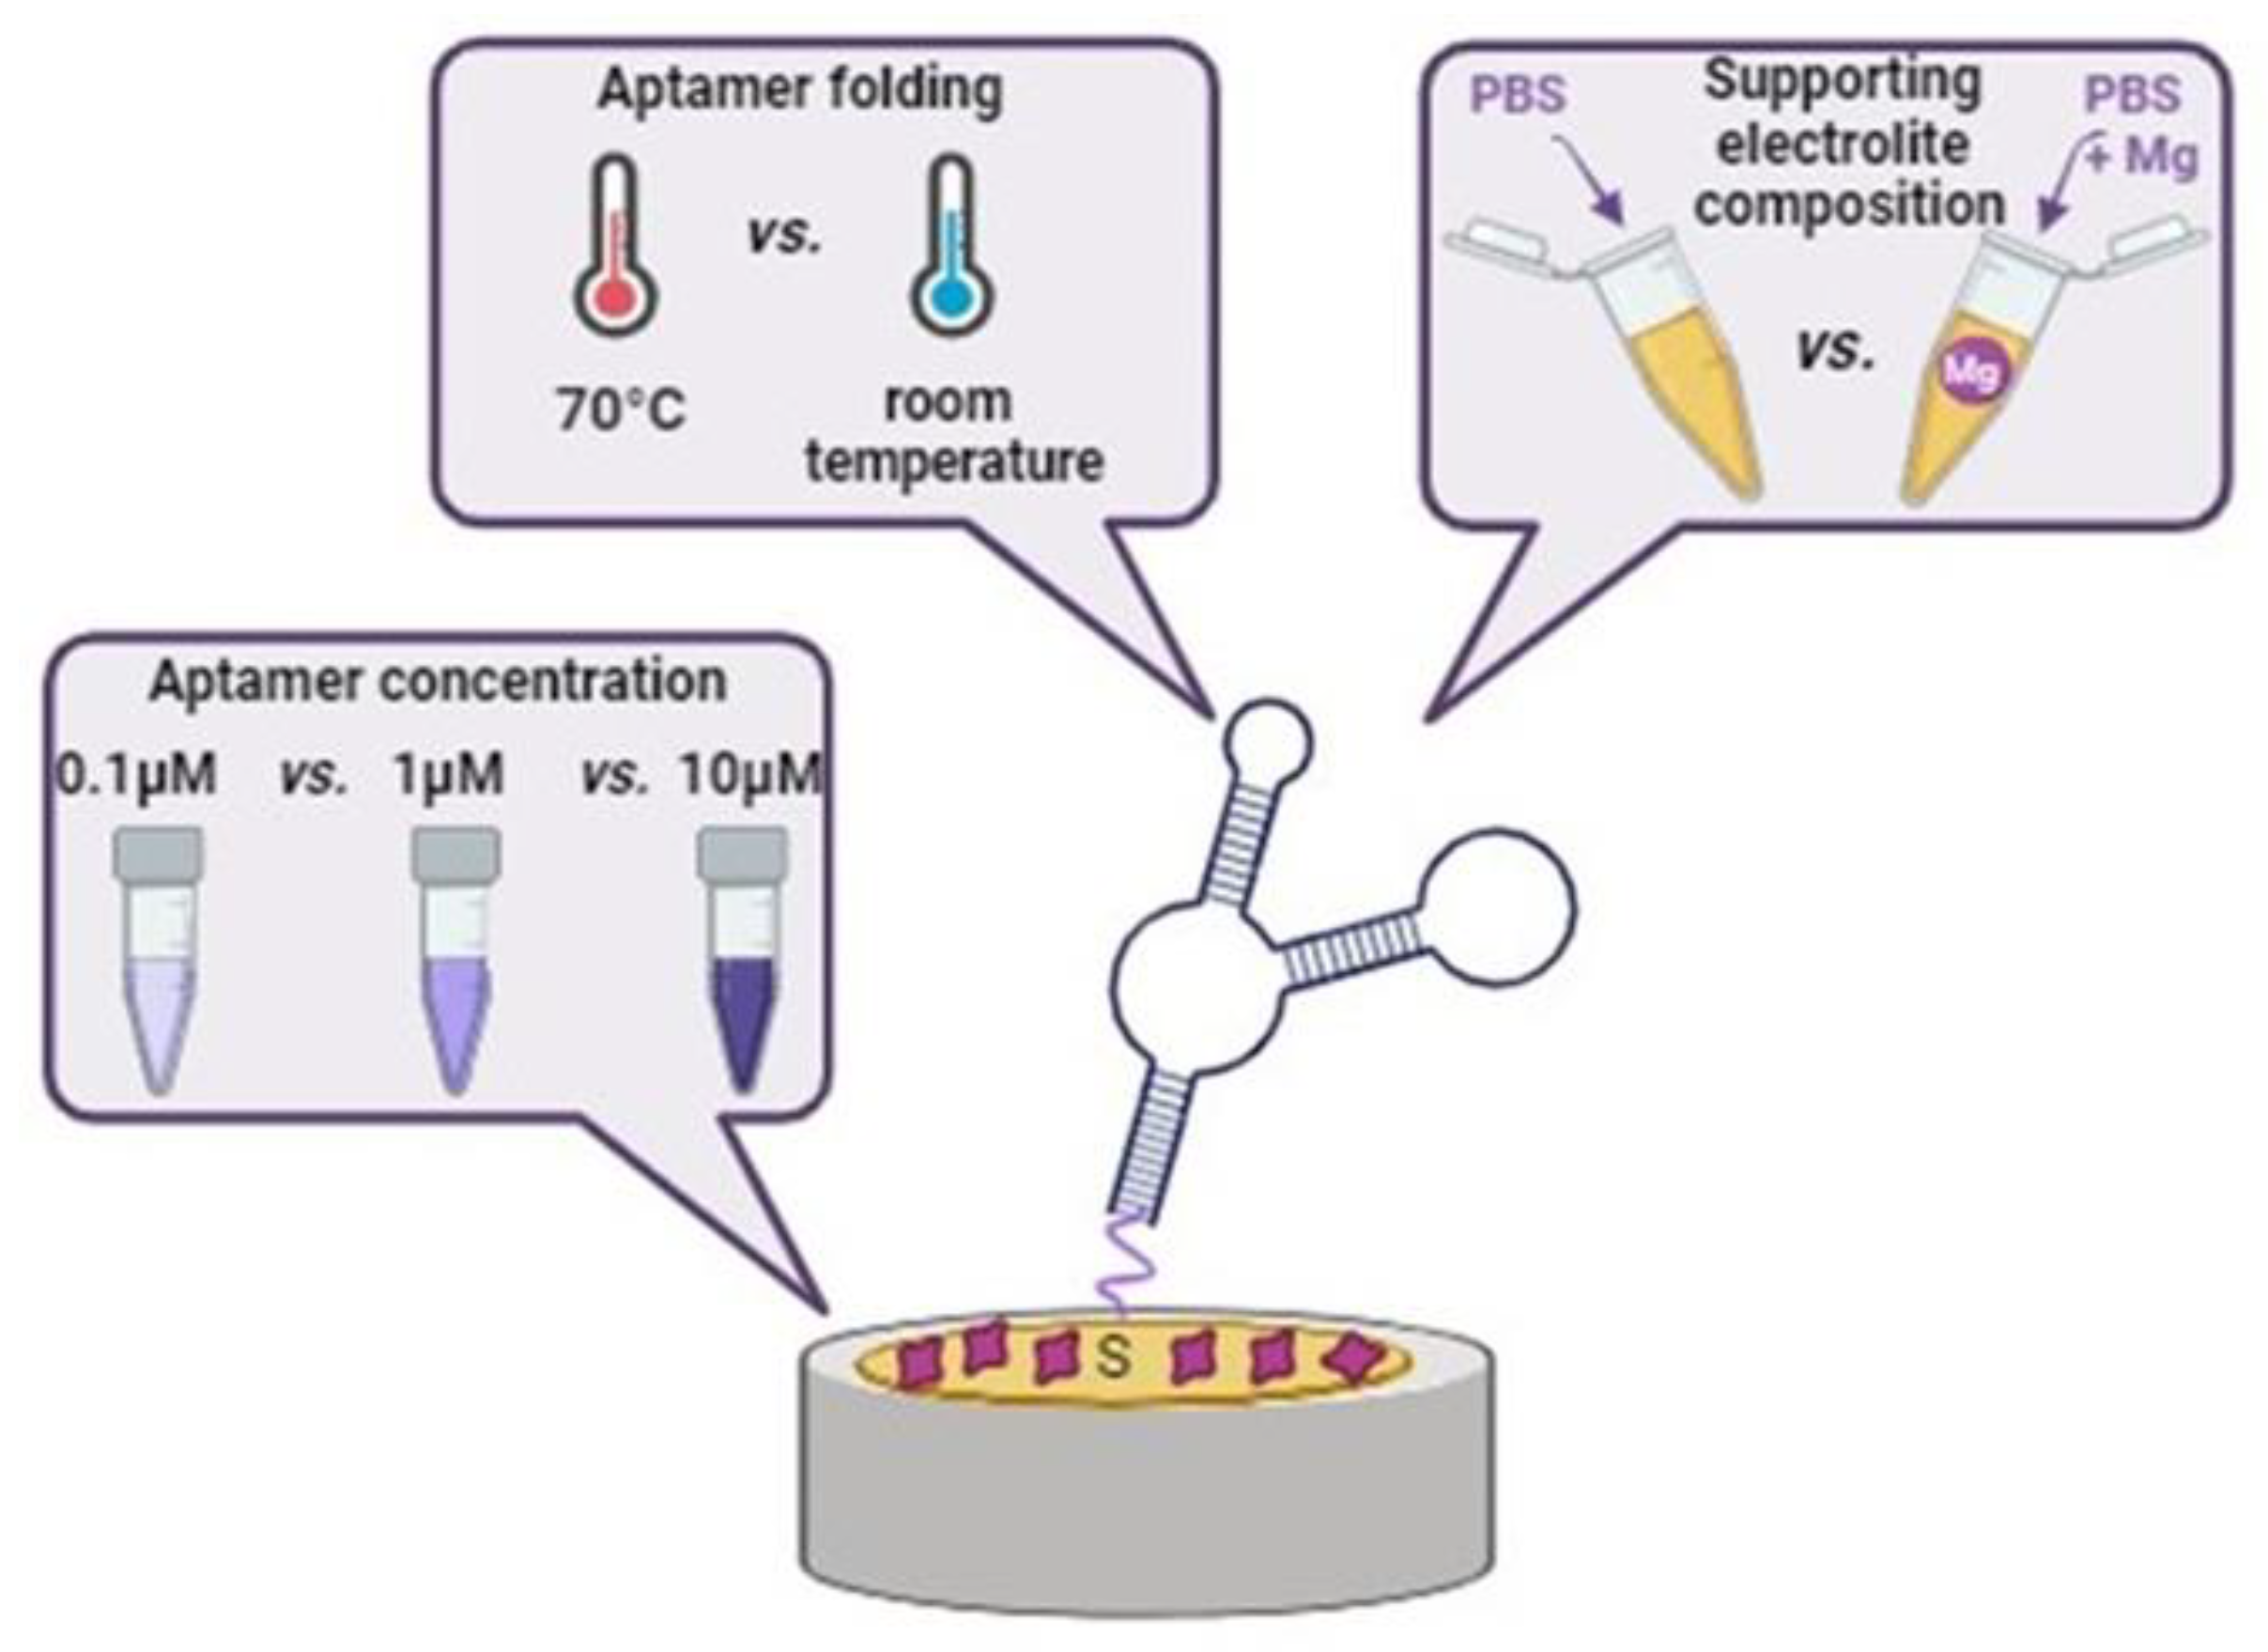
- The solutions of Apt-RBP-4 (0.1, 1.0, or 10.0 µM) were either incubated at 70 °C in a water bath for 1 min (prepared in PBS or PBS + 2 mM MgCl2) and then exposed to ice cooling (10 min) (called “aptamer folding”) or were not treated in this way (“aptamer without folding”). Then, a 10 μL droplet of solution containing an appropriate concentration of thiolated aptamer (0.1 or 1.0 or 10.0 µM), together with 0.1 µM of MCH, was co-immobilized by drop-casting on the Au electrode, at room temperature, in suitable buffer, for 3 h. The Au/Apt-RBP-4/MCH electrode was rinsed with buffer (PBS or PBS + 2 mM MgCl2).
- (2)
- The second step was based on the incubation of modified electrodes in the first stage by dropwise application of 1 mM of MCH solution (either in PBS or in PBS + 2 mM MgCl2), for 30 min, in order to cover the non-active sites of the Au/Apt-RBP-4/MCH surface. Then, after rinsing with the same buffer, the electrodes were left overnight in a buffer solution at 4 °C until use.
3. Results and Discussion
3.1. Optimization of the Folding Procedure, Modification and Supporting Electrolyte Composition
3.2. Optimization of Aptamer Concentration in the Modification Solution
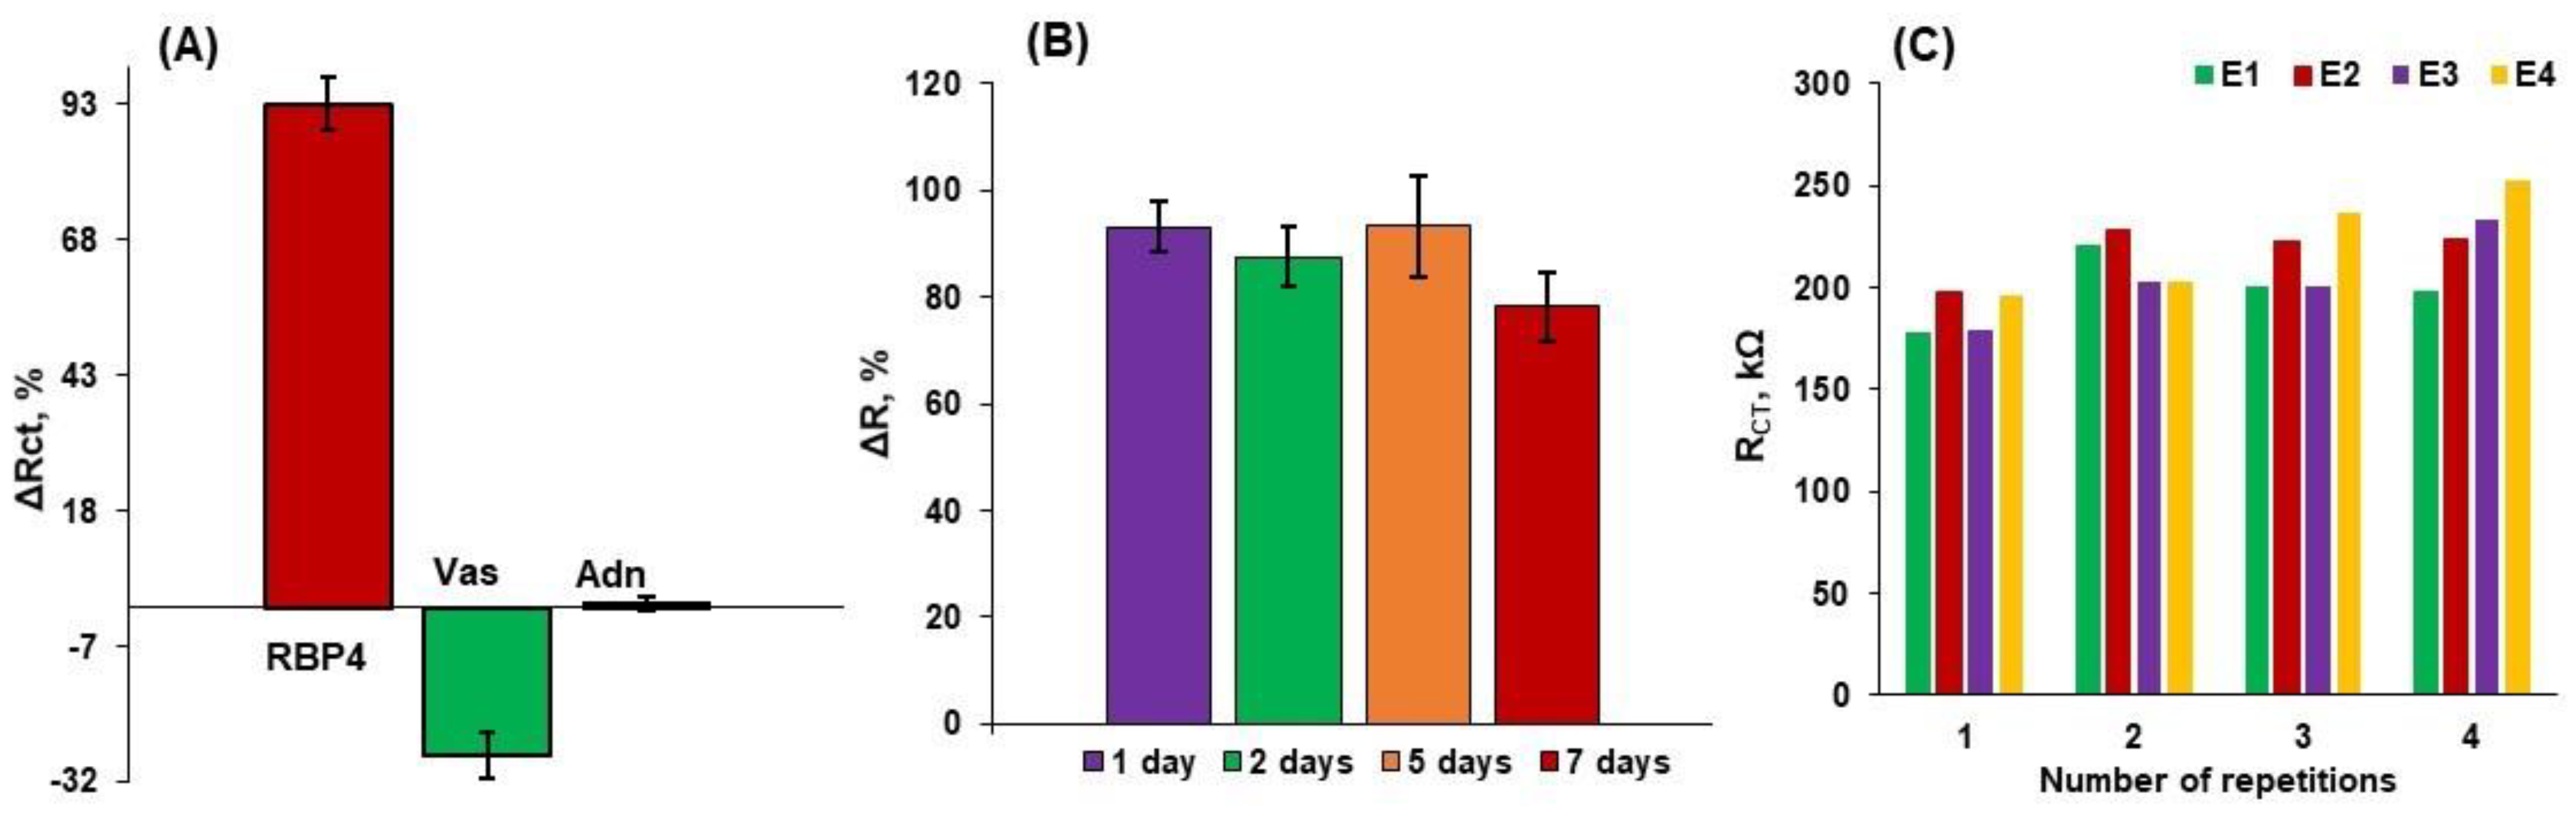
3.3. Electrochemical Aptasensing of RBP-4 Protein
4. Conclusions
Supplementary Materials
Author Contributions
Funding
Institutional Review Board Statement
Informed Consent Statement
Data Availability Statement
Acknowledgments
Conflicts of Interest
References
- Wu, J.; Liu, H.; Chen, W.; Ma, B.; Ju, H. Device integration of electrochemical biosensors. Nat. Rev. Bioeng. 2023, 1, 346–360. [Google Scholar] [CrossRef]
- Zhuo, Z.; Yu, Y.; Wang, M.; Li, J.; Zhang, Z.; Liu, J.; Wu, X.; Lu, A.; Zhang, G.; Zhang, B. Recent Advances in SELEX Technology and Aptamer Applications in Biomedicine. Int. J. Mol. Sci. 2017, 18, 2142. [Google Scholar] [CrossRef]
- Nur Topkaya, S.; Cetin, A.E. Electrochemical Aptasensors for Biological and Chemical Analyte Detection. Electroanalysis 2021, 33, 277–291. [Google Scholar] [CrossRef]
- Bhardwaj, T.; Kumar Sharma, T. Aptasensors for full body health checkup. Biosens. Bioelectron. X 2022, 11, 100199. [Google Scholar] [CrossRef]
- Villalonga, A.; Pérez-Calabuig, A.M.; Villalonga, R. Electrochemical biosensors based on nucleic acid aptamers. Anal. Bioanal. Chem. 2020, 412, 55–72. [Google Scholar] [CrossRef] [PubMed]
- Villalonga, A.; Mayol, B.; Villalonga, R.; Vilela, D. Electrochemical aptasensors for clinical diagnosis. A review of the last five years. Sens. Actuators B Chem. 2022, 369, 132318. [Google Scholar] [CrossRef]
- Pan, Y.; Wang, L.; Chen, S.; Wei, Y.; Wei, X. A target-triggered ultra-sensitive aptasensor for simultaneous detection of Cd2+ and Hg2+ using MWCNTs-Au NPs modified electrode. Food Chem. 2024, 440, 138185. [Google Scholar] [CrossRef] [PubMed]
- Hu, Z.; Zhu, R.; Figueroa-Miranda, G.; Zhou, L.; Feng, L.; Offenhäusser, A.; Mayer, D. Truncated Electrochemical Aptasensor with Enhanced Antifouling Capability for Highly Sensitive Serotonin Detection. Biosensors 2023, 13, 881. [Google Scholar] [CrossRef] [PubMed]
- Hu, M.; Yue, F.; Dong, J.; Tao, C.; Bai, M.; Liu, M.; Zhai, S.; Chen, S.; Liu, W.; Qi, G.; et al. Screening of broad-spectrum aptamer and development of electrochemical aptasensor for simultaneous detection of penicillin antibiotics in milk. Talanta 2024, 269, 125508. [Google Scholar] [CrossRef] [PubMed]
- Steinhoff, J.S.; Lass, A.; Schupp, M. Biological Functions of RBP4 and Its Relevance for Human Diseases. Front. Physiol. 2021, 12, 659977. [Google Scholar] [CrossRef]
- Torabi, R.; Bagherzadeh, K.; Ghourchian, H.; Amanlou, M. An investigation on the interaction modes of a single-strand DNA aptamer and RBP4 protein: A molecular dynamic simulations approach. Org. Biomol. Chem. 2016, 14, 8141–8153. [Google Scholar] [CrossRef]
- Torabi, R.; Ghourchian, H. Ultrasensitive nano-aptasensor for monitoring retinol binding protein 4 as a biomarker for diabetes prognosis at early stages. Sci. Rep. 2020, 10, 594. [Google Scholar] [CrossRef]
- Lee, S.J.; Youn, B.S.; Park, J.W.; Niazi, J.H.; Kim, Y.S.; Gu, M.B. ssDNA aptamer-based surface plasmon resonance biosensor for the detection of retinol binding protein 4 for the early diagnosis of type 2 diabetes. Anal. Chem. 2008, 80, 2867–2873. [Google Scholar] [CrossRef]
- Lee, S.J.; Park, J.-W.; Kim, I.-A.; Youn, B.-S.; Gu, M.B. Sensitive detection of adipokines for early diagnosis of type 2 diabetes using enzyme-linked antibody-aptamer sandwich (ELAAS) assays. Sens. Actuators B Chem. 2012, 168, 243–248. [Google Scholar] [CrossRef]
- Moabelo, K.L.; Lerga, T.M.; Jauset-Rubio, M.; Sibuyi, N.R.S.; O’Sullivan, C.K.; Meyer, M.; Madiehe, A.M. A Label-Free Gold Nanoparticles-Based Optical Aptasensor for the Detection of Retinol Binding Protein 4. Biosensors 2022, 12, 1061. [Google Scholar] [CrossRef]
- Paul, A.; Chiriacò, M.S.; Primiceri, E.; Srivastava, D.N.; Maruccio, G. Picomolar detection of retinol binding protein 4 for early management of type II diabetes. Biosens. Bioelectron. 2019, 128, 122–128. [Google Scholar] [CrossRef] [PubMed]
- Oberhaus, F.V.; Frense, D.; Beckmann, D. Immobilization Techniques for Aptamers on Gold Electrodes for the Electrochemical Detection of Proteins: A Review. Biosensors 2020, 10, 45. [Google Scholar] [CrossRef] [PubMed]
- Onaş, A.M.; Dascălu, C.; Raicopol, M.D.; Pilan, L. Critical Design Factors for Electrochemical Aptasensors Based on Target-Induced Conformational Changes: The Case of Small-Molecule Targets. Biosensors 2022, 12, 816. [Google Scholar] [CrossRef]
- Tello, A.; Cao, R.; Marchant, M.J.; Gomez, H. Conformational Changes of Enzymes and Aptamers Immobilized on Electrodes. Bioconjugate Chem. 2016, 27, 2581–2591. [Google Scholar] [CrossRef]
- Serec, K.; Babić, S.D.; Podgornik, R.; Tomić, S. Effect of magnesium ions on the structure of DNA thin films: An infrared spectroscopy study. Nucleic Acids Res. 2016, 44, 8456–8464. [Google Scholar] [CrossRef]
- McKeague, M.; McConnell, E.M.; Cruz-Toledo, J.; Bernard, E.D.; Pach, A.; Mastronardi, E.; Zhang, X.; Beking, M.; Francis, T.; Giamberardino, A.; et al. Analysis of In Vitro Aptamer Selection Parameters. J. Mol. Evol. 2015, 81, 150–161. [Google Scholar] [CrossRef] [PubMed]
- Bai, Y.; Zhao, Q. Investigation of the effects of metal ions in sample buffer on capillary electrophoresis coupled with laser-induced fluorescence analysis of thrombin using a dye-labeled 29-mer DNA aptamer. Anal. Methods 2017, 9, 5684–5690. [Google Scholar] [CrossRef]
- Balamurugan, S.; Obubuafo, A.; Soper, S.A.; McCarley, R.L.; Spivak, D.A. Designing Highly Specific Biosensing Surfaces Using Aptamer Monolayers on Gold. Langmuir 2006, 22, 6446–6453. [Google Scholar] [CrossRef]
- Sypabekova, M.; Jolly, P.; Estrela, P.; Kanayeva, D. Electrochemical aptasensor using optimized surface chemistry for the detection of Mycobacterium tuberculosis secreted protein MPT64 in human serum. Biosens. Bioelectron. 2019, 123, 141–151. [Google Scholar] [CrossRef] [PubMed]
- Hianik, T.; Ostatná, V.; Sonlajtnerova, M.; Grman, I. Influence of ionic strength, pH and aptamer configuration for binding affinity to thrombin. Bioelectrochemistry 2007, 70, 127–133. [Google Scholar] [CrossRef]
- Keighley, S.D.; Li, P.; Estrela, P.; Migliorato, P. Optimization of DNA immobilization on gold electrodes for label-free detection by electrochemical impedance spectroscopy. Biosens. Bioelectron. 2008, 23, 1291–1297. [Google Scholar] [CrossRef] [PubMed]
- Ardjomandi, N.; Niederlaender, J.; Aicher, W.K.; Reinert, S.; Schweizer, E.; Wendel, H.P.; Alexander, D. Identification of an aptamer binding to human osteogenic-induced progenitor cells. Nucleic Acid. Ther. 2013, 23, 44–61. [Google Scholar] [CrossRef]
- Levicky, R.; Herne, T.M.; Tarlov, M.J.; Satija, S.K. Using Self-Assembly To Control the Structure of DNA Monolayers on Gold: A Neutron Reflectivity Study. J. Am. Chem. Soc. 1998, 120, 9787–9792. [Google Scholar] [CrossRef]
- García-Miranda Ferrari, A.; Foster, C.W.; Kelly, P.J.; Brownson, D.A.C.; Banks, C.E. Determination of the Electrochemical Area of Screen-Printed Electrochemical Sensing Platforms. Biosensors 2018, 8, 53. [Google Scholar] [CrossRef]
- Zaki, M.H.M.; Mohd, Y.; Chin, L.Y. Surface Properties of Nanostructured Gold Coatings Electrodeposited at Different Potentials. Int. J. Electrochem. Sci. 2020, 15, 11401–11415. [Google Scholar] [CrossRef]
- Xie, X.; Holze, R. Electrode Kinetic Data: Geometric vs. Real Surface Area. Batteries 2022, 8, 146. [Google Scholar] [CrossRef]
- Malecka, K.; Stachyra, A.; Góra-Sochacka, A.; Sirko, A.; Zagórski-Ostoja, W.; Radecka, H.; Radecki, J. Electrochemical genosensor based on disc and screen printed gold electrodes for detection of specific DNA and RNA sequences derived from Avian Influenza Virus H5N1. Sens. Actuators B Chem. 2016, 224, 290–297. [Google Scholar] [CrossRef]
- Palla, G.; Malecka, K.; Dehaen, W.; Radecki, J.; Radecka, H. Immunosensor incorporating half-antibody fragment for electrochemical monitoring of amyloid-β fibrils in artificial blood plasma. Bioelectrochemistry 2021, 137, 107643. [Google Scholar] [CrossRef] [PubMed]
- Chailapakul, O.; Sun, L.; Xu, C.; Crooks, R.M. Interactions between organized, surface-confined monolayers and vapor-phase probe molecules. 7. Comparison of self-assembling n-alkanethiol monolayers deposited on gold from liquid and vapor phases. J. Am. Chem. Soc. 1993, 115, 12459–12467. [Google Scholar] [CrossRef]
- Steichen, M.; Doneux, T.; Buess-Herman, C. On the adsorption of hexaammineruthenium (III) at anionic self-assembled monolayers. Electrochim. Acta 2008, 53, 6202–6208. [Google Scholar] [CrossRef]
- Peterson, P.A.; Berggård, I. Isolation and Properties of a Human Retinol-transporting Protein. J. Biol. Chem. 1971, 246, 25–33. [Google Scholar] [CrossRef]
- Schrattenecker, J.D.; Heer, R.; Melnik, E.; Maier, T.; Fafilek, G.; Hainberger, R. Hexaammineruthenium (II)/(III) as alternative redox-probe to Hexacyanoferrat (II)/(III) for stable impedimetric biosensing with gold electrodes. Biosens. Bioelectron. 2019, 127, 25–30. [Google Scholar] [CrossRef] [PubMed]
- Formisano, N.; Jolly, P.; Bhalla, N.; Cromhout, M.; Flanagan, S.P.; Fogel, R.; Limson, J.L.; Estrela, P. Optimisation of an electrochemical impedance spectroscopy aptasensor by exploiting quartz crystal microbalance with dissipation signals. Sens. Actuators B Chem. 2015, 220, 369–375. [Google Scholar] [CrossRef]
- Trachioti, M.G.; Lazanas, A.C.; Prodromidis, M.I. Shedding light on the calculation of electrode electroactive area and heterogeneous electron transfer rate constants at graphite screen-printed electrodes. Microchim. Acta 2023, 190, 251. [Google Scholar] [CrossRef] [PubMed]
- Forouzanfar, S.; Alam, F.; Pala, N.; Wang, C. Highly sensitive label-free electrochemical aptasensors based on photoresist derived carbon for cancer biomarker detection. Biosens. Bioelectron. 2020, 170, 112598. [Google Scholar] [CrossRef]
- Ge, B.; Huang, Y.-C.; Sen, D.; Yu, H.-Z. Electrochemical investigation of DNA-modified surfaces: From quantitation methods to experimental conditions. J. Electroanal. Chem. 2007, 602, 156–162. [Google Scholar] [CrossRef]
- Khalifa, M.M.; Elkhawaga, A.A.; Hassan, M.A.; Zahran, A.M.; Fathalla, A.M.; El-Said, W.A.; El-Badawy, O. Highly specific Electrochemical Sensing of Pseudomonas aeruginosa in patients suffering from corneal ulcers: A comparative study. Sci. Rep. 2019, 9, 18320. [Google Scholar] [CrossRef] [PubMed]
- Magar, H.S.; Hassan, R.Y.A.; Mulchandani, A. Electrochemical Impedance Spectroscopy (EIS): Principles, Construction, and Biosensing Applications. Sensors 2021, 21, 6578. [Google Scholar] [CrossRef] [PubMed]
- Lvovich, V.F. Electrochemical Impedance Spectroscopy (EIS) Applications to Sensors and Diagnostics. In Encyclopedia of Applied Electrochemistry; Kreysa, G., Ota, K.-I., Savinell, R.F., Eds.; Springer: New York, NY, USA, 2014; pp. 485–507. [Google Scholar]
- Curulli, A. Electrochemical Biosensors in Food Safety: Challenges and Perspectives. Molecules 2021, 26, 2940. [Google Scholar] [CrossRef] [PubMed]
- Szymańska, I.; Radecka, H.; Radecki, J.; Kaliszan, R. Electrochemical impedance spectroscopy for study of amyloid β-peptide interactions with (−) nicotine ditartrate and (−) cotinine. Biosens. Bioelectron. 2007, 22, 1955–1960. [Google Scholar] [CrossRef] [PubMed]
- Sikarwar, B.; Singh, V.V.; Sharma, P.K.; Kumar, A.; Thavaselvam, D.; Boopathi, M.; Singh, B.; Jaiswal, Y.K. DNA-probe-target interaction based detection of Brucella melitensis by using surface plasmon resonance. Biosens. Bioelectron. 2017, 87, 964–969. [Google Scholar] [CrossRef] [PubMed]
- Long, G.L.; Winefordner, J.D. Limit of detection. A closer look at the IUPAC definition. Anal. Chem. 1983, 55, 712A–724A. [Google Scholar] [CrossRef]
- Farjo, K.M.; Farjo, R.A.; Halsey, S.; Moiseyev, G.; Ma, J.X. Retinol-binding protein 4 induces inflammation in human endothelial cells by an NADPH oxidase- and nuclear factor kappa B-dependent and retinol-independent mechanism. Mol. Cell Biol. 2012, 32, 5103–5115. [Google Scholar] [CrossRef]
- Amouzadeh Tabrizi, M.; Acedo, P. Highly sensitive aptasensor for the detection of SARS-CoV-2-RBD using aptamer-gated methylene blue@mesoporous silica film/laser engraved graphene electrode. Biosens. Bioelectron. 2022, 215, 114556. [Google Scholar] [CrossRef]


| Modification Solution/ Supporting Electrolyte | Aptamer Folding | Aptamer without Folding | ||||
|---|---|---|---|---|---|---|
| ΔE [%] | ΔI [%] | ΔR [%] | ΔE [%] | ΔI [%] | ΔR [%] | |
| PBS | 9.7 ± 0.3 | −9 ± 0.7 | 53.3 ± 5 | 14.6 ± 0.8 | −7 ± 0.7 | 37.3 ± 5.5 |
| PBS + MgCl2 | 35.3 ± 2.9 | −22.9 ± 0.7 | 67.5 ± 4.5 | 39.7 ± 3.0 | −19.6 ± 1.8 | 55.3 ± 4.3 |
| CAPT [µM] | Aptamer Folding | Aptamer without Folding | ||||
|---|---|---|---|---|---|---|
| ΔE [%] | ΔI [%] | ΔR [%] | ΔE [%] | ΔI [%] | ΔR [%] | |
| 0.1 | 67 ± 1.7 | −51.7 ± 2.6 | 93.1 ± 4.8 | 71 ± 4 | −29.8 ± 1.7 | 46.2 ± 1.9 |
| 1 | 35.3 ± 2.9 | −22.9 ± 0.7 | 67.5 ± 4.5 | 39.7 ± 3.0 | −19.6 ± 1.8 | 55.3 ± 4.3 |
| 10 | 24.9 ± 1.2 | −22.3 ± 1.1 | 58.4 ± 7.6 | 27.7 ± 1.6 | −23.7 ± 1.8 | 35.8 ± 2.1 |
| Receptor | Method | LOD (ng/mL) | Linear Range (ng/mL) | Detection Time (min) | Ref. |
|---|---|---|---|---|---|
| ssDNA Aptamer | SPR | 1580 | 200–500 | 140 | [13] |
| ELAAS | 75 | 78–5000 | 120 | [14] | |
| Chemiluminescence | 95.1 × 10⁻⁵ | 0.001–2.0 | 120 | [12] | |
| Colorimetric | 1906 | 164 –5250 | 5 | [15] | |
| EIS | 44 | 100–1000 | 60 | This work |
| Analyte | ΔE [%] | ΔI [%] | ΔR [%] |
|---|---|---|---|
| RBP-4 | 67 ± 1.7 | −51.7 ± 2.6 | 93.1 ± 4.8 |
| Vaspin | 7.8 ± 2.0 | −13.8 ± 0.7 | −27.2 ± 4.3 |
| Adiponectin | 10.7 ± 2.3 | −1.5 ± 0.9 | 0.8 ± 1.4 |
Disclaimer/Publisher’s Note: The statements, opinions and data contained in all publications are solely those of the individual author(s) and contributor(s) and not of MDPI and/or the editor(s). MDPI and/or the editor(s) disclaim responsibility for any injury to people or property resulting from any ideas, methods, instructions or products referred to in the content. |
© 2024 by the authors. Licensee MDPI, Basel, Switzerland. This article is an open access article distributed under the terms and conditions of the Creative Commons Attribution (CC BY) license (https://creativecommons.org/licenses/by/4.0/).
Share and Cite
Malecka-Baturo, K.; Żółtowska, P.; Jackowska, A.; Kurzątkowska-Adaszyńska, K.; Grabowska, I. Electrochemical Aptasensing Platform for the Detection of Retinol Binding Protein-4. Biosensors 2024, 14, 101. https://doi.org/10.3390/bios14020101
Malecka-Baturo K, Żółtowska P, Jackowska A, Kurzątkowska-Adaszyńska K, Grabowska I. Electrochemical Aptasensing Platform for the Detection of Retinol Binding Protein-4. Biosensors. 2024; 14(2):101. https://doi.org/10.3390/bios14020101
Chicago/Turabian StyleMalecka-Baturo, Kamila, Paulina Żółtowska, Agnieszka Jackowska, Katarzyna Kurzątkowska-Adaszyńska, and Iwona Grabowska. 2024. "Electrochemical Aptasensing Platform for the Detection of Retinol Binding Protein-4" Biosensors 14, no. 2: 101. https://doi.org/10.3390/bios14020101