Human Urinary Volatilome Analysis in Renal Cancer by Electronic Nose

 , ,
, ,  , , and
Abstract
:1. Introduction
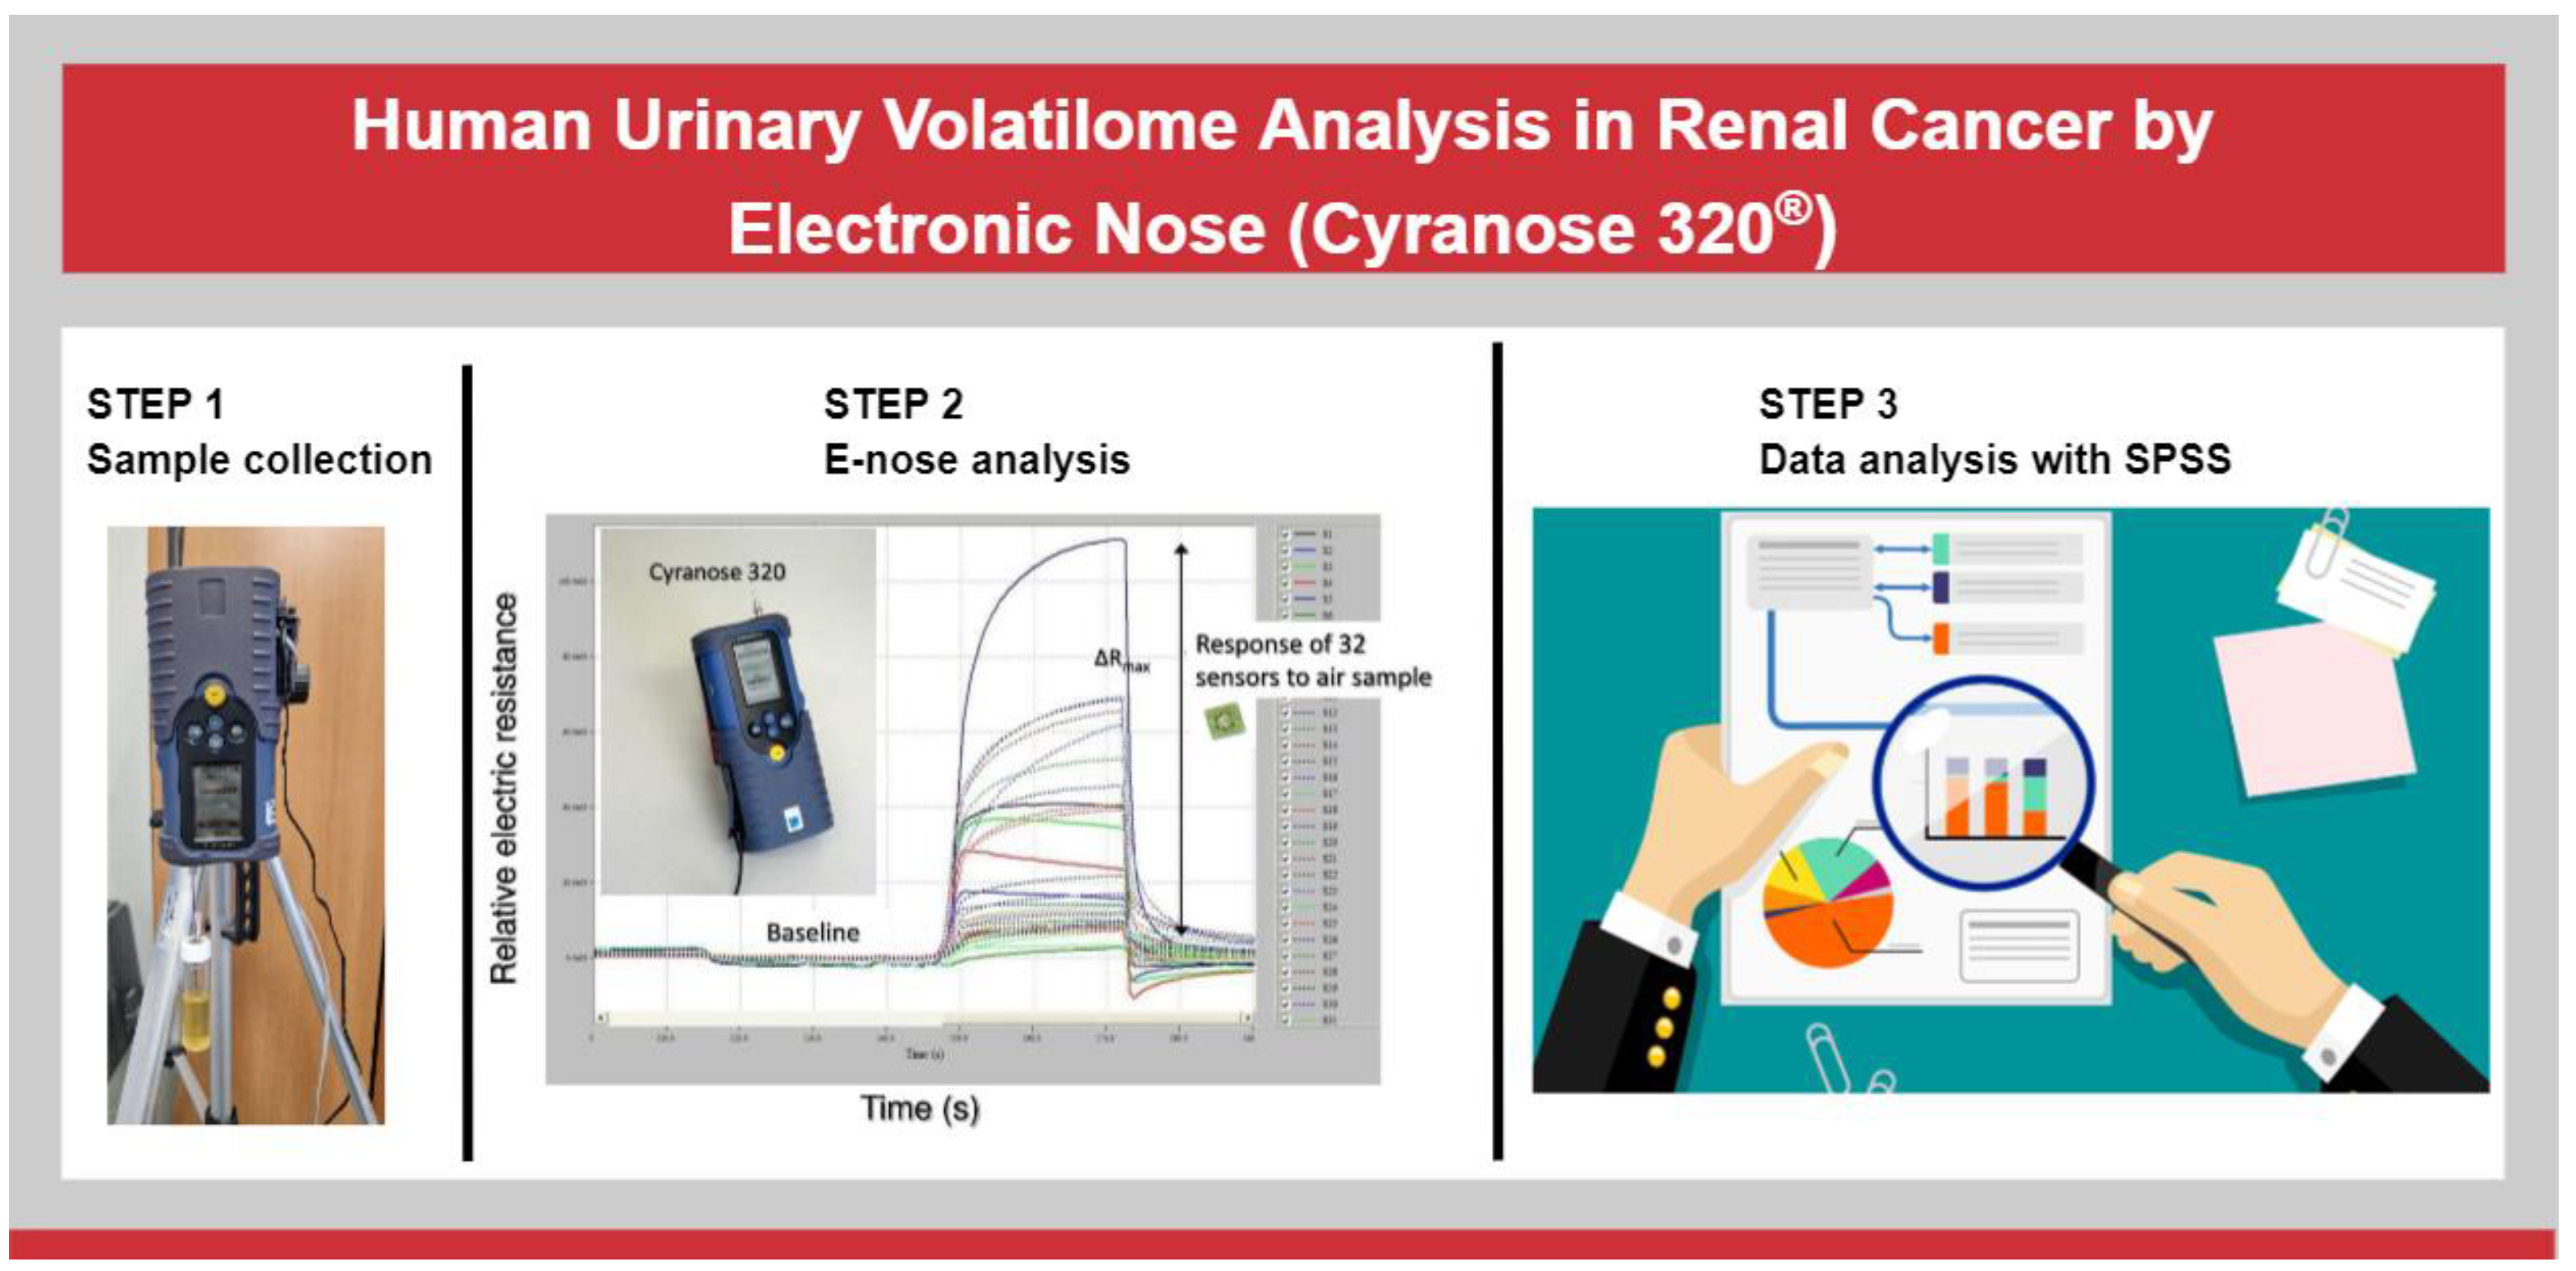
2. Materials and Methods
2.1. Study Population
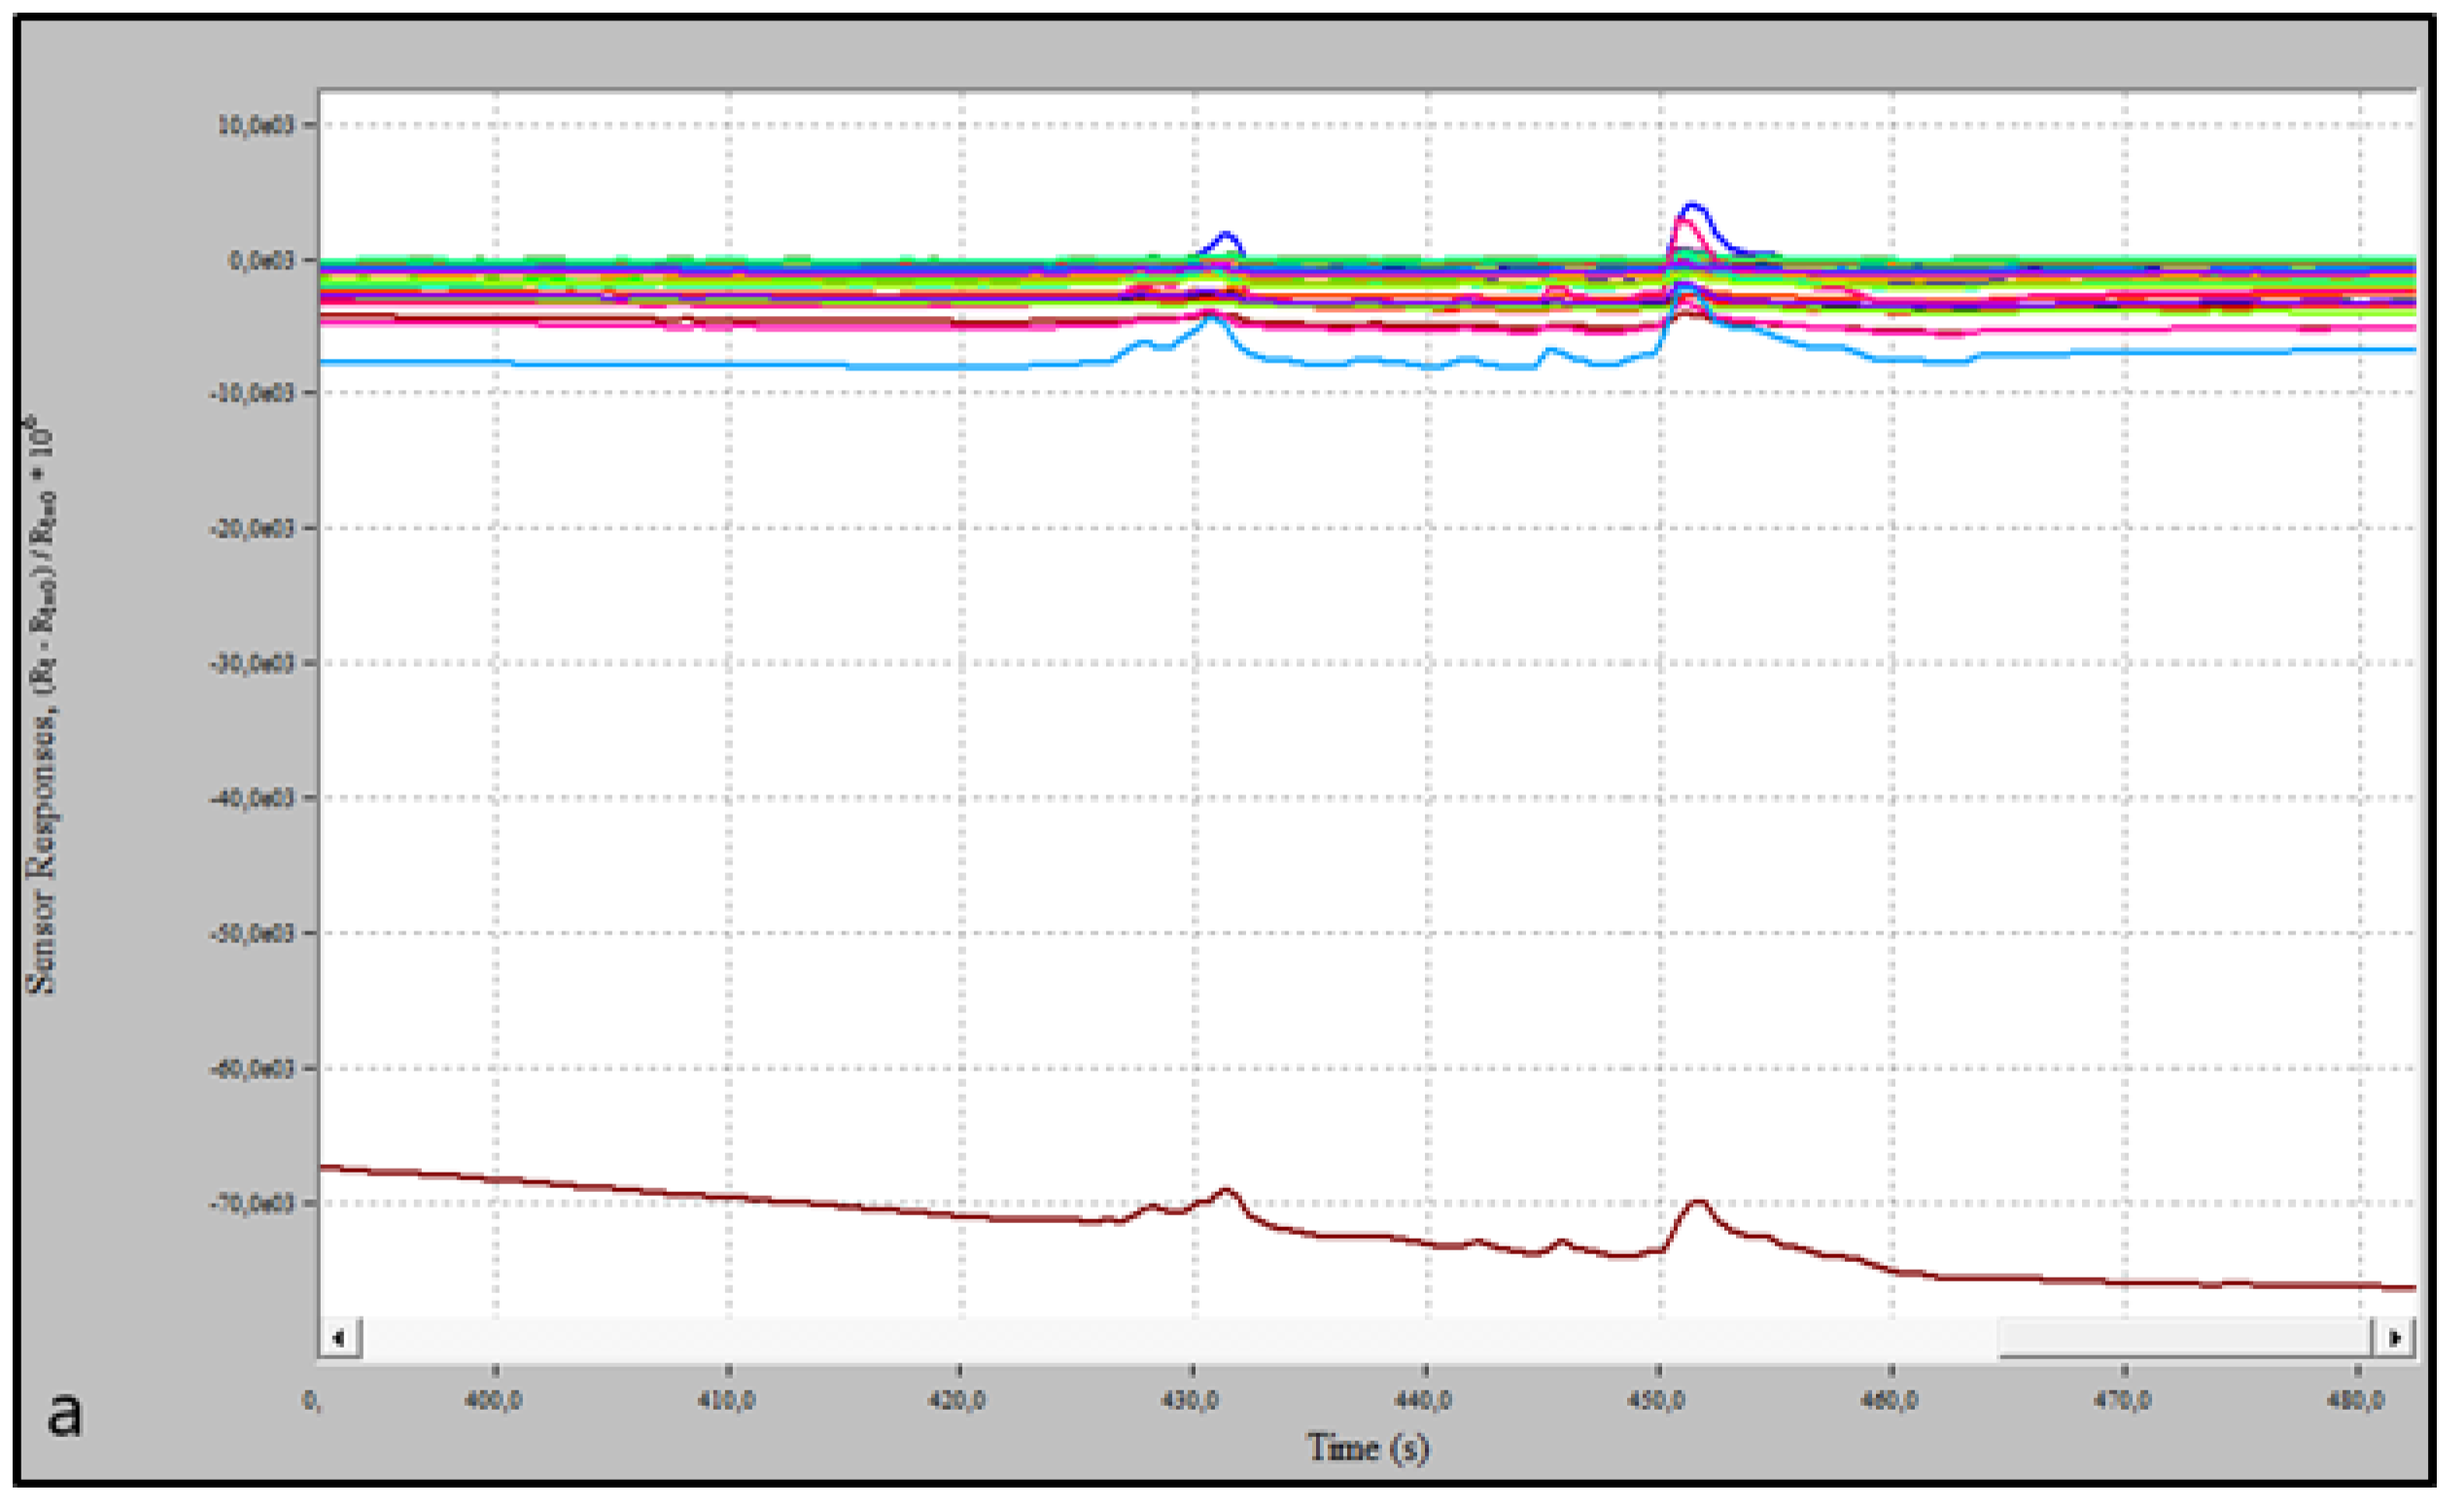
2.2. Electronic Nose
2.3. Data Analysis
3. Results
4. Discussion
Clinical Translation
5. Conclusions
Author Contributions
Funding
Institutional Review Board Statement
Informed Consent Statement
Data Availability Statement
Acknowledgments
Conflicts of Interest
Abbreviations
| EN or e-Nose | Electronic nose |
| VOCs | Volatile organic compounds |
| RCC | Renal cell carcinoma |
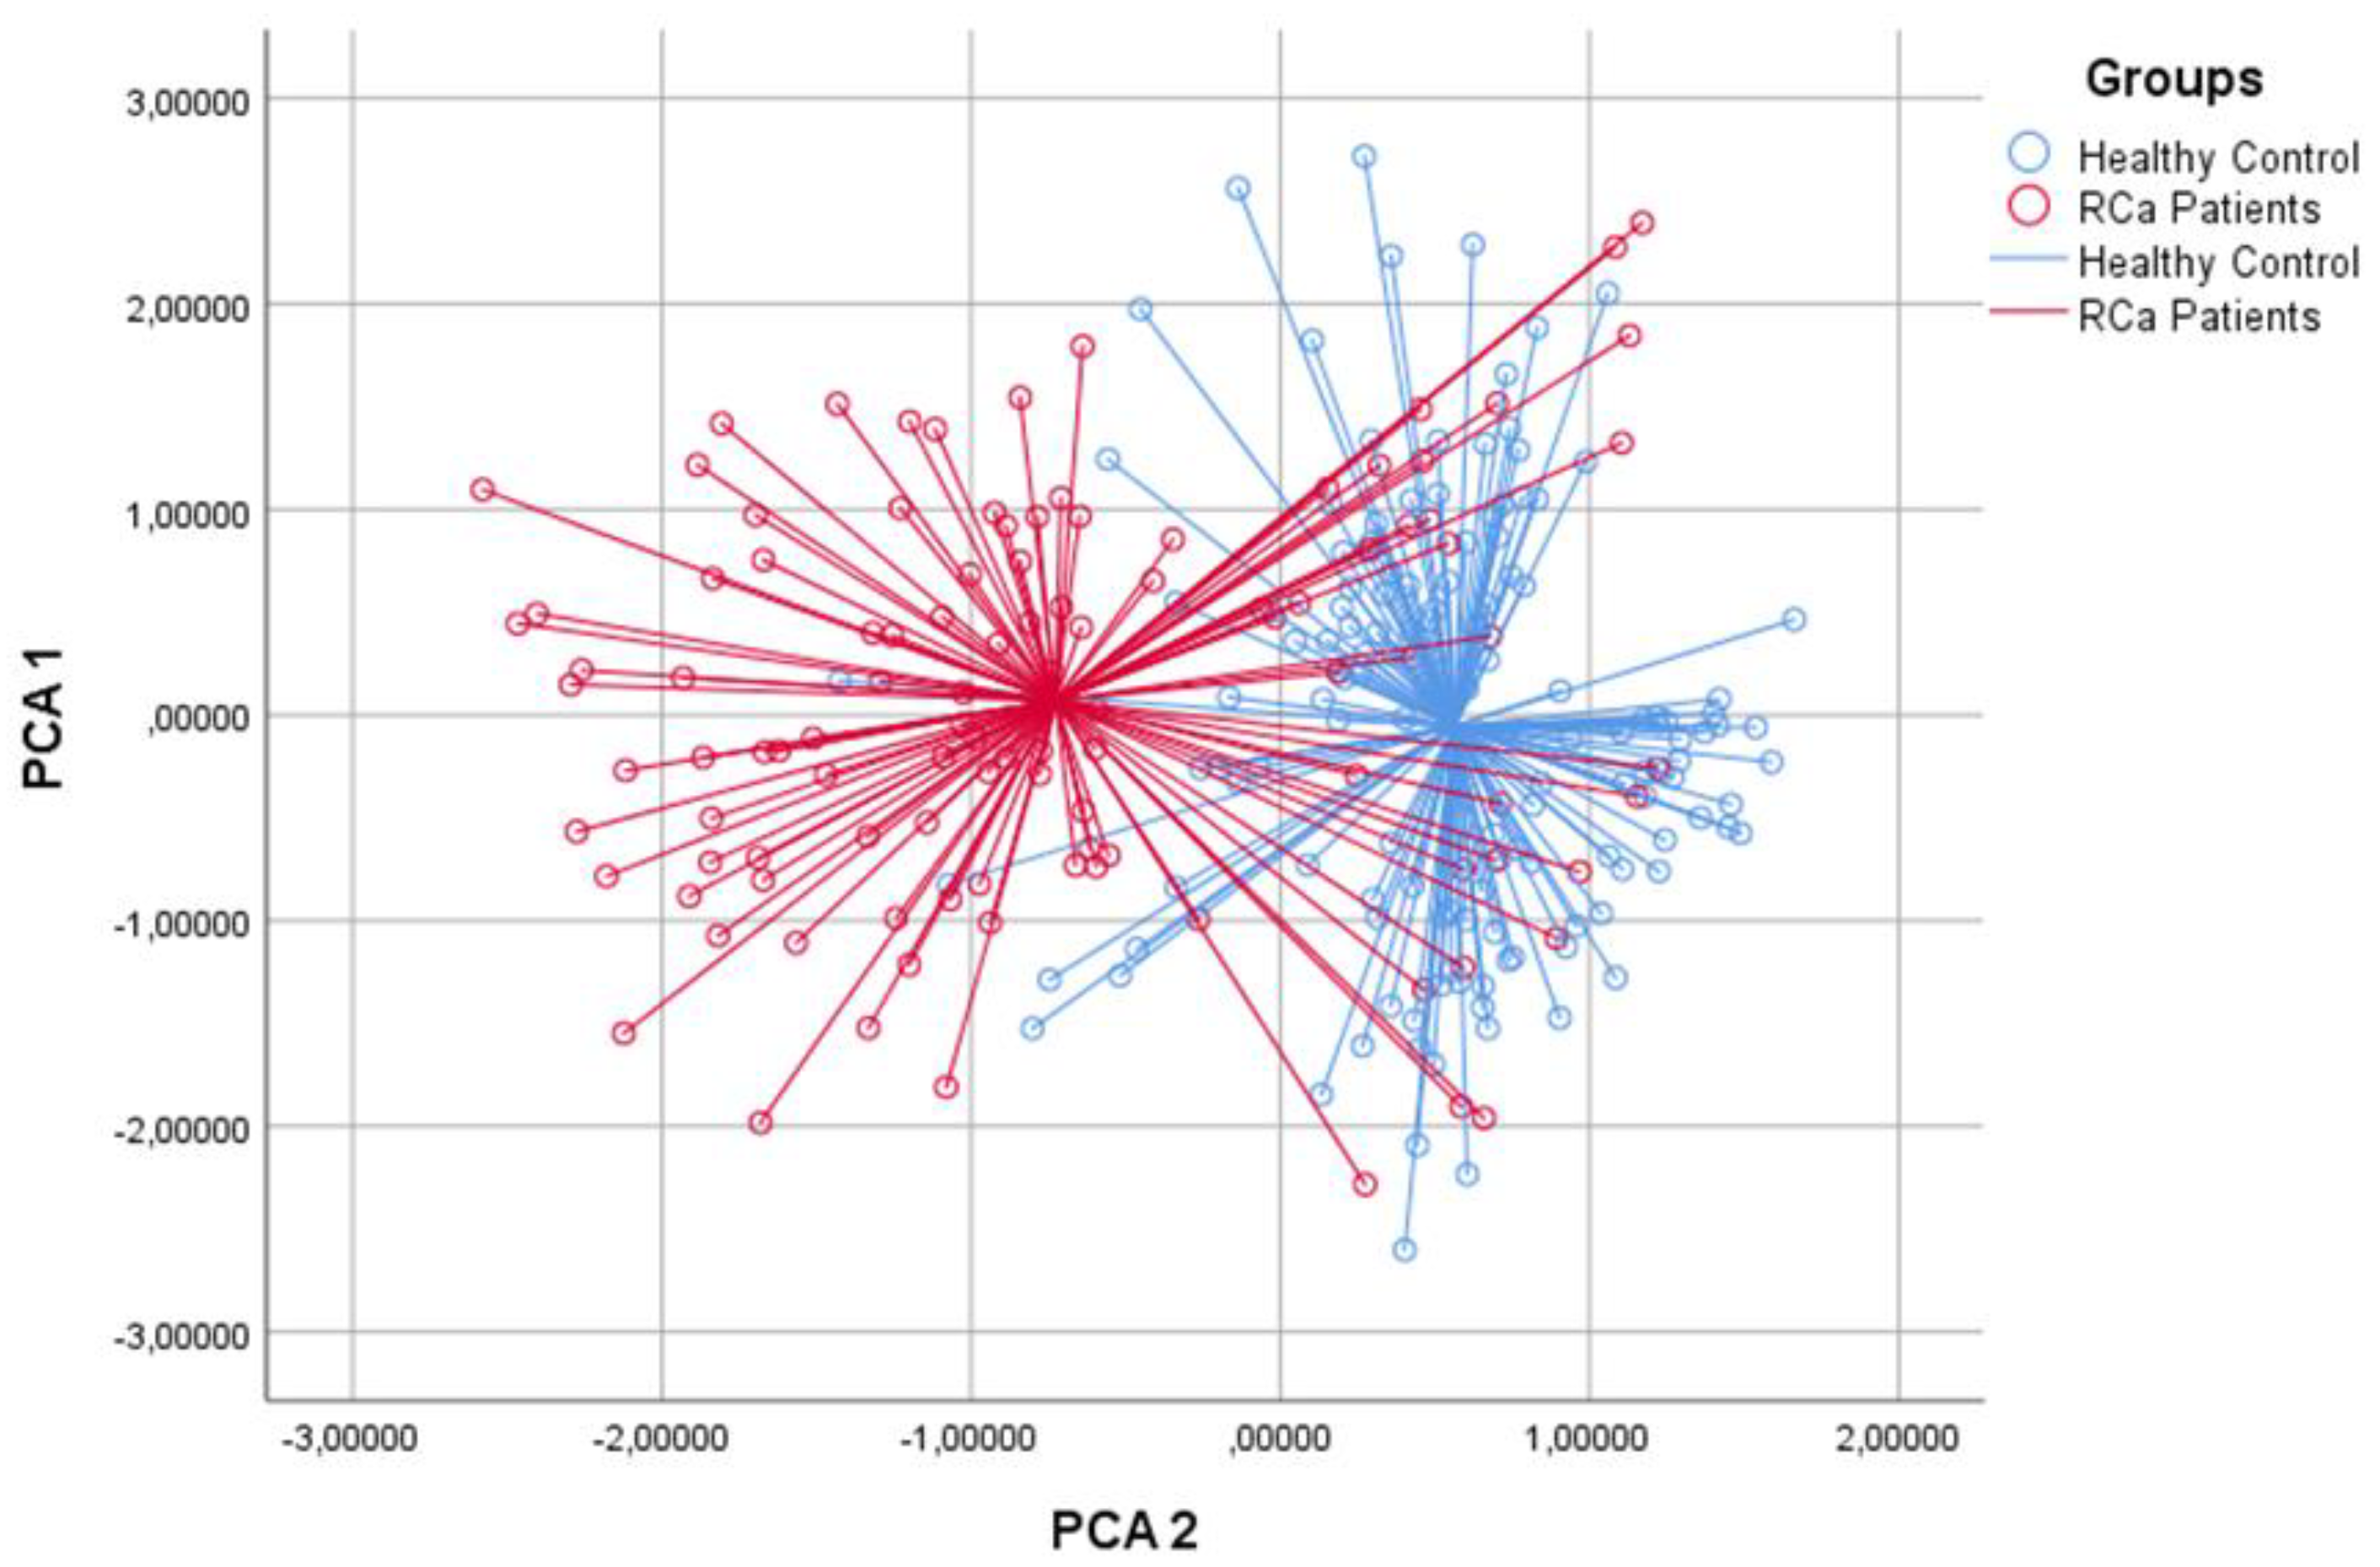
| PCA | Principal component analysis |
| CDA | Canonical discriminant analysis |
| CVA | Cross validated accuracy |
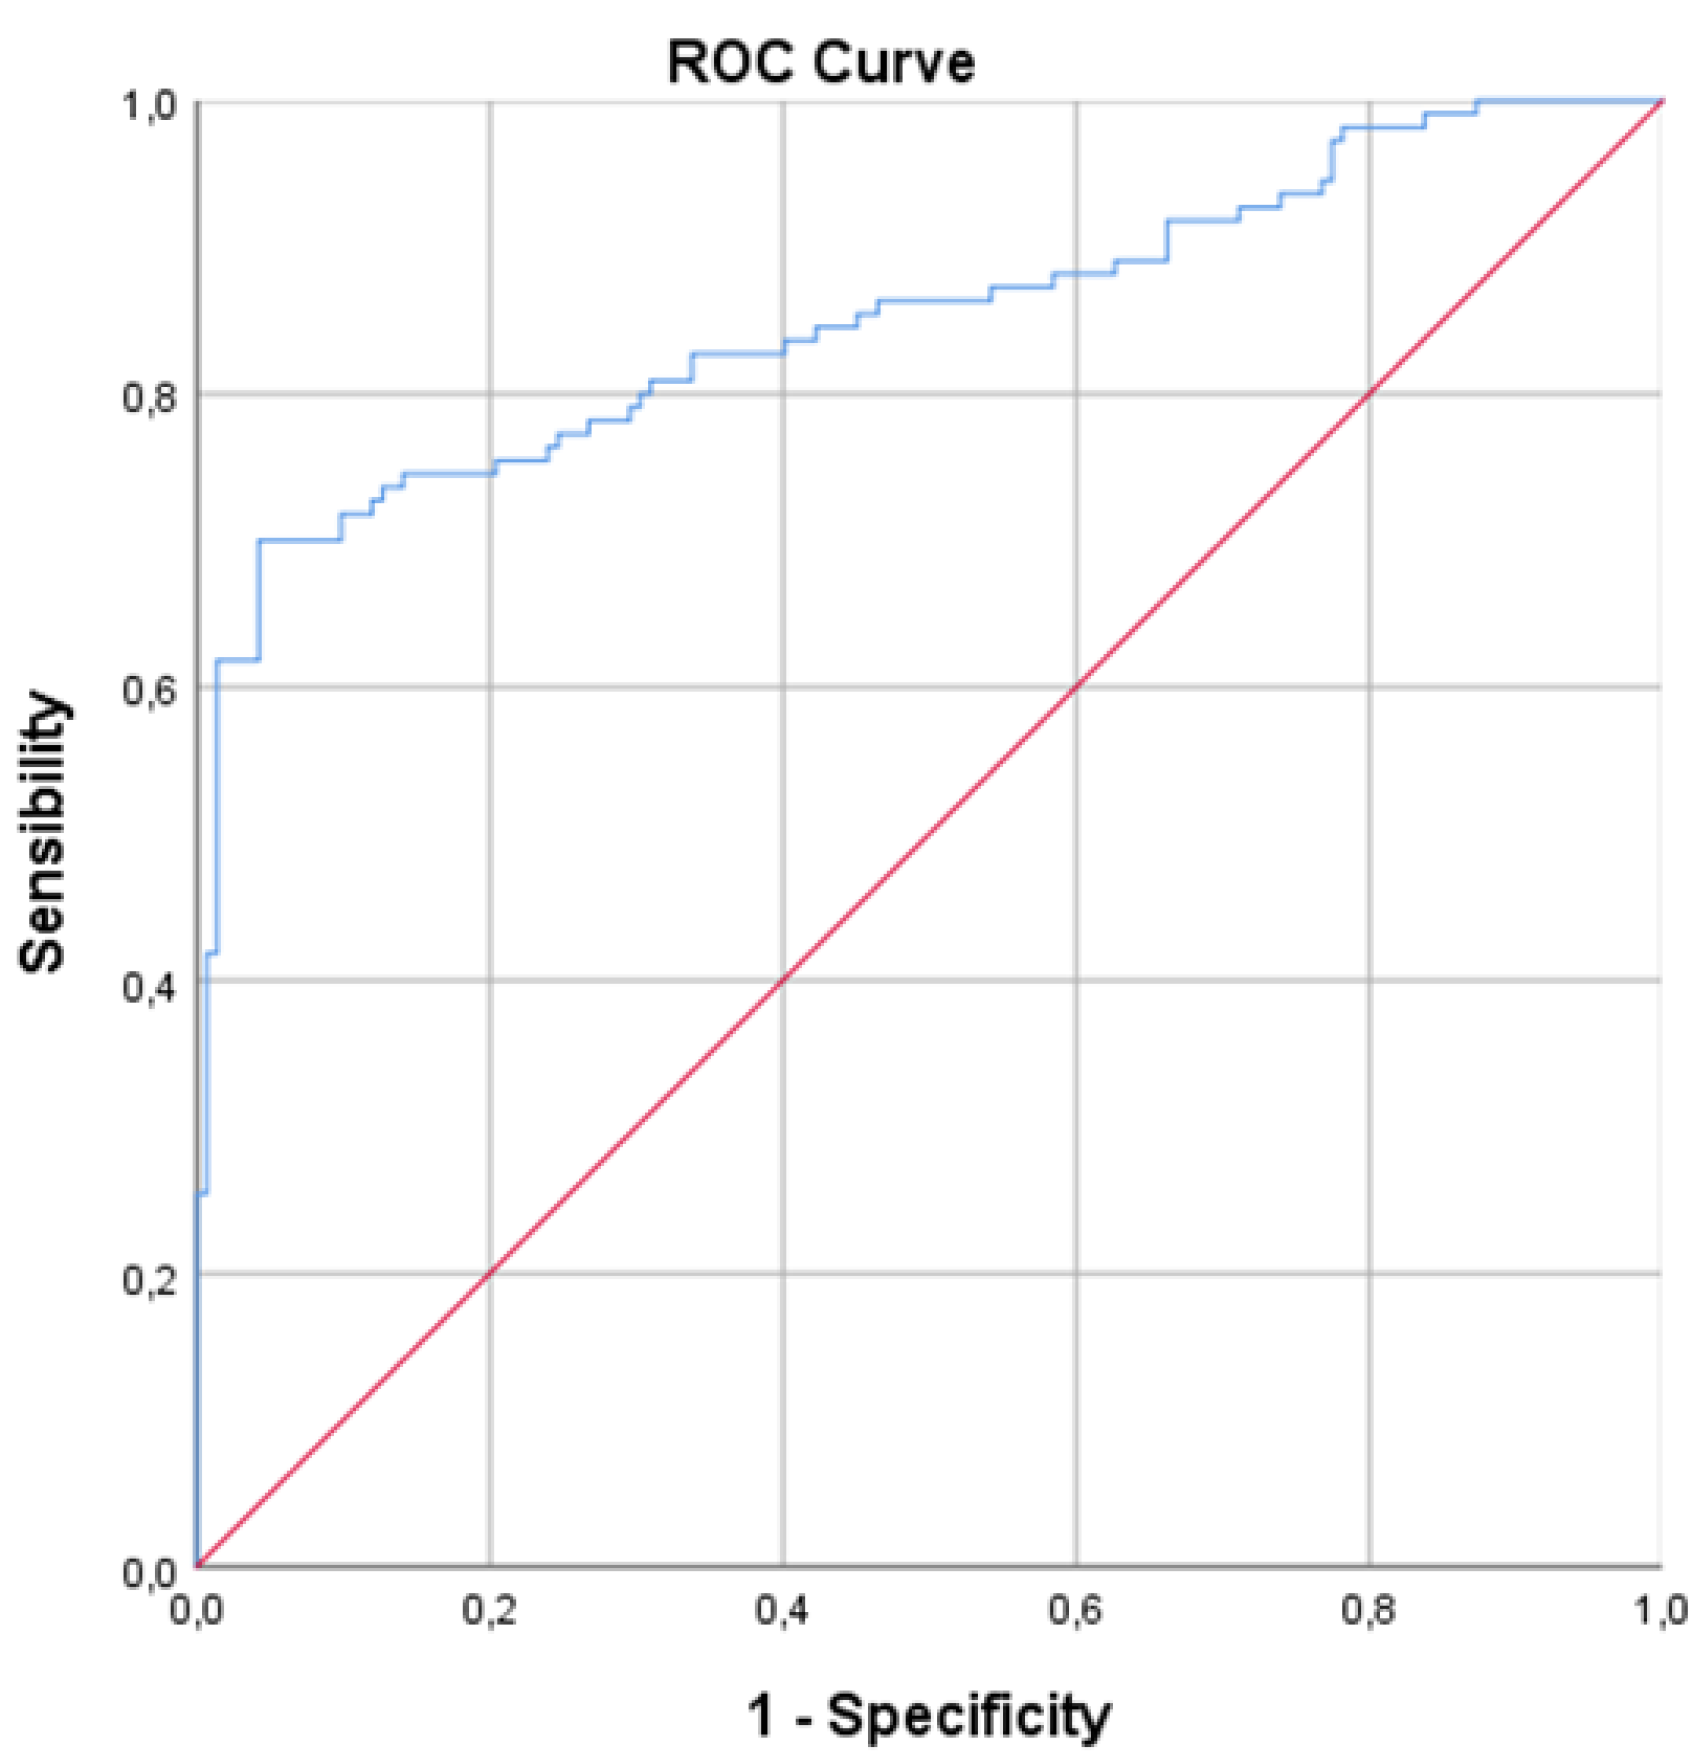
| ROC | Receiver operator curve |
| PPV | Positive prognostic value |
| NPV | Negative prognostic value |
| HC | Healthy control group |
| RCa | Renal cancer group |
References
- Siegel, R.L.; Miller, K.D.; Jemal, A. Cancer statistics, 2019. CA Cancer J. Clin. 2019, 69, 7–34. [Google Scholar] [CrossRef] [PubMed] [Green Version]
- Capitanio, U.; Bensalah, K.; Bex, A.; Boorjian, S.A.; Bray, F.; Coleman, J.; Gore, J.L.; Sun, M.; Wood, C.; Russo, P. Epidemiology of renal cell carcinoma. Eur. Urol. 2019, 75, 74–84. [Google Scholar] [CrossRef] [PubMed]
- Wen, Q.; Boshier, P.; Myridakis, A.; Belluomo, I.; Hanna, G.B. Urinary Volatile Organic Compound Analysis for the Diagnosis of Cancer: A Systematic Literature Review and Quality Assessment. Metabolites 2020, 11, 17. [Google Scholar] [CrossRef]
- Church, J.; Williams, H. Another sniffer dog for the clinic? Lancet 2001, 358, 930. [Google Scholar] [CrossRef] [PubMed]
- Gordon, R.T.; Schatz, C.B.; Myers, L.J.; Kosty, M.; Gonczy, C.; Kroener, J.; Tran, M.; Kurtzhals, P.; Heath, S.; Koziol, J.A.; et al. The Use of Canines in the Detection of Human Cancers. J. Altern. Complement. Med. 2008, 14, 61–67. [Google Scholar] [CrossRef] [PubMed]
- Gardner, J.; Bartlett, P.N. A brief history of electronic noses. Sens. Actuators B Chem. 1994, 18, 210–211. [Google Scholar] [CrossRef]
- Capelli, L.; Taverna, G.; Bellini, A.; Eusebio, L.; Buffi, N.; Lazzeri, M.; Guazzoni, G.; Bozzini, G.; Seveso, M.; Mandressi, A.; et al. Application and Uses of Electronic Noses for Clinical Diagnosis on Urine Samples: A Review. Sensors 2016, 16, 1708. [Google Scholar] [CrossRef] [Green Version]
- Wasilewski, T.; Migon, D.; Gębicki, J. Critical review of electronic nose and tongue instruments prospects in pharmaceutical analysis. Anal. Chim. Acta 2019, 1077, 14–29. [Google Scholar] [CrossRef]
- Bonah, E.; Huang, X.; Aheto, J.H.; Osae, R. Application of electronic nose as a non-invasive technique for odor fingerprinting and detection of bacterial foodborne pathogens: A review. J. Food Sci. Technol. 2020, 57, 1977–1990. [Google Scholar] [CrossRef]
- Gębicki, J.; Dymerski, T.; Namieśnik, J. Monitoring of odour nuisance from landfill using electronic nose. Chem. Eng. Trans. 2014, 40, 85–90. [Google Scholar]
- Brudzewski, K.; Osowski, S.; Pawłowski, W. Metal oxide sensor arrays for detection of explosives at sub-parts-per million concentration levels by the differential electronic nose. Sens. Actuators B Chem. 2011, 161, 528–533. [Google Scholar] [CrossRef]
- Deshmukh, S.; Bandyopadhyay, R.; Bhattacharyya, N.; Pandey, R.; Jana, A. Application of electronic nose for industrial odors and gaseous emissions measurement and monitoring—An overview. Talanta 2015, 144, 329–340. [Google Scholar] [CrossRef] [PubMed]
- Dang, L.; Tian, F.; Zhang, L.; Kadri, C.; Yin, X.; Peng, X.; Liu, S. A novel classifier ensemble for recognition of multiple in-door air contaminants by an electronic nose. Sens. Actuators B Chem. 2014, 207, 67–74. [Google Scholar] [CrossRef]
- Rosi, P.E.; Miscoria, S.A.; Bernik, D.L.; Martín Negri, R. Customized design of electronic noses placed on top of air-lift bioreac-tors for in situ monitoring the off-gas patterns. Bioprocess Biosyst. Eng. 2012, 35, 835–842. [Google Scholar] [CrossRef]
- Dragonieri, S.; Annema, J.T.; Schot, R.; van der Schee, M.P.; Spanevello, A.; Carratú, P.; Resta, O.; Rabe, K.F.; Sterk, P.J. An electronic nose in the discrimination of patients with lung cancer and COPD. Lung Cancer 2009, 64, 166–170. [Google Scholar] [CrossRef]
- Filianoti, A.; Costantini, M.; Bove, A.M.; Anceschi, U.; Brassetti, A.; Ferriero, M.; Mastroianni, R.; Misuraca, L.; Tuderti, G.; Ciliberto, G.; et al. Volatilome Analysis in Prostate Cancer by Electronic Nose: A Pilot Monocentric Study. Cancers 2022, 14, 2927. [Google Scholar] [CrossRef]
- Lewis, N.S. Comparisons between Mammalian and Artificial Olfaction Based on Arrays of Carbon Black−Polymer Composite Vapor Detectors. Acc. Chem. Res. 2004, 37, 663–672. [Google Scholar] [CrossRef]
- Broadhurst, D.I.; Kjell, D.B. Statistical strategies for avoiding false discoveries in metabolomics and related experiments. Metabolomics 2006, 2, 171–196. [Google Scholar] [CrossRef] [Green Version]
- World Health Organization. WHO. Cancer. 2019. Available online: https://www.who.int/news-room/fact-sheets/detail/cancer (accessed on 3 February 2022).
- Blumen, H.; Fitch, K.; Polkus, V. Comparison of Treatment Costs for Breast Cancer, by Tumor Stage and Type of Service. Am. Health Drug Benefits 2016, 9, 23–32. [Google Scholar]
- Cipriano, L.E.; Romanus, D.; Earle, C.C.; Neville, B.A.; Halpern, E.F.; Gazelle, G.S.; McMahon, P.M. Lung cancer treatment costs, including patient responsibility, by disease stage and treatment modality, 1992 to 2003. Value Health 2011, 14, 41–52. [Google Scholar] [CrossRef] [Green Version]
- Brassetti, A.; Anceschi, U.; Bertolo, R.; Ferriero, M.; Tuderti, G.; Capitanio, U.; Larcher, A.; Garisto, J.; Antonelli, A.; Mottire, A.; et al. Surgical quality, cancer control and functional preservation: Introducing a novel trifecta for robot-assisted partial nephrectomy. Minerva Urol. Nefrol. 2020, 72, 82–90. [Google Scholar] [CrossRef]
- Gallucci, M.; Guaglianone, S.; Carpanese, L.; Papalia, R.; Simone, G.; Forestiere, E.; Leonardo, C. Superselective embolization as first step of laparoscopic partial nephrectomy. Urology 2007, 69, 642–645, discussion 645–646. [Google Scholar] [CrossRef] [PubMed]
- Simone, G.; Papalia, R.; Guaglianone, S.; Forestiere, E.; Gallucci, M. Preoperative superselective transarterial embolization in laparoscopic partial nephrectomy: Technique, oncologic, and functional outcomes. J. Endourol. 2009, 23, 1473–1478. [Google Scholar] [CrossRef] [PubMed]
- Frantzi, M.; Metzger, J.; Banks, R.E.; Husi, H.; Klein, J.; Dakna, M.; Mullen, W.; Cartledge, J.J.; Schanstra, J.P.; Brand, K.; et al. Discovery and validation of urinary biomarkers for detection of renal cell carcinoma. J. Proteom. 2014, 98, 44–58. [Google Scholar] [CrossRef] [PubMed]
- Murdocca, M.; Torino, F.; Pucci, S.; Costantini, M.; Capuano, R.; Greggi, C.; Polidoro, C.; Somma, G.; Pasqualetti, V.; Ketchanji Mougang, Y.; et al. Urine LOX-1 and Volatilome as Promising Tools towards the Early Detection of Renal Cancer. Cancers 2021, 13, 4213. [Google Scholar] [CrossRef]
- Petrozza, V.; Pastore, A.L.; Palleschi, G.; Tito, C.; Porta, N.; Ricci, S.; Marigliano, C.; Costantini, M.; Simone, G.; Di Carlo, A.; et al. Secreted miR-210-3p as non-invasive biomarker in clear cell renal cell carcinoma. Oncotarget 2017, 8, 69551–69558. [Google Scholar] [CrossRef] [PubMed] [Green Version]
- Pastore, A.L.; Palleschi, G.; Silvestri, L.; Moschese, D.; Ricci, S.; Petrozza, V.; Carbone, A.; Di Carlo, A. Serum and urine biomarkers for human renal cell carcinoma. Dis. Markers 2015, 2015, 251403. [Google Scholar] [CrossRef] [Green Version]
- Yong, C.; Stewart, G.D.; Frezza, C. Oncometabolites in renal cancer: Warburg’s hypothesis re-examined. Nat. Rev. Nephrol. 2020, 16, 156–172. [Google Scholar] [CrossRef]
- Serasanambati, M.; Broza, Y.; Marmur, A.; Haick, H. Profiling single cancer cells with volatolomics approach. iScience 2019, 11, 178–188. [Google Scholar] [CrossRef] [Green Version]
- Dummer, J.; Storer, M.; Swanney, M.; McEwan, M.; Scott-Thomas, A.; Bhandari, S.; Chambers, S.; Dweik, R.; Epton, M. Analysis of biogenic volatile organic compounds in human health and disease. TrAC Trends Anal. Chem. 2011, 30, 960–967. [Google Scholar] [CrossRef]
- Wilson, A.D. Noninvasive Early Disease Diagnosis by Electronic-Nose and Related VOC-Detection Devices. Biosensors 2020, 10, 73. [Google Scholar] [CrossRef] [PubMed]
- Bajaj, A.; Miranda, O.R.; Kim, I.-B.; Phillips, R.L.; Jerry, D.J.; Bunz, U.H.; Rotello, V.M. Detection and differentiation of nor-mal, cancerous, and metastatic cells using nanoparticlepolymer sensor arrays. Proc. Natl. Acad. Sci. USA 2009, 106, 10912–10916. [Google Scholar] [CrossRef] [PubMed] [Green Version]
- Ganti, S.; Weiss, R.H. Urine metabolomics for kidney cancer detection and biomarker discovery. Urol. Oncol. Semin. Orig. Investig. 2011, 29, 551–557. [Google Scholar] [CrossRef] [PubMed] [Green Version]
- Adams, F. Hippocratic Writings: Aphorism, 5th ed.; Web Atomics: New York, NY, USA, 1994. [Google Scholar]
- De Lacy Costello, B.; Ratcliffe, N.M. Volatile Organic Compounds (VOCs) Found in Urine and Stool. In Volatile Biomarkers, Non-Invasive Diagnosis in Physiology and Medicine; Amann, A., Smith, D., Eds.; Elsevier B.V.: Oxford, UK, 2013; Chapter 22; pp. 405–462. [Google Scholar]
- Lorenzo, N.; Wan, T.; Harper, R.J.; Hsu, Y.-L.; Chow, M.; Rose, S.; Furton, K.G. Laboratory and field experiments used to identify Canis lupus var. familiaris active odor signature chemicals from drugs, explosives, and humans. Anal. Bioanal. Chem. 2003, 376, 1212–1224. [Google Scholar] [CrossRef]
- Williams, H.; Pembroke, A. Sniffer dogs in the melanoma clinic? Lancet 1989, 1, 734. [Google Scholar] [CrossRef] [PubMed]
- Cornu, J.N.; Cancel-Tassin, G.; Ondet, V.; Girardet, C.; Cussenot, O. Olfactory detection of prostate cancer by dogs sniffing urine: A step forward in early diagnosis. Eur. Urol. 2011, 59, 197–201. [Google Scholar] [CrossRef]
- Taverna, G.; Tidu, L.; Grizzi, F. Sniffing out prostate cancer: A new clinical opportunity. Cent. Eur. J. Urol. 2015, 68, 308–310. [Google Scholar] [CrossRef] [Green Version]
- Willis, C.M.; Church, S.M.; Guest, C.M.; Cook, W.A.; McCarthy, N.; Bransbury, A.J.; Church, M.R.T.; Church, J.C.T. Olfactory detection of human bladder cancer by dogs: Proof of principle study. BMJ 2004, 329, 712. [Google Scholar] [CrossRef] [PubMed] [Green Version]
- Wojnowski, W.; Dymerski, T.; Gębicki, J.; Namieśnik, J. Electronic Noses in Medical Diagnostics. Curr. Med. Chem. 2019, 26, 197–215. [Google Scholar] [CrossRef] [PubMed]
- Altomare, D.F.; Di Lena, M.; Porcelli, F.; Trizio, L.; Travaglio, E.; Tutino, M.; Dragonieri, S.; Memeo, V.; de Gennaro, G. Exhaled volatile organic compounds identify patients with colorectal cancer. J. Br. Surg. 2013, 100, 144–150. [Google Scholar] [CrossRef]
- Ikeda, A.; Nishiumi, S.; Shinohara, M.; Yoshie, T.; Hatano, N.; Okuno, T.; Bamba, T.; Fukusaki, E.; Takenawa, T.; Azuma, T.; et al. Serum metabolomics as a novel diagnostic approach for gastrointestinal cancer. Biomed. Chromatogr. 2012, 26, 548–558. [Google Scholar] [CrossRef] [PubMed]
- Wu, H.; Xue, R.; Dong, L.; Liu, T.; Deng, C.; Zeng, H.; Shen, X. Metabolomic profiling of human urine in hepatocellular carcinoma patients using gas chromatography/mass spectrometry. Anal. Chim. Acta 2009, 648, 98–104. [Google Scholar] [CrossRef] [PubMed]
- Filipiak, W.; Sponring, A.; Mikoviny, T.; Ager, C.; Schubert, J.; Miekisch, W.; Amann, A.; Troppmair, J. Release of volatile organic compounds (VOCs) from the lung cancer cell line CALU-1 in vitro. Cancer Cell Int. 2008, 8, 172008. [Google Scholar] [CrossRef] [PubMed] [Green Version]
- Nakhleh, M.K.; Amal, H.; Jeries, R.; Broza, Y.Y.; Aboud, M.; Gharra, A.; Ivgi, H.; Khatib, S.; Badarneh, S.; Har-Shai, L.; et al. Diagnosis and classification of 17 diseases from 1404 subjects via pattern analysis of exhaled molecules. ACS Nano 2017, 11, 112–125. [Google Scholar] [CrossRef] [PubMed] [Green Version]
- Wang, D.; Wang, C.; Pi, X.; Guo, L.; Wang, Y.; Li, M.; Feng, Y.; Lin, Z.; Hou, W.; Li, E. Urinary volatile organic compounds as potential biomarkers for renal cell carcinoma. Biomed. Rep. 2016, 5, 68–72. [Google Scholar] [CrossRef] [Green Version]
- Pinto, J.; Amaro, F.; Lima, A.R.; Carvalho-Maia, C.; Jerónimo, C.; Henrique, R.; Bastos, M.D.L.; Carvalho, M.; Guedes de Pinho, P. Urinary Volatilomics Unveils a Candidate Biomarker Panel for Noninvasive Detection of Clear Cell Renal Cell Carcinoma. J. Proteome Res. 2021, 20, 3068–3077. [Google Scholar] [CrossRef]
- Thorn, R.M.S.; Greenman, J. Microbial volatile compounds in health and disease conditions. J. Breath Res. 2012, 6, 024001. [Google Scholar] [CrossRef]
- Furrer, M.A.; Spycher, S.C.; Buettiker, S.M.; Gross, T.; Bosshard, P.; Thalmann, G.N.; Schneider, M.P.; Roth, B. Comparison of the Diagnostic Performance of Contrast-enhanced Ultrasound with That of Contrast-enhanced Computed Tomography and Contrast-enhanced Magnetic Resonance Imaging in the Evaluation of Renal Masses: A Systematic Review and Meta-analysis. Eur. Urol. Oncol. 2020, 3, 464–473. [Google Scholar] [CrossRef] [Green Version]


| RCa Cohort | HC Cohort | p–Value | |
|---|---|---|---|
| N | 110 | 142 | |
| Age (years), mean ± SD (range) | 64.53 ± 11.72 (36–86) | 63.05 ± 14.27 (40–99) | 0.378 |
| Smokers, N (%) | 29 (26.3%) | 31 (21.8%) | 0.404 |
| Comorbidities, N (%) | |||
| 70 (63.6%) | 75 (52.8%) | 0.202 |
| 5 (4.5%) | 2 (1.4%) | 0.133 |
| 4 (2.6%) | 3 (2.1%) | 0.74 |
| 31 (28.1%) | 29 (20.4%) | 0.152 |
| TNM Stage | n. (%) | ISUP Grade | n. (%) |
|---|---|---|---|
| T1a | 46 (30.6) | 1 | 8 |
| T1b | 30 (20) | 2 | 55 |
| T2a | 5 (3.3) | 3 | 22 |
| T2b | 5 (3.3) | 4 | 4 |
| T3a | 23 (15.3) | (only ccRCC) | 89 |
| T3b | 1 (0.6) | ||
| T3c | 0 (0) | ||
| T4 | 0 (0) | ||
| Total | 110 (73.3) |
| Expected Group Membership | ||||
|---|---|---|---|---|
| Group | HC | RCa | Total | |
| Count | HC | 127 | 15 | 142 |
| RCa | 31 | 79 | 110 | |
| % | HC | 89.4 | 10.6 | 100 |
| RCa | 28.2 | 71.8 | 100 | |
Disclaimer/Publisher’s Note: The statements, opinions and data contained in all publications are solely those of the individual author(s) and contributor(s) and not of MDPI and/or the editor(s). MDPI and/or the editor(s) disclaim responsibility for any injury to people or property resulting from any ideas, methods, instructions or products referred to in the content. |
© 2023 by the authors. Licensee MDPI, Basel, Switzerland. This article is an open access article distributed under the terms and conditions of the Creative Commons Attribution (CC BY) license (https://creativecommons.org/licenses/by/4.0/).
Share and Cite
Costantini, M.; Filianoti, A.; Anceschi, U.; Bove, A.M.; Brassetti, A.; Ferriero, M.; Mastroianni, R.; Misuraca, L.; Tuderti, G.; Ciliberto, G.; et al. Human Urinary Volatilome Analysis in Renal Cancer by Electronic Nose. Biosensors 2023, 13, 427. https://doi.org/10.3390/bios13040427
Costantini M, Filianoti A, Anceschi U, Bove AM, Brassetti A, Ferriero M, Mastroianni R, Misuraca L, Tuderti G, Ciliberto G, et al. Human Urinary Volatilome Analysis in Renal Cancer by Electronic Nose. Biosensors. 2023; 13(4):427. https://doi.org/10.3390/bios13040427
Chicago/Turabian StyleCostantini, Manuela, Alessio Filianoti, Umberto Anceschi, Alfredo Maria Bove, Aldo Brassetti, Mariaconsiglia Ferriero, Riccardo Mastroianni, Leonardo Misuraca, Gabriele Tuderti, Gennaro Ciliberto, and et al. 2023. "Human Urinary Volatilome Analysis in Renal Cancer by Electronic Nose" Biosensors 13, no. 4: 427. https://doi.org/10.3390/bios13040427