Immunotechniques for the Group Determination of Macrolide Antibiotics Traces in the Environment Using a Volume-Mediated Sensitivity Enhancement Strategy

 , ,
, ,
Abstract
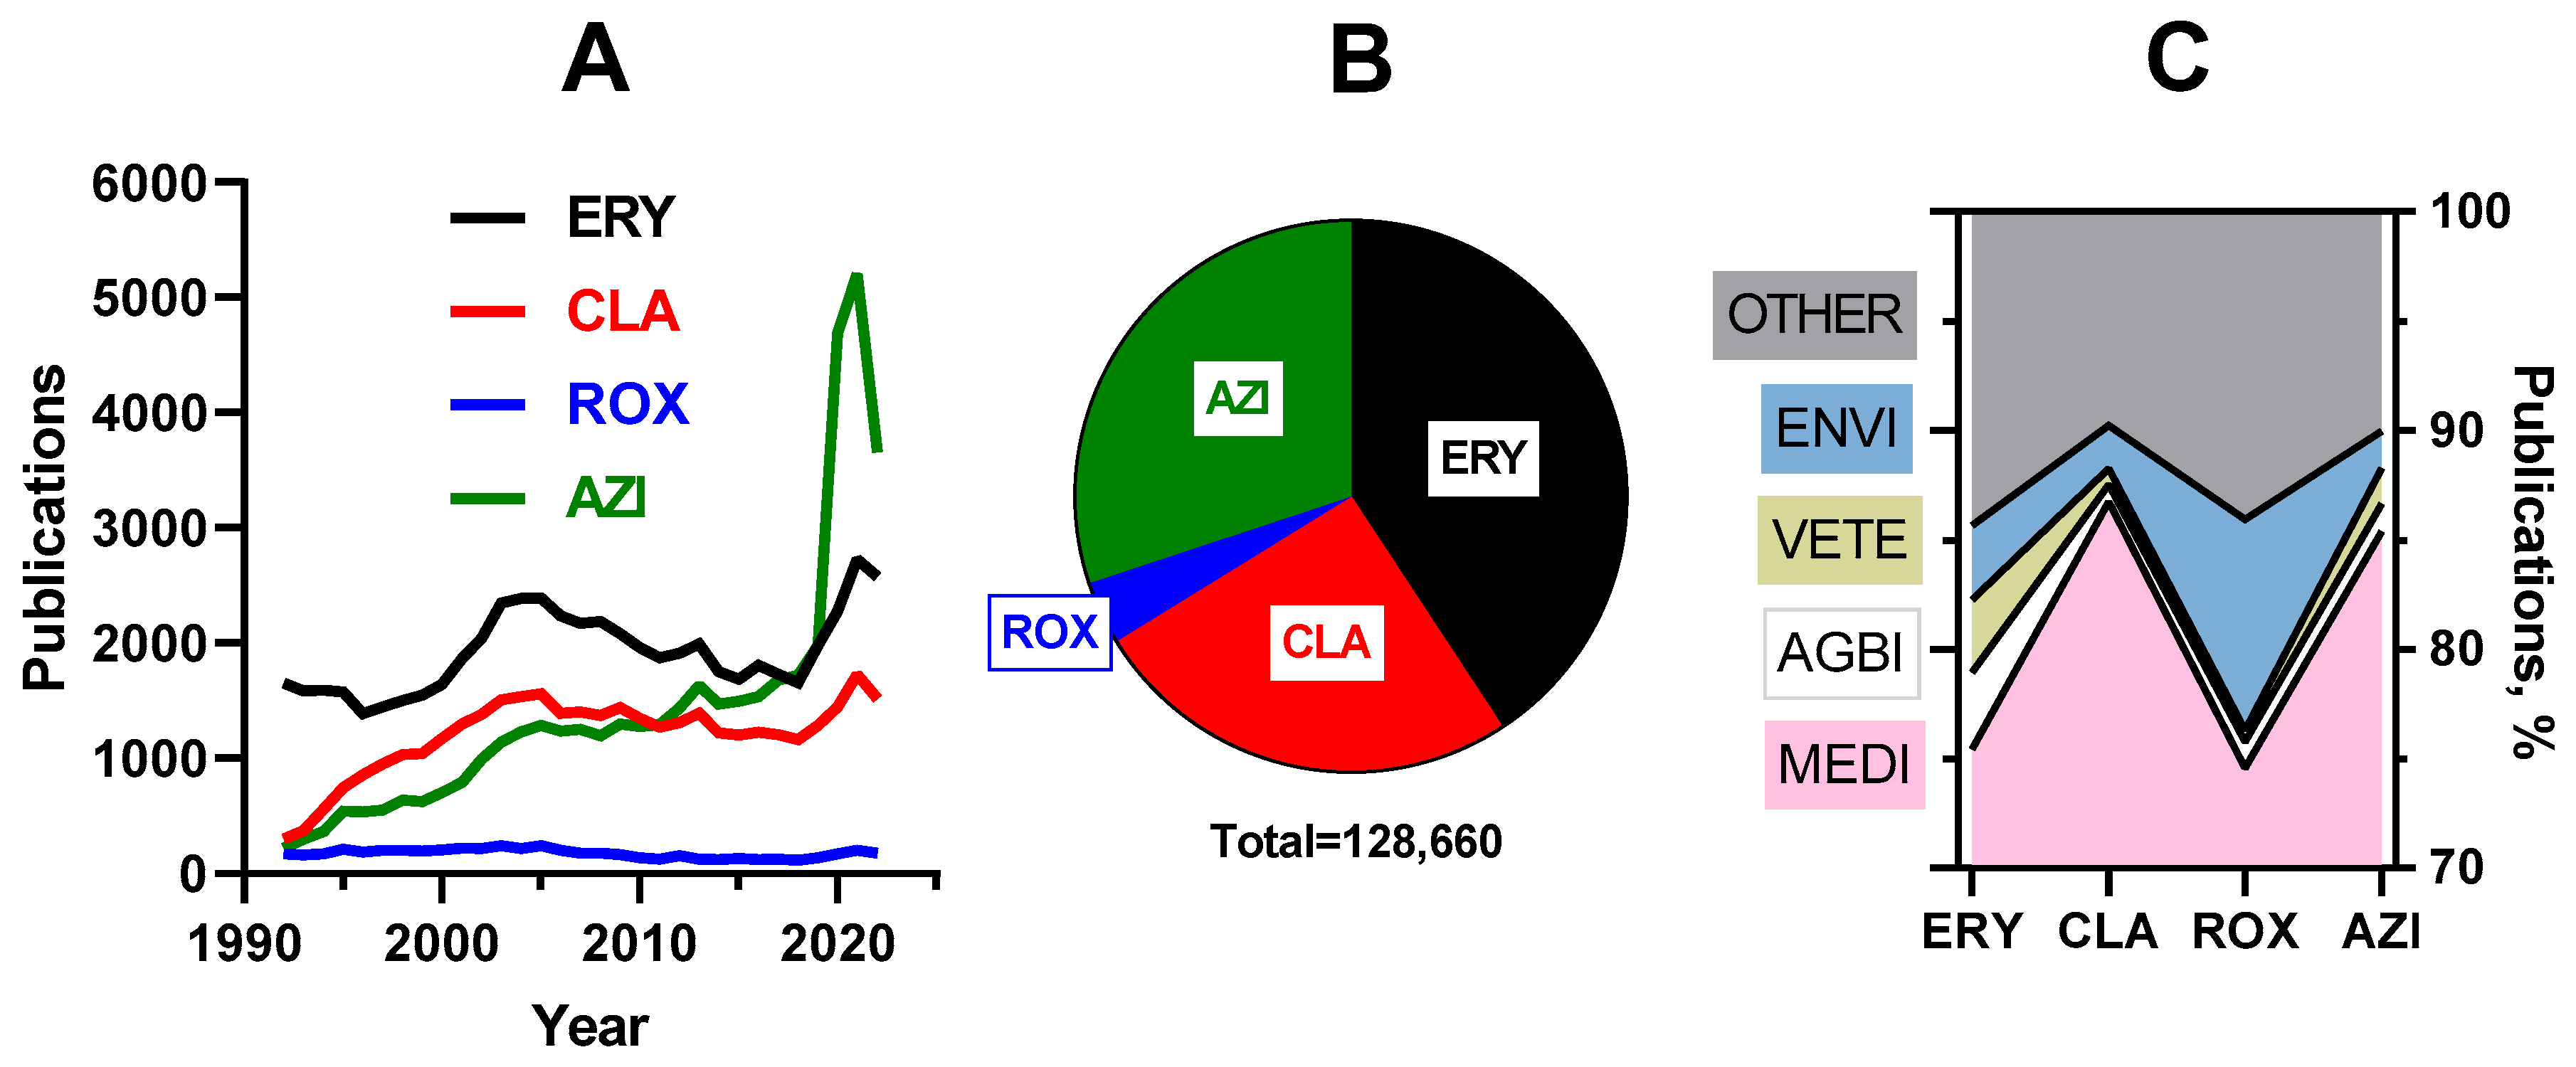
:1. Introduction
2. Methods
2.1. Chemicals and Reagents
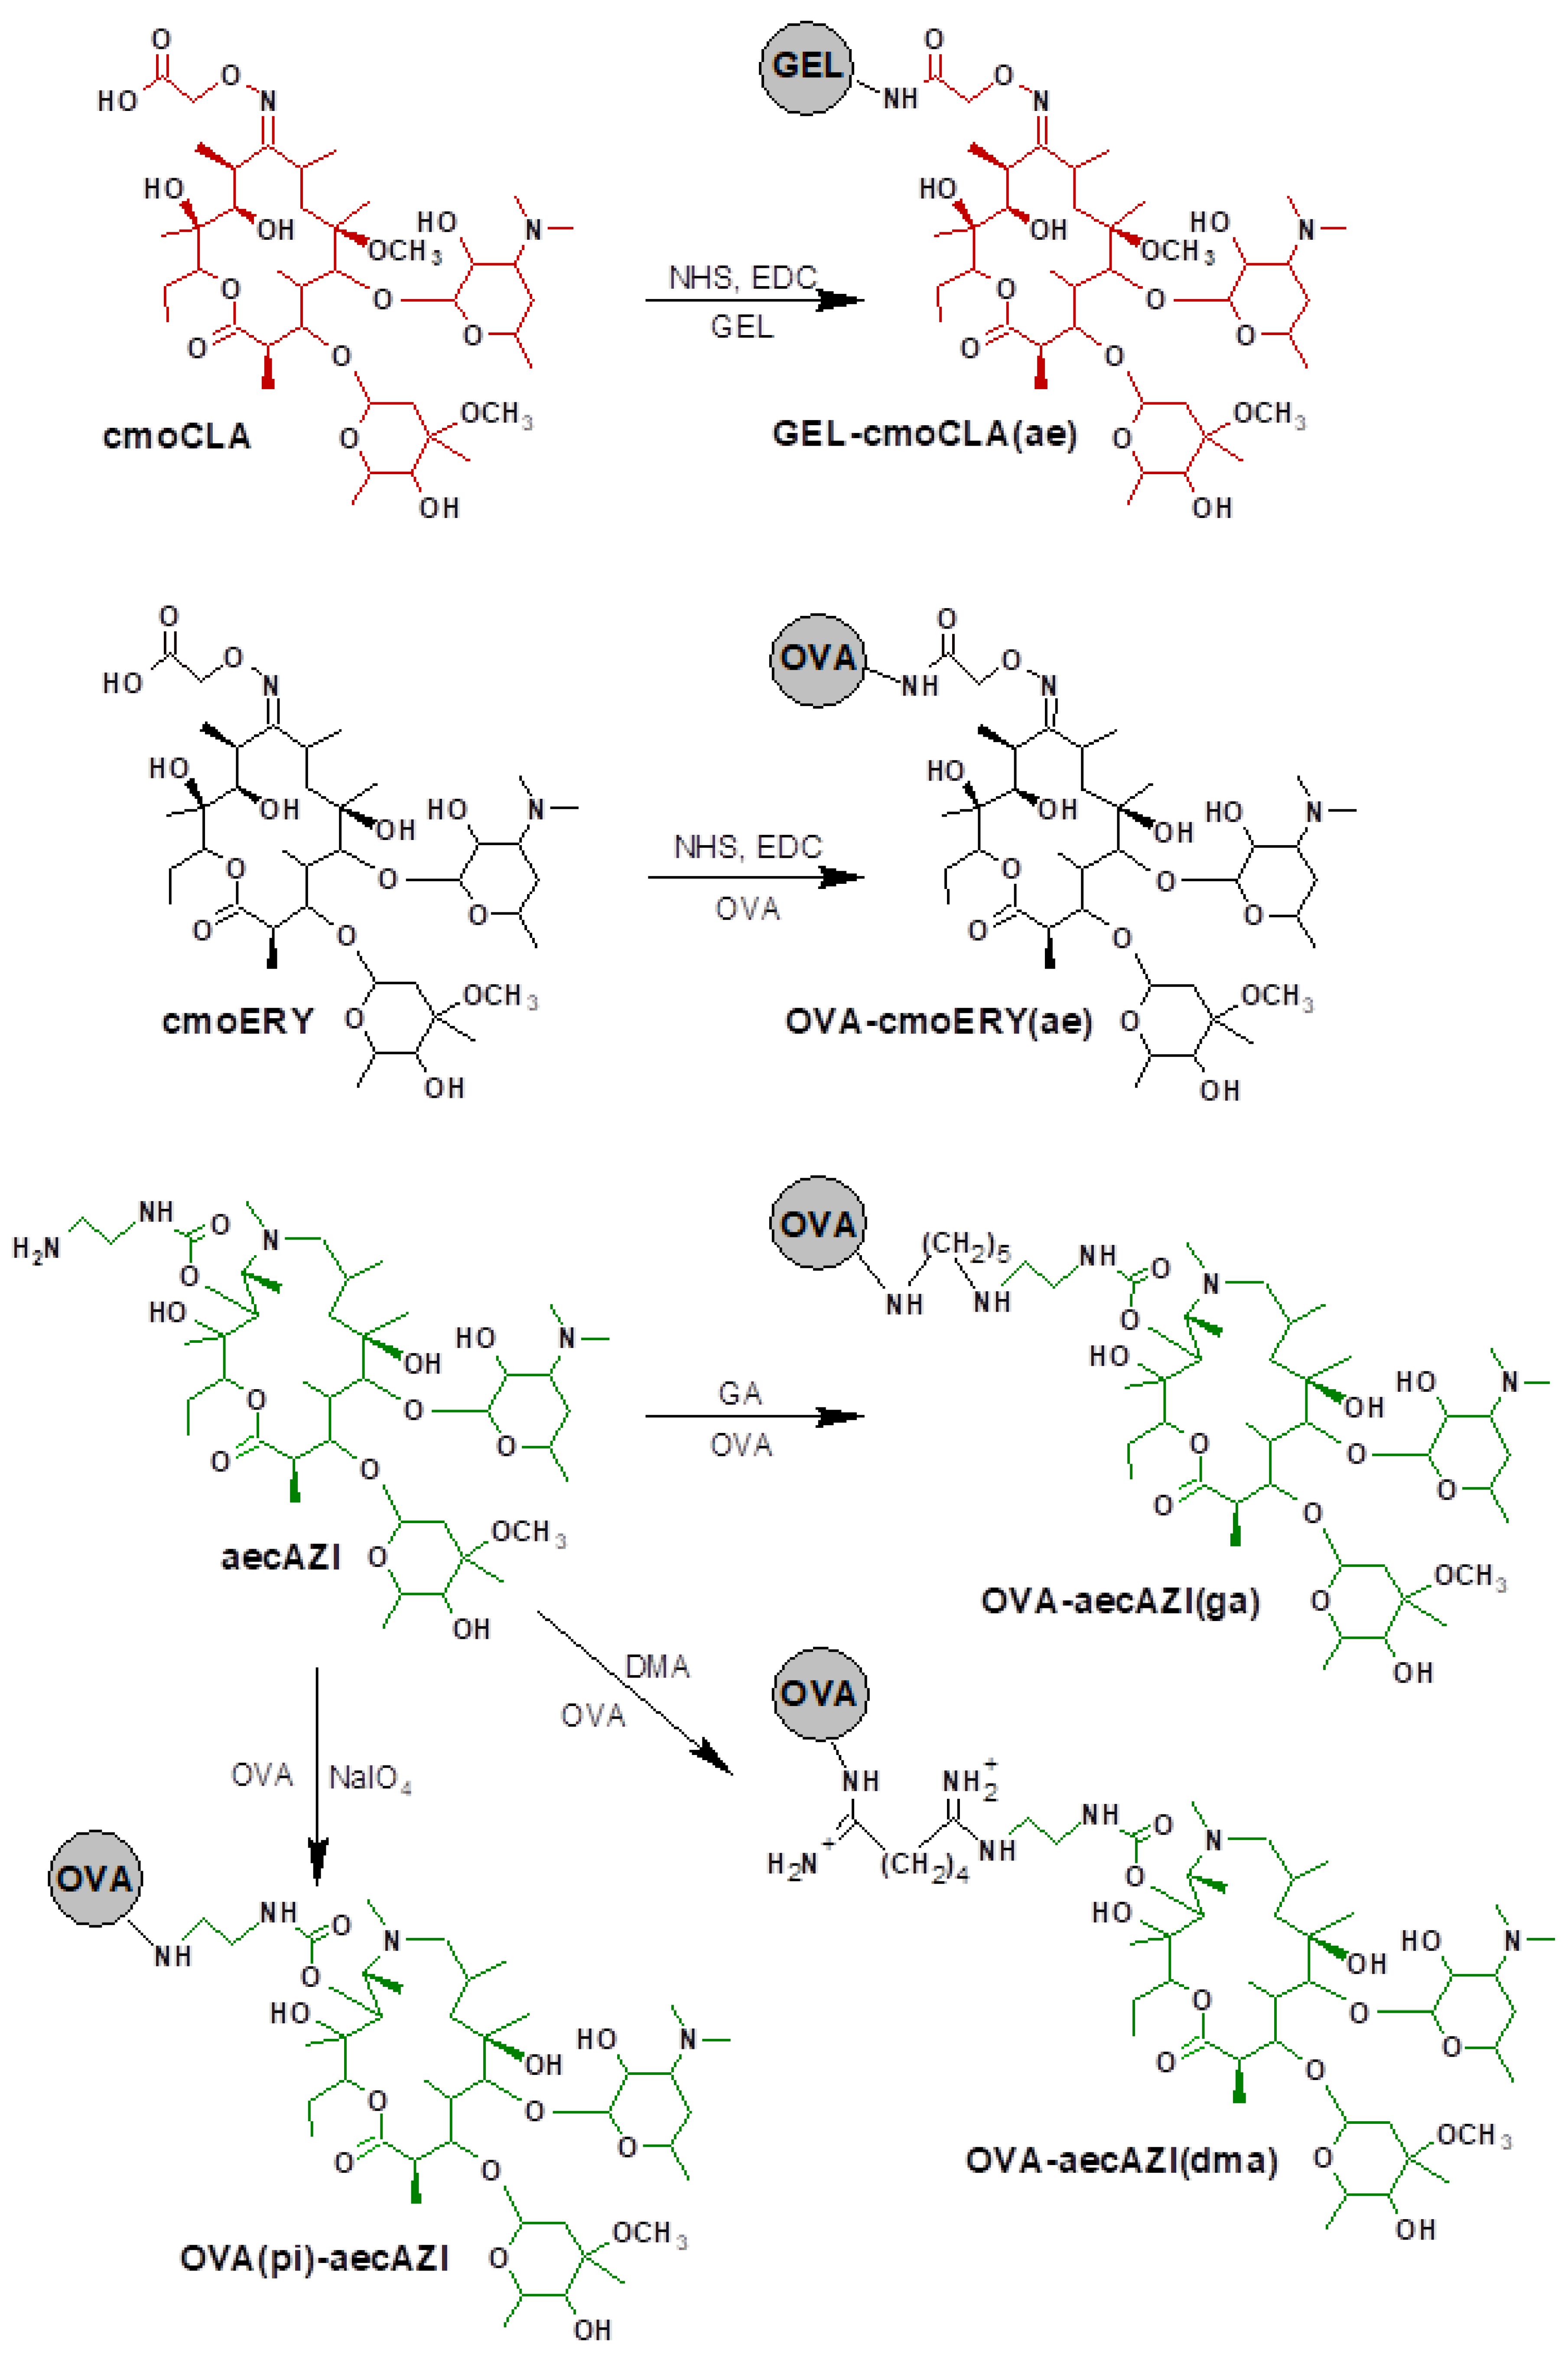
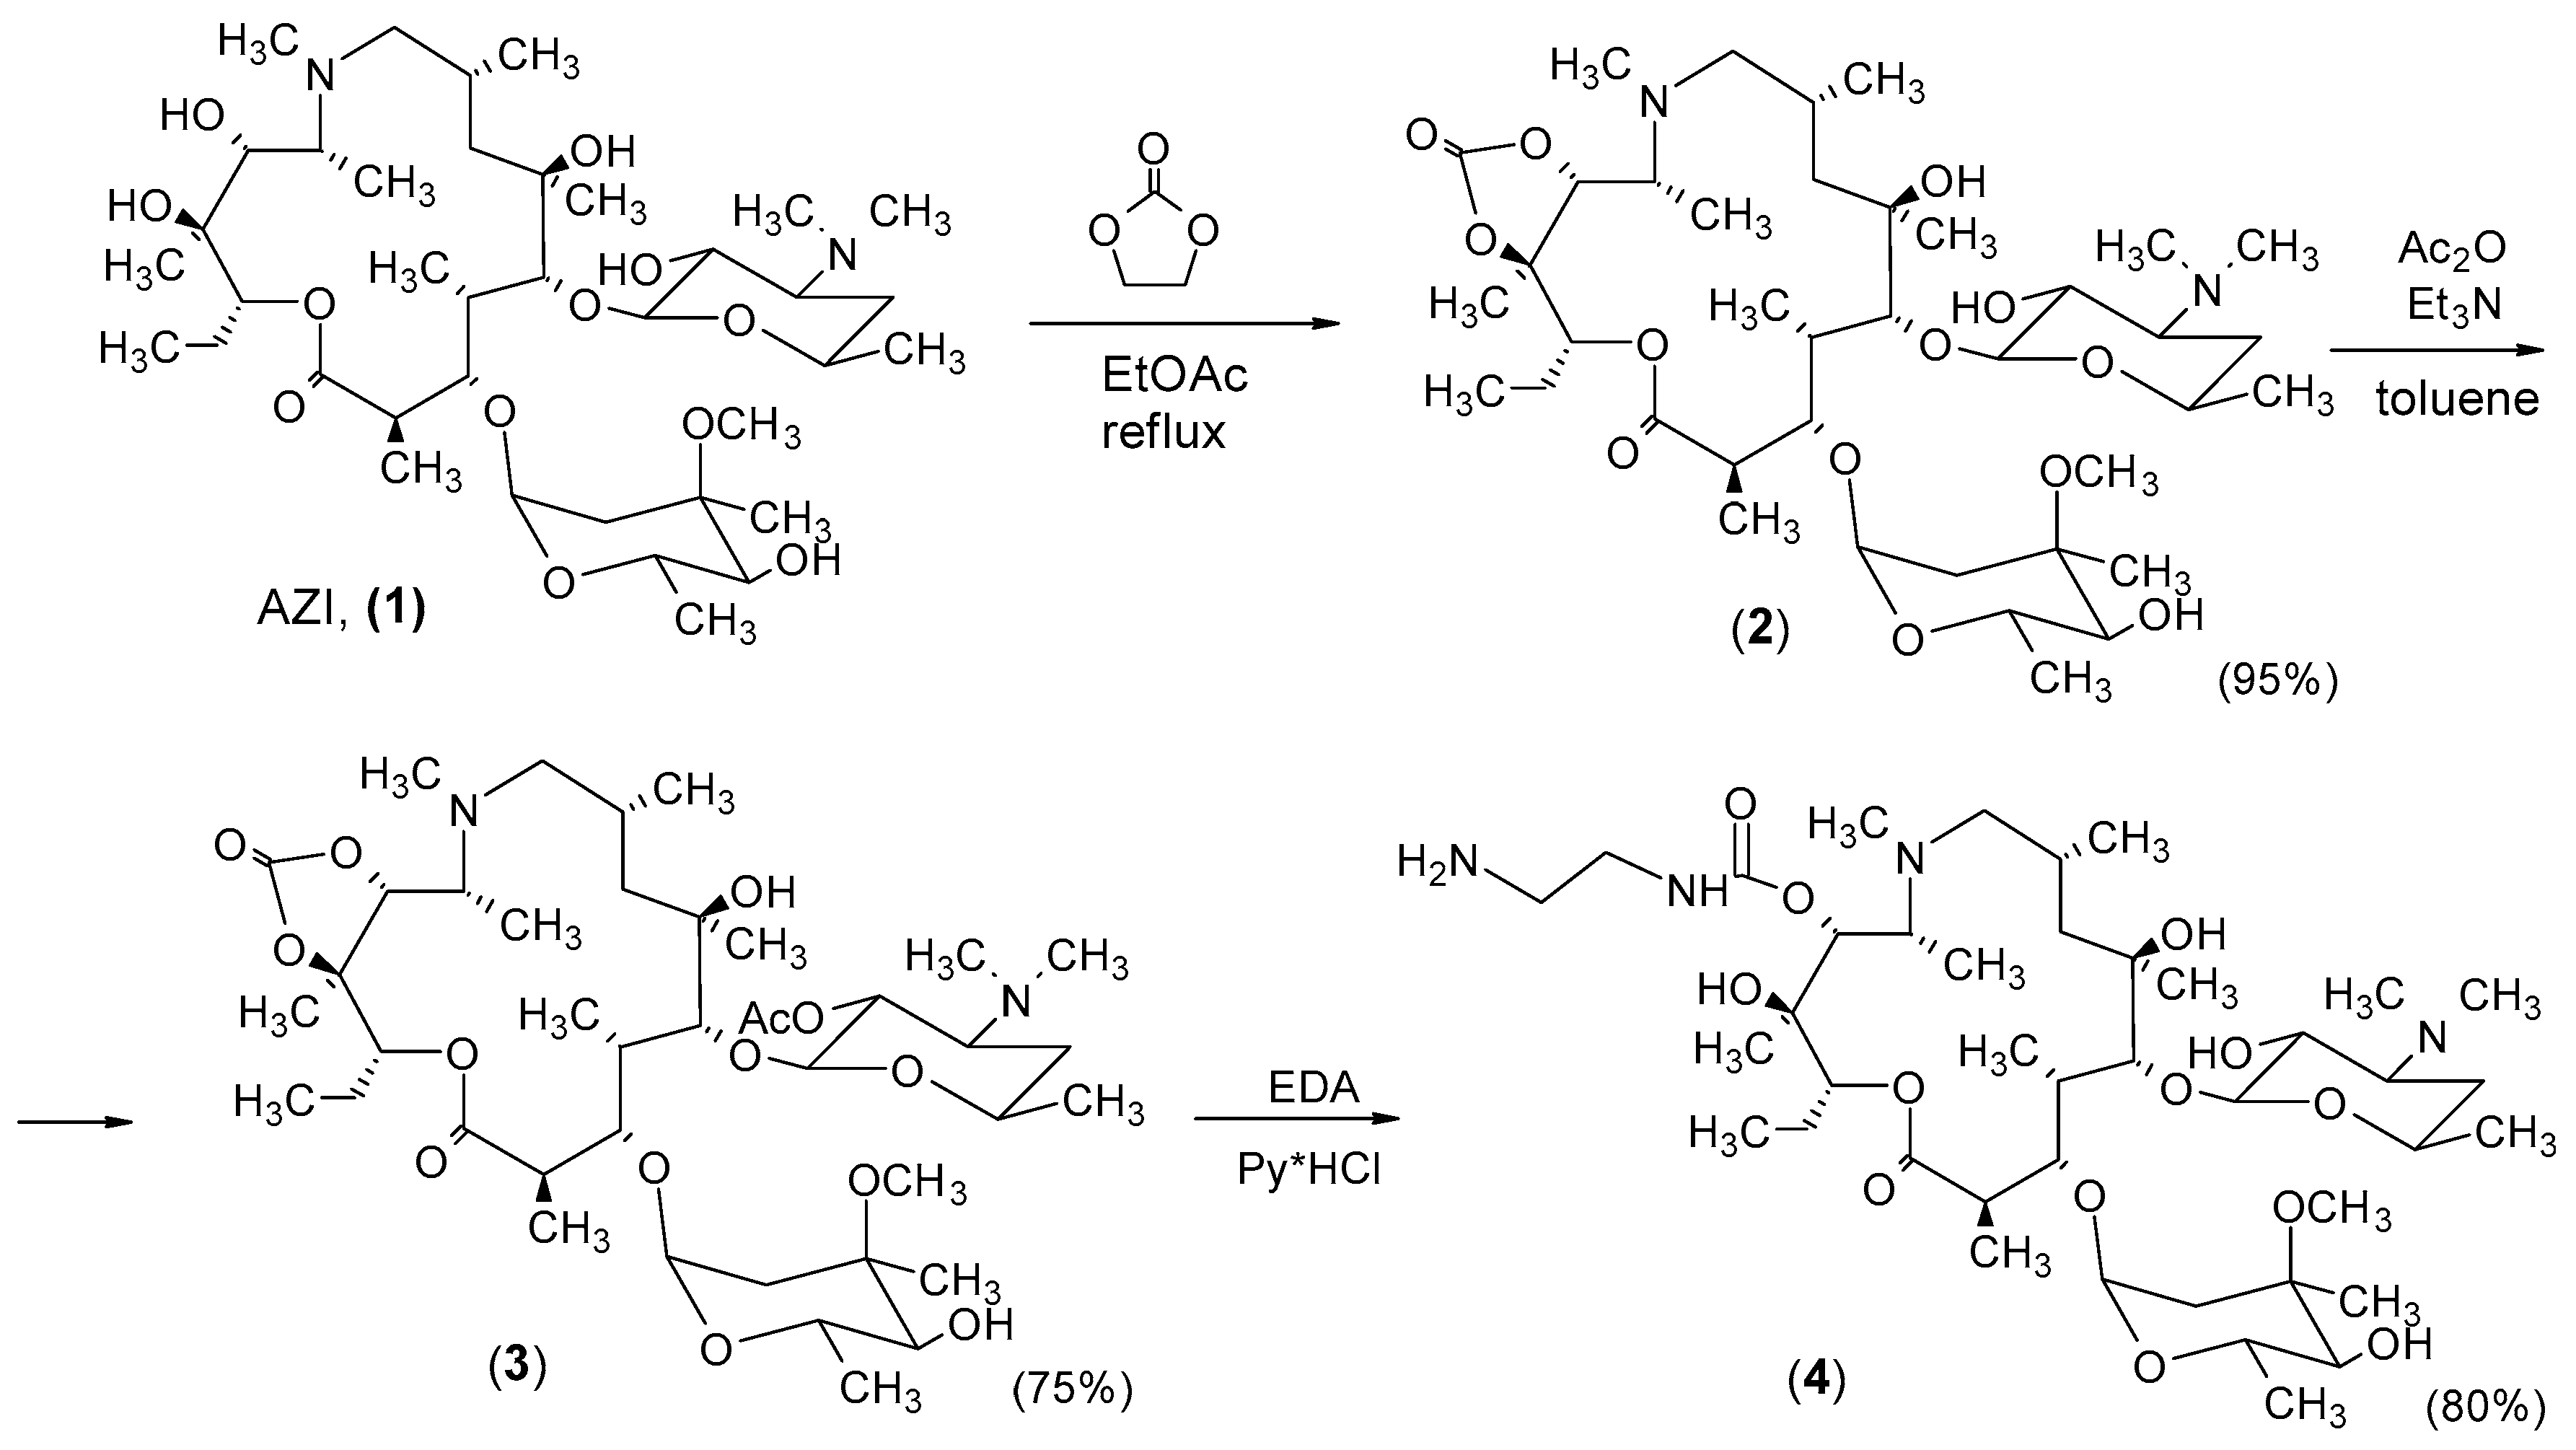
2.2. Hapten Synthesis
2.3. Preparation of Coating Antigens
2.4. Indirect Competitive Enzyme-Linked Immunosorbent Assay (icELISA)
2.5. HRP-Labeled Antigen Preparation
2.6. Immunosorbent Preparation
2.7. Direct Competitive Assay Formats
2.8. Sample Pretreatment and Analysis
3. Results and Discussion
3.1. Synthesis of Haptens
3.2. Preparation of Conjugated Antigens
3.3. Specificity and Sensitivity of the Developed ELISA Variants
3.4. Direct Competitive Assay Formats
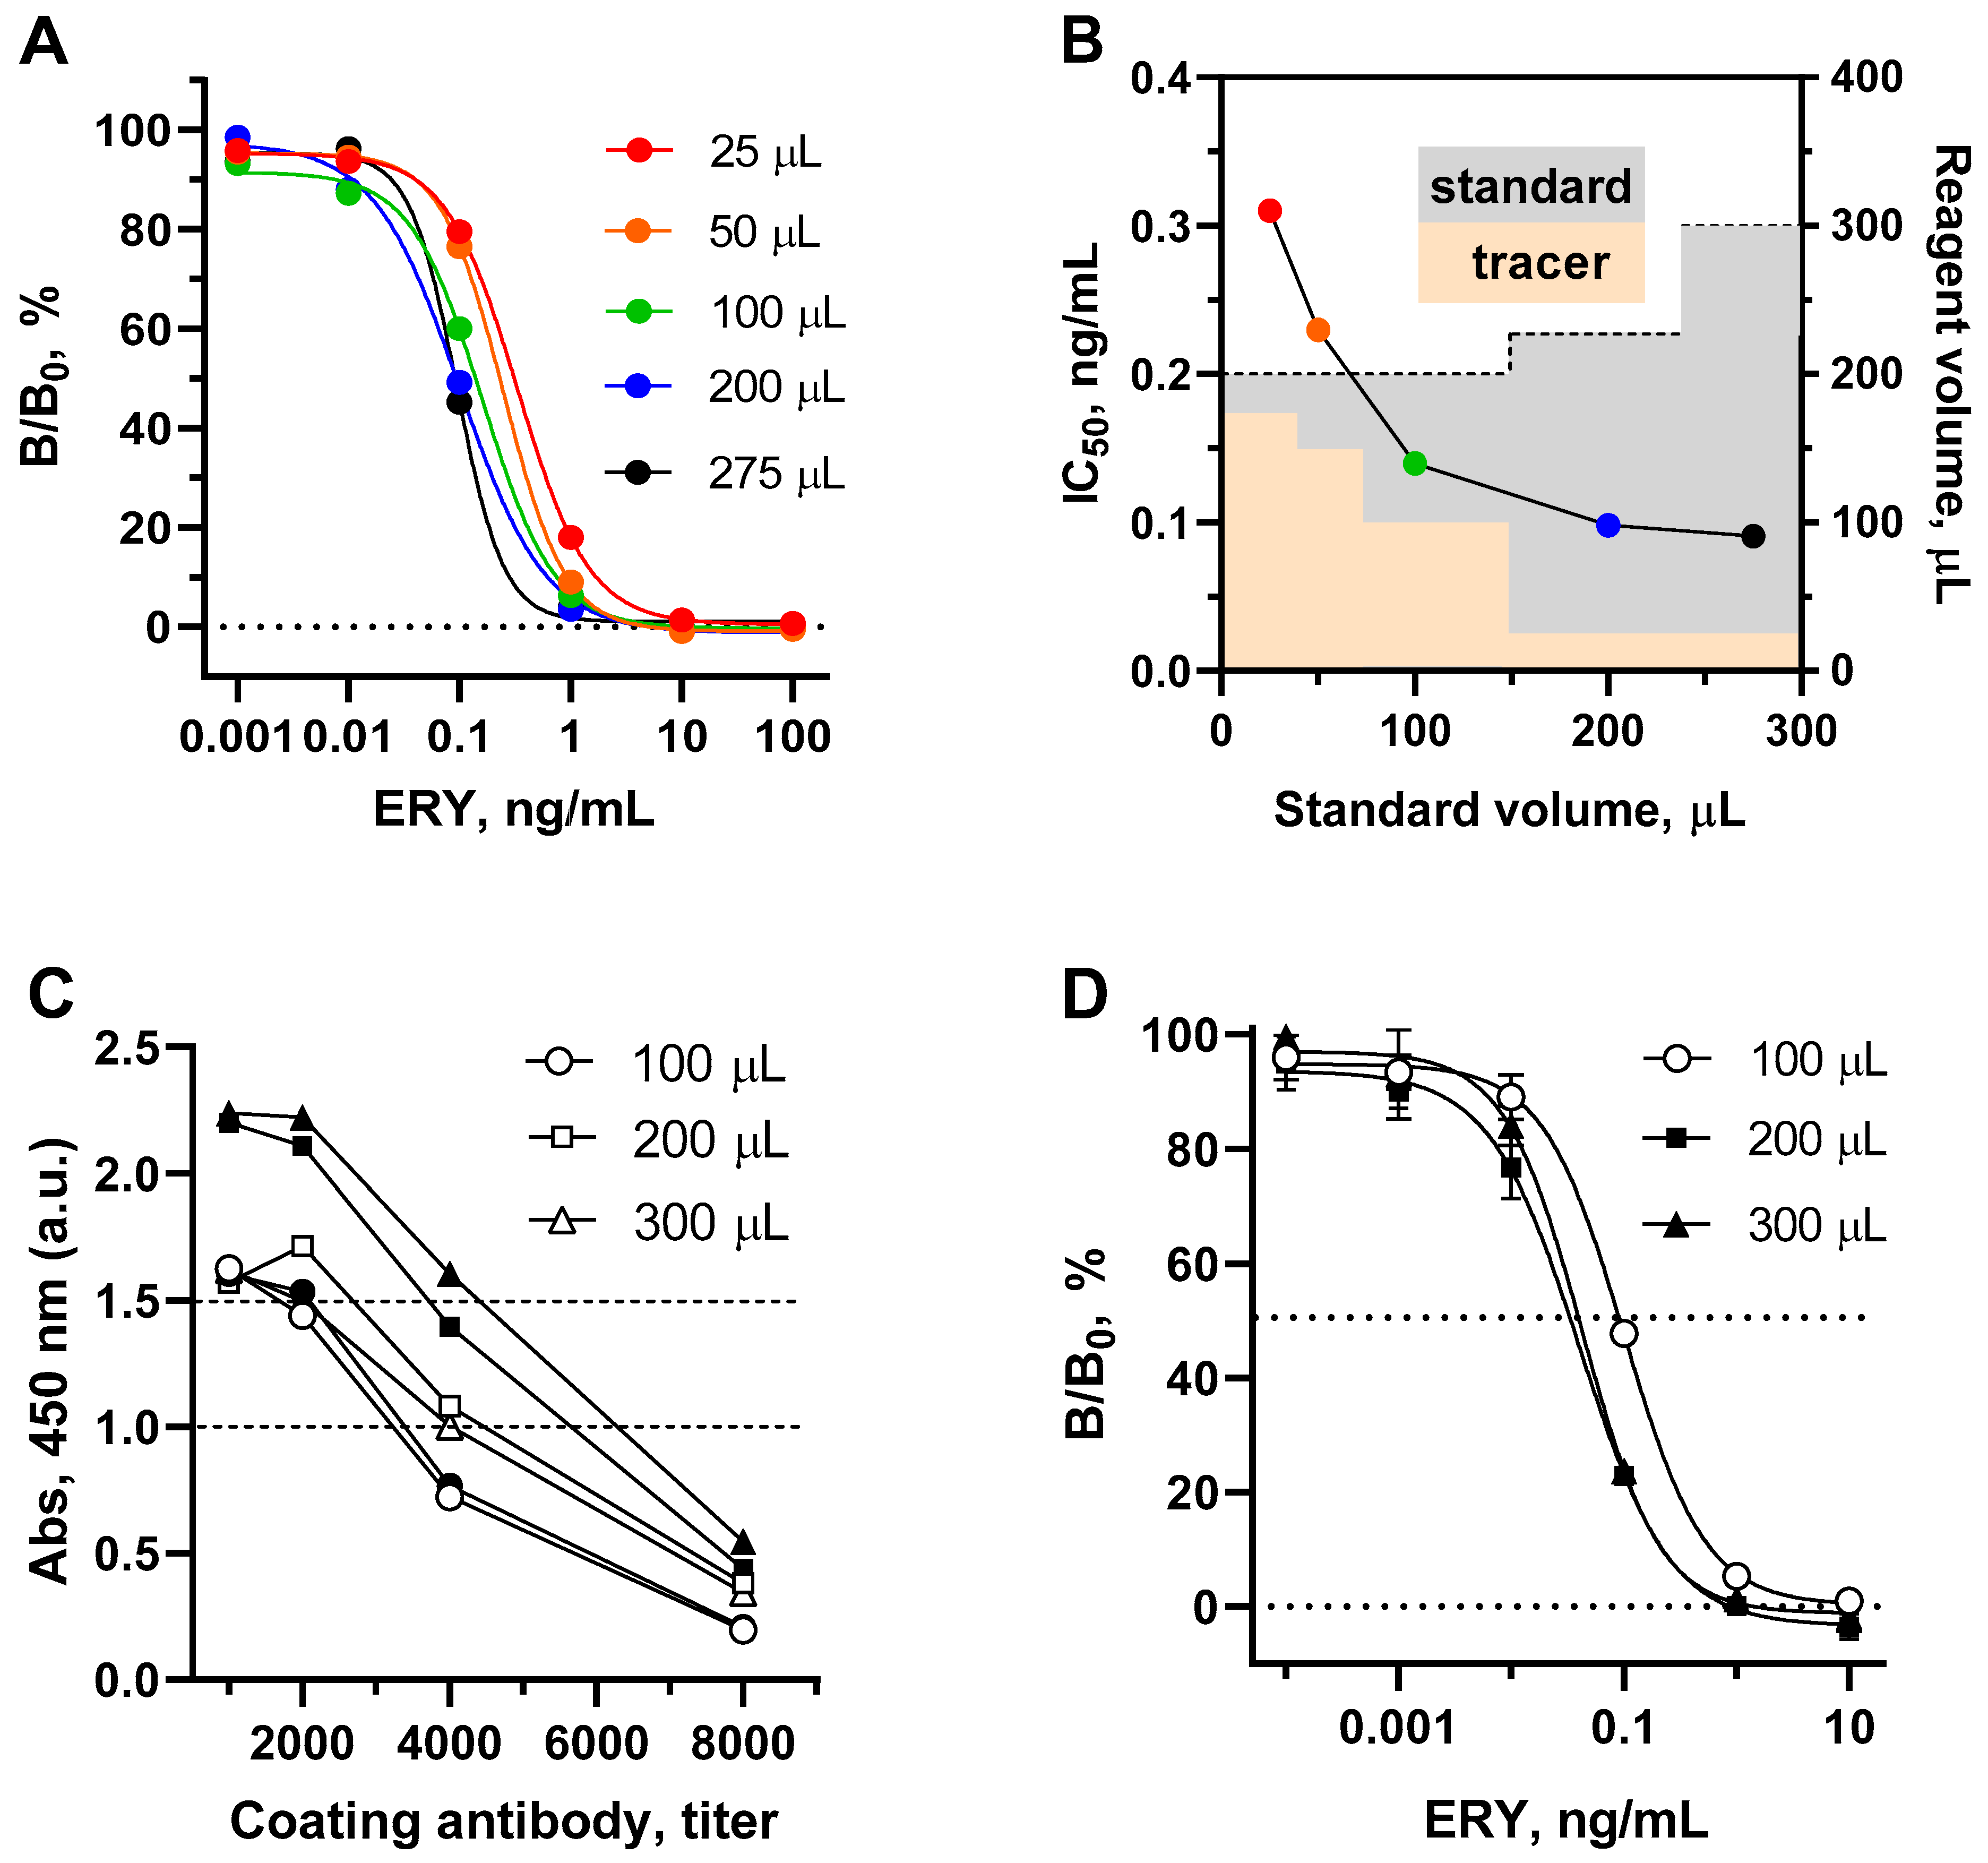
3.5. Effect of Sample Volume Increase on Sensitivity in Plate Assay Format
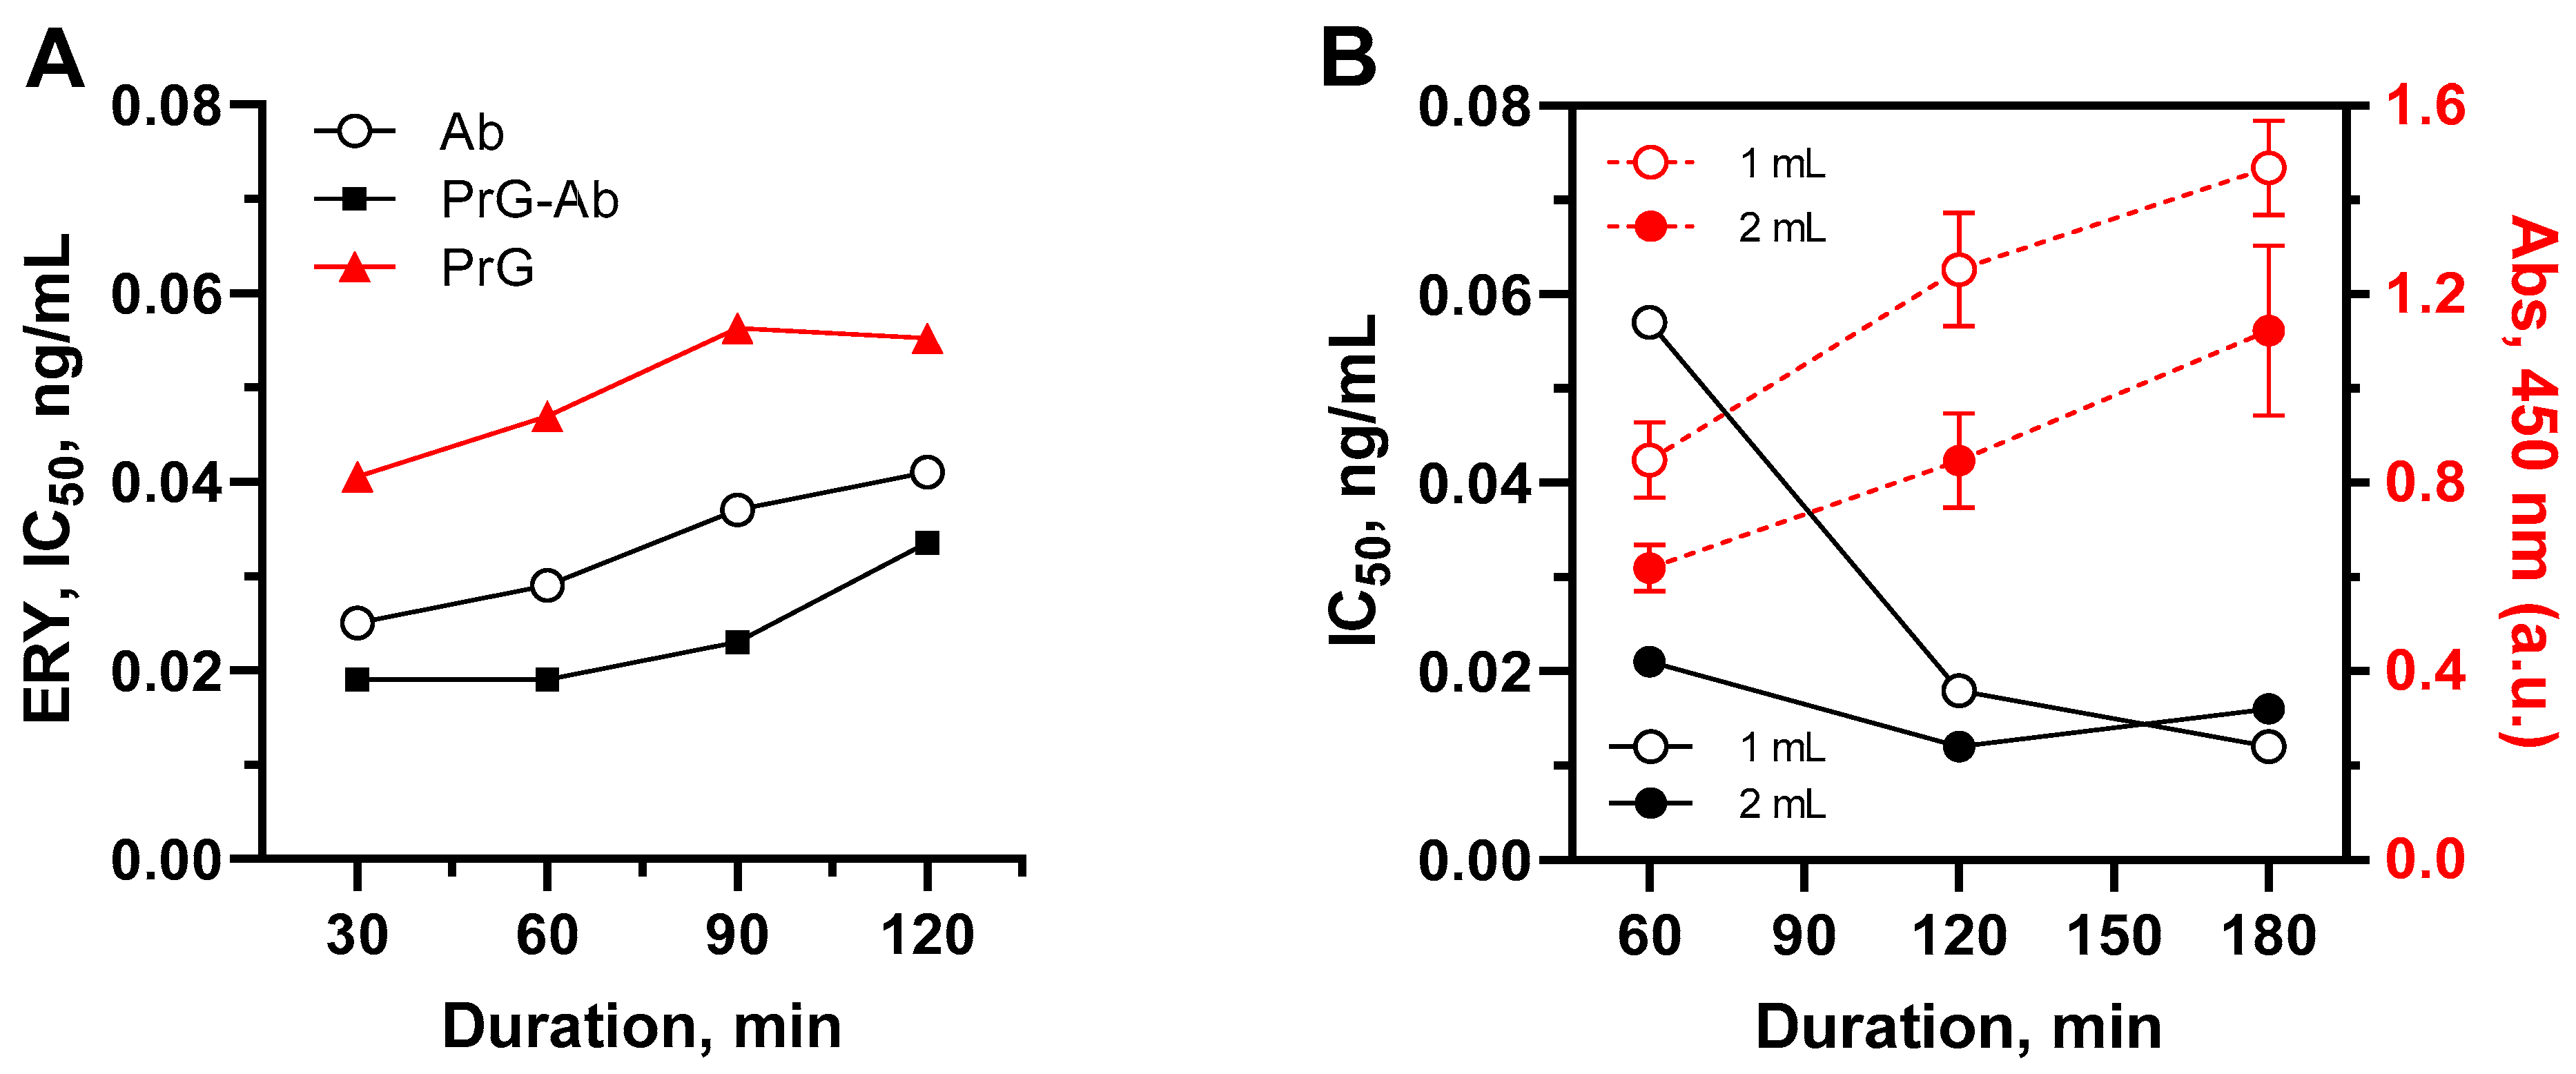
3.6. Effect of Oriented Coating of Antibody and Competitive Stage Duration on Assay Sensitivity
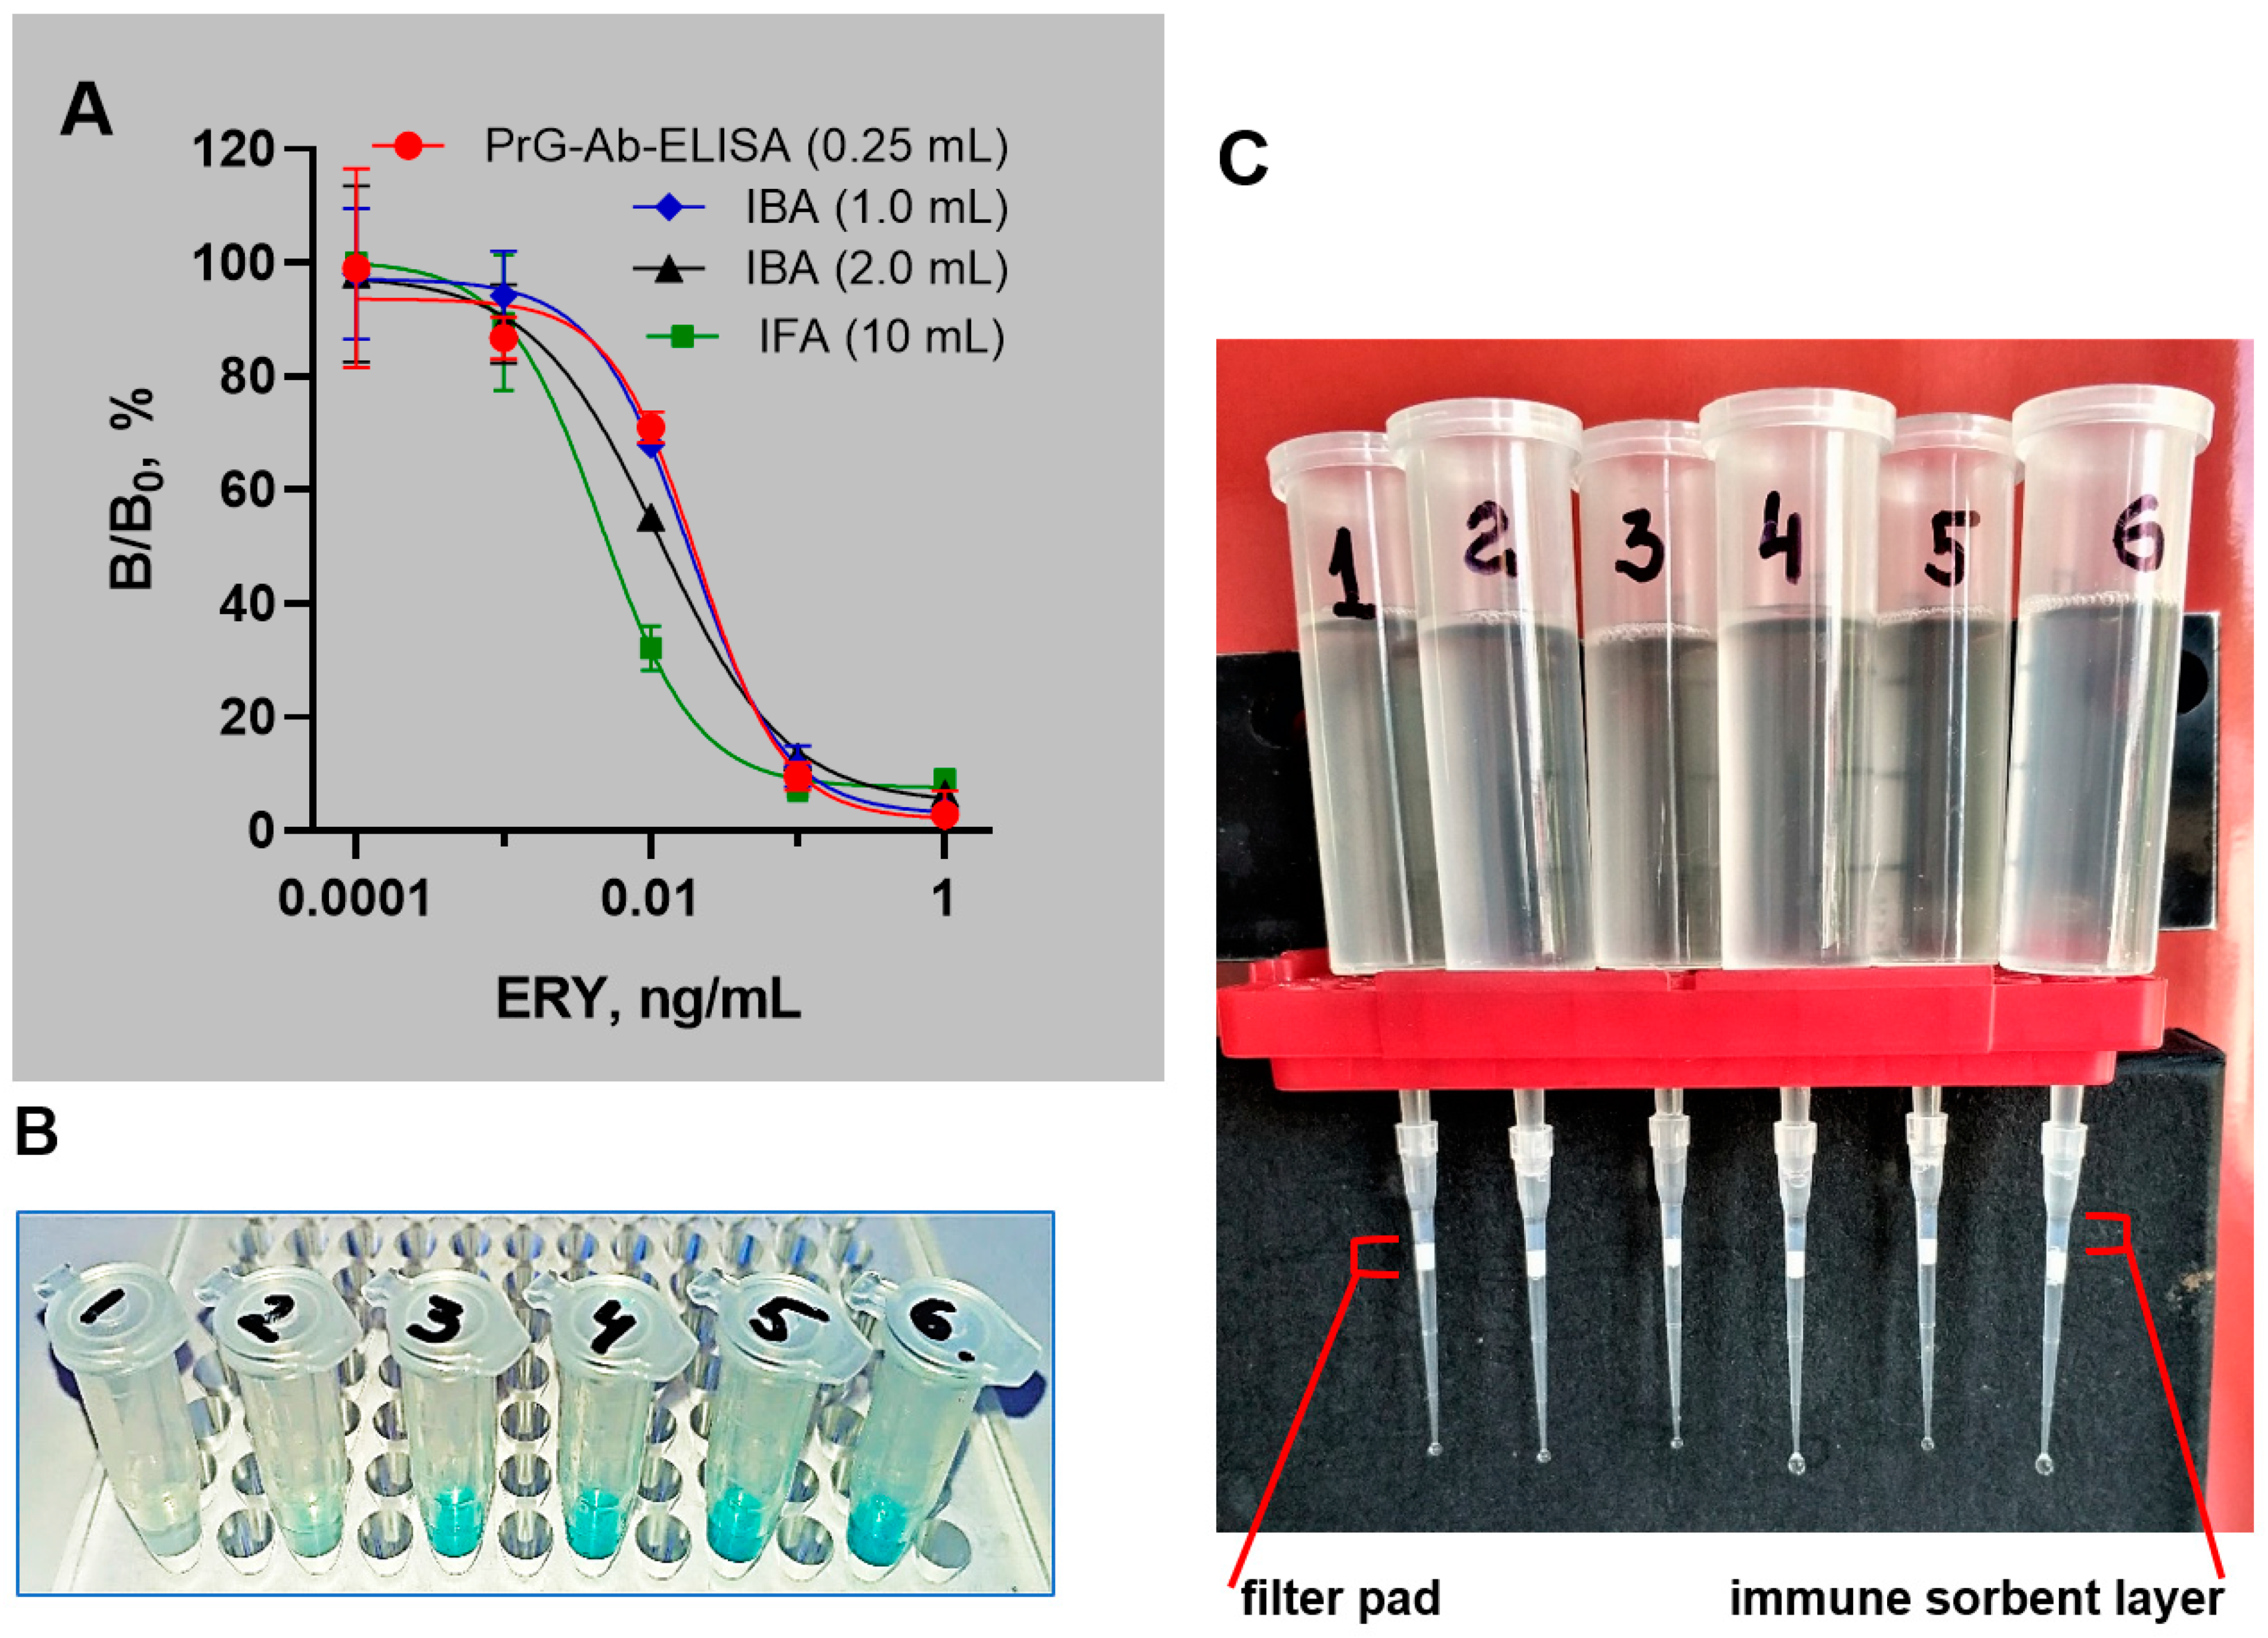
3.7. Effect of Sample Volume Increase on Sensitivity Assessed in IBA and IFA
3.8. Environmental Water Analysis and Recovery Examination
4. Conclusions
Supplementary Materials
Author Contributions
Funding
Institutional Review Board Statement
Informed Consent Statement
Data Availability Statement
Acknowledgments
Conflicts of Interest
References
- Pal, S. A journey across the sequential development of macrolides and ketolides related to erythromycin. Tetrahedron 2006, 62, 3171–3200. [Google Scholar] [CrossRef]
- Arsic, B.; Barber, J.; Čikoš, A.; Mladenovic, M.; Stankovic, N.; Novak, P. 16-membered macrolide antibiotics: A review. Int. J. Antimicrob. Agents 2018, 51, 283–298. [Google Scholar] [CrossRef]
- Kirst, H.A. 2 Semi-synthetic Derivatives of Erythromycin. Prog. Med. Chem. 1993, 30, 57–88. [Google Scholar] [CrossRef]
- Evans, N.A. Tulathromycin: An overview of a new triamilide antibiotic for livestock respiratory disease. Vet. Ther. Res. Appl. Vet. Med. 2005, 6, 83–95. [Google Scholar]
- Echeverría-Esnal, D.; Martin-Ontiyuelo, C.; Navarrete-Rouco, M.E.; Cuscó, M.D.-A.; Ferrández, O.; Horcajada, J.P.; Grau, S. Azithromycin in the treatment of COVID-19: A review. Expert Rev. Anti-Infect. Ther. 2021, 19, 147–163. [Google Scholar] [CrossRef]
- Felis, E.; Kalka, J.; Sochacki, A.; Kowalska, K.; Bajkacz, S.; Harnisz, M.; Korzeniewska, E. Antimicrobial pharmaceuticals in the aquatic environment-occurrence and environmental implications. Eur. J. Pharmacol. 2020, 866, 172813. [Google Scholar] [CrossRef]
- Liu, J.; Deng, W.-J.; Ying, G.-G.; Tsang, E.P.; Hong, H.-C. Occurrence and distribution of antibiotics in surface water. Ecotoxicology 2022, 31, 1111–1119. [Google Scholar] [CrossRef]
- Zheng, C.; Liu, J.; Cai, Y.; Jing, C.; Jiang, R.; Zheng, X.; Lu, G. Pharmaceutically active compounds in biotic and abiotic media of rivers receiving urban sewage: Concentrations, bioaccumulation and ecological risk. Process Saf. Environ. Prot. 2022, 166, 491–499. [Google Scholar] [CrossRef]
- Richardson, S.D.; Kimura, S.Y. Water analysis: Emerging contaminants and current issues. Anal. Chem. 2019, 92, 473–505. [Google Scholar] [CrossRef]
- Wan, J.; Guo, P.; Peng, X.; Wen, K. Effect of erythromycin exposure on the growth, antioxidant system and photosynthesis of Microcystis flos-aquae. J. Hazard. Mater. 2015, 283, 778–786. [Google Scholar] [CrossRef]
- Yan, S.; Ding, N.; Yao, X.; Song, J.; He, W.; Rehman, F.; Guo, J. Effects of erythromycin and roxithromycin on river periphyton: Structure, functions and metabolic pathways. Chemosphere 2023, 316, 137793. [Google Scholar] [CrossRef]
- Li, J.; Li, W.; Liu, K.; Guo, Y.; Ding, C.; Han, J.; Li, P. Global review of macrolide antibiotics in the aquatic environment: Sources, occurrence, fate, ecotoxicity, and risk assessment. J. Hazard. Mater. 2022, 439, 129628. [Google Scholar] [CrossRef]
- Yang, L.H.; Ying, G.G.; Su, H.C.; Stauber, J.L.; Adams, M.S.; Binet, M.T. Growth-inhibiting effects of 12 antibacterial agents and their mixtures on the freshwater microalga pseudokirchneriella subcapitata. Environ. Toxicol. Chem. Int. J. 2008, 27, 1201–1208. [Google Scholar] [CrossRef]
- Commission Implementing Decision (EU) 2015/495 of 20 March 2015 590 establishing a watch list of substances for Union-wide monitoring in the field of water policy pursuant to 591 Directive 2008/105/EC of the European Parliament and of the Council. Off. J. Eur. Union 2015, 78, 40–42.
- Camel, V.; Caude, M. Trace enrichment methods for the determination of organic pollutants in ambient air. J. Chromatogr. A 1995, 710, 3–19. [Google Scholar] [CrossRef]
- Wen, Y.; Li, J.; Ma, J.; Chen, L. Recent advances in enrichment techniques for trace analysis in capillary electrophoresis. Electrophoresis 2012, 33, 2933–2952. [Google Scholar] [CrossRef]
- Guo, L.; Ma, X.; Xie, X.; Huang, R.; Zhang, M.; Li, J.; Zeng, G.; Fan, Y. Preparation of dual-dummy-template molecularly imprinted polymers coated magnetic graphene oxide for separation and enrichment of phthalate esters in water. Chem. Eng. J. 2019, 361, 245–255. [Google Scholar] [CrossRef]
- Galvidis, I.; Lapa, G.; Burkin, M. Group determination of 14-membered macrolide antibiotics and azithromycin using antibodies against common epitopes. Anal. Biochem. 2015, 468, 75–82. [Google Scholar] [CrossRef]
- Wang, Z.; Mi, T.; Beier, R.C.; Zhang, H.; Sheng, Y.; Shi, W.; Zhang, S.; Shen, J. Hapten synthesis, monoclonal antibody production and development of a competitive indirect enzyme-linked immunosorbent assay for erythromycin in milk. Food Chem. 2015, 171, 98–107. [Google Scholar] [CrossRef]
- Raysyan, A.; Galvidis, I.A.; Schneider, R.J.; Eremin, S.A.; Burkin, M.A. Development of a latex particles-based lateral flow immunoassay for group determination of macrolide antibiotics in breast milk. J. Pharm. Biomed. Anal. 2020, 189, 113450. [Google Scholar] [CrossRef]
- Burkin, M.A.; Galvidis, I.A.; Surovoy, Y.A.; Plyushchenko, I.V.; Rodin, I.A.; Tsarenko, S.V. Development of ELISA formats for polymyxin B monitoring in serum of critically ill patients. J. Pharm. Biomed. Anal. 2021, 204, 114275. [Google Scholar] [CrossRef]
- Perosa, F.; Carbone, R.; Ferrone, S.; Dammacco, F. Purification of human immunoglobulins by sequential precipitation with caprylic acid and ammonium sulphate. J. Immunol. Methods 1990, 128, 9–16. [Google Scholar] [CrossRef]
- Li, X.; Ma, S.; Yan, M.; Wang, Y.; Ma, S. Synthesis and antibacterial evaluation of novel 11,4″-disubstituted azithromycin analogs with greatly improved activity against erythromycin-resistant bacteria. Eur. J. Med. Chem. 2013, 59, 209–217. [Google Scholar] [CrossRef]
- Printsevskaya, S.S.; Korolev, A.M.; Luzikov, Y.N.; Mirchink, E.P.; Isakova, E.B.; Tevyashova, A.N. Synthesis and antibacterial activity of 11-O-(benzoxaborole-aminoalkylcarbamoyl) derivatives of macrolide antibiotic azithromycin. Antibiot. Chemother. 2018, 63, 3–7. [Google Scholar]
- Barber, J. Assignments of the 13C and 1H NMR spectra of azithromycin in CDCl3. Magn. Reson. Chem. 1991, 29, 740–743. [Google Scholar] [CrossRef]
- Brennan, R.J.; Barber, J. Full assignments of the 13C and 1H NMR spectra of azithromycin in buffered D2O and DMSO-d6. Magn. Reson. Chem. 1992, 30, 327–333. [Google Scholar] [CrossRef]
- Burkin, M.A.; Galvidis, I.A. Hapten modification approach for switching immunoassay specificity from selective to generic. J. Immunol. Methods 2013, 388, 60–67. [Google Scholar] [CrossRef]
- Burkin, M.A.; Galvidis, I.A.; Eremin, S.A. Specific and generic immunorecognition of glycopeptide antibiotics promoted by unique and multiple orientations of hapten. Biosensors 2019, 9, 52. [Google Scholar] [CrossRef]
- Gao, S.; Guisán, J.M.; Rocha-Martin, J. Oriented immobilization of antibodies onto sensing platforms—A critical review. Anal. Chim. Acta 2022, 1189, 338907. [Google Scholar] [CrossRef]
- Galvidis, I.A.; Wang, Z.; Nuriev, R.I.; Burkin, M.A. Broadening the detection spectrum of small analytes using a two-antibody-designed hybrid immunoassay. Anal. Chem. 2018, 90, 4901–4908. [Google Scholar] [CrossRef]
- Tajima, N.; Takai, M.; Ishihara, K. Significance of antibody orientation unraveled: Well-oriented antibodies recorded high binding affinity. Anal. Chem. 2011, 83, 1969–1976. [Google Scholar] [CrossRef] [PubMed]
- Burkin, M.A.; Lapa, G.B.; Galvidis, I.A.; Burkin, K.M.; Zubkov, A.V.; Eremin, S.A. Three steps improving the sensitivity of sulfonamide immunodetection in milk. Anal. Methods 2018, 10, 5773–5782. [Google Scholar] [CrossRef]
- Li, X.; Wen, K.; Chen, Y.; Wu, X.; Pei, X.; Wang, Q.; Liu, A.; Shen, J. Multiplex immunogold chromatographic assay for simultaneous determination of macrolide antibiotics in raw milk. Food Anal. Methods 2015, 8, 2368–2375. [Google Scholar] [CrossRef]
- Li, X.; Shen, J.; Wang, Q.; Gao, S.; Pei, X.; Jiang, H.; Wen, K. Multi-residue fluorescent microspheres immunochromatographic assay for simultaneous determination of macrolides in raw milk. Anal. Bioanal. Chem. 2015, 407, 9125–9133. [Google Scholar] [CrossRef]
- Zeng, L.; Liu, L.; Kuang, H.; Cui, G.; Xu, C. A paper-based colorimetric assay for rapid detection of four macrolides in milk. Mater. Chem. Front. 2019, 3, 2175–2183. [Google Scholar] [CrossRef]
- Duan, C.; Zhang, H.; Zhang, Y.; Li, Q.; Li, P.; Mari, G.M.; Eremin, S.A.; Shen, J.; Wang, Z. Robust Homogeneous Fluorescence Polarization Immunoassay for Rapid Determination of Erythromycin in Milk. Foods 2023, 12, 1581. [Google Scholar] [CrossRef]


| MLs | GEL- cmoCLA(ae) * | OVA-cmoERY(ae) | OVA- aecAZI(ga) | OVA-aecAZI(dma) | OVA(pi)- aecAZI | |||||
|---|---|---|---|---|---|---|---|---|---|---|
| IC50, ng/mL | CR,% | IC50, ng/mL | CR,% | IC50, ng/mL | CR,% | IC50, ng/mL | CR,% | IC50, ng/mL | CR,% | |
| CLA | 0.16 | 100 | 0.172 | 100 | 0.043 | 100 | 0.157 | 100 | 0.044 | 100 |
| ERY | 0.20 | 68.2 | 0.240 | 71.7 | 0.049 | 87.8 | 0.223 | 70.4 | 0.042 | 105 |
| ESE | - | - | 0.466 | 36.9 | 0.094 | 45.7 | 0.352 | 44.6 | 0.074 | 59.5 |
| ROX | 0.14 | 125 | 0.125 | 137.6 | 0.040 | 107.5 | 0.157 | 100 | 0.051 | 86.3 |
| AZI | 1.63 | 8.8 | 1.990 | 8.6 | 0.315 | 13.7 | 1.220 | 12.9 | 0.107 | 41.1 |
| DIR | - | - | 0.554 | 31.0 | 0.136 | 31.6 | 0.544 | 28.9 | 0.096 | 45.8 |
| TUL | - | - | 629.9 | 2.7 | 134.8 | 0.03 | 379.5 | 0.04 | 5.403 | 0.81 |
| OLE | - | - | 75.75 | 0.2 | 40.10 | 0.11 | 287.2 | 0.05 | 45.64 | 0.1 |
| Assay (Matrix) | Immunogen | Antigen | IC50//LOD, ng/mL | CR, % | Reference | |
|---|---|---|---|---|---|---|
| ICA (Milk) | Commercial | Commercial | ni//5 | ERY | 100 | [33] |
| FM-ICA (Milk) | Commercial | Commercial | ni//0.13 | ERY | 100 | [34] |
| IC-ELISA (Milk) | BSA-cmoERY(ma) | OVA-cmoERY(ae) | 0.94//0.3 | CLA ERY ESE ROX AZI DIR | 26.7 100 - 14.8 0.9 157 | [19] |
| ICA (Milk) | BSA-cmoCLA(ae) | OVA-cmoCLA(ae) | 0.16//0.095 | CLA ERY ESE ROX AZI DIR | 100 30.1 - 21.1 16.2 - | [35] |
| LFIA (Breast milk) | BSA-cmoCLA(ae) | GEL- cmoCLA(ae) | 0.45//0.12 | CLA ERY ROX DIR AZI | 100 7.5 97.8 5.4 5.7 | [20] |
| FPIA (Milk) | BSA-cmoERY(ma) | OVA-cmoERY(ae) | 7.4//14.1 | CLA ERY ESE ROX AZI DIR | 26.7 100 43.7 92 - 157 | [36] |
| IC-ELISA (Water) IFA (Water) | BSA-cmoCLA(ae) | OVA(pi)-aecAZI HRP(pi)-aecAZI | 0.04//0.01 0.005//0.001 | CLA ERY ESE ROX AZI DIR | 100 105 59.5 86.3 41.1 45.8 | Present study |
| Assay Format, Competitive Step Duration | Coating Ab Volume, µL | Standard/Sample, µL | IC50, ng/mL | IC20-IC80, ng/mL | IC10, ng/mL |
|---|---|---|---|---|---|
| ELISA, 1 h | 100 | 25 | 0.31 | 0.097–0.907 | 0.04 |
| 100 | 50 | 0.23 | 0.085–0.565 | 0.04 | |
| 100 | 100 | 0.14 | 0.037–0.400 | 0.008 | |
| 100 | 200 | 0.098 | 0.029–0.253 | 0.011 | |
| 100 | 275 | 0.091 | 0.043–0.184 | 0.024 | |
| 200 | 275 | 0.034 | 0.008–0.119 | 0.002 | |
| 300 | 275 | 0.040 | 0.012–0.119 | 0.006 | |
| PrG-ELISA, 1.5 h | 200 | 250 | 0.055 | 0.015–0.199 | 0.007 |
| PrG-Ab-ELISA, 0.5 h | 200 | 250 | 0.020 | 0.006–0.054 | 0.002 |
| IBA, 2 h | 10 | 1000 | 0.018 | 0.006–0.056 | 0.003 |
| IBA, 2 h | 20 | 2000 | 0.012 | 0.003–0.057 | 0.001 |
| IFA, overnight | 50 | 10,000 | 0.005 | 0.002–0.019 | 0.001 |
Disclaimer/Publisher’s Note: The statements, opinions and data contained in all publications are solely those of the individual author(s) and contributor(s) and not of MDPI and/or the editor(s). MDPI and/or the editor(s) disclaim responsibility for any injury to people or property resulting from any ideas, methods, instructions or products referred to in the content. |
© 2023 by the authors. Licensee MDPI, Basel, Switzerland. This article is an open access article distributed under the terms and conditions of the Creative Commons Attribution (CC BY) license (https://creativecommons.org/licenses/by/4.0/).
Share and Cite
Burkin, M.A.; Tevyashova, A.N.; Bychkova, E.N.; Melekhin, A.O.; Galvidis, I.A. Immunotechniques for the Group Determination of Macrolide Antibiotics Traces in the Environment Using a Volume-Mediated Sensitivity Enhancement Strategy. Biosensors 2023, 13, 921. https://doi.org/10.3390/bios13100921
Burkin MA, Tevyashova AN, Bychkova EN, Melekhin AO, Galvidis IA. Immunotechniques for the Group Determination of Macrolide Antibiotics Traces in the Environment Using a Volume-Mediated Sensitivity Enhancement Strategy. Biosensors. 2023; 13(10):921. https://doi.org/10.3390/bios13100921
Chicago/Turabian StyleBurkin, Maksim A., Anna N. Tevyashova, Elena N. Bychkova, Artem O. Melekhin, and Inna A. Galvidis. 2023. "Immunotechniques for the Group Determination of Macrolide Antibiotics Traces in the Environment Using a Volume-Mediated Sensitivity Enhancement Strategy" Biosensors 13, no. 10: 921. https://doi.org/10.3390/bios13100921