SnO2-Based Ultra-Flexible Humidity/Respiratory Sensor for Analysis of Human Breath

 ,
,  and
and 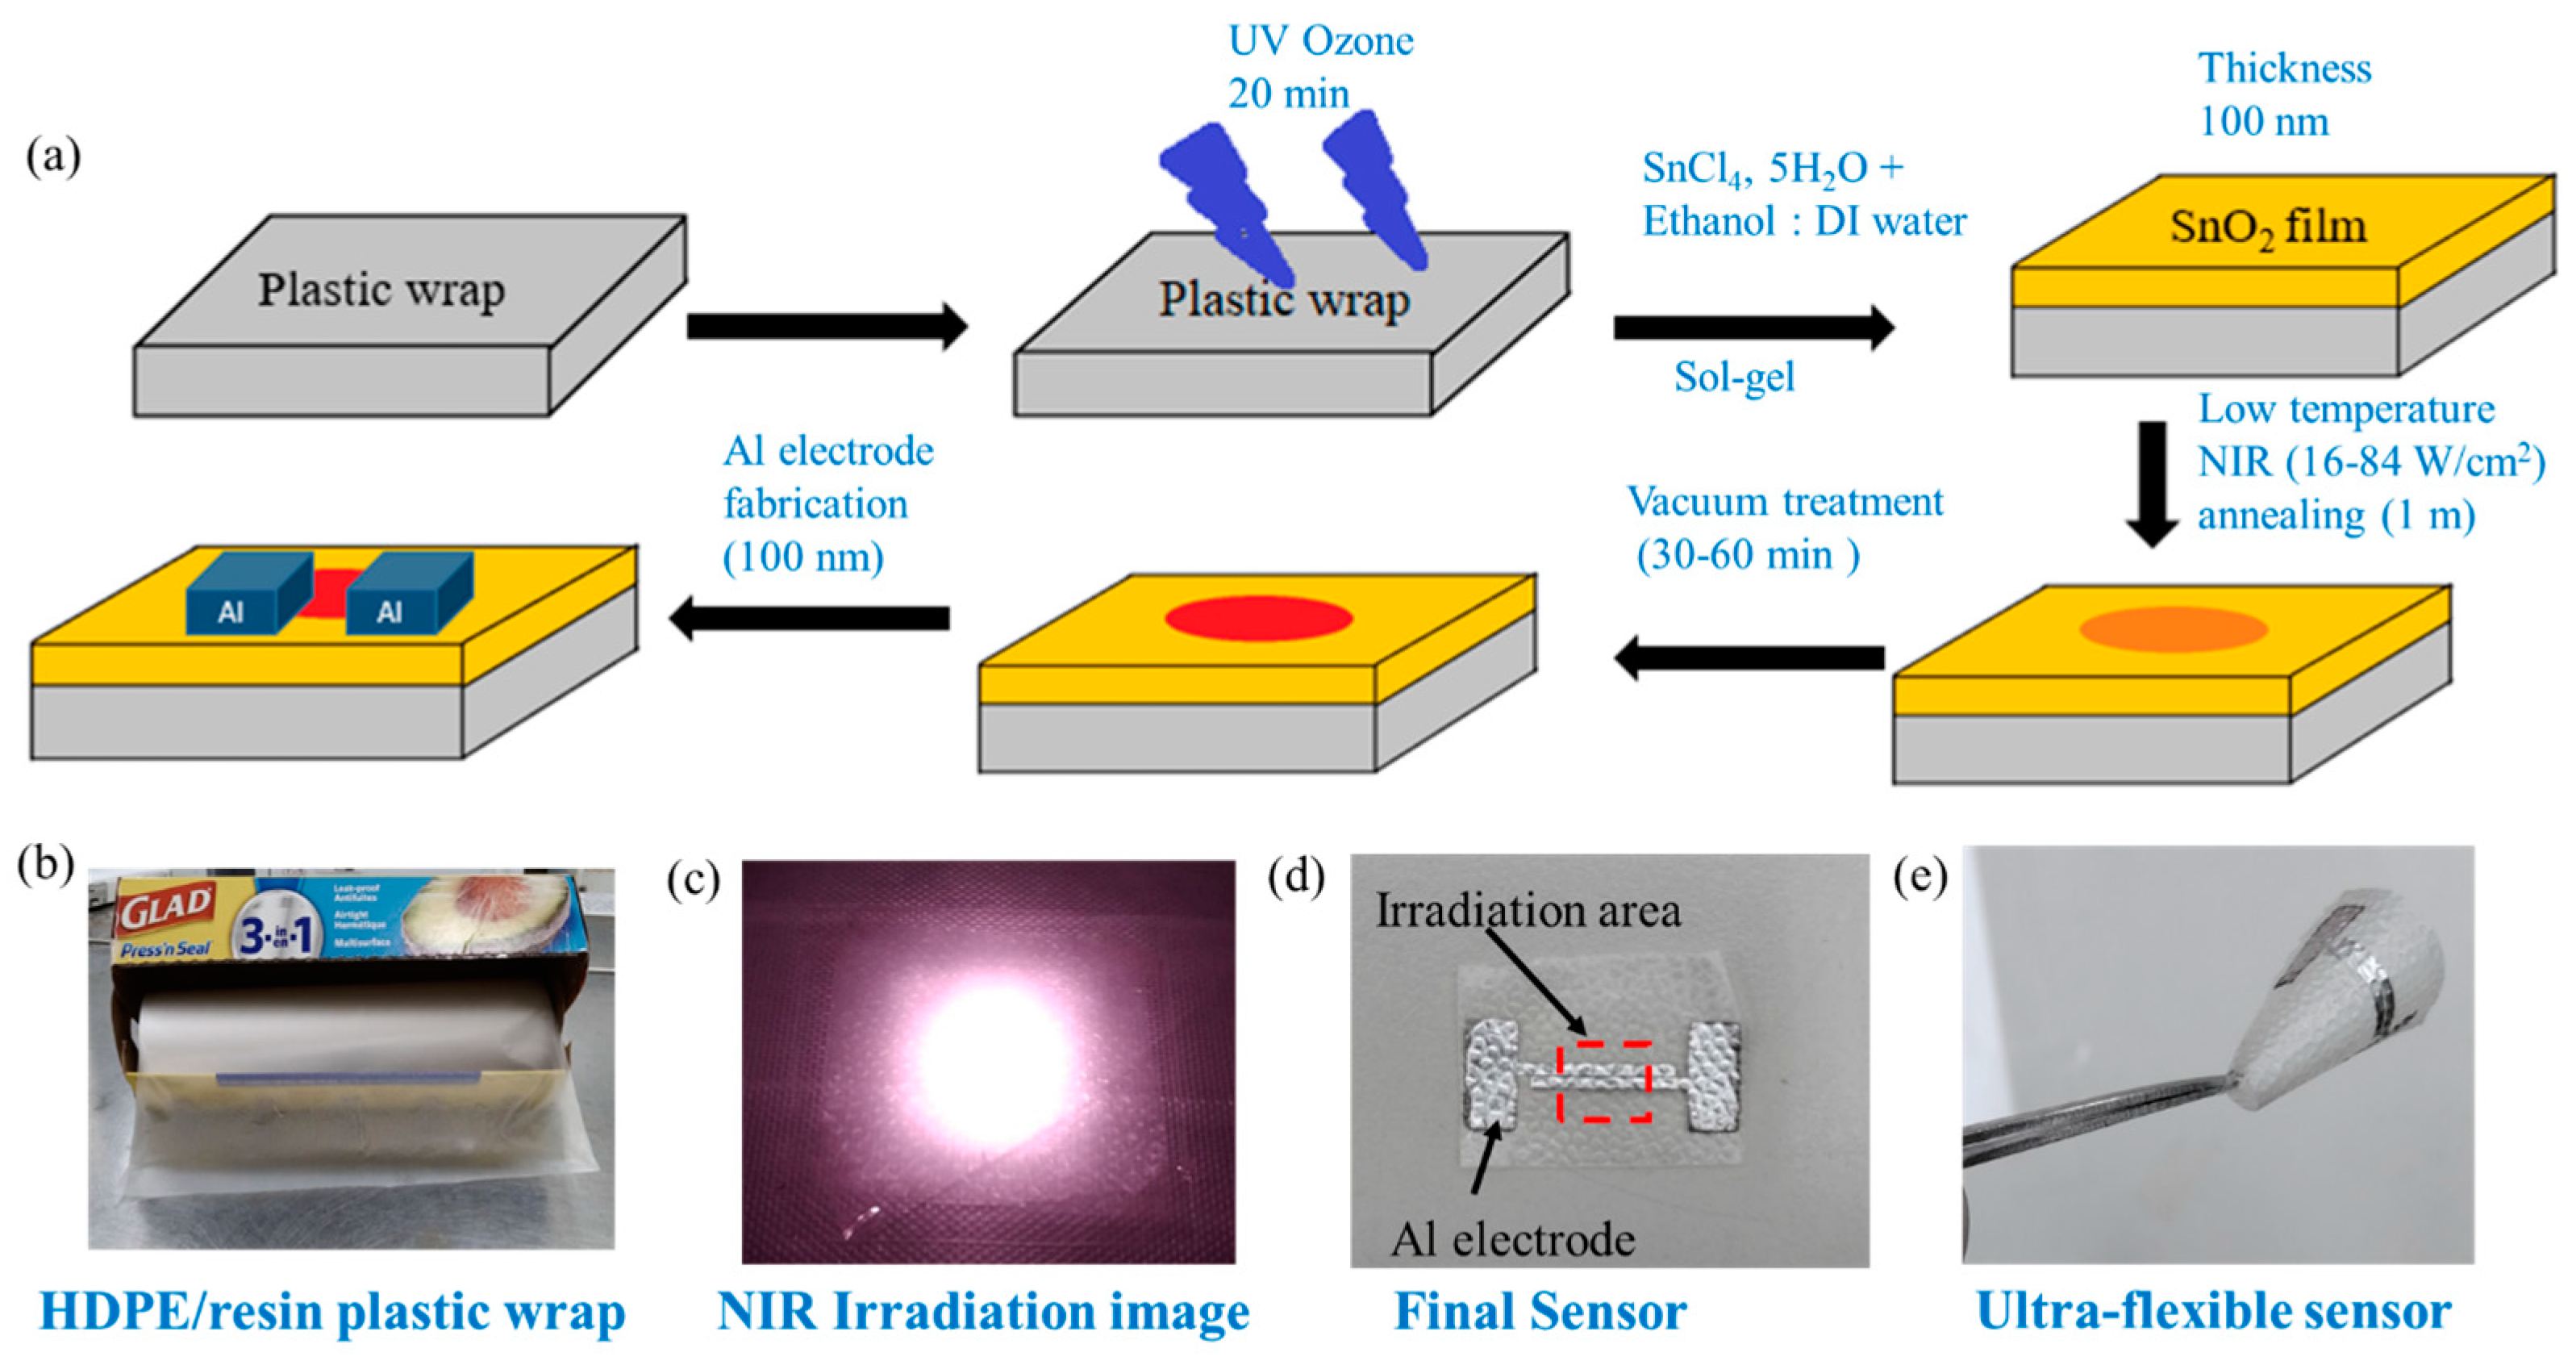
Abstract
:1. Introduction
2. Experimental Procedure
2.1. Materials
2.2. Sensor Fabrication
2.3. Sensor Measurement System
3. Results and Discussions
3.1. Wettability Effect and NIR Laser Endurance
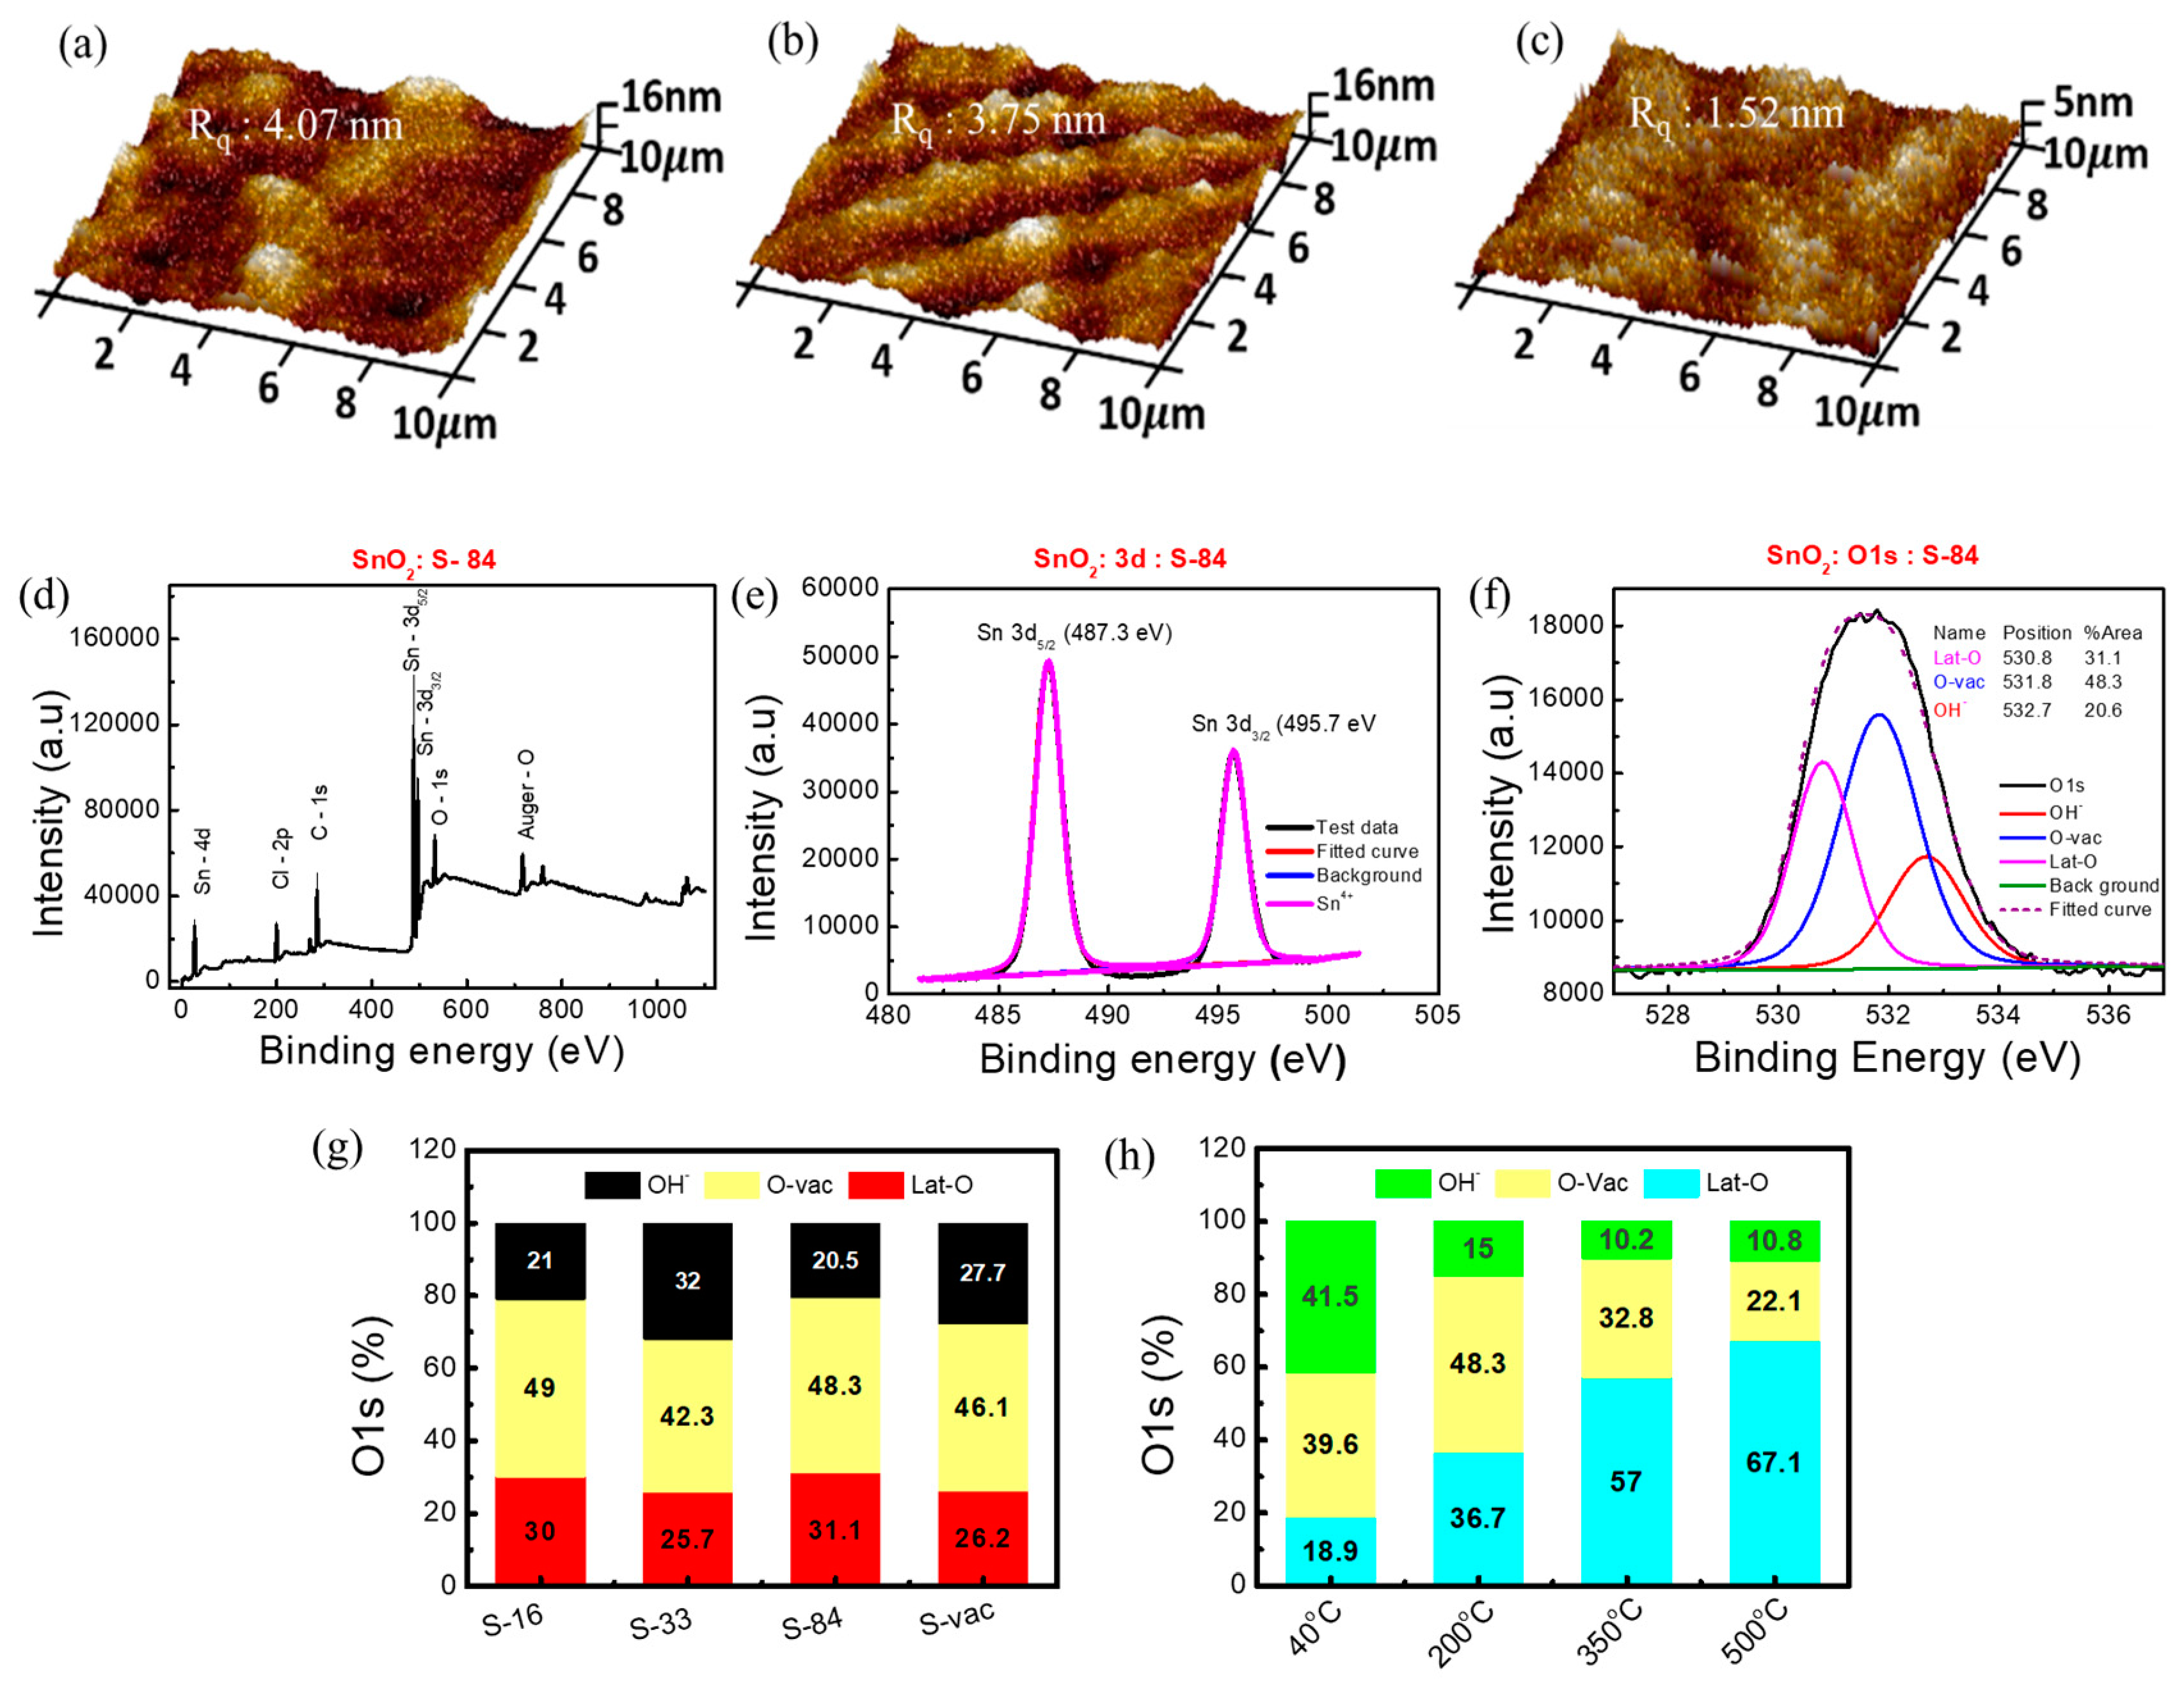
3.2. Material Analysis
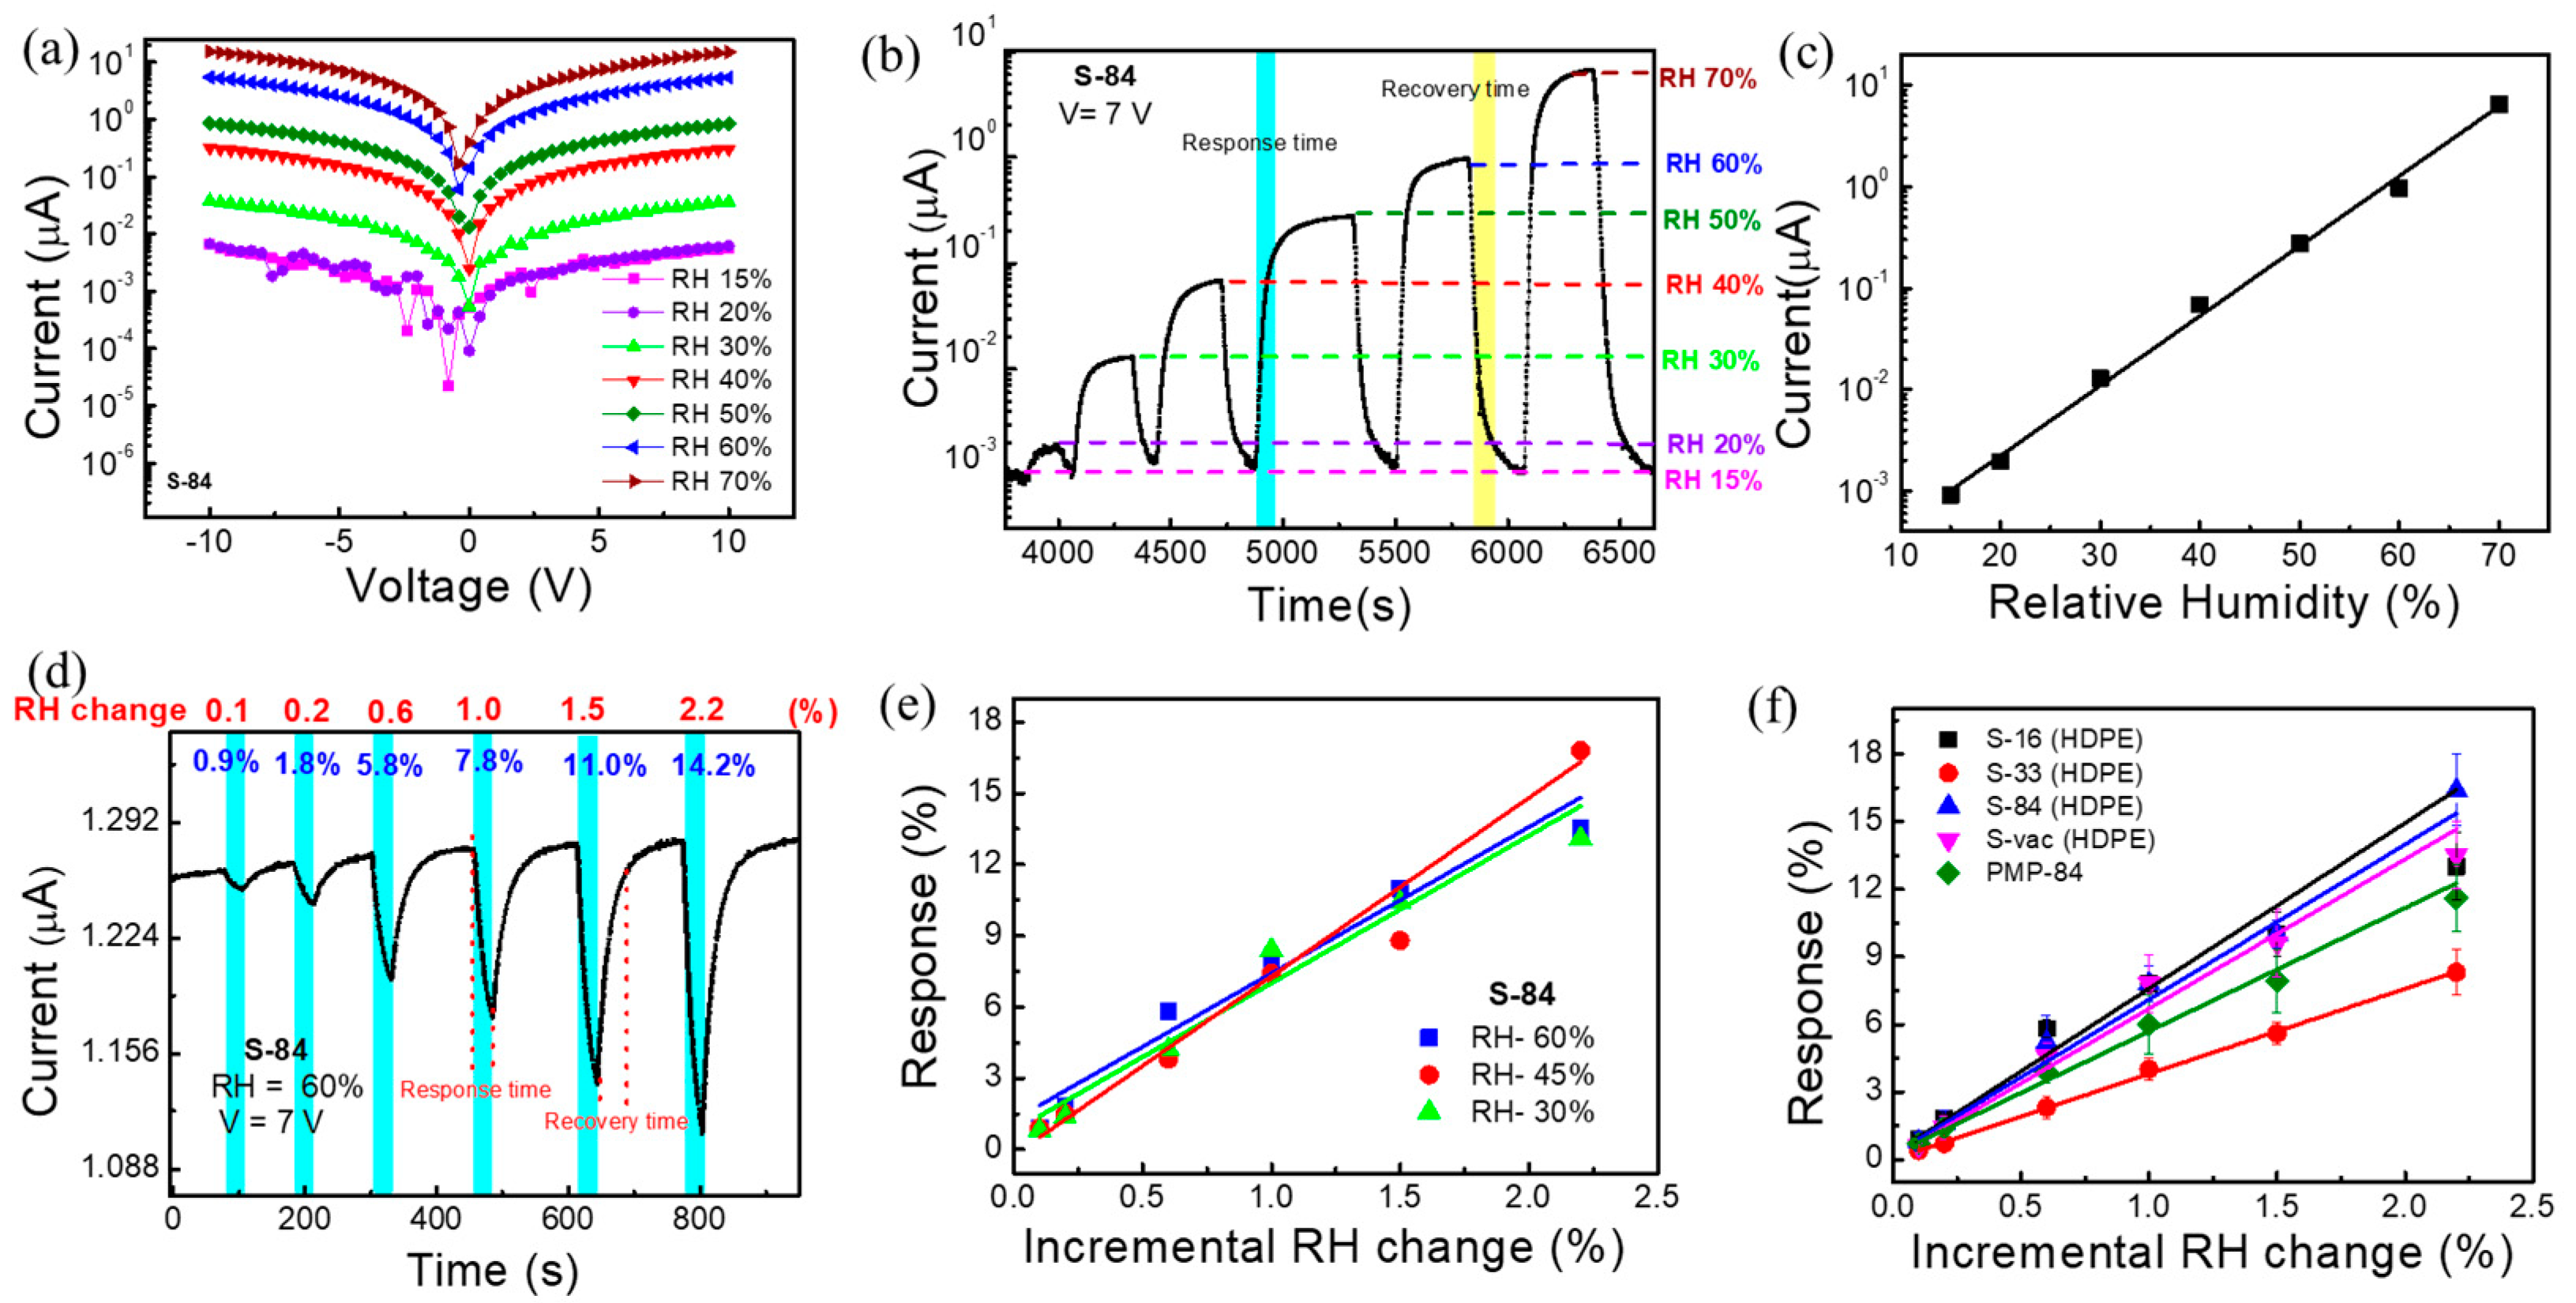
3.3. Relative Humidity Response Measurement
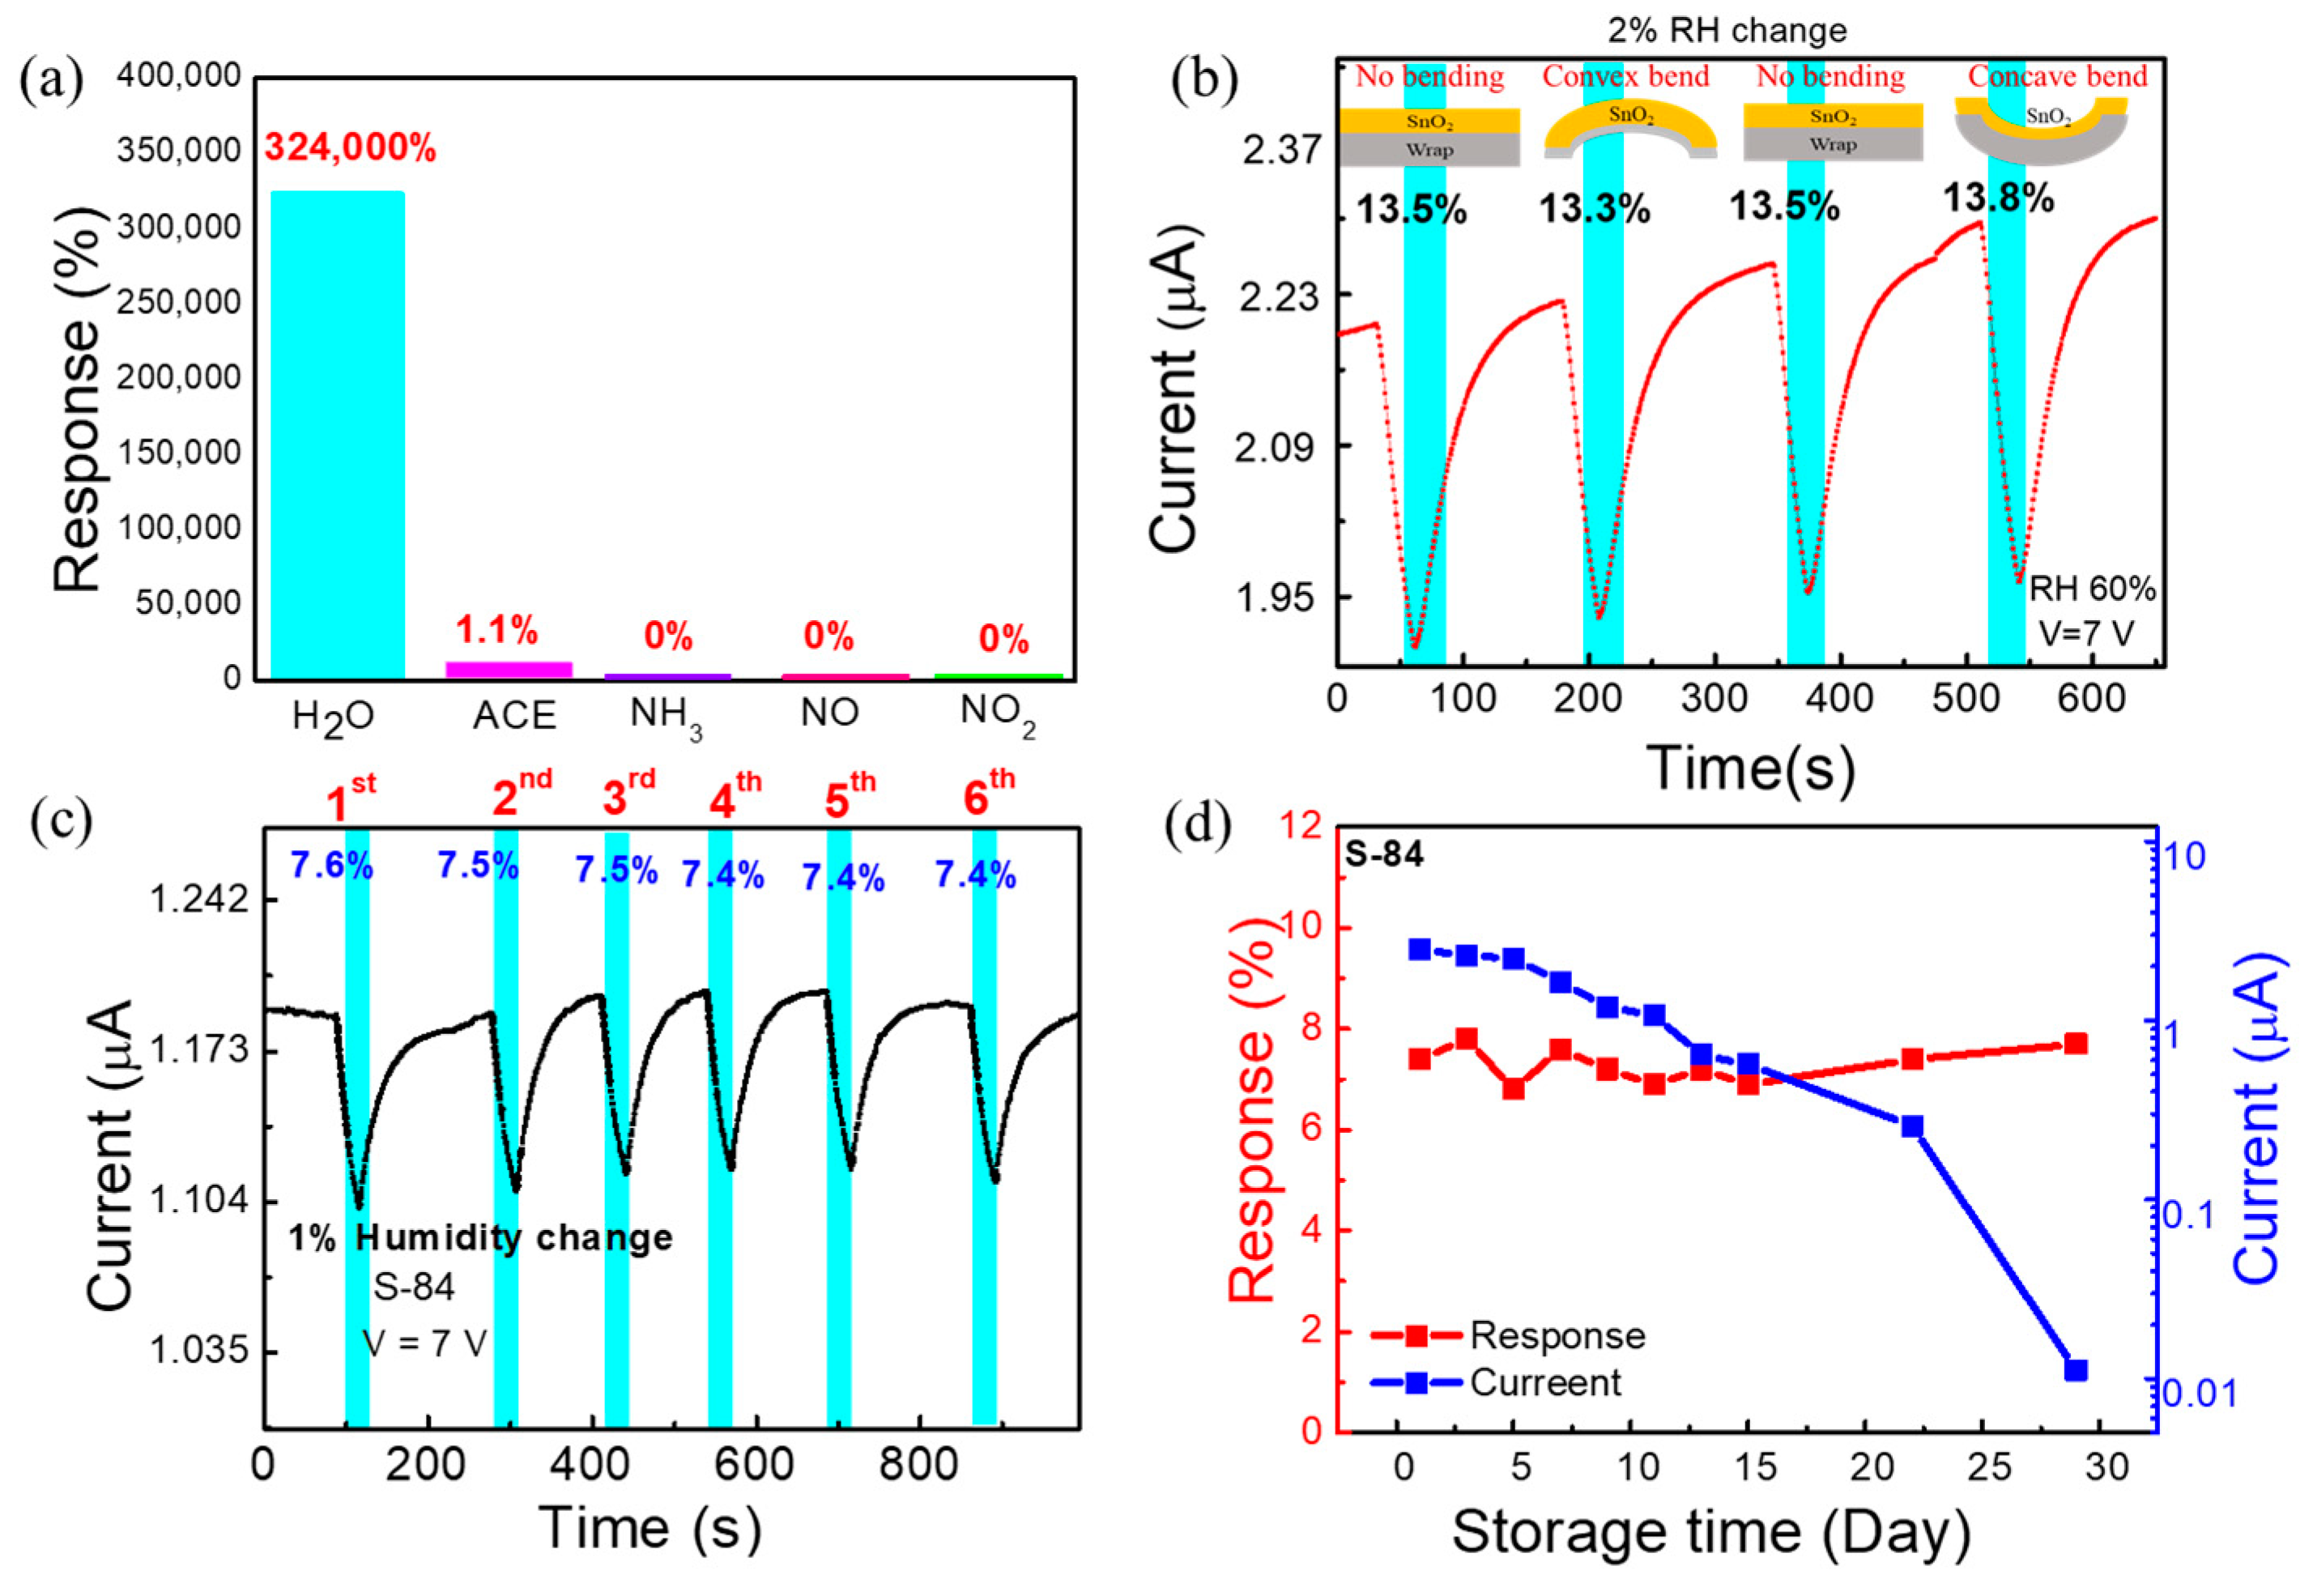
3.4. Selectivity, Flexibility, and Reliability
3.5. Respiratory Sensing Performance
4. Conclusions
Supplementary Materials
Author Contributions
Funding
Institutional Review Board Statement
Informed Consent Statement
Data Availability Statement
Conflicts of Interest
References
- Sikarwar, S.; Yadav, B.C. Opto-electronic humidity sensor: A review. Sens. Actuator A Phys. 2015, 233, 54–70. [Google Scholar] [CrossRef]
- Palaparthy, V.S.; Kalita, H.; Surya, S.G.; Baghini, M.S.; Aslam, M. Graphene oxide based soil moisture microsensor for in situ agriculture applications. Sens. Actuators B Chem. 2018, 273, 1660–1669. [Google Scholar] [CrossRef]
- Moustafa, H.; Morsy, M.; Ateia, M.A.; Abdel-Haleem, F.M. Ultrafast response humidity sensors based on polyvinyl chloride/graphene oxide nanocomposites for intelligent food packaging. Sens. Actuator A Phys. 2021, 331, 112918. [Google Scholar] [CrossRef]
- Cheng, Y.; Wang, J.; Qiu, Z.; Zheng, X.; Leung, N.L.C.; Lam, J.W.Y.; Tang, B.Z. Multiscale Humidity Visualization by Environmentally Sensitive Fluorescent Molecular Rotors. Adv. Mater. 2017, 29, 1703900. [Google Scholar] [CrossRef]
- Alwis, L.; Sun, T.; Grattan, K.T.V. Optical fibre-based sensor technology for humidity and moisture measurement: Review of recent progress. Measurement 2013, 46, 4052–4074. [Google Scholar] [CrossRef]
- Zhao, Y.; Sun, H.; Tu, D. Effect of mechanical ventilation and natural ventilation on indoor climates in Urumqi residential buildings. Build. Environ. 2018, 144, 108–118. [Google Scholar] [CrossRef]
- Tang, H.; Li, Y.; Ye, H.; Hu, F.; Gao, C.; Tao, L.; Tu, T.; Gou, G.; Chen, X.; Fan, X.; et al. High-performance humidity sensor using Schottky-contacted SnS nanoflakes for noncontact healthcare monitoring. Nanotechnology 2020, 31, 055501. [Google Scholar] [CrossRef] [PubMed]
- Wang, X.; Deng, Y.; Chen, X.; Jiang, P.; Cheung, Y.K.; Yu, H. An ultrafast-response and flexible humidity sensor for human respiration monitoring and noncontact safety warning. Microsyst. Nanoeng. 2021, 7, 99. [Google Scholar] [CrossRef] [PubMed]
- Bhattacharjee, M.; Nemade, H.B.; Bandyopadhyay, D. Nano-enabled paper humidity sensor for mobile based point-of-care lung function monitoring. Biosens. Bioelectron. 2017, 94, 544–551. [Google Scholar] [CrossRef]
- Bernardi, L.; Porta, C.; Gabutti, A.; Spicuzza, L.; Sleight, P. Modulatory effects of respiration. Auton. Neurosci. 2001, 90, 47–56. [Google Scholar] [CrossRef]
- Honda, S.; Hara, H.; Arie, T.; Akita, S.; Takei, K. A wearable, flexible sensor for real-time, home monitoring of sleep apnea. iScience 2022, 25, 104163. [Google Scholar] [CrossRef] [PubMed]
- Chen, G.; Guan, R.; Shi, M.; Dai, X.; Li, H.; Zhou, N.; Chen, D.; Mao, H. A nanoforest-based humidity sensor for respiration monitoring. Microsyst. Nanoeng. 2022, 8, 44. [Google Scholar] [CrossRef] [PubMed]
- Farnum, A.; Parnas, M.; Hoque Apu, E.; Cox, E.; Lefevre, N.; Contag, C.H.; Saha, D. Harnessing insect olfactory neural circuits for detecting and discriminating human cancers. Biosens. Bioelectron. 2022, 219, 114814. [Google Scholar] [CrossRef] [PubMed]
- Wang, C.; Sun, B.; Guo, L.; Wang, X.; Ke, C.; Liu, S.; Zhao, W.; Luo, S.; Guo, Z.; Zhang, Y.; et al. Volatile organic metabolites identify patients with breast cancer, cyclomastopathy and mammary gland fibroma. Sci. Rep. 2014, 4, 5383. [Google Scholar] [CrossRef] [Green Version]
- Waltman, C.G.; Marcelissen, T.A.; van Roermund, J.G. Exhaled-breath testing for prostate cancer based on volatile organic compound profiling using an electronic nose device (Aeonose™): A preliminary report. Eur. Urol. Focus 2020, 6, 1220–1225. [Google Scholar] [CrossRef]
- Van Keulen, K.E.; Jansen, M.E.; Schrauwen, R.W.; Kolkman, J.J.; Siersema, P.D. Volatile organic compounds in breath can serve as a non-invasive diagnostic biomarker for the detection of advanced adenomas and colorectal cancer. Aliment. Pharmacol. Ther. 2020, 51, 334–346. [Google Scholar] [CrossRef] [Green Version]
- He, J.; Xiao, P.; Shi, J.; Liang, Y.; Lu, W.; Chen, Y.; Wang, W.; Théato, P.; Kuo, S.-W.; Chen, T. High Performance Humidity Fluctuation Sensor for Wearable Devices via a Bioinspired Atomic-Precise Tunable Graphene-Polymer Heterogeneous Sensing Junction. Chem. Mater. 2018, 30, 4343–4354. [Google Scholar] [CrossRef]
- Zhang, D.; Xu, Z.; Yang, Z.; Song, X. High-performance flexible self-powered tin disulfide nanoflowers/reduced graphene oxide nanohybrid-based humidity sensor driven by triboelectric nanogenerator. Nano Energy 2020, 67, 104251. [Google Scholar] [CrossRef]
- Li, Y.; Zhang, M.; Hu, X.; Yu, L.; Fan, X.; Huang, C.; Li, Y. Graphdiyne-based flexible respiration sensors for monitoring human health. Nano Today 2021, 39, 101214. [Google Scholar] [CrossRef]
- Delipinar, T.; Shafique, A.; Gohar, M.S.; Yapici, M.K. Fabrication and Materials Integration of Flexible Humidity Sensors for Emerging Applications. ACS Omega 2021, 6, 8744–8753. [Google Scholar] [CrossRef]
- Tai, H.; Wang, S.; Duan, Z.; Jiang, Y. Evolution of breath analysis based on humidity and gas sensors: Potential and challenges. Sens. Actuators B Chem. 2020, 318, 128104. [Google Scholar] [CrossRef]
- Pang, Y.; Jian, J.; Tu, T.; Yang, Z.; Ling, J.; Li, Y.; Wang, X.; Qiao, Y.; Tian, H.; Yang, Y.; et al. Wearable humidity sensor based on porous graphene network for respiration monitoring. Biosens. Bioelectron. 2018, 116, 123–129. [Google Scholar] [CrossRef] [PubMed]
- Zhao, Q.; Yuan, Z.; Duan, Z.; Jiang, Y.; Li, X.; Li, Z.; Tai, H. An ingenious strategy for improving humidity sensing properties of multi-walled carbon nanotubes via poly-L-lysine modification. Sens. Actuators B Chem. 2019, 289, 182–185. [Google Scholar] [CrossRef]
- Tachibana, S.; Wang, Y.F.; Sekine, T.; Takeda, Y.; Hong, J.; Yoshida, A.; Abe, M.; Miura, R.; Watanabe, Y.; Kumaki, D.; et al. A Printed Flexible Humidity Sensor with High Sensitivity and Fast Response Using a Cellulose Nanofiber/Carbon Black Composite. ACS Appl. Mater. Interfaces 2022, 14, 5721–5728. [Google Scholar] [CrossRef] [PubMed]
- Zhou, X.; Guo, W.; Fu, J.; Zhu, Y.; Huang, Y.; Peng, P. Laser writing of Cu/CuO integrated structure on flexible substrate for humidity sensing. Appl. Surf. Sci. 2019, 494, 684–690. [Google Scholar] [CrossRef]
- Li, B.; Tian, Q.; Su, H.; Wang, X.; Wang, T.; Zhang, D. High sensitivity portable capacitive humidity sensor based on In2O3 nanocubes-decorated GO nanosheets and its wearable application in respiration detection. Sens. Actuators B Chem. 2019, 299, 126973. [Google Scholar] [CrossRef]
- Wang, Y.; Zhang, L.; Zhou, J.; Lu, A. Flexible and transparent cellulose-based ionic film as a humidity sensor. ACS Appl. Mater. Interfaces 2020, 12, 7631–7638. [Google Scholar] [CrossRef]
- Duan, Z.; Jiang, Y.; Yan, M.; Wang, S.; Yuan, Z.; Zhao, Q.; Sun, P.; Xie, G.; Du, X.; Tai, H. Facile, flexible, cost-saving, and environment-friendly paper-based humidity sensor for multifunctional applications. ACS Appl. Mater. Interfaces 2019, 11, 21840–21849. [Google Scholar] [CrossRef] [PubMed]
- Li, B.; Xiao, G.; Liu, F.; Qiao, Y.; Li, C.M.; Lu, Z. A flexible humidity sensor based on silk fabrics for human respiration monitoring. J. Mater. Chem. C 2018, 6, 4549–4554. [Google Scholar] [CrossRef]
- Xing, H.; Li, X.; Lu, Y.; Wu, Y.; He, Y.; Chen, Q.; Liu, Q.; Han, R.P.S. MXene/MWCNT electronic fabric with enhanced mechanical robustness on humidity sensing for real-time respiration monitoring. Sens. Actuators B Chem. 2022, 361, 131704. [Google Scholar] [CrossRef]
- Chang, S.-P.; Chang, S.-J.; Lu, C.-Y.; Li, M.-J.; Hsu, C.-L.; Chiou, Y.-Z.; Hsueh, T.-J.; Chen, I.C. A ZnO nanowire-based humidity sensor. Superlattices Microstruct. 2010, 47, 772–778. [Google Scholar] [CrossRef]
- Kumar, P.; Khadtare, S.; Park, J.; Yadav, B.C. Fabrication of leaf shaped SnO2 nanoparticles via sol–gel route and its application for the optoelectronic humidity sensor. Mater. Lett. 2020, 278, 128451. [Google Scholar] [CrossRef]
- McGhee, J.R.; Sagu, J.S.; Southee, D.J.; Wijayantha, K.G.U. Humidity Sensing Properties of Transparent Sputter-Coated Indium–Tin Oxide and Printed Polymer Structures. IEEE Sens. J. 2018, 18, 7358–7364. [Google Scholar] [CrossRef] [Green Version]
- Parthibavarman, M.; Karthik, M.; Prabhakaran, S. Facile and one step synthesis of WO3 nanorods and nanosheets as an efficient photocatalyst and humidity sensing material. Vacuum 2018, 155, 224–232. [Google Scholar] [CrossRef]
- Yu, S.; Zhang, H.; Chen, C.; Lin, C. Investigation of humidity sensor based on Au modified ZnO nanosheets via hydrothermal method and first principle. Sens. Actuators B Chem. 2019, 287, 526–534. [Google Scholar] [CrossRef]
- Xie, X.-J.; Si, R.-J.; Zheng, J.; Wei, K.; Zheng, X.-Y.; Chen, C.; Wang, C.-C. Synthesis of ZnO/NiO hollow spheres and their humidity sensing performance. J. Alloys Compd. 2021, 879, 160487. [Google Scholar] [CrossRef]
- Moharamzadeh, M.; Amoli, H.S.; Mozaffari, S.A. Fabrication of ultra-fast humidity ZITO nanoporous sensor by sol–gel technique for dynamic situation and human breath. J. Sol-Gel Sci. Technol. 2018, 85, 596–609. [Google Scholar] [CrossRef]
- Korotcenkov, G.; Cho, B.K. Instability of metal oxide-based conductometric gas sensors and approaches to stability improvement (short survey). Sens. Actuators B Chem. 2011, 156, 527–538. [Google Scholar] [CrossRef]
- Tomer, V.K.; Duhan, S. A facile nanocasting synthesis of mesoporous Ag-doped SnO2 nanostructures with enhanced humidity sensing performance. Sens. Actuators B Chem. 2016, 223, 750–760. [Google Scholar] [CrossRef]
- Yuan, Z.; Tai, H.; Bao, X.; Liu, C.; Ye, Z.; Jiang, Y. Enhanced humidity-sensing properties of novel graphene oxide/zinc oxide nanoparticles layered thin film QCM sensor. Mater. Lett. 2016, 174, 28–31. [Google Scholar] [CrossRef]
- Yan, H.; Chen, Z.; Zeng, L.; Wang, Z.; Zheng, G.; Zhou, R. The Effect of rGO-Doping on the Performance of SnO2/rGO Flexible Humidity Sensor. Nanomaterials 2021, 11, 3368. [Google Scholar] [CrossRef] [PubMed]
- Yu, S.; Chen, C.; Zhang, H.; Zhang, J.; Liu, J. Design of high sensitivity graphite carbon nitride/zinc oxide humidity sensor for breath detection. Sens. Actuators B Chem. 2021, 332, 129536. [Google Scholar] [CrossRef]
- Lin, H.E.; Katayanagi, Y.; Kishi, T.; Yano, T.; Matsushita, N. A solution-processed tin dioxide film applicable as a transparent and flexible humidity sensor. RSC Adv. 2018, 8, 30310–30319. [Google Scholar] [CrossRef] [PubMed] [Green Version]
- Li, F.; Li, P.; Zhang, H. Preparation and Research of a High-Performance ZnO/SnO2 Humidity Sensor. Sensors 2021, 22, 293. [Google Scholar] [CrossRef] [PubMed]
- Chang, P.Y.; Lin, C.F.; El Khoury Rouphael, S.; Huang, T.H.; Wu, C.M.; Berling, D.; Yeh, P.H.; Lu, C.J.; Meng, H.F.; Zan, H.W.; et al. Near-Infrared Laser-Annealed IZO Flexible Device as a Sensitive H2S Sensor at Room Temperature. ACS Appl. Mater. Interfaces 2020, 12, 24984–24991. [Google Scholar] [CrossRef]
- Huang, T.-H.; Li, P.-Y.; Yang, J.-B.; Liu, T.-Y.; Chen, M.-H.; Liu, P.-T.; Meng, H.-F.; Lu, C.-J.; Soppera, O.; Yeh, P.-H.; et al. Vertical channel metal-oxide clusters as sensitive NO2 sensor with modulated response at room temperature. Sens. Actuators B Chem. 2022, 354, 131222. [Google Scholar] [CrossRef]
- Selim, M.S. Room temperature sensitivity of (SnO2–ZrO2) sol–gel thin films. Sens. Actuators A Phys. 2000, 84, 76–80. [Google Scholar] [CrossRef]
- Zhong, Y.; Li, W.; Zhao, X.; Jiang, X.; Lin, S.; Zhen, Z.; Chen, W.; Xie, D.; Zhu, H. High-Response Room-Temperature NO2 Sensor and Ultrafast Humidity Sensor Based on SnO2 with Rich Oxygen Vacancy. ACS Appl. Mater. Interfaces 2019, 11, 13441–13449. [Google Scholar] [CrossRef]
- Carvalho, D.H.Q.; Schiavon, M.A.; Raposo, M.T.; de Paiva, R.; Alves, J.L.A.; Paniago, R.M.; Speziali, N.L.; Ferlauto, A.S.; Ardisson, J.D. Synthesis and characterization of SnO2 thin films prepared by dip-coating method. Phys. Procedia 2012, 28, 22–27. [Google Scholar] [CrossRef] [Green Version]
- Zeng, Q.; Cui, Y.; Zhu, L.; Yao, Y. Increasing oxygen vacancies at room temperature in SnO2 for enhancing ethanol gas sensing. Mater. Sci. Semicond. Process 2020, 111, 104962. [Google Scholar] [CrossRef]
- Farahani, H.; Wagiran, R.; Hamidon, M.N. Humidity sensors principle, mechanism, and fabrication technologies: A comprehensive review. Sensors 2014, 14, 7881–7939. [Google Scholar] [CrossRef] [PubMed] [Green Version]
- Lim, D.-I.; Cha, J.-R.; Gong, M.-S. Preparation of flexible resistive micro-humidity sensors and their humidity-sensing properties. Sens. Actuators B Chem. 2013, 183, 574–582. [Google Scholar] [CrossRef]
- Duan, Z.; Jiang, Y.; Tai, H. Recent advances in humidity sensor for human body related humidity detections. J. Mater. Chem. C 2021, 9, 14963. [Google Scholar] [CrossRef]


Disclaimer/Publisher’s Note: The statements, opinions and data contained in all publications are solely those of the individual author(s) and contributor(s) and not of MDPI and/or the editor(s). MDPI and/or the editor(s) disclaim responsibility for any injury to people or property resulting from any ideas, methods, instructions or products referred to in the content. |
© 2023 by the authors. Licensee MDPI, Basel, Switzerland. This article is an open access article distributed under the terms and conditions of the Creative Commons Attribution (CC BY) license (https://creativecommons.org/licenses/by/4.0/).
Share and Cite
Deb, M.; Chen, M.-Y.; Chang, P.-Y.; Li, P.-H.; Chan, M.-J.; Tian, Y.-C.; Yeh, P.-H.; Soppera, O.; Zan, H.-W. SnO2-Based Ultra-Flexible Humidity/Respiratory Sensor for Analysis of Human Breath. Biosensors 2023, 13, 81. https://doi.org/10.3390/bios13010081
Deb M, Chen M-Y, Chang P-Y, Li P-H, Chan M-J, Tian Y-C, Yeh P-H, Soppera O, Zan H-W. SnO2-Based Ultra-Flexible Humidity/Respiratory Sensor for Analysis of Human Breath. Biosensors. 2023; 13(1):81. https://doi.org/10.3390/bios13010081
Chicago/Turabian StyleDeb, Moumita, Mei-Yu Chen, Po-Yi Chang, Pin-Hsuan Li, Ming-Jen Chan, Ya-Chung Tian, Ping-Hung Yeh, Olivier Soppera, and Hsiao-Wen Zan. 2023. "SnO2-Based Ultra-Flexible Humidity/Respiratory Sensor for Analysis of Human Breath" Biosensors 13, no. 1: 81. https://doi.org/10.3390/bios13010081