Utilization of Personalized Machine-Learning to Screen for Dysglycemia from Ambulatory ECG, toward Noninvasive Blood Glucose Monitoring

 , , and
Abstract
:1. Introduction
2. Materials and Methods
2.1. Dataset Collection and Inclusion Criteria
2.2. Training and Validation Dataset
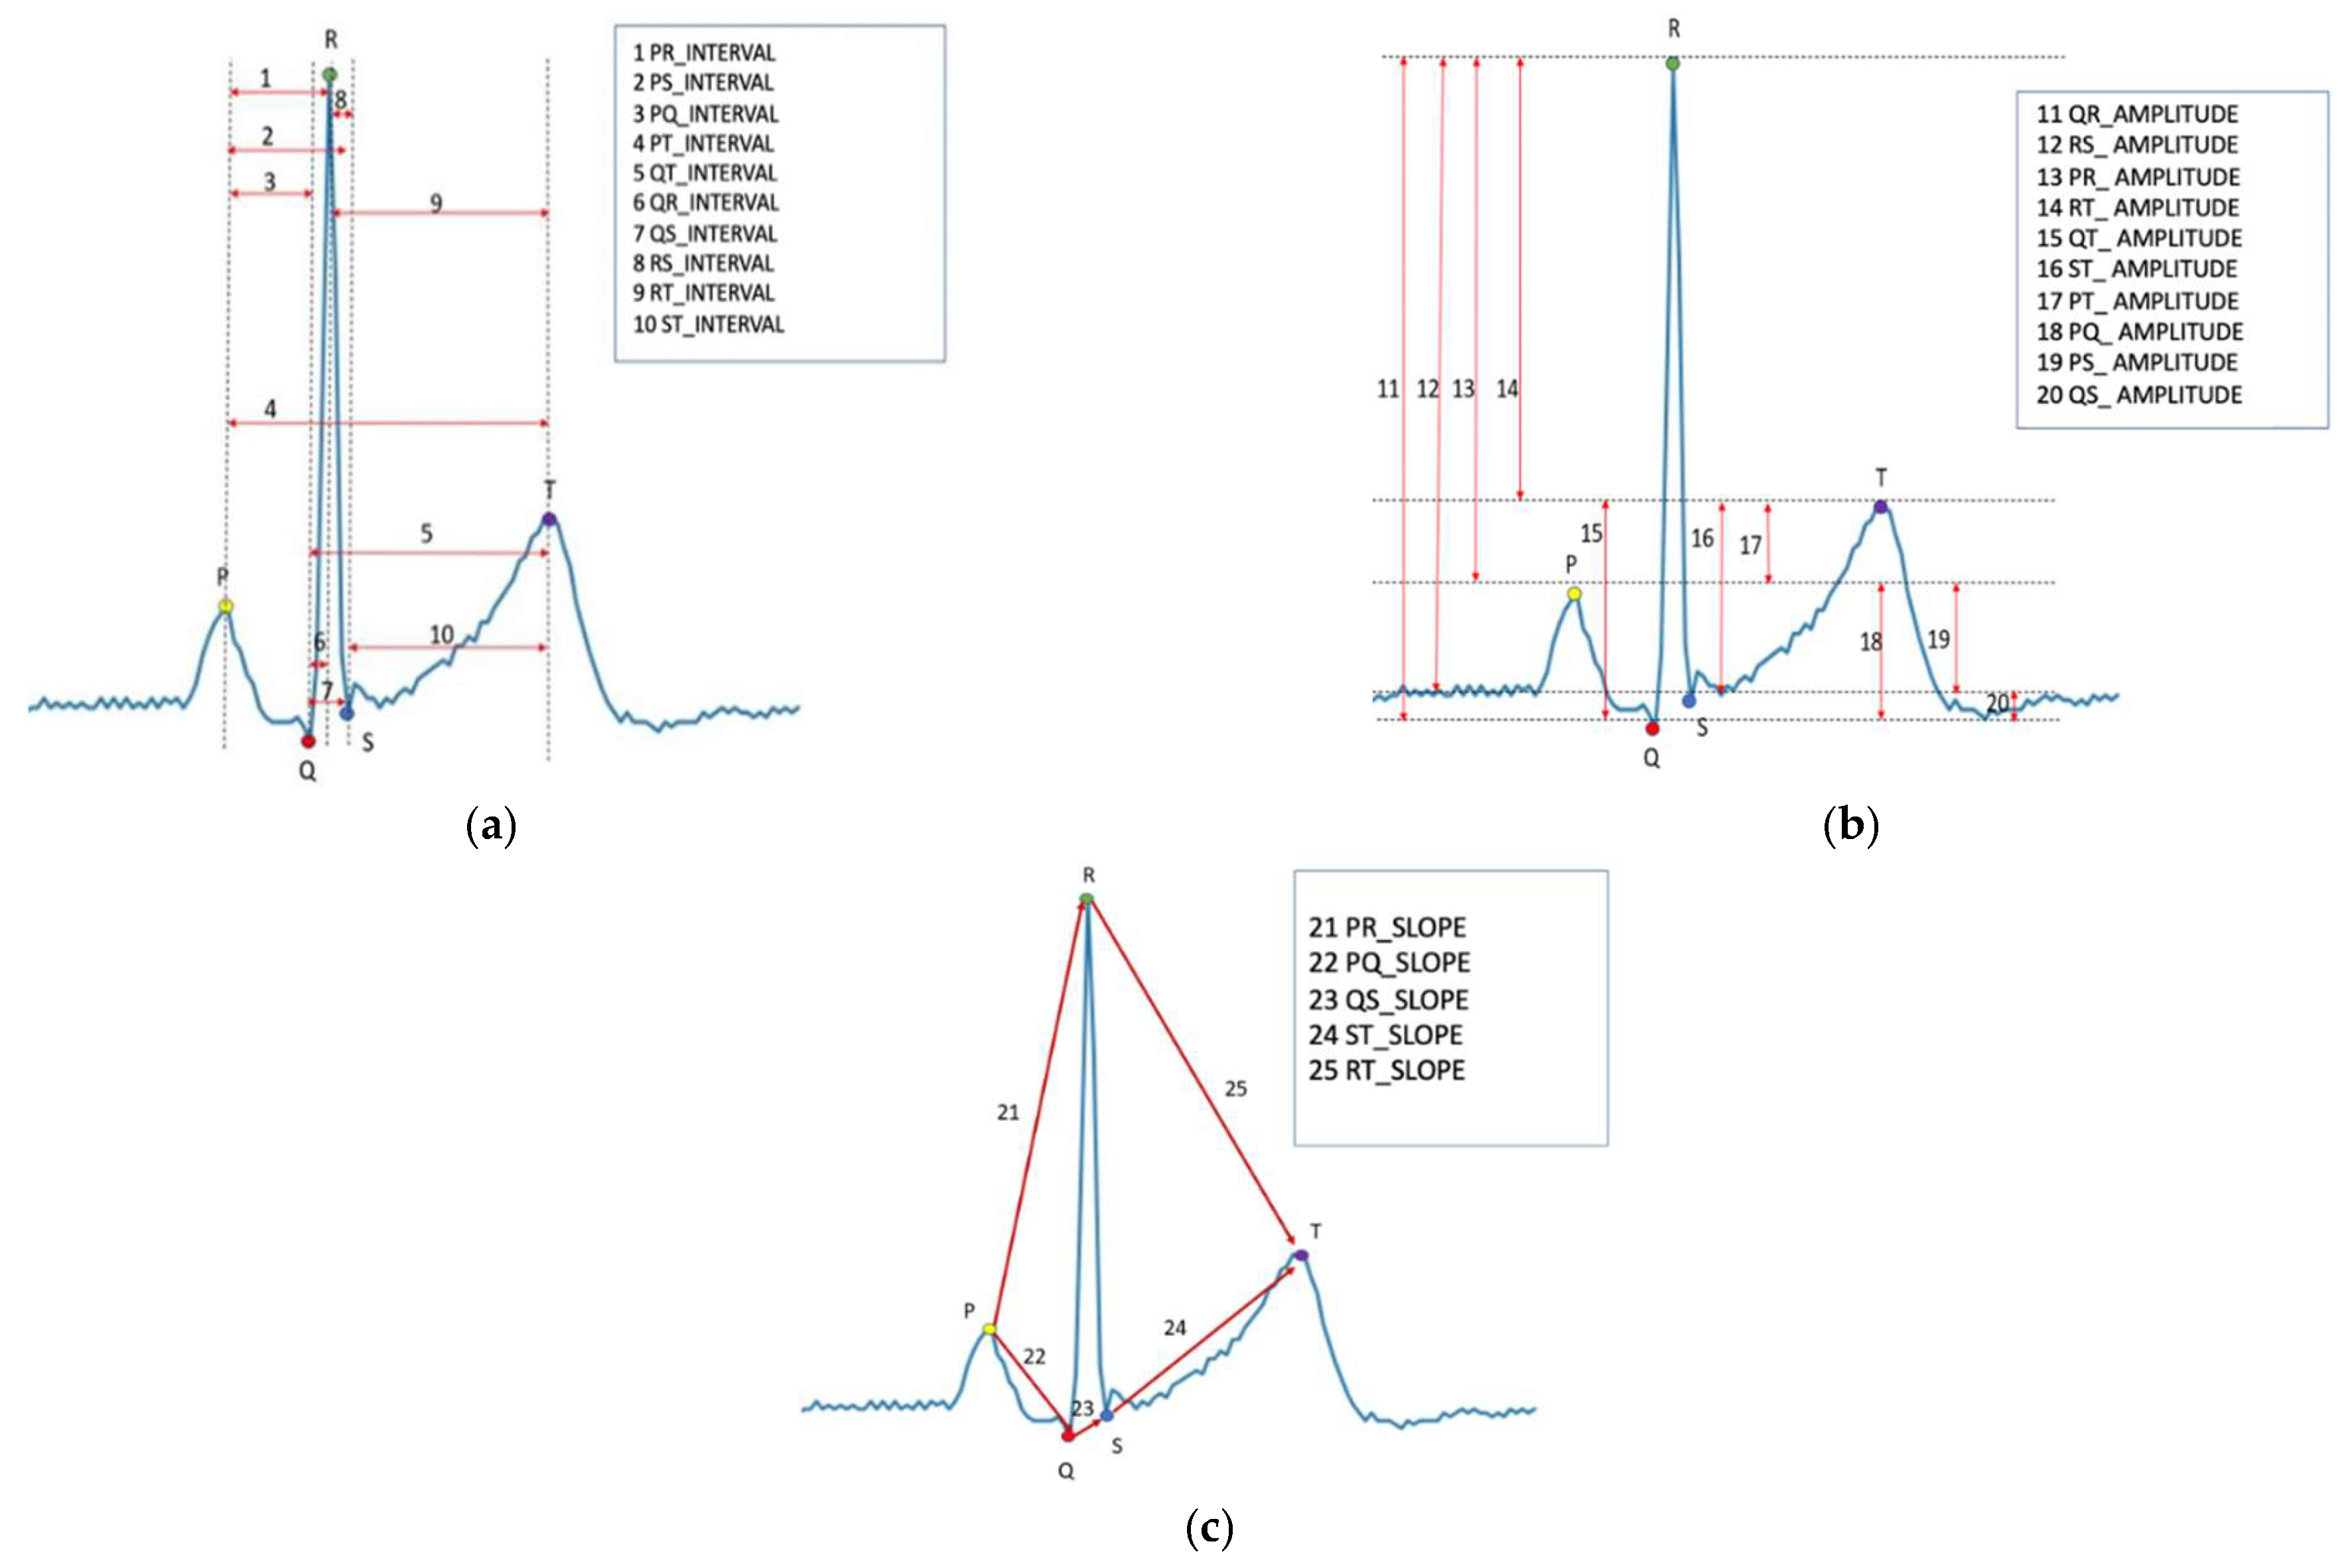
2.3. ECG Segmentation and Feature Extraction
2.4. Machine-Learning Algorithm
2.5. Statistical Analysis
3. Results
4. Discussion
5. Conclusions
Supplementary Materials
Author Contributions
Funding
Institutional Review Board Statement
Informed Consent Statement
Data Availability Statement
Conflicts of Interest
References
- Capes, S.E.; Hunt, D.; Malmberg, K.; Gerstein, H.C. Stress hyperglycaemia and increased risk of death after myocardial infarction in patients with and without diabetes: A systematic overview. Lancet 2000, 355, 773–778. [Google Scholar] [CrossRef]
- Sung, J.; Bochicchio, G.V.; Joshi, M.; Bochicchio, K.; Tracy, K.; Scalea, T.M. Admission hyperglycemia is predictive of outcome in critically ill trauma patients. J. Trauma 2005, 59, 80–83. [Google Scholar] [CrossRef]
- Krinsley, J.S. Association between hyperglycemia and increased hospital mortality in a heterogeneous population of critically ill patients. Mayo Clin. Proc. 2003, 78, 1471–1478. [Google Scholar] [CrossRef] [Green Version]
- Falciglia, M.; Freyberg, R.W.; Almenoff, P.L.; D’Alessio, D.A.; Render, M.L. Hyperglycemia-related mortality in critically ill patients varies with admission diagnosis. Crit. Care Med. 2009, 37, 3001–3009. [Google Scholar] [CrossRef]
- Armstrong, C. ADA Updates Standards of Medical Care for Patients with Diabetes Mellitus. Am. Fam. Physician 2017, 95, 40–43. [Google Scholar]
- Battelino, T.; Phillip, M.; Bratina, N.; Nimri, R.; Oskarsson, P.; Bolinder, J. Effect of continuous glucose monitoring on hypoglycemia in type 1 diabetes. Diabetes Care 2011, 34, 795–800. [Google Scholar] [CrossRef] [Green Version]
- Karter, A.J.; Ferrara, A.; Darbinian, J.A.; Ackerson, L.M.; Selby, J.V. Self-monitoring of blood glucose: Language and financial barriers in a managed care population with diabetes. Diabetes Care 2000, 23, 477–483. [Google Scholar] [CrossRef] [Green Version]
- Vincze, G.; Barner, J.C.; Lopez, D. Factors associated with adherence to self-monitoring of blood glucose among persons with diabetes. Diabetes Educ. 2004, 30, 112–125. [Google Scholar] [CrossRef]
- Cappon, G.; Vettoretti, M.; Sparacino, G.; Facchinetti, A. Continuous Glucose Monitoring Sensors for Diabetes Management: A Review of Technologies and Applications. Diabetes Metab. J. 2019, 43, 383–397. [Google Scholar] [CrossRef]
- Chen, C.; Zhao, X.L.; Li, Z.H.; Zhu, Z.G.; Qian, S.H.; Flewitt, A.J. Current and Emerging Technology for Continuous Glucose Monitoring. Sensors 2017, 17, 182. [Google Scholar] [CrossRef] [Green Version]
- So, C.F.; Choi, K.S.; Wong, T.K.; Chung, J.W. Recent advances in noninvasive glucose monitoring. Med. Devices 2012, 5, 45–52. [Google Scholar]
- Juan, C.G.; Potelon, B.; Quendo, C.; Bronchalo, E. Microwave Planar Resonant Solutions for Glucose Concentration Sensing: A Systematic Review. Appl. Sci. 2021, 11, 7018. [Google Scholar] [CrossRef]
- Singh, J.P.; Larson, M.; O’Donnell, C.J.; Wilson, P.F.; Tsuji, H.; Lloyd-Jones, D.; Levy, D. Association of hyperglycemia with reduced heart rate variability (The Framingham Heart Study). Am. J. Cardiol. 2000, 86, 309–312. [Google Scholar] [CrossRef] [PubMed]
- Laptev, D.N.; Riabykina, G.V.; Seid-Guseĭnov, A.A. 24-hours monitoring of ECG and glucose level for detection of relations between glycemia and QT interval duration in patients with type 1 diabetes. Ter. Arkh. 2009, 81, 28–33. [Google Scholar]
- Tobore, I.; Li, J.; Kandwal, A.; Yuhang, L.; Nie, Z.; Wang, L. Statistical and spectral analysis of ECG signal towards achieving non-invasive blood glucose monitoring. BMC Med. Inform. Decis. Mak. 2019, 19, 266. [Google Scholar] [CrossRef]
- Hannun, A.Y.; Rajpurkar, P.; Haghpanahi, M.; Tison, G.H.; Bourn, C.; Turakhia, M.P.; Ng, A.Y. Cardiologist-level arrhythmia detection and classification in ambulatory electrocardiograms using a deep neural network. Nat. Med. 2019, 25, 65–69. [Google Scholar] [CrossRef]
- Attia, Z.I.; Noseworthy, P.A.; Lopez-Jimenez, F.; Asirvatham, S.J.; Deshmukh, A.J.; Gersh, B.J.; E Carter, R.; Yao, X.; A Rabinstein, A.; Erickson, B.J.; et al. An artificial intelligence-enabled ECG algorithm for the identification of patients with atrial fibrillation during sinus rhythm: A retrospective analysis of outcome prediction. Lancet 2019, 394, 8617. [Google Scholar] [CrossRef]
- Galloway, C.D.; Valys, A.V.; Shreibati, J.B.; Treiman, D.L.; Petterson, F.L.; Gundotra, V.P.; Albert, D.E.; Attia, Z.I.; Carter, R.E.; Asirvatham, S.J.; et al. Development and validation of a deep-learning model to screen for hyperkalemia from the electrocardiogram. JAMA Cardiol. 2019, 4, 428–436. [Google Scholar] [CrossRef]
- Mujahid, O.; Contreras, I.; Vehi, J. Machine Learning Techniques for Hypoglycemia Prediction: Trends and Challenges. Sensors 2021, 21, 546. [Google Scholar] [CrossRef]
- Kodama, S.; Fujihara, K.; Shiozaki, H.; Horikawa, C.; Yamada, M.H.; Sato, T.; Yaguchi, Y.; Yamamoto, M.; Kitazawa, M.; Iwanaga, M.; et al. Ability of Current Machine Learning Algorithms to Predict and Detect Hypoglycemia in Patients with Diabetes Mellitus: Meta-analysis. JMIR Diabetes 2021, 6, e22458. [Google Scholar] [CrossRef]
- Moody, B.; Moody, G.; Villarroel, M.; Clifford, G.; Silva, I. MIMIC-III Waveform Database Matched Subset (version 1.0). PhysioNet 2020. [Google Scholar] [CrossRef]
- Johnson, A.E.W.; Pollard, T.J.; Shen, L.; Lehman, L.-W.H.; Feng, M.; Ghassemi, M.; Moody, B.; Szolovits, P.; Celi, L.A.; Mark, R.G. MIMIC-III, a freely accessible critical care database. Sci. Data 2016, 3, 160035. [Google Scholar] [CrossRef] [PubMed] [Green Version]
- Carreiras, C.; Alves, A.P.; Lourenço, A.; Canento, F.; Silva, H.; Fred, A. BioSPPy-Biosignal Processing in Python. 2015. Available online: https://github.com/PIA-Group/BioSPPy/ (accessed on 7 December 2022).
- Lee, G.; Gommers, R.; Wohlfahrt, K.; Wasilewski, F.; O’Leary, A.; Nahrstaedt, H.; Sauvé, A.; Agrawal, A.; Pelt, D.M.; Oliveira, H.; et al. PyWavelets/pywt: V1.4.1. Zenodo 2022. [Google Scholar] [CrossRef]
- Wagner, J.; Malchoff, C.; Abbott, G. Invasiveness as a barrier to self-monitoring of blood glucose in diabetes. Diabetes Technol. Ther. 2005, 7, 612–619. [Google Scholar] [CrossRef] [PubMed]
- Isakadze, N.; Martin, S.S. How useful is the smartwatch ECG? Trends Cardiovasc. Med. 2020, 30, 442–448. [Google Scholar] [CrossRef]
- Gruden, G.; Giunti, S.; Barutta, F.; Chaturvedi, N.; Witte, D.R.; Tricarico, M.; Fuller, J.H.; Cavallo Perin, P.; Bruno, G. QTc interval prolongation is independently associated with severe hypoglycemic attacks in type 1 diabetes from the EURODIAB IDDM complications study. Diabetes Care 2012, 35, 125–127. [Google Scholar] [CrossRef] [Green Version]
- Pickham, D.; Flowers, E.; Drew, B.J. Hyperglycemia is associated with corrected QT prolongation and mortality in acutely ill patients. J. Cardiovasc. Nurs. 2014, 29, 264–270. [Google Scholar] [CrossRef] [Green Version]
- Pan, G.Z.; Xie, J.; Tian, X.F.; Yang, S.W.; Zhou, Y.J. The Impact of Different Plasma Glucose Levels on Heart Rate in Experimental Rats with Acute Myocardial Infarction. Cardiol. Res. 2016, 7, 146–151. [Google Scholar] [CrossRef] [Green Version]
- Ling, S.H.; San, P.P.; Lam, H.K.; Nguyen, H.T. Hypoglycemia detection: Multiple regression-based combinational neural logic approach. Soft Comput. 2017, 21, 543–553. [Google Scholar] [CrossRef]
- San, P.P.; Ling, S.H.; Nguyen, H.T. Deep learning framework for detection of hypoglycemic episodes in children with type 1 diabetes. Annu. Int. Conf. IEEE Eng. Med. Biol. Soc. 2016, 2016, 3503–3506. [Google Scholar]
- Cordeiro, R.; Karimian, N.; Park, Y. Hyperglycemia Identification Using ECG in Deep Learning Era. Sensors 2021, 21, 6263. [Google Scholar] [CrossRef]
- Nguyen, L.L.; Su, S.; Nguyen, H.T. Identification of hypoglycemia and hyperglycemia in type 1 diabetic patients using ECG parameters. Annu. Int. Conf. IEEE Eng. Med. Biol. Soc. 2012, 2012, 2716–2719. [Google Scholar] [PubMed]
- Porumb, M.; Stranges, S.; Pescapè, A.; Pecchia, L. Precision Medicine and Artificial Intelligence: A Pilot Study on Deep Learning for Hypoglycemic Events Detection based on ECG. Sci. Rep. 2020, 10, 170. [Google Scholar] [CrossRef] [Green Version]
- Lipponen, J.A.; Kemppainen, J.; Karjalainen, P.A.; Laitinen, T.; Mikola, H.; Kärki, T.; Tarvainen, M.P. Dynamic estimation of cardiac repolarization characteristics during hypoglycemia in healthy and diabetic subjects. Physiol. Meas. 2011, 32, 649–660. [Google Scholar] [CrossRef]
- Olde Bekkink, M.; Koeneman, M.; de Galan, B.E.; Bredie, S.J. Early Detection of Hypoglycemia in Type 1 Diabetes Using Heart Rate Variability Measured by a Wearable Device. Diabetes Care 2019, 42, 689–692. [Google Scholar] [CrossRef] [Green Version]
- Amanipour, R.; Nazeran, H.; Reyes, I.; Franco, M.; Haltiwanger, E. The effects of blood glucose changes on frequency-domain measures of HRV signal in type 1 diabetes. In Proceedings of the CONIELECOMP 2012, 22nd International Conference on Electrical Communications and Computers, Cholula, Puebla, Mexico, 27–29 February 2012; pp. 50–54. [Google Scholar]
- Gordin, D.; Forsblom, C.; Rönnback, M.; Groop, P.H. Acute hyperglycaemia disturbs cardiac repolarization in Type 1 diabetes. Diabet Med. 2008, 25, 101–105. [Google Scholar] [CrossRef]
- Robinson, R.T.; Harris, N.D.; Ireland, R.H.; Lee, S.; Newman, C.; Heller, S.R. Mechanisms of abnormal cardiac repolarization during insulin-induced hypoglycemia. Diabetes 2003, 52, 1469–1474. [Google Scholar] [CrossRef] [PubMed] [Green Version]
- Kaze, A.D.; Yuyun, M.F.; Erqou, S.; Fonarow, G.C.; Echouffo-Tcheugui, J.B. Severe Hypoglycemia and Incidence of QT Interval Prolongation Among Adults with Type 2 Diabetes. J. Clin. Endocrinol. Metab. 2022, 107, e2743-50. [Google Scholar] [CrossRef]
- van Noord, C.; Sturkenboom, M.C.; Straus, S.M.; Hofman, A.; Kors, J.A.; Witteman, J.C.; Stricker, B.H. Serum glucose and insulin are associated with QTc and RR intervals in nondiabetic elderly. Eur. J. Endocrinol. 2010, 162, 241–248. [Google Scholar] [CrossRef] [Green Version]
- Laitinen, T.; Lyyra-Laitinen, T.; Huopio, H.; Vauhkonen, I.; Halonen, T.; Hartikainen, J.; Niskanen, L.; Laakso, M. Electrocardiographic alterations during hyperinsulinemic hypoglycemia in healthy subjects. Ann. Noninvasive Electrocardiol. 2008, 13, 97–105. [Google Scholar] [CrossRef]
- Marfella, R.; Nappo, F.; De Angelis, L.; Siniscalchi, M.; Rossi, F.; Giugliano, D. The effect of acute hyperglycaemia on QTc duration in healthy man. Diabetologia 2000, 43, 571–575. [Google Scholar] [CrossRef] [PubMed] [Green Version]
- Bathula, R.; Hughes, A.D.; Panerai, R.; Potter, J.; Thom, S.A.M.; Francis, D.P.; Shore, A.C.; Kooner, J.; Chaturvedi, N. Indian Asians have poorer cardiovascular autonomic function than Europeans: This is due to greater hyperglycaemia and may contribute to their greater risk of heart disease. Diabetologia 2010, 53, 2120–2128. [Google Scholar] [CrossRef] [Green Version]
- Bouzid, Z.; Al-Zaiti, S.S.; Bond, R.; Sejdić, E. Remote and wearable ECG devices with diagnostic abilities in adults: A state-of-the-science scoping review. Heart Rhythm. 2022, 19, 1192–1201. [Google Scholar] [CrossRef] [PubMed]


| Variables | Median (IQR)/N (%) |
|---|---|
| Age, median (IQR) | 64 (55–72) |
| Male, n (%) | 27 (54.0) |
| Race | |
| White | 29 (58.0) |
| Black | 10 (20.0) |
| Asian | 2 (4.0) |
| Latino | 2 (4.0) |
| Height (cm), median (IQR) | 172 (163–180) |
| Weight (Kg), median (IQR) | 83.6 (70.2–96.3) |
| BMI, median (IQR) | 27.9 (25.4–29.7) |
| Diagnosis at admission | |
| Cardiovascular | 13 (26.0) |
| CNS | 11 (22.0) |
| Respiratory | 7 (14.0) |
| Infectious | 6 (12.0) |
| Gastrointestinal | 4 (8.0) |
| Metabolic | 4 (8.0) |
| Others | 5 (10.0) |
| Normal | Dysglycemia | p-Value | |
|---|---|---|---|
| R–R interval (s) | 0.74 ± 0.52 | 0.66 ± 0.50 | <0.001 |
| P–Q interval (s) | 0.13 ± 0.07 | 0.16 ± 0.09 | <0.001 |
| Q–R interval (s) | 0.08 ± 0.06 | 0.07 ± 0.05 | <0.001 |
| R–S interval (s) | 0.04 ± 0.03 | 0.05 ± 0.03 | <0.001 |
| S–T interval (s) | 0.25 ± 0.08 | 0.32 ± 0.09 | <0.001 |
| P–R interval (s) | 0.21 ± 0.09 | 0.23 ± 0.10 | <0.001 |
| Q–T interval (s) | 0.37 ± 0.13 | 0.44 ± 0.15 | <0.001 |
| P–Q amplitude (mV) | 0.13 ± 0.05 | 0.15 ± 0.07 | <0.001 |
| Q–R amplitude (mV) | 0.68 ± 0.46 | 0.56 ± 0.43 | <0.001 |
| R–S amplitude (mV) | 0.75 ± 0.56 | 0.71 ± 0.49 | <0.001 |
| Q–S amplitude (mV) | 0.07 ± 0.05 | 0.05 ± 0.04 | <0.001 |
| S–T amplitude (mV) | 0.64 ± 0.43 | 0.58 ± 0.34 | <0.001 |
| P–R slope (mV/s) | 0.61 ± 0.58 | 0.81 ± 0.79 | <0.001 |
| P–Q slope (mV/s) | −1.14 ± 0.53 | −1.08 ± 0.58 | <0.001 |
| Q–S slope (mV/s) | −0.31 ± 0.27 | −0.12 ± 0.08 | <0.001 |
| S–T slope (mV/s) | 5.92 ± 5.91 | 4.64 ± 4.95 | <0.001 |
| R–T slope (mV/s) | −0.68 ± 0.60 | −0.58 ± 0.68 | <0.001 |
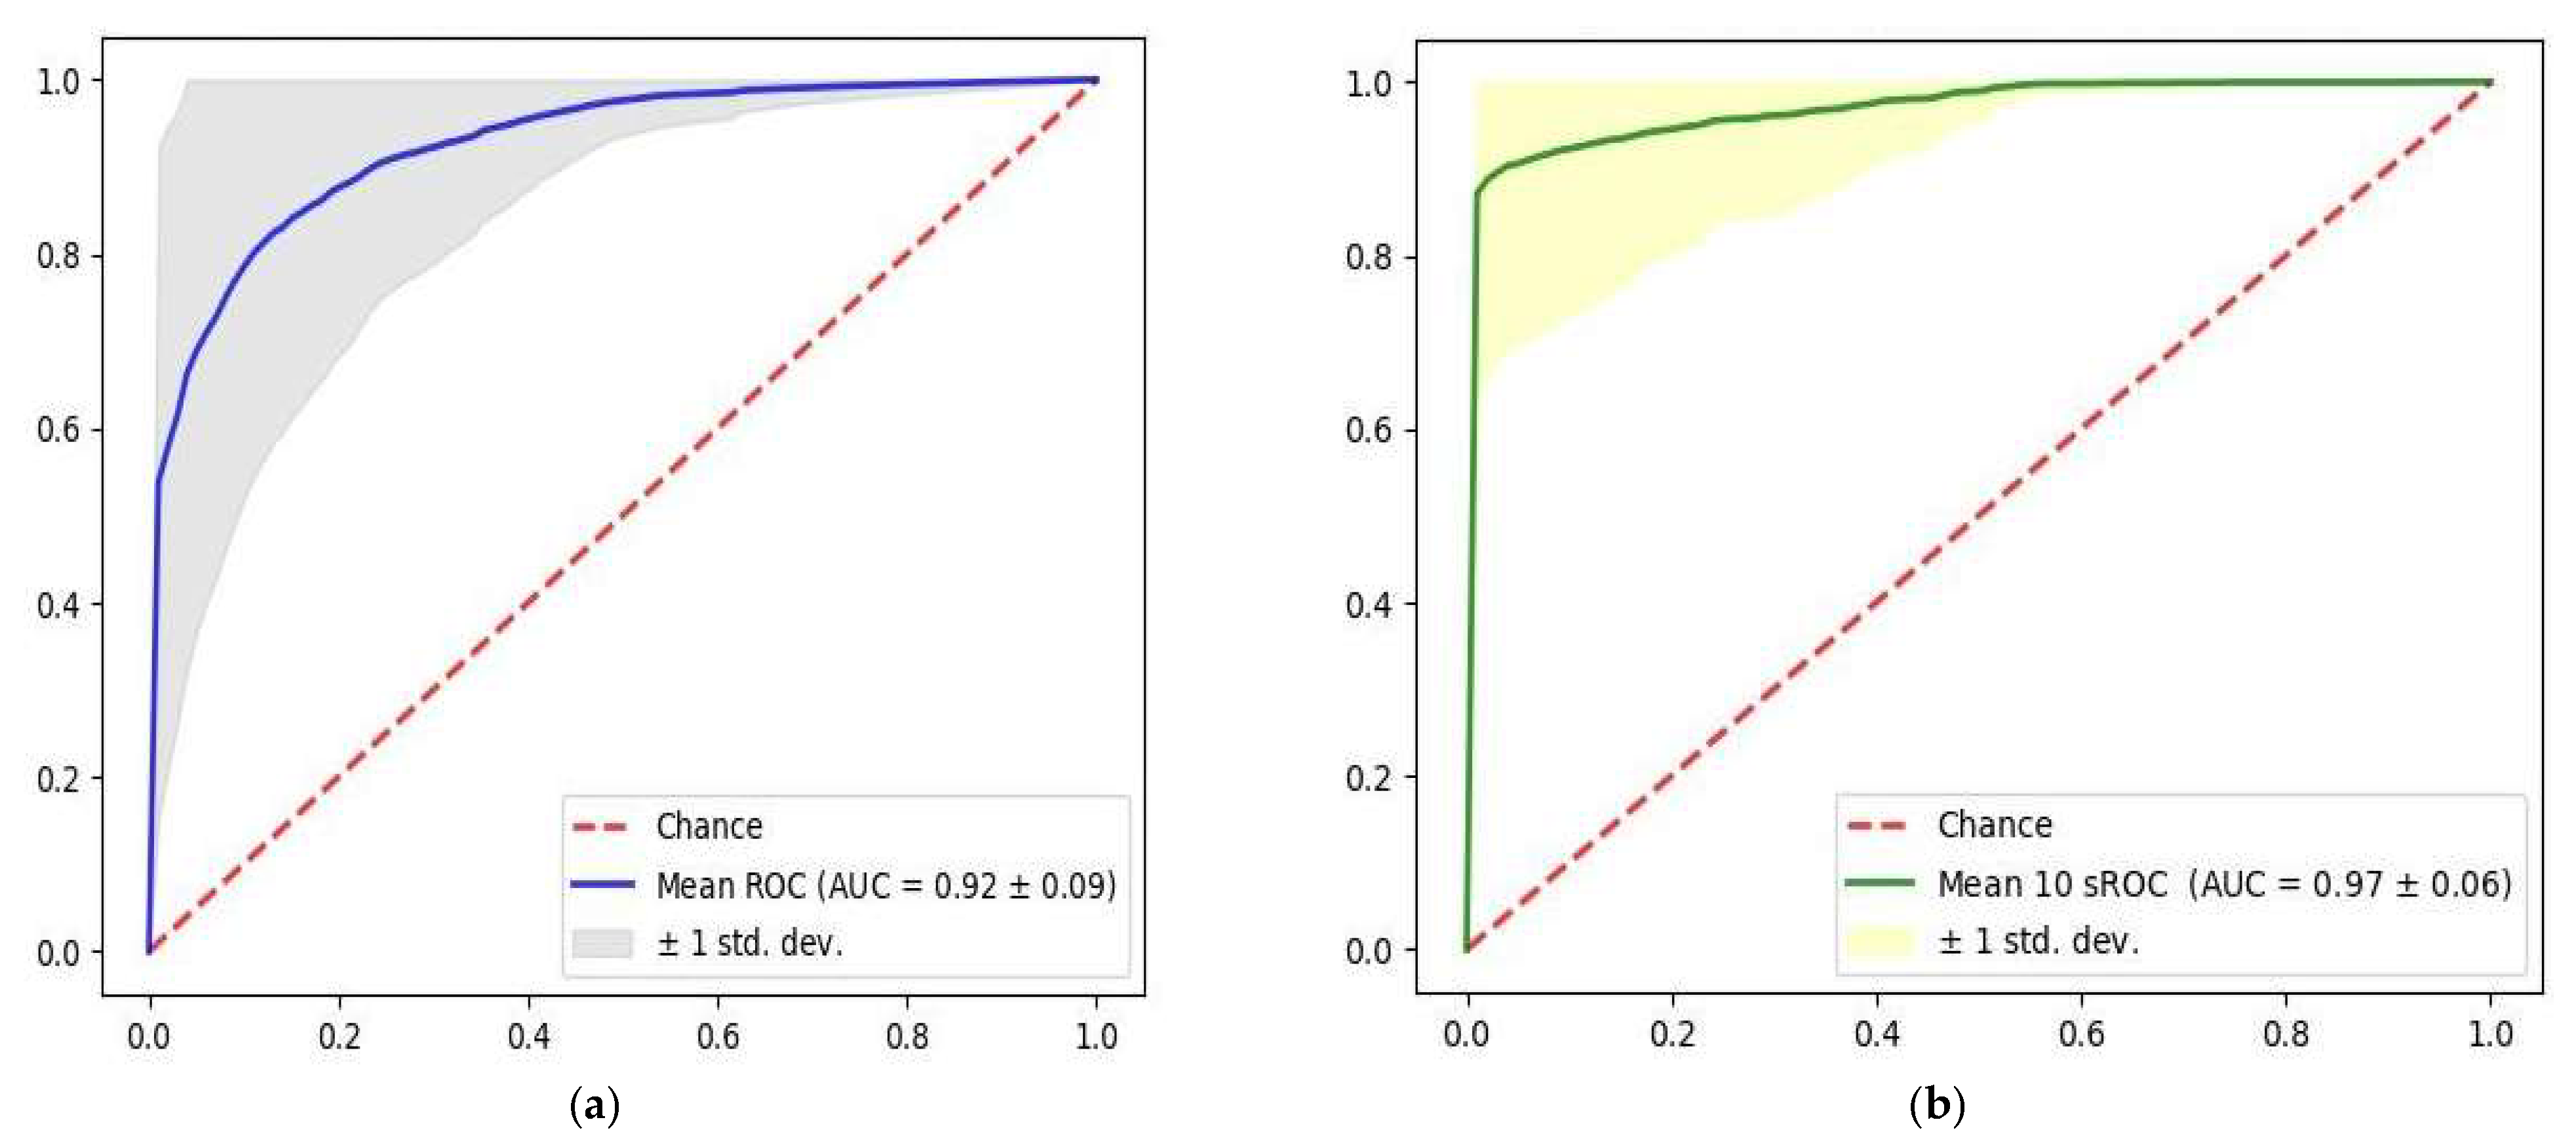
| Oc-SVM | AUC | Sensitivity | Specificity | PPV | NPV |
|---|---|---|---|---|---|
| Single heartbeat | 0.92 ± 0.09 | 0.92 ± 0.10 | 0.84 ± 0.04 | 0.85 ± 0.03 | 0.92 ± 0.09 |
| 10 s | 0.97 ± 0.06 | 0.97 ± 0.09 | 0.96 ± 0.04 | 0.96 ± 0.04 | 0.97 ± 0.09 |
| ECG Features | F-Score |
|---|---|
| R–R interval | 591 |
| R–S amplitude | 271 |
| P–T amplitude | 153 |
| Q–R amplitude | 150 |
| Q–T interval | 98 |
| S–T slope | 97 |
| R–T amplitude | 76 |
| R–S interval | 76 |
| P–S amplitude | 72 |
| P–Q amplitude | 69 |
| P–R slope | 69 |
| R–T slope | 69 |
Disclaimer/Publisher’s Note: The statements, opinions and data contained in all publications are solely those of the individual author(s) and contributor(s) and not of MDPI and/or the editor(s). MDPI and/or the editor(s) disclaim responsibility for any injury to people or property resulting from any ideas, methods, instructions or products referred to in the content. |
© 2022 by the authors. Licensee MDPI, Basel, Switzerland. This article is an open access article distributed under the terms and conditions of the Creative Commons Attribution (CC BY) license (https://creativecommons.org/licenses/by/4.0/).
Share and Cite
Chiu, I.-M.; Cheng, C.-Y.; Chang, P.-K.; Li, C.-J.; Cheng, F.-J.; Lin, C.-H.R. Utilization of Personalized Machine-Learning to Screen for Dysglycemia from Ambulatory ECG, toward Noninvasive Blood Glucose Monitoring. Biosensors 2023, 13, 23. https://doi.org/10.3390/bios13010023
Chiu I-M, Cheng C-Y, Chang P-K, Li C-J, Cheng F-J, Lin C-HR. Utilization of Personalized Machine-Learning to Screen for Dysglycemia from Ambulatory ECG, toward Noninvasive Blood Glucose Monitoring. Biosensors. 2023; 13(1):23. https://doi.org/10.3390/bios13010023
Chicago/Turabian StyleChiu, I-Min, Chi-Yung Cheng, Po-Kai Chang, Chao-Jui Li, Fu-Jen Cheng, and Chun-Hung Richard Lin. 2023. "Utilization of Personalized Machine-Learning to Screen for Dysglycemia from Ambulatory ECG, toward Noninvasive Blood Glucose Monitoring" Biosensors 13, no. 1: 23. https://doi.org/10.3390/bios13010023