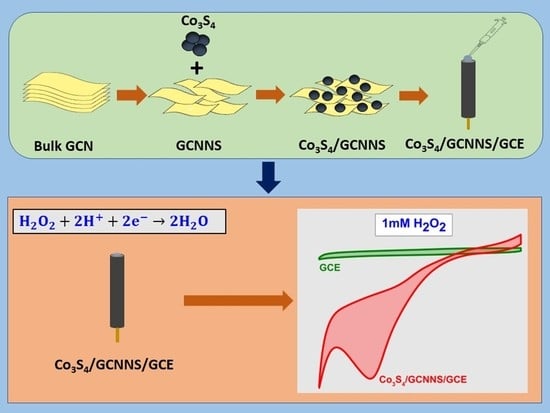
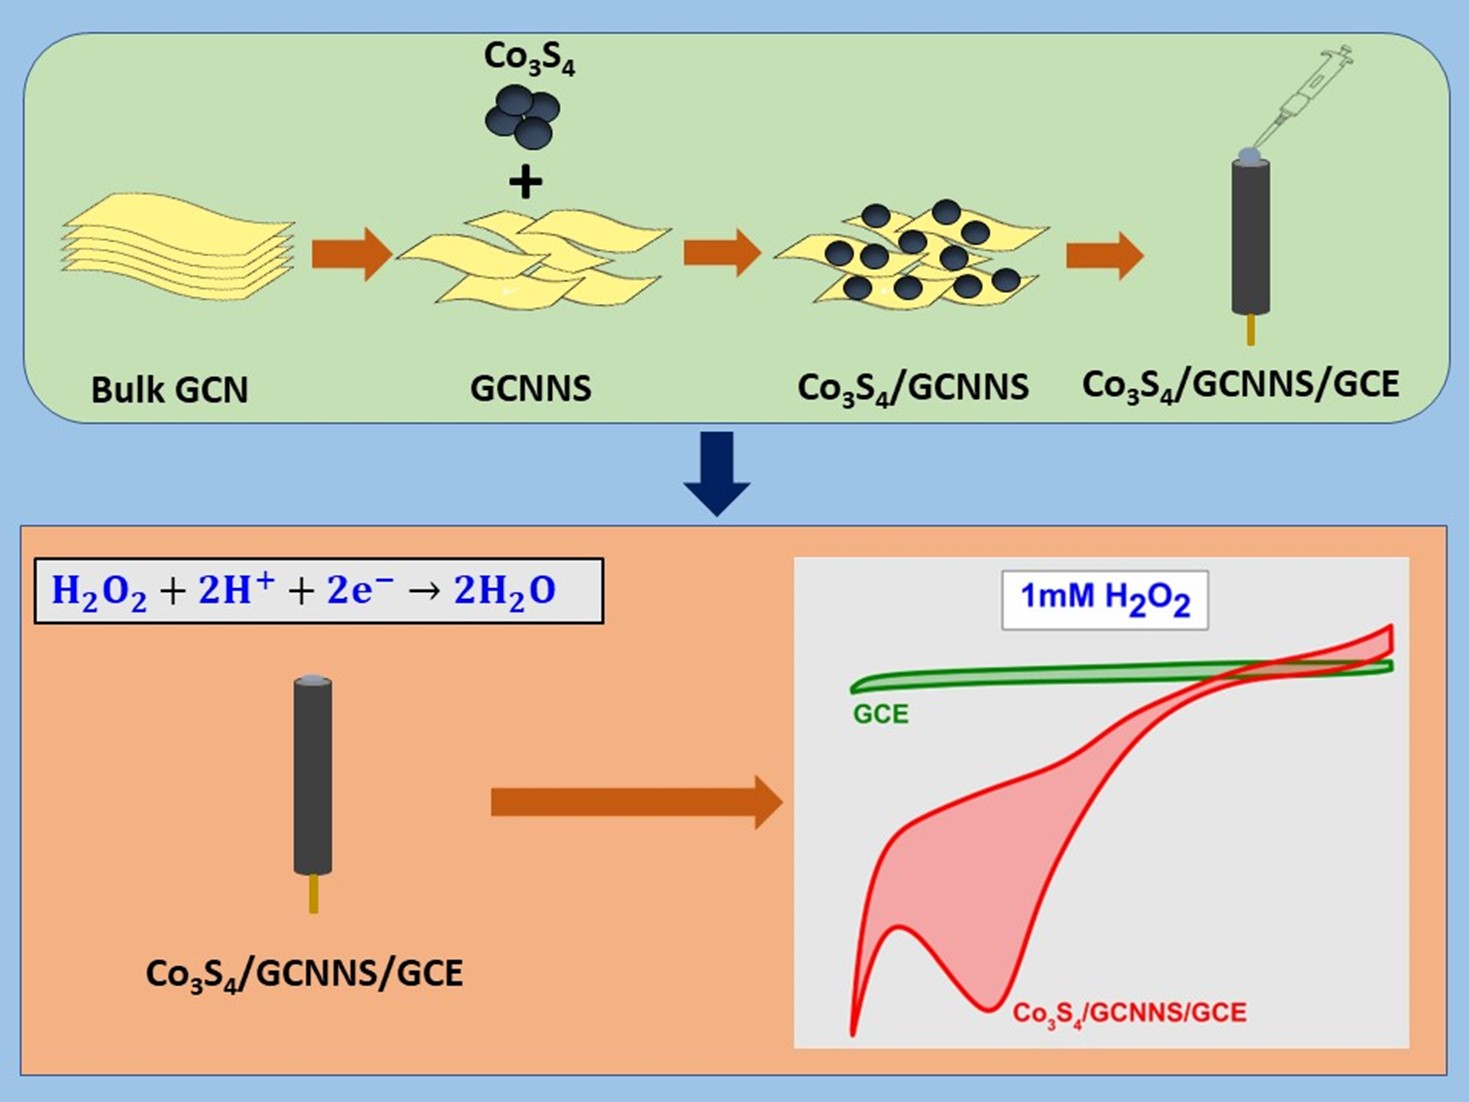
Hybridization of Co3S4 and Graphitic Carbon Nitride Nanosheets for High-performance Nonenzymatic Sensing of H2O2

 ,
,
Abstract
:
1. Introduction
2. Experimental Section
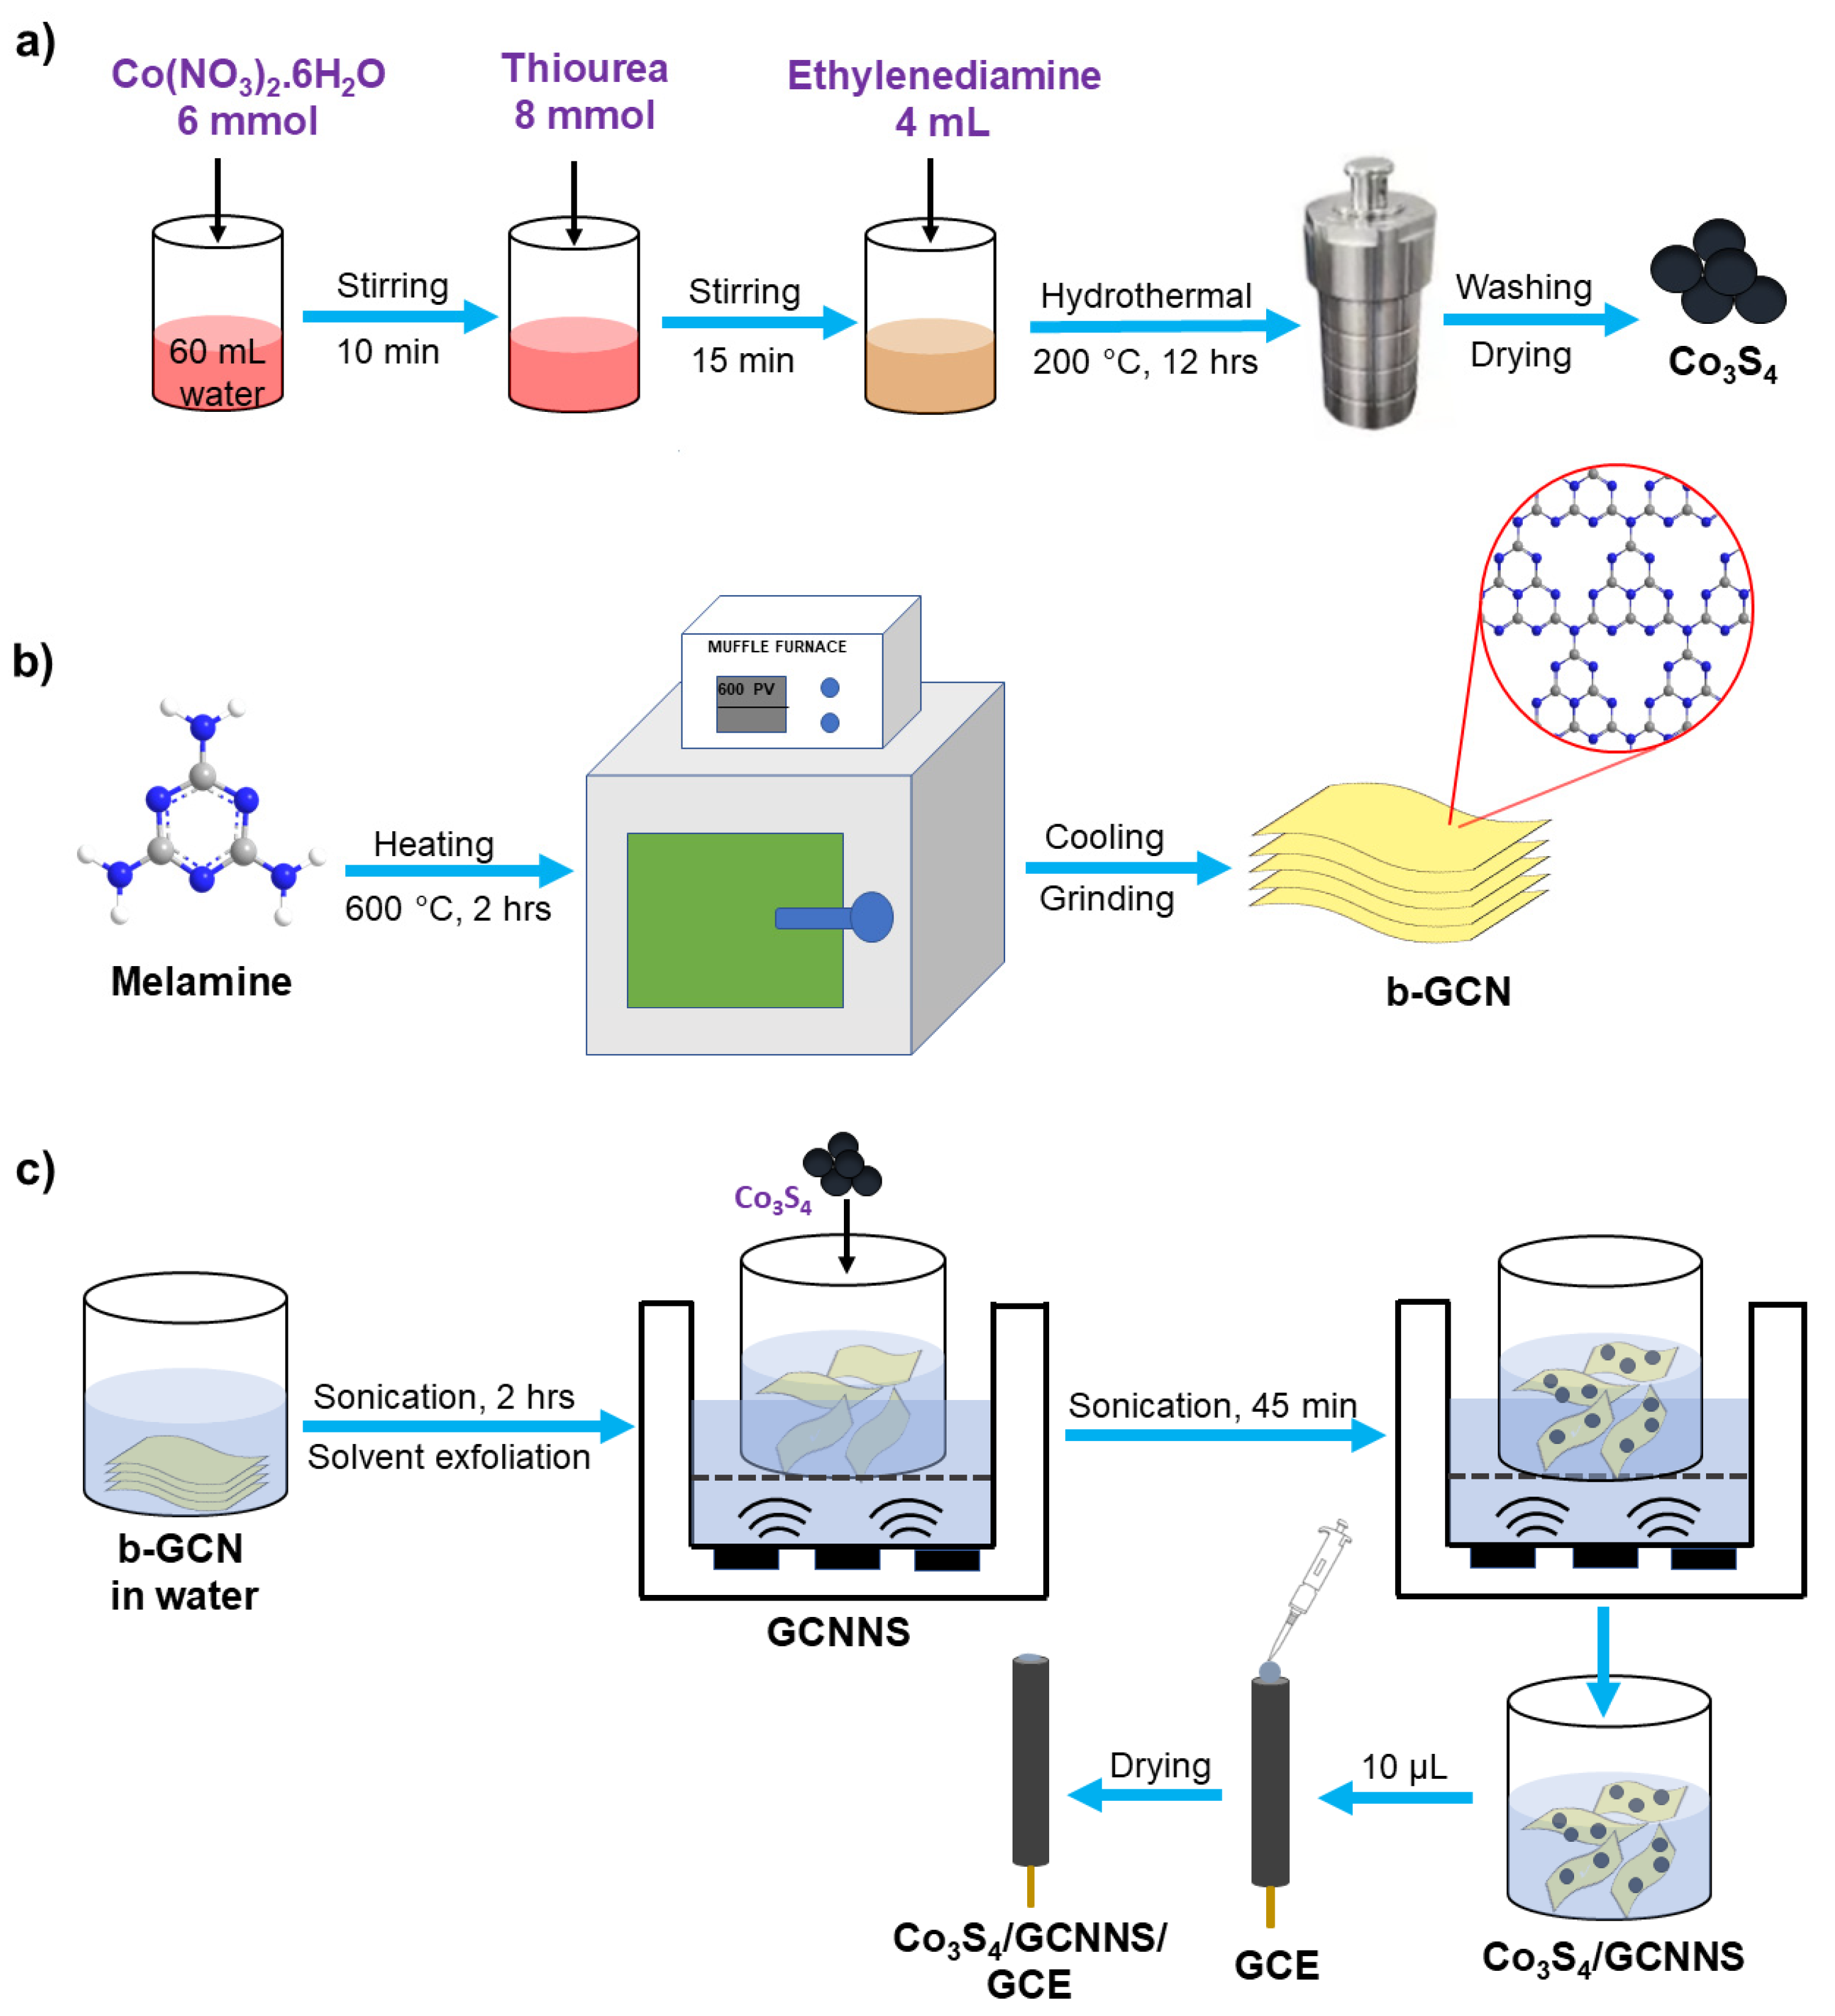
2.1. Synthesis
2.1.1. Co3S4
2.1.2. GCNNS
2.1.3. Co3S4/GCNNS
2.2. Fabrication of the Electrodes
3. Results and Discussion
3.1. Characterization
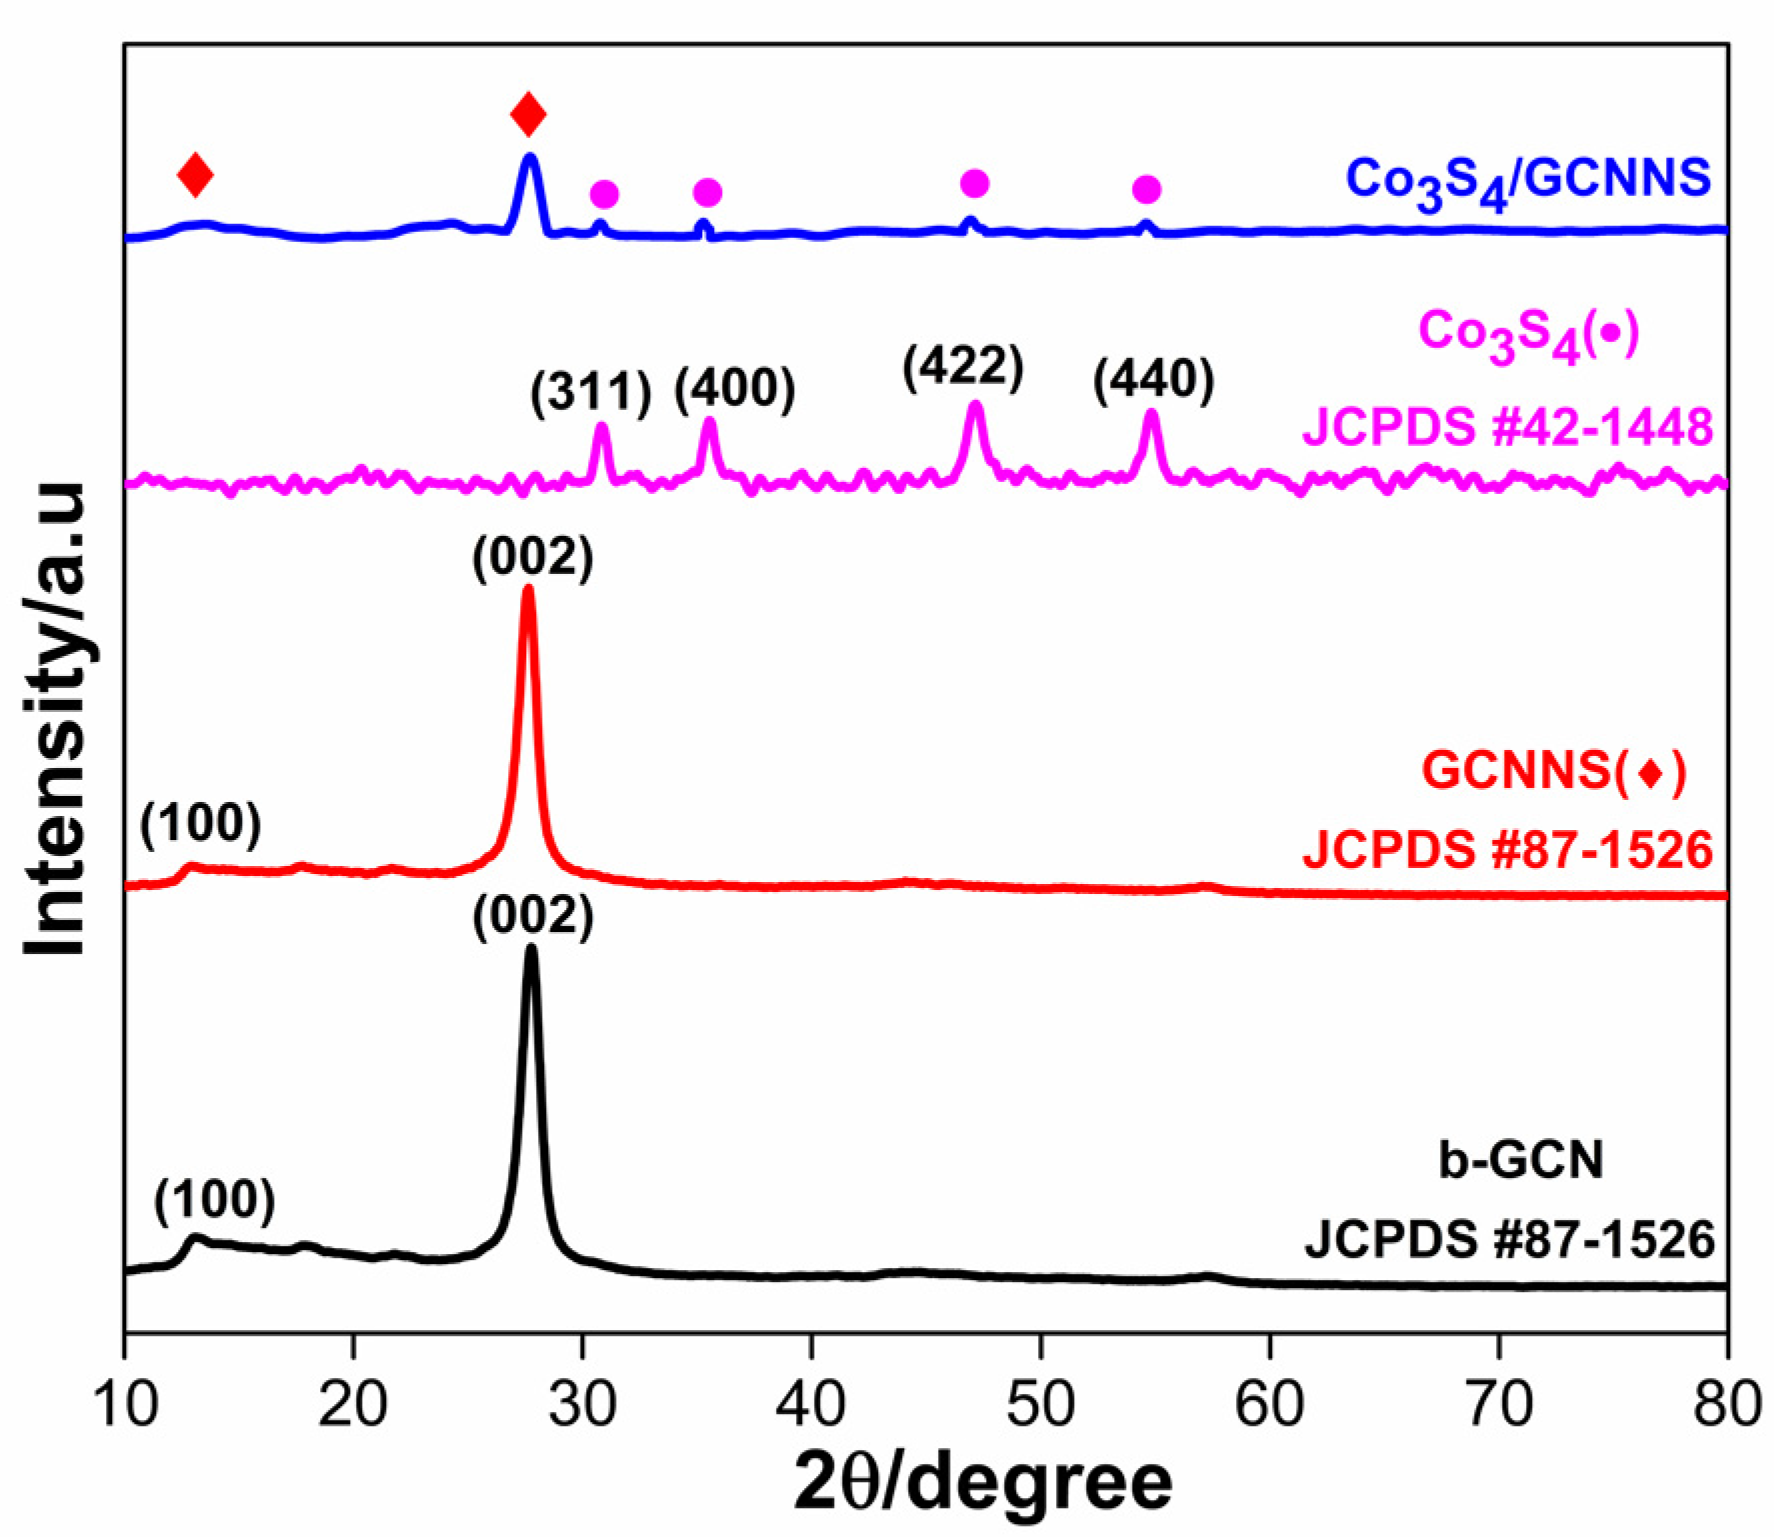
3.1.1. Crystallographic Studies
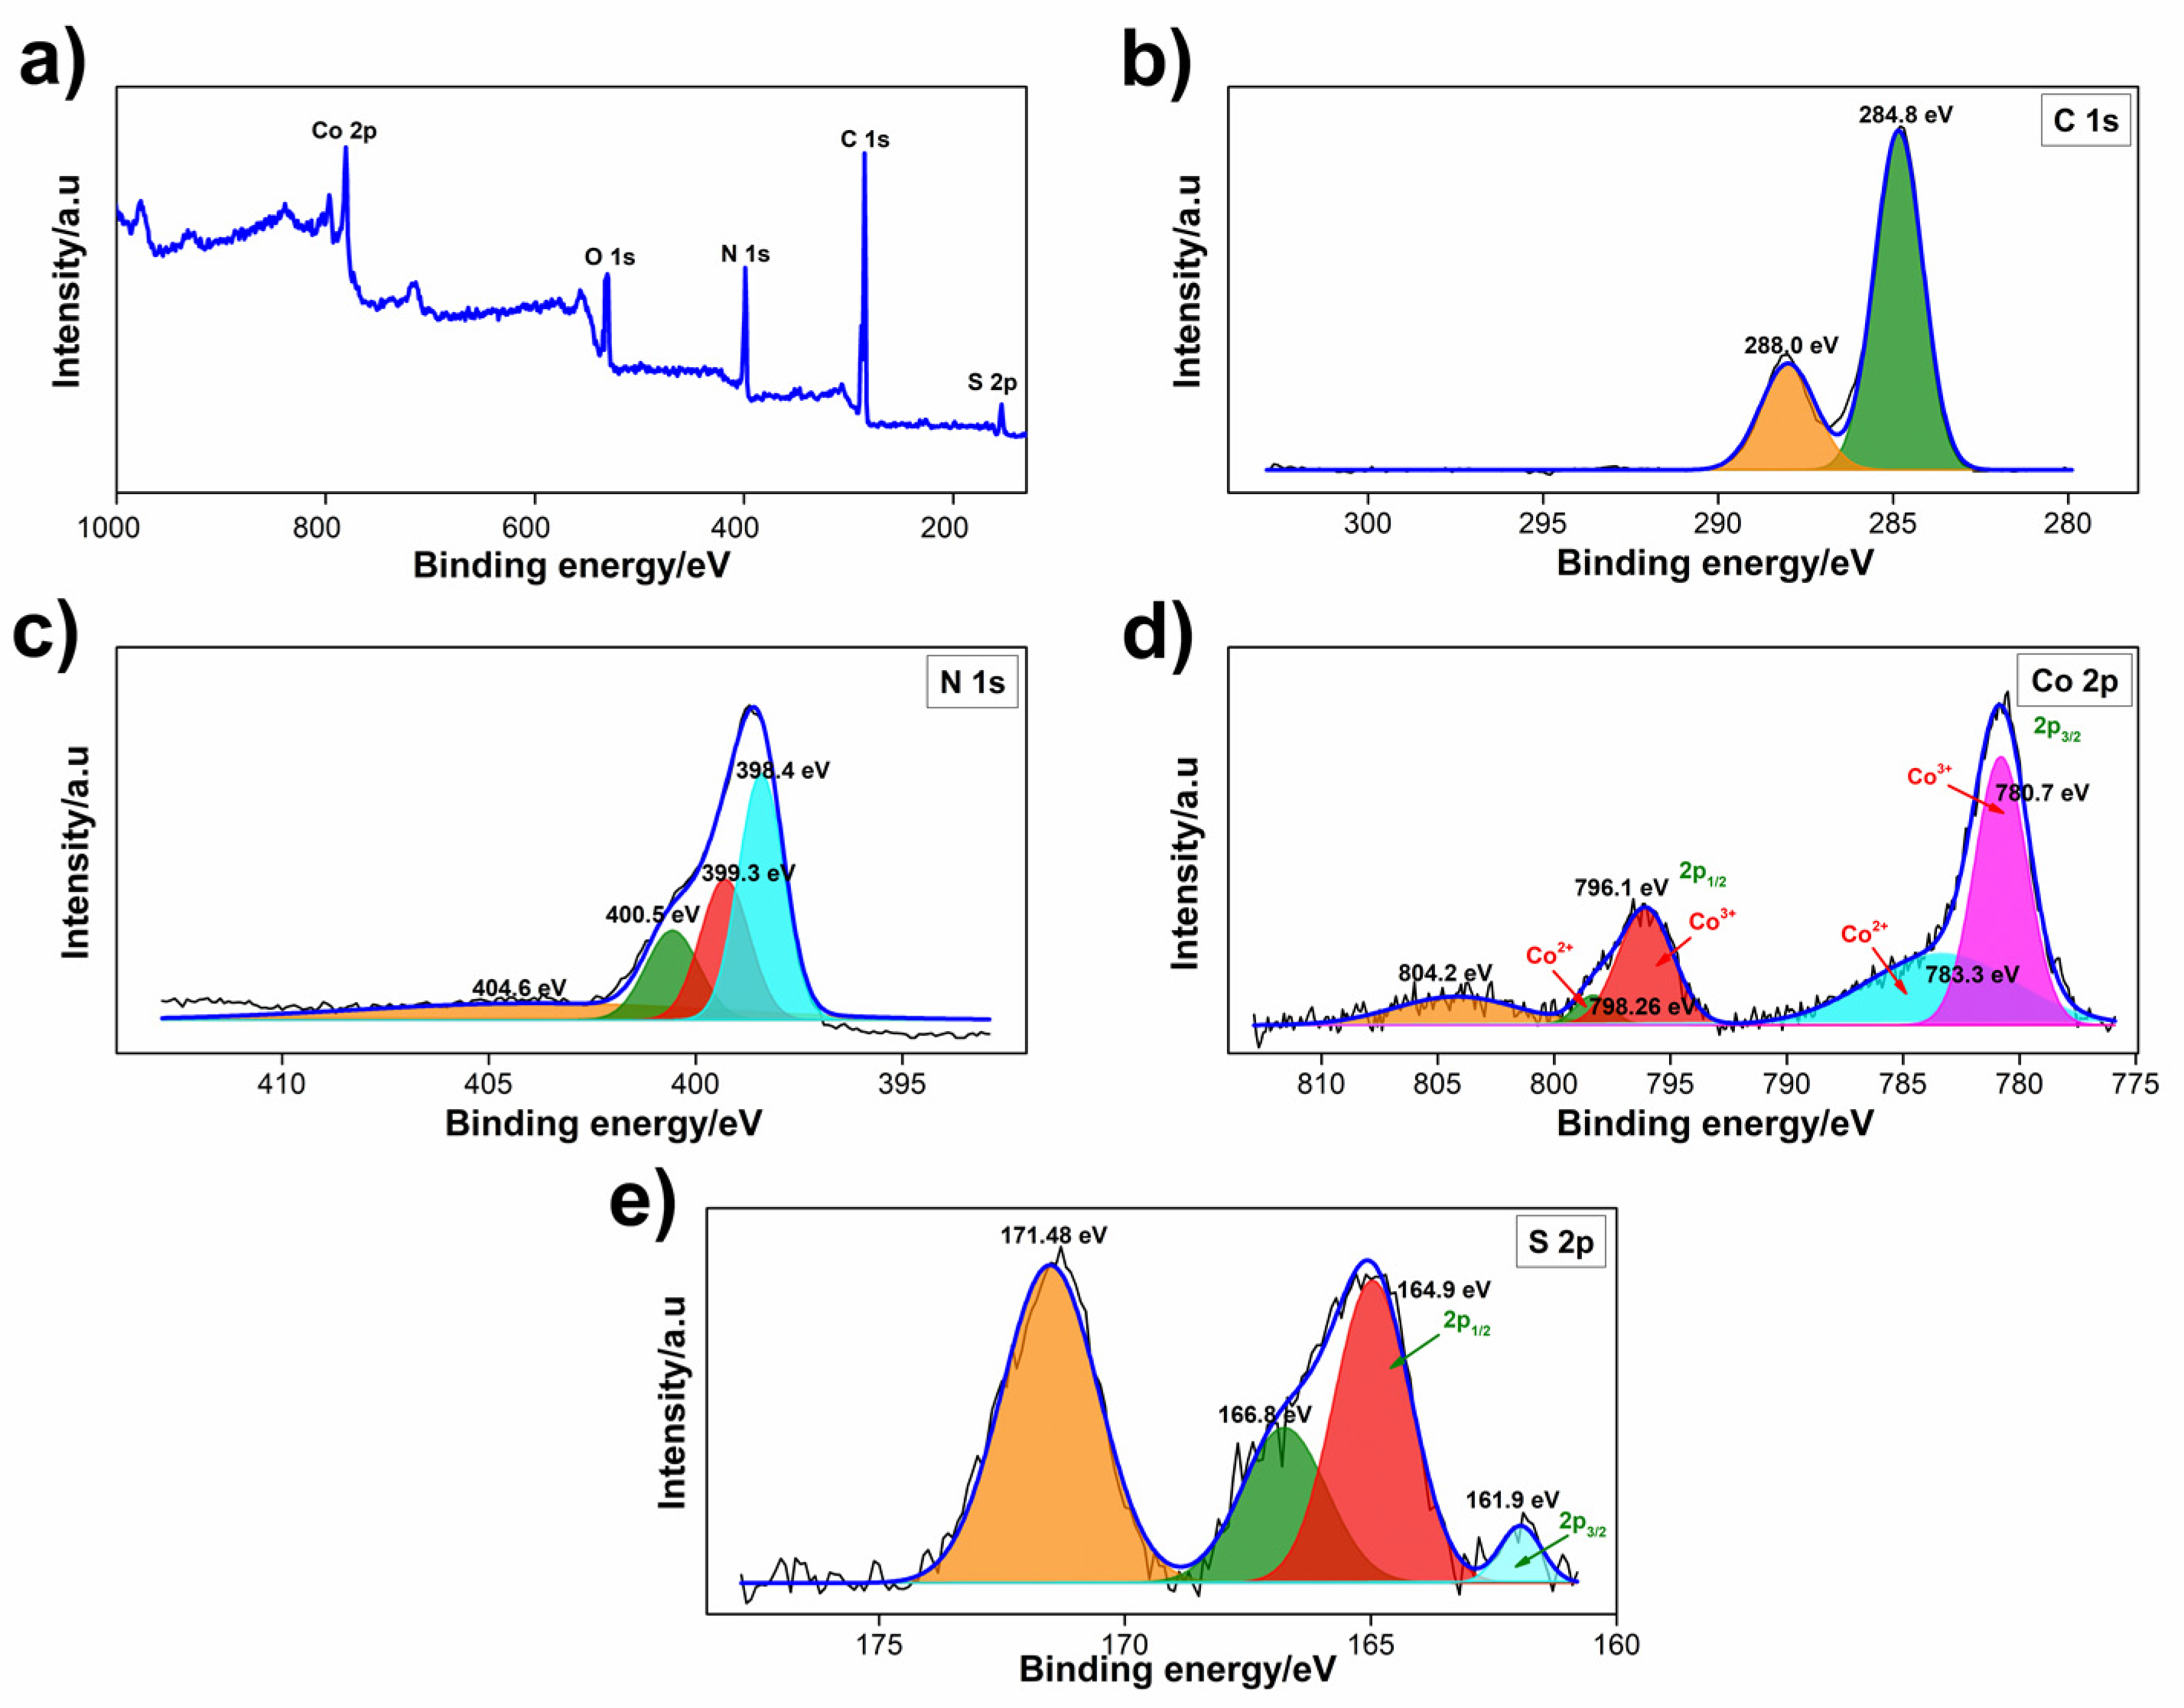
3.1.2. XPS Analysis
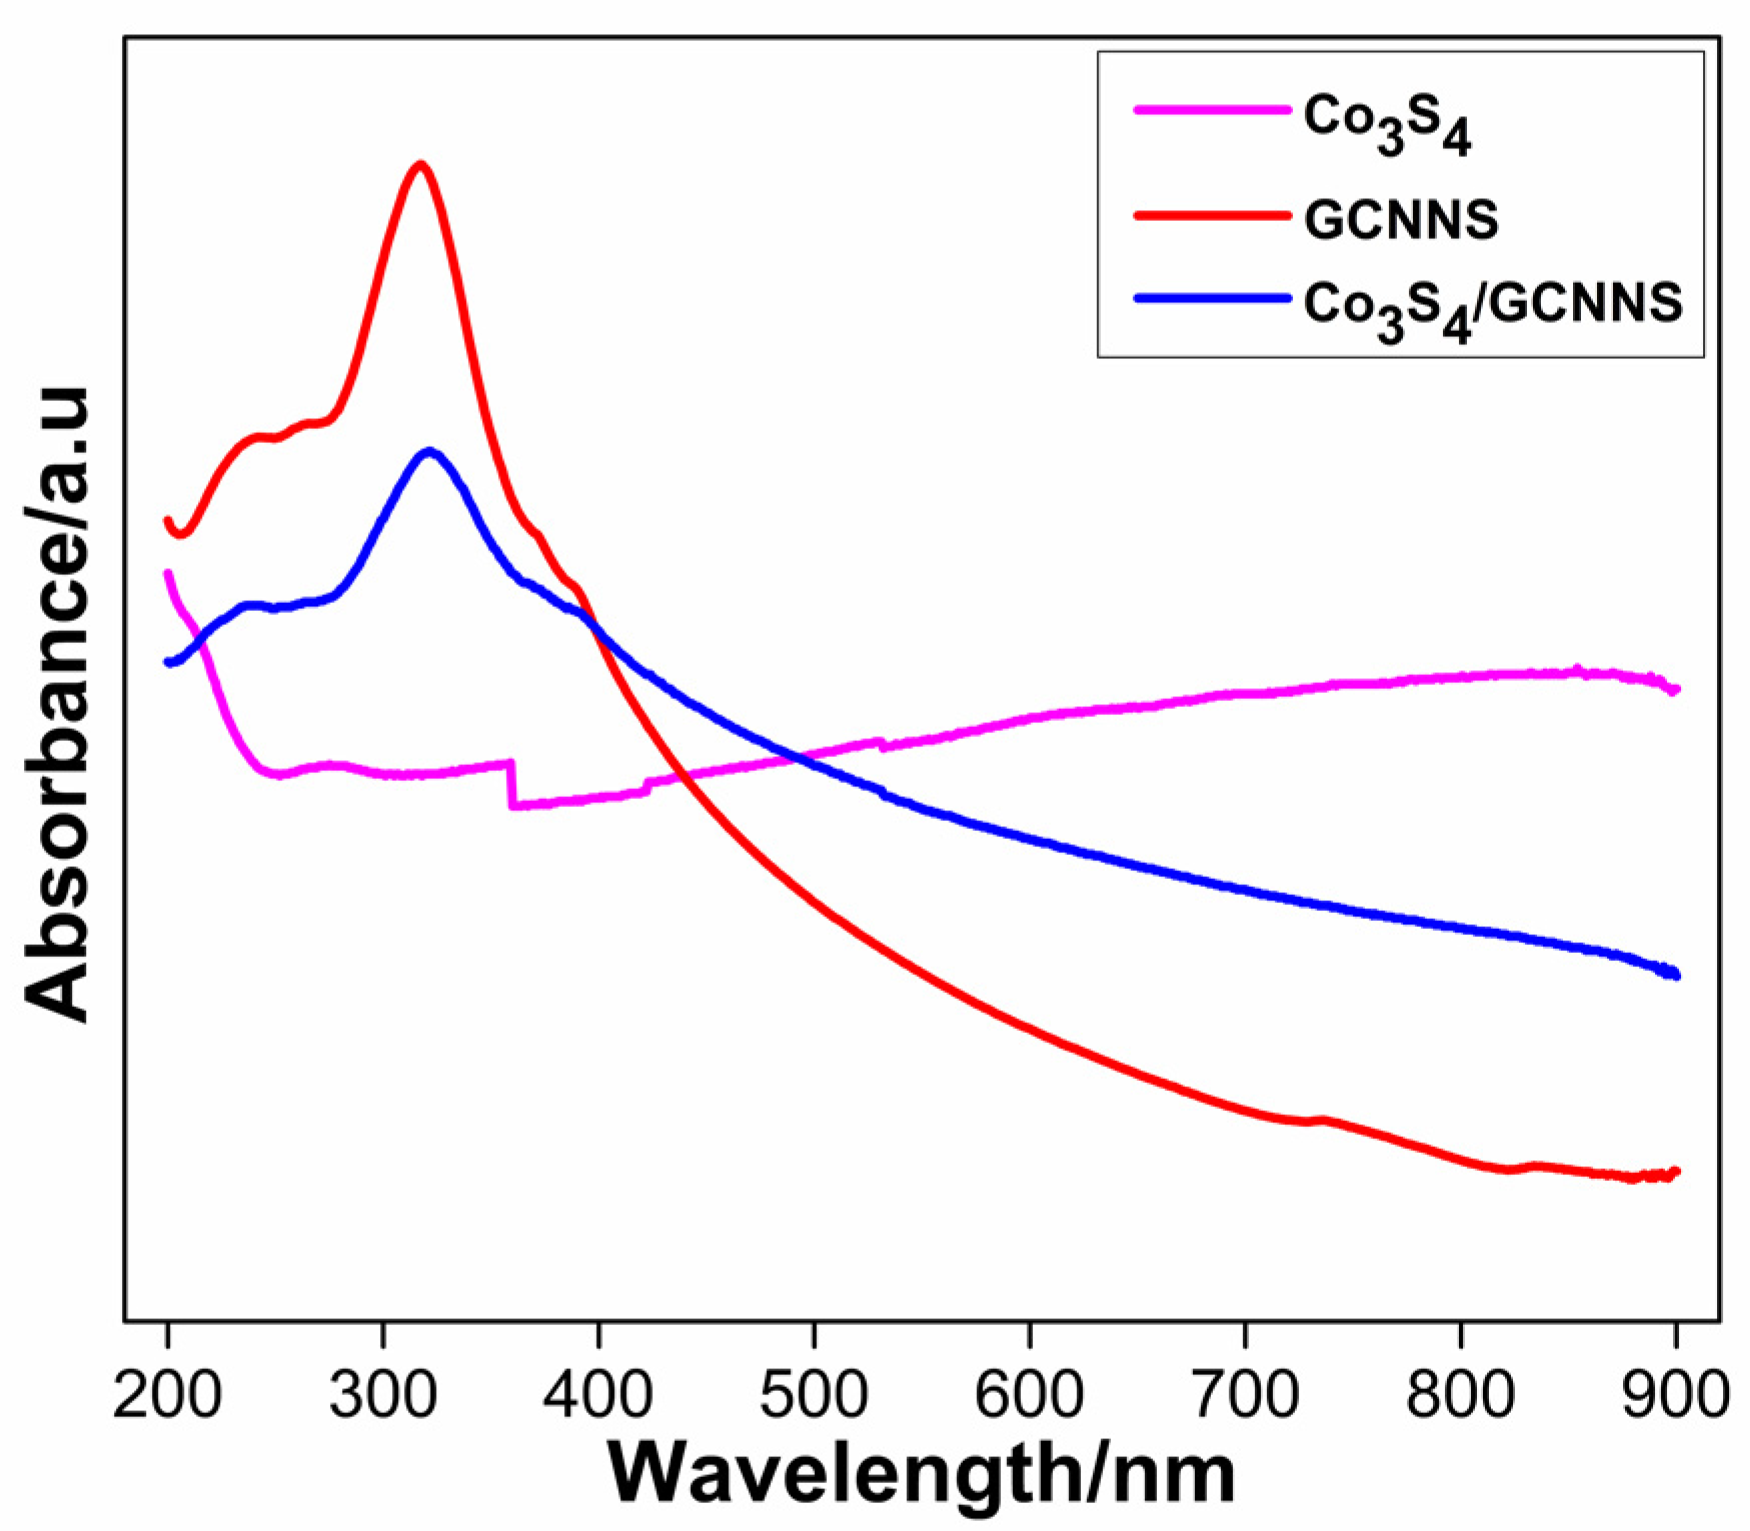
3.1.3. UV-Visible
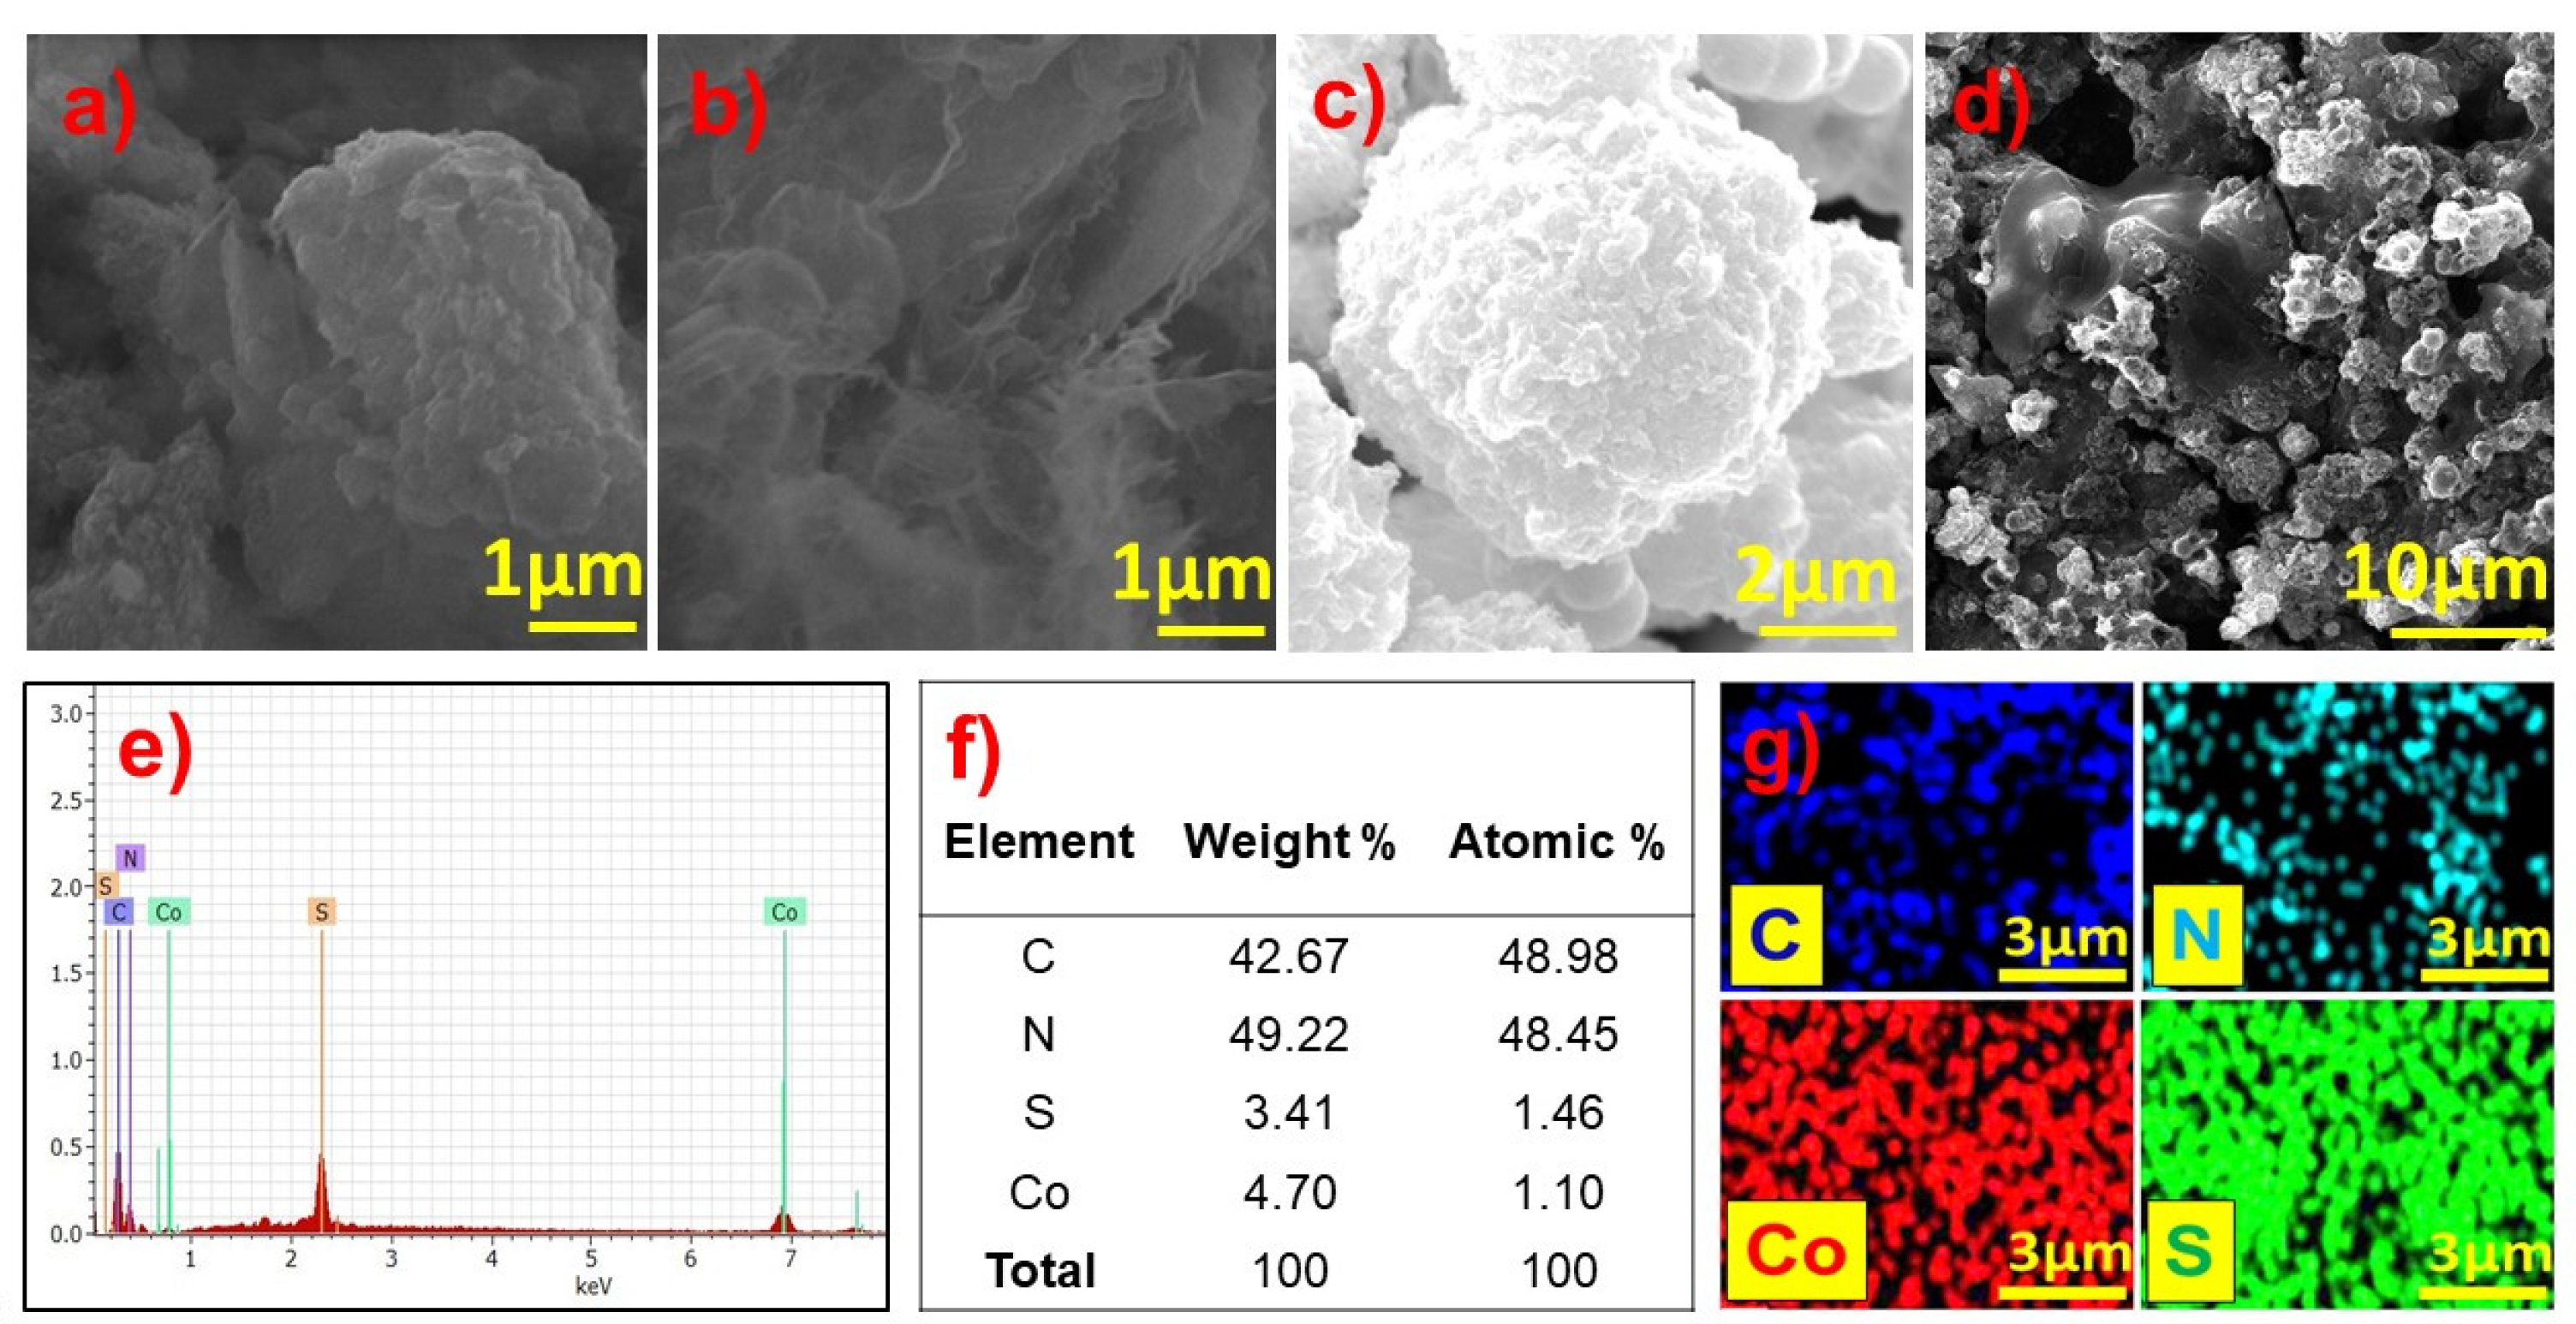
3.1.4. SEM and EDS
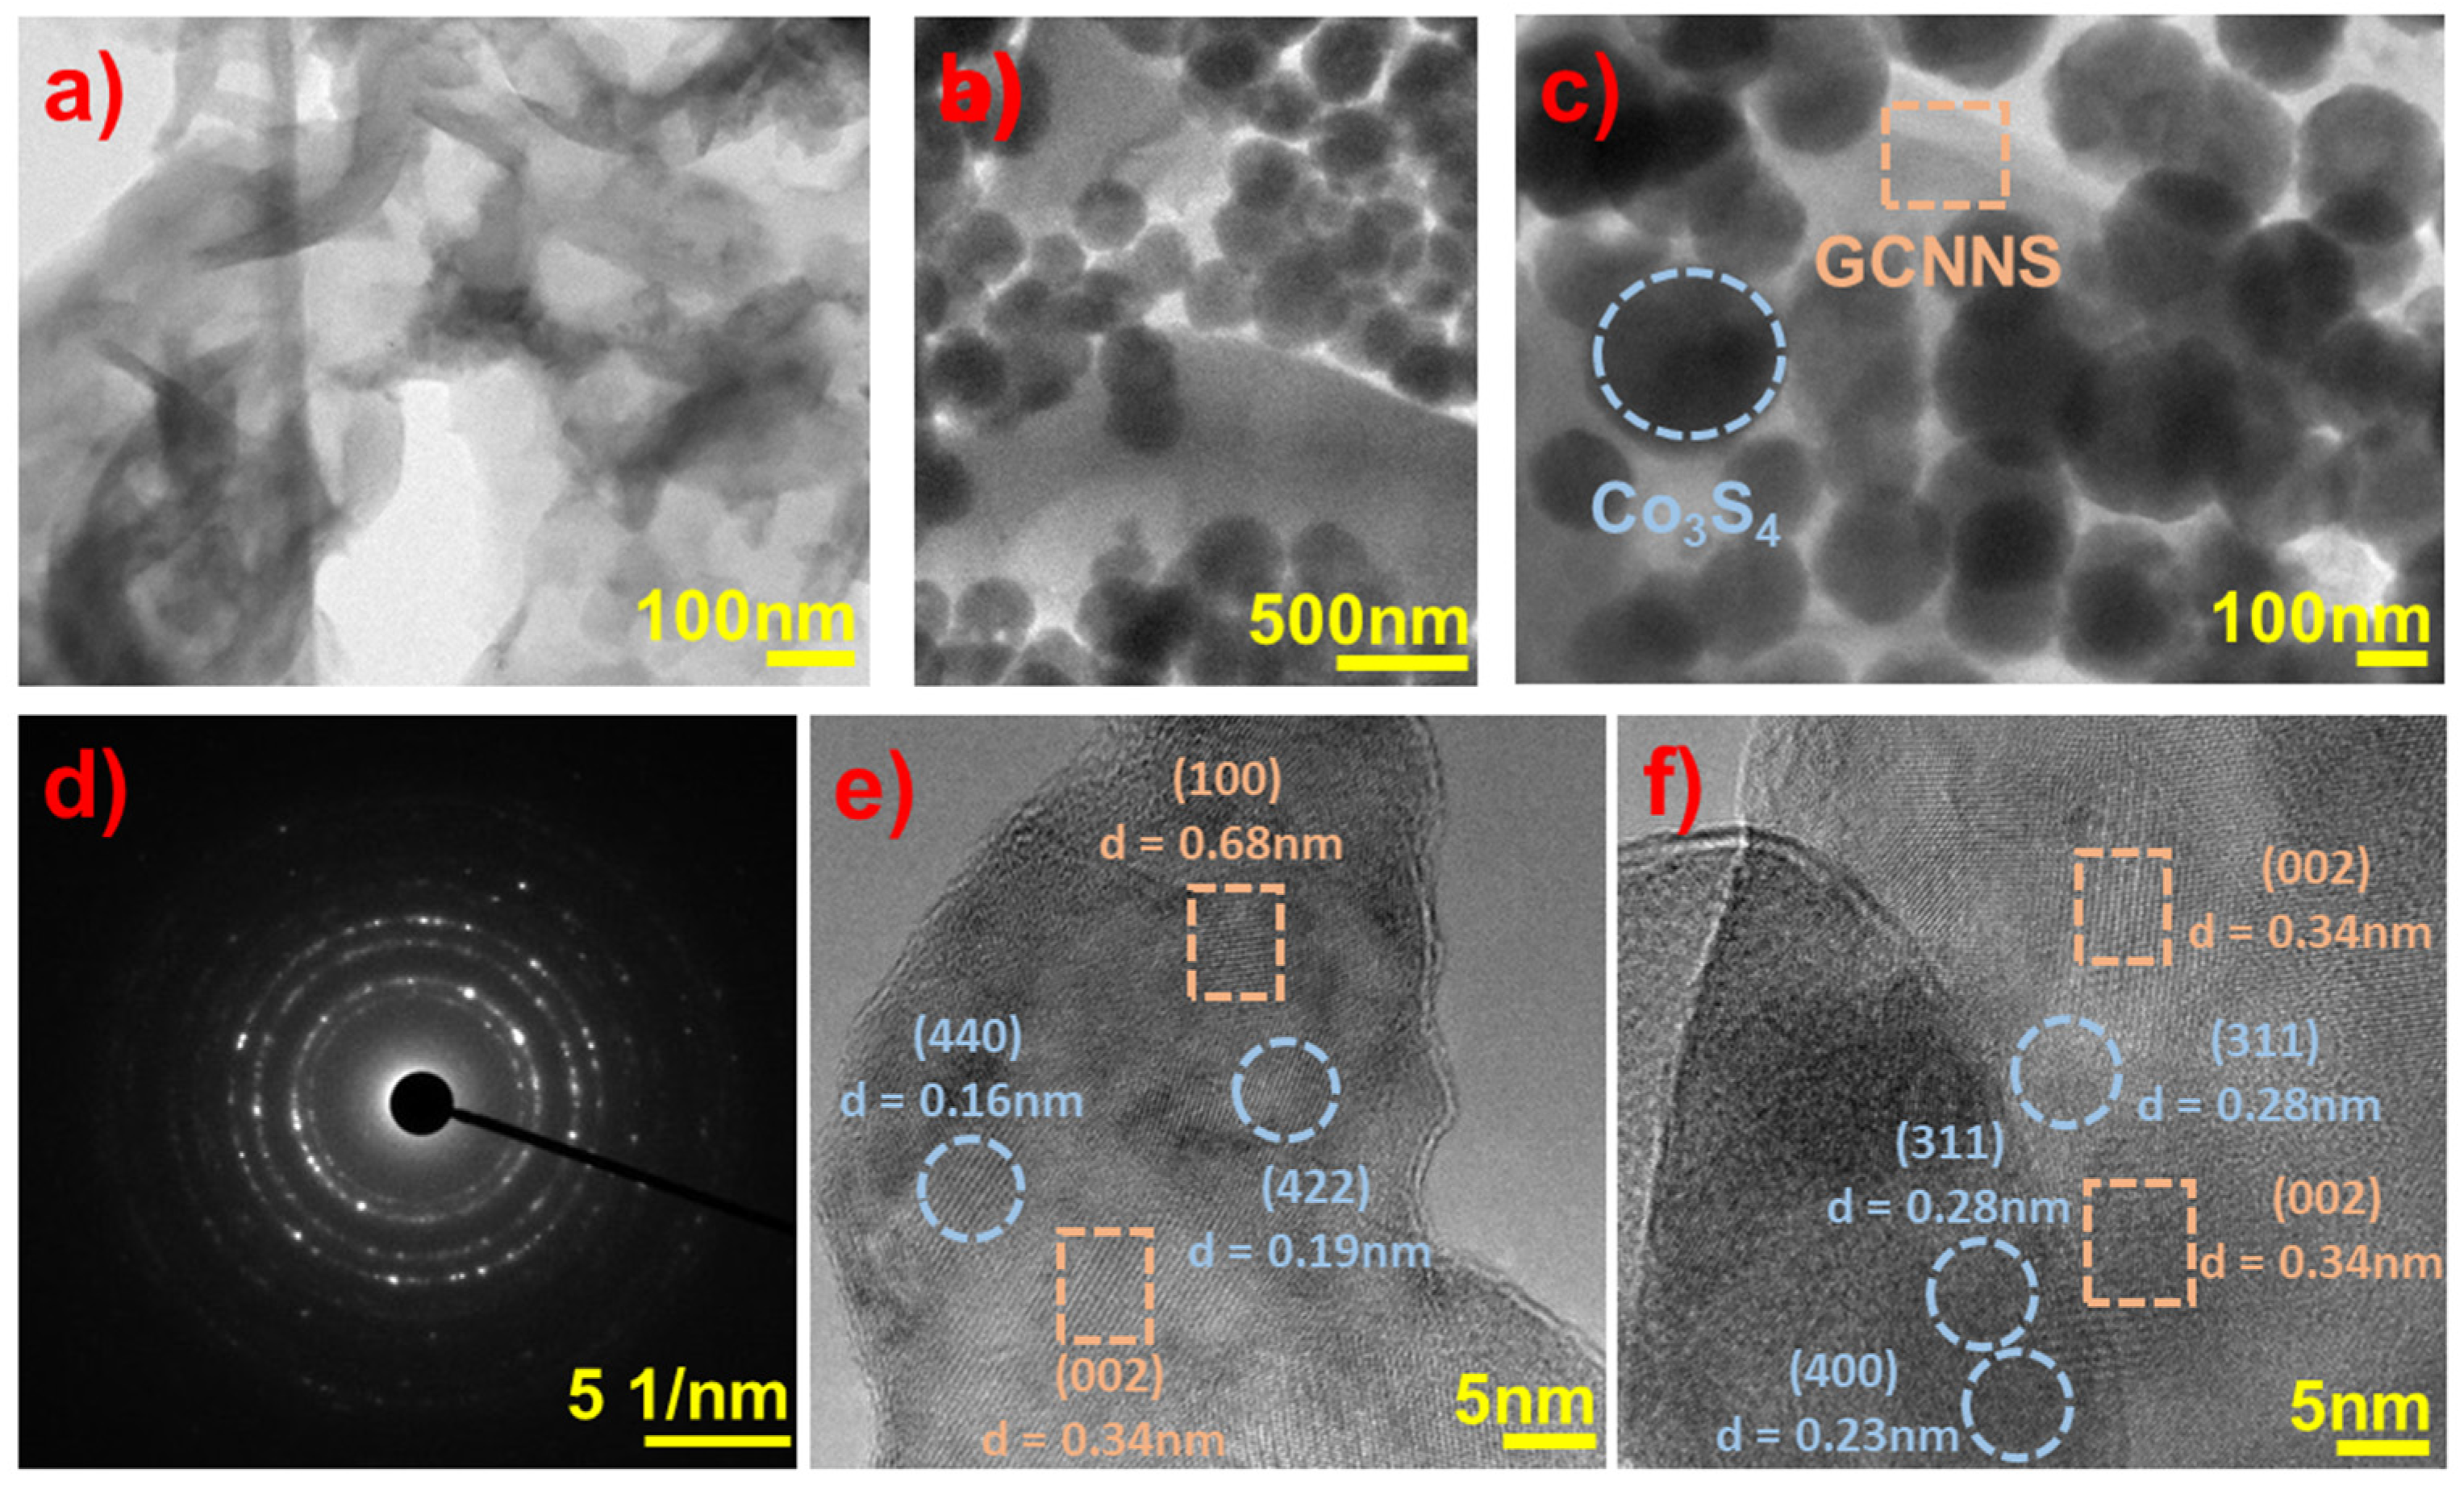
3.1.5. TEM
3.2. Electrochemical Characterization of Modified Electrodes
3.2.1. Response of Co3S4 and Co3S4/GCNNS Modified GCE Electrode in NaOH
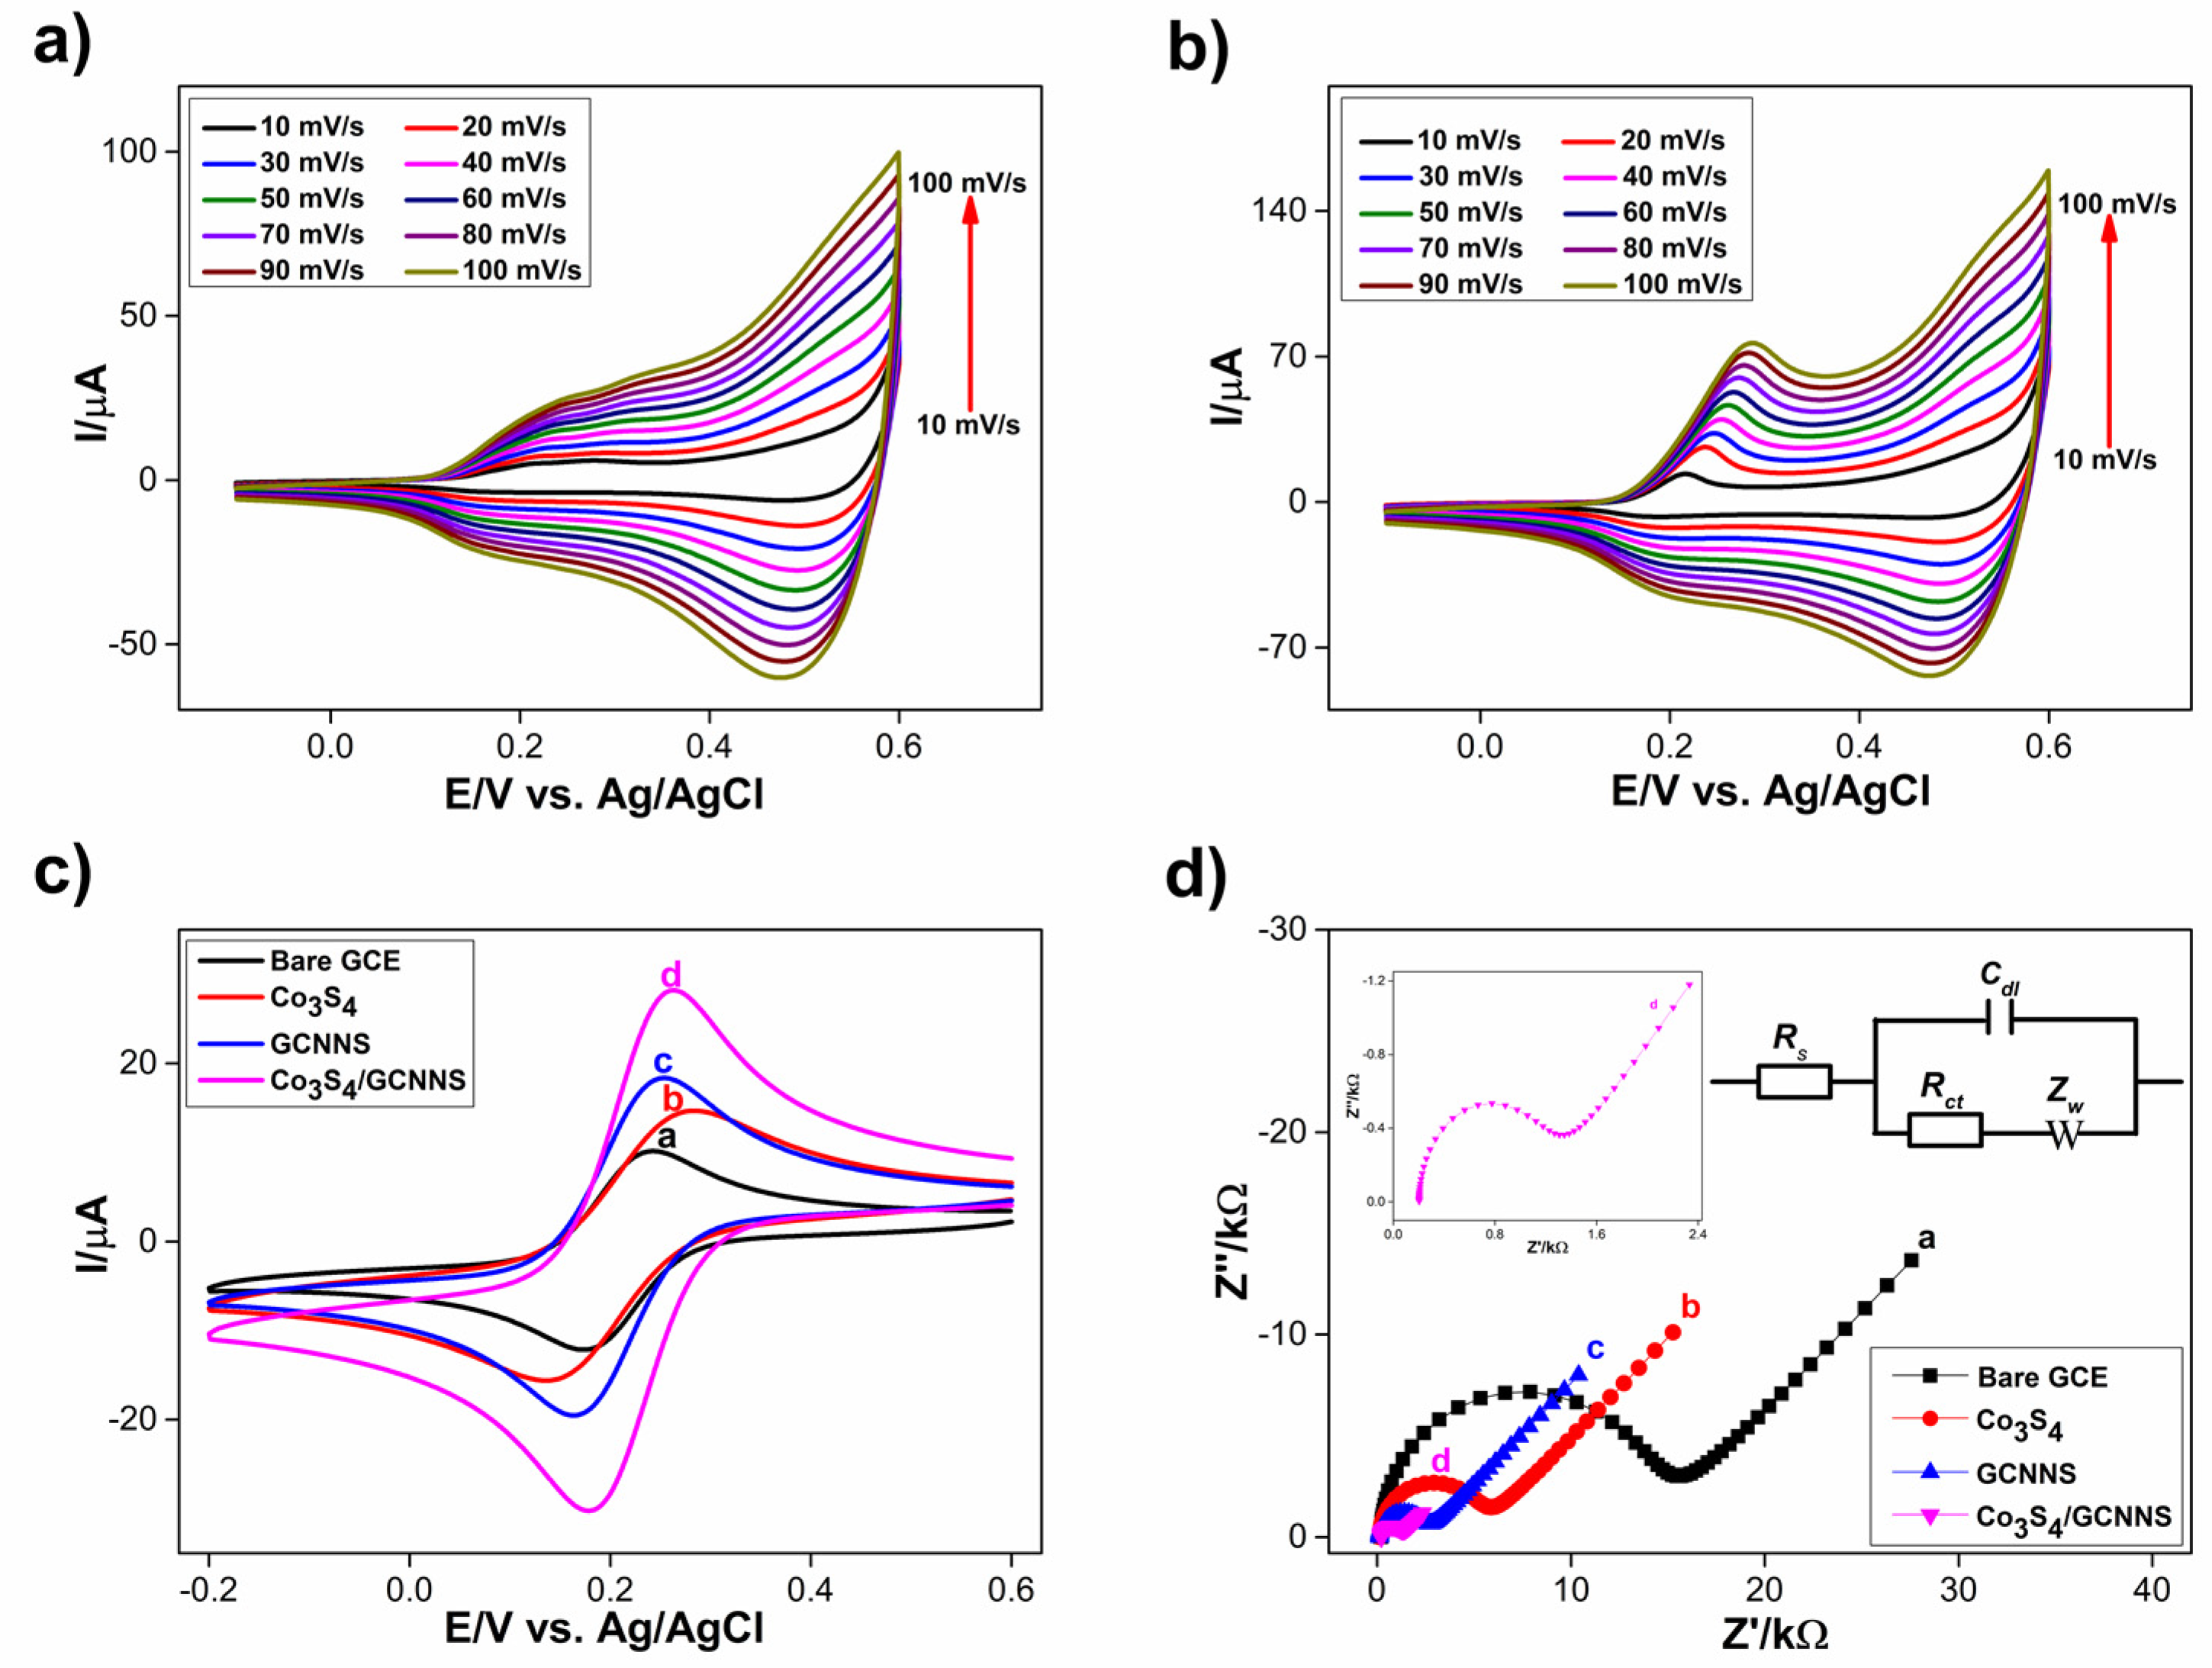
3.2.2. K4[Fe(CN)6]/K3[Fe(CN)6] Response of Modified Electrodes and Electroactive Surface Area (EAS)
3.2.3. Electrochemical Impedance Studies
3.3. Electrochemical Detection of H2O2
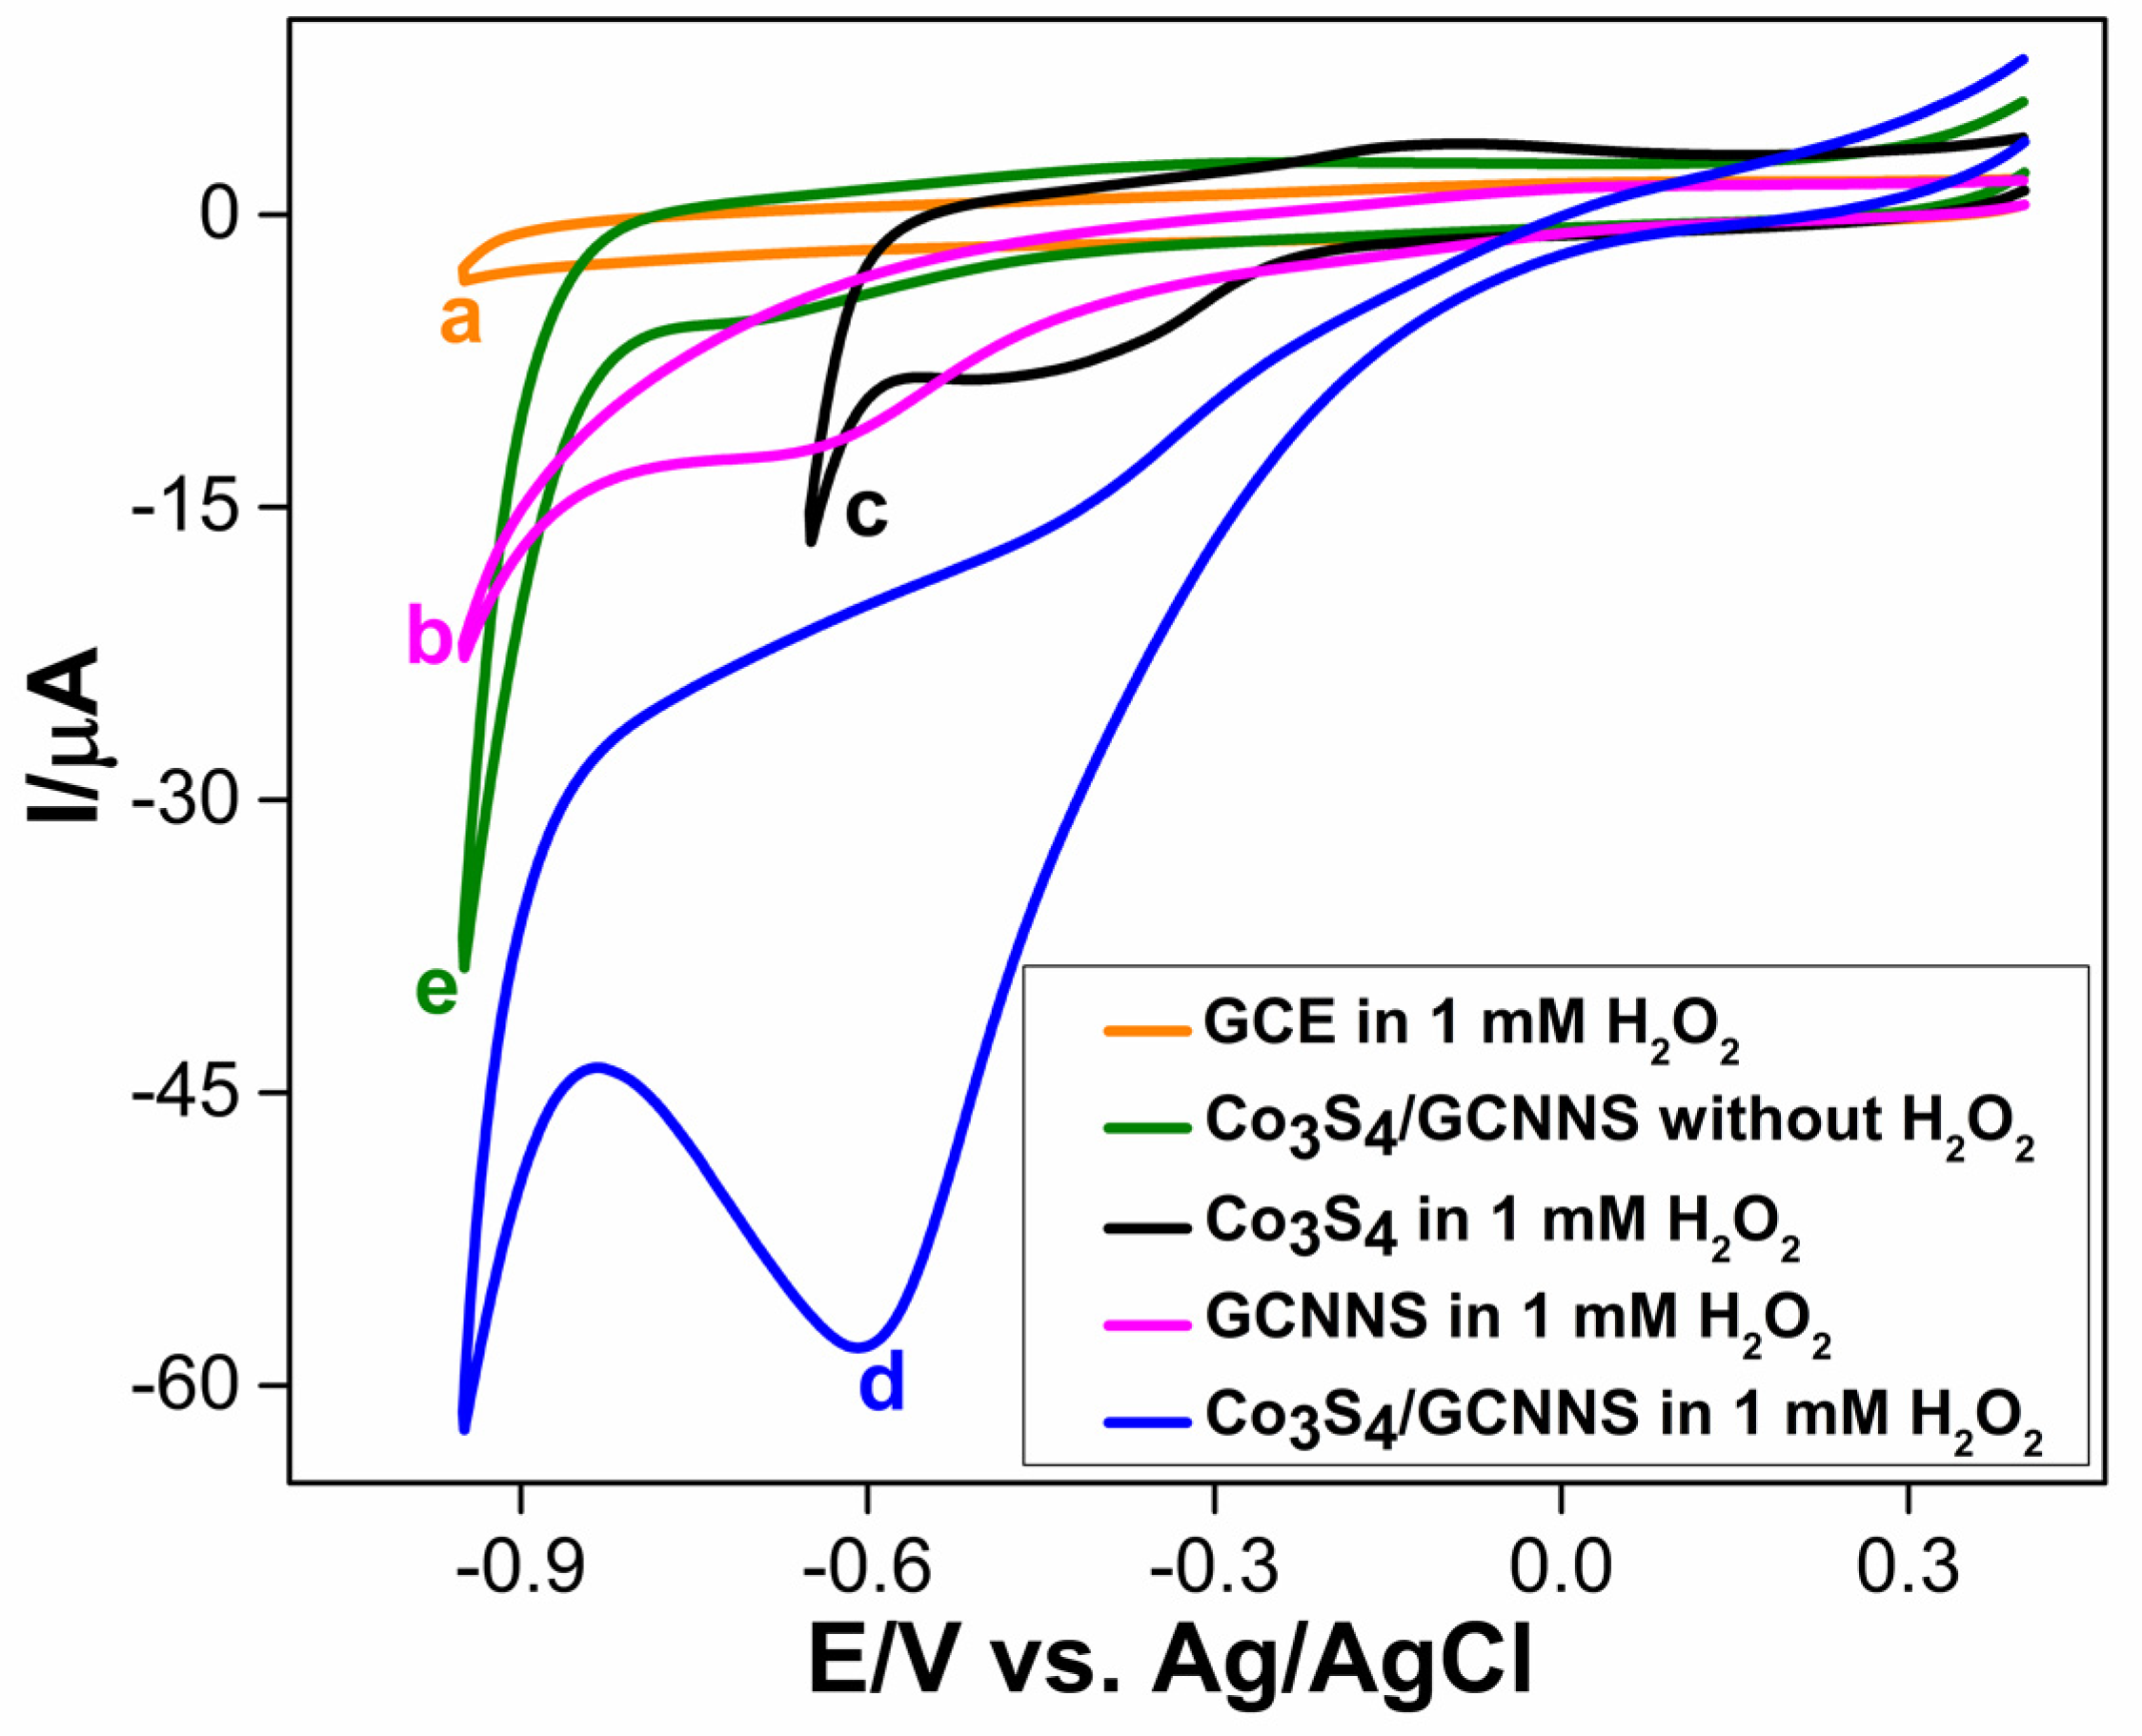
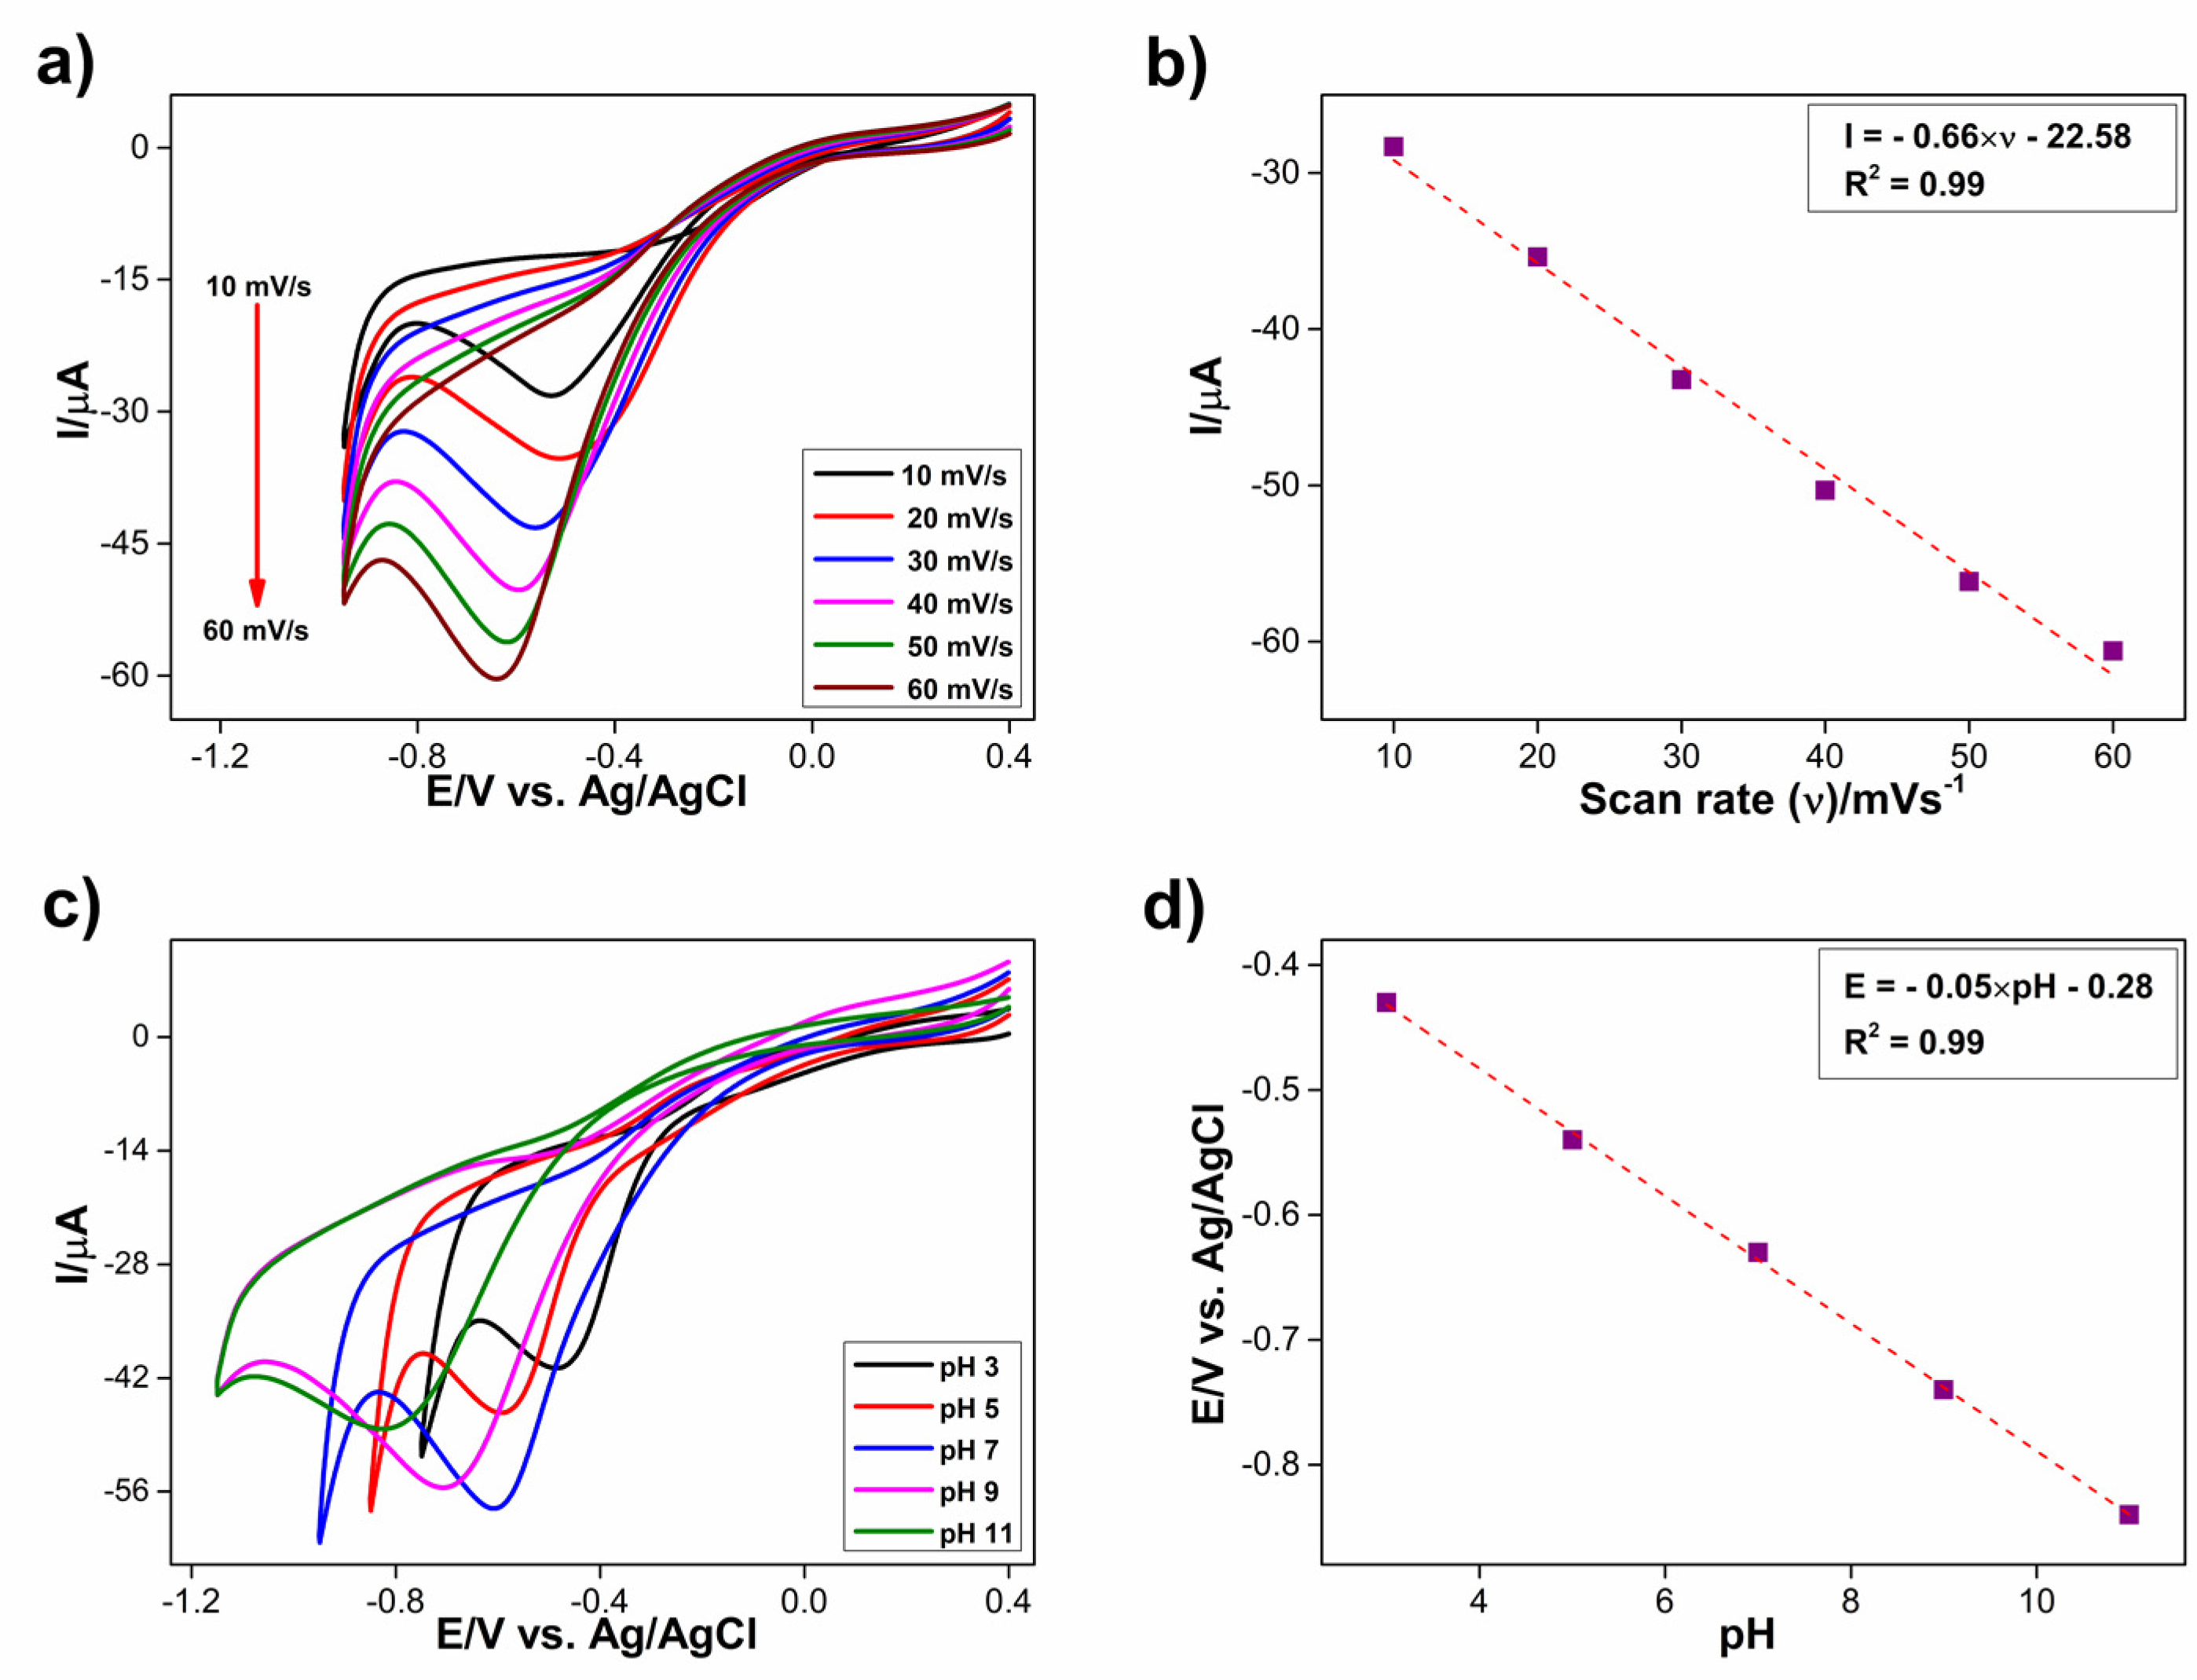
3.3.1. Electrochemical Reduction of H2O2 at Co3S4/GCNNS Modified GCE
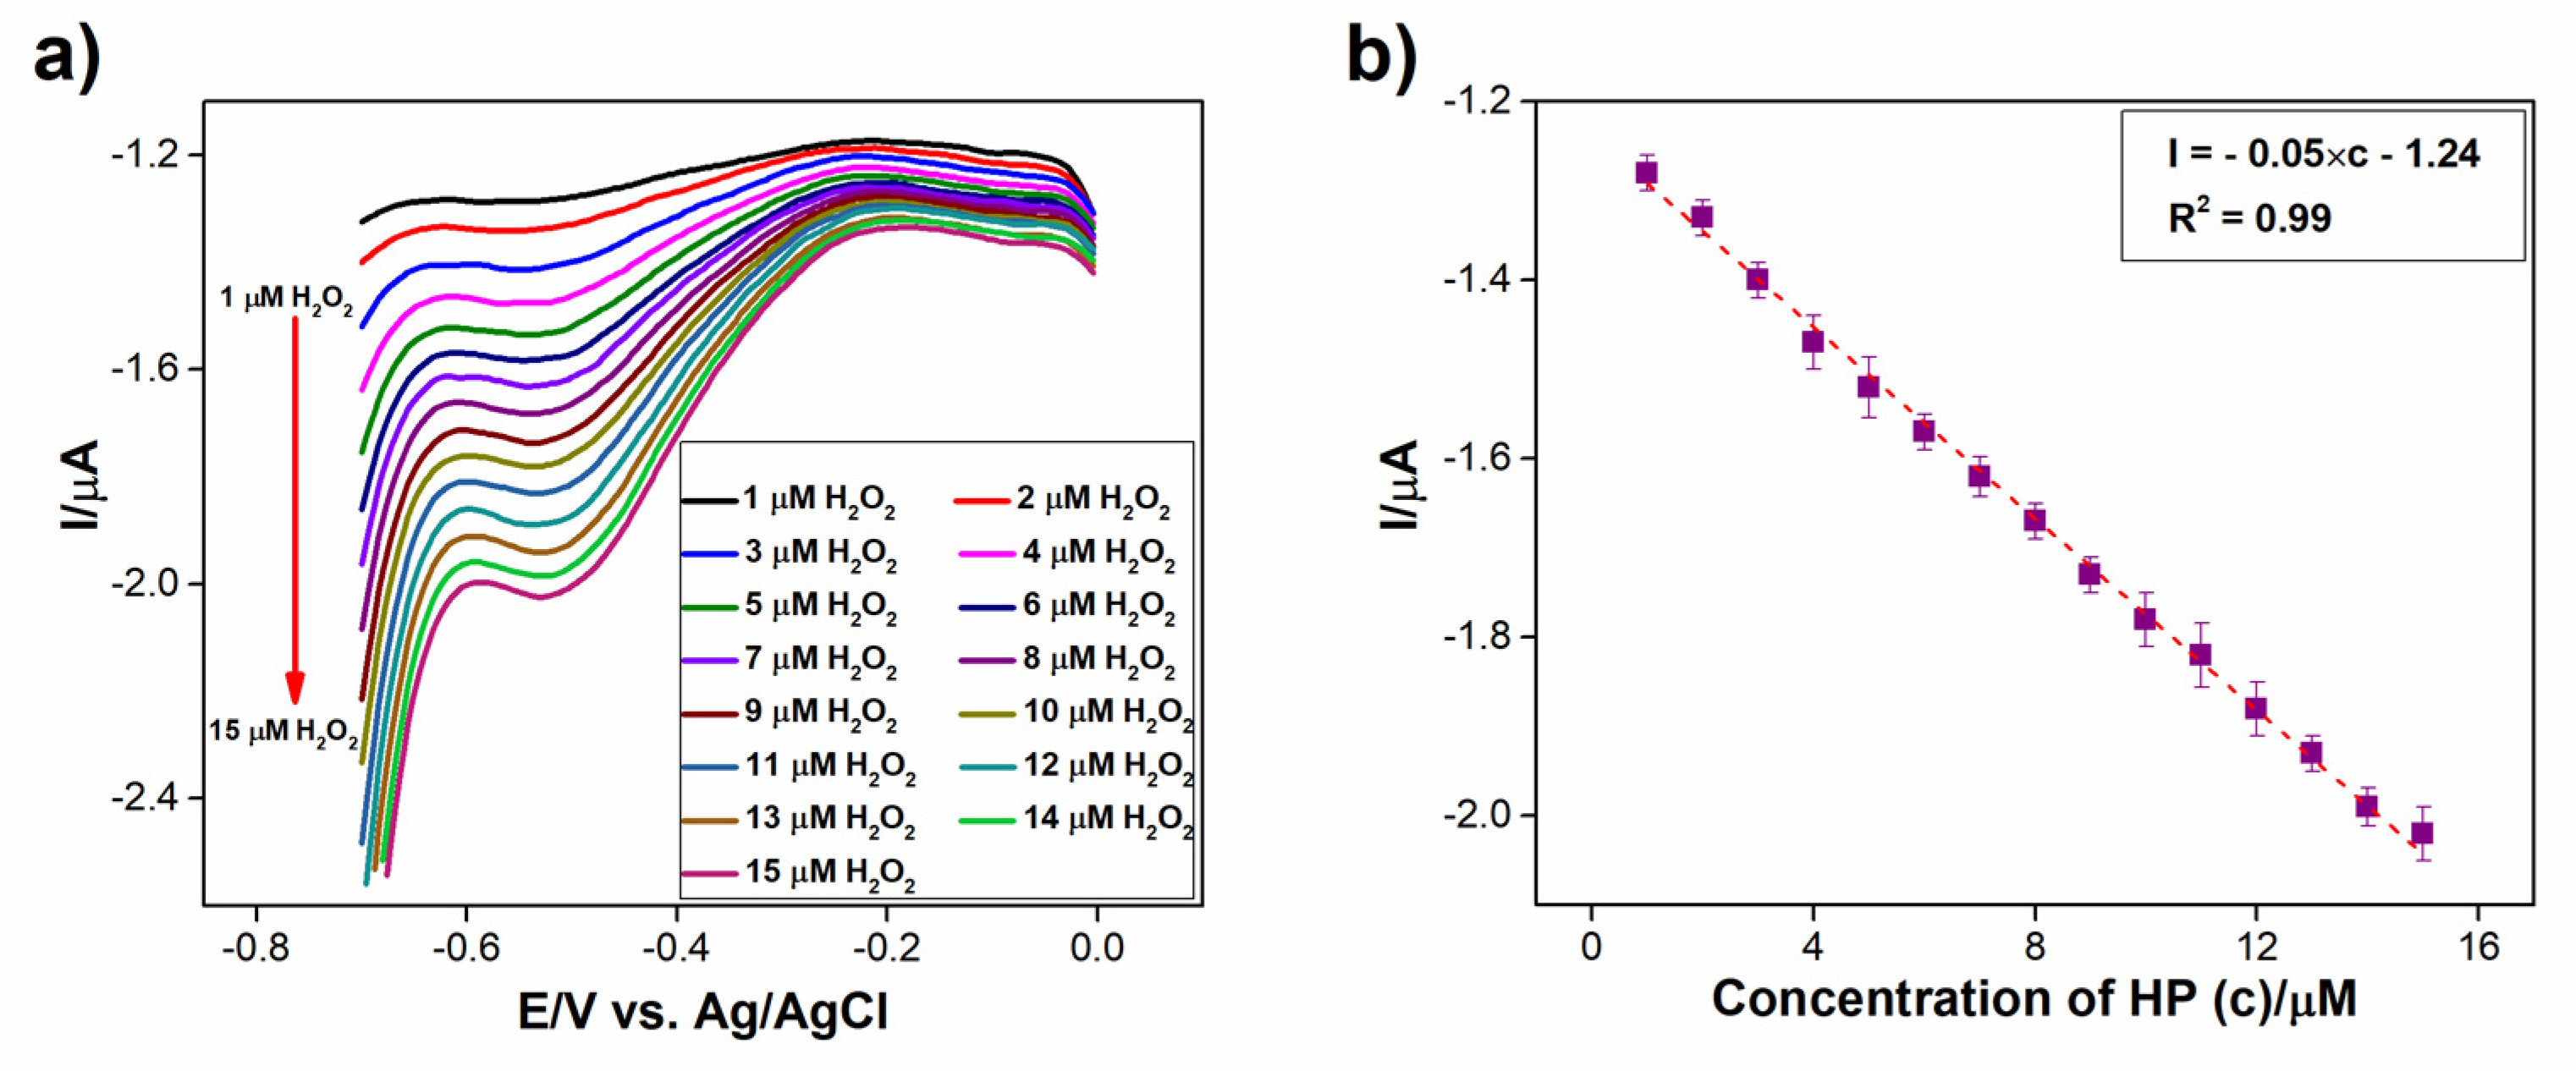
3.3.2. Sensitive Determination of H2O2
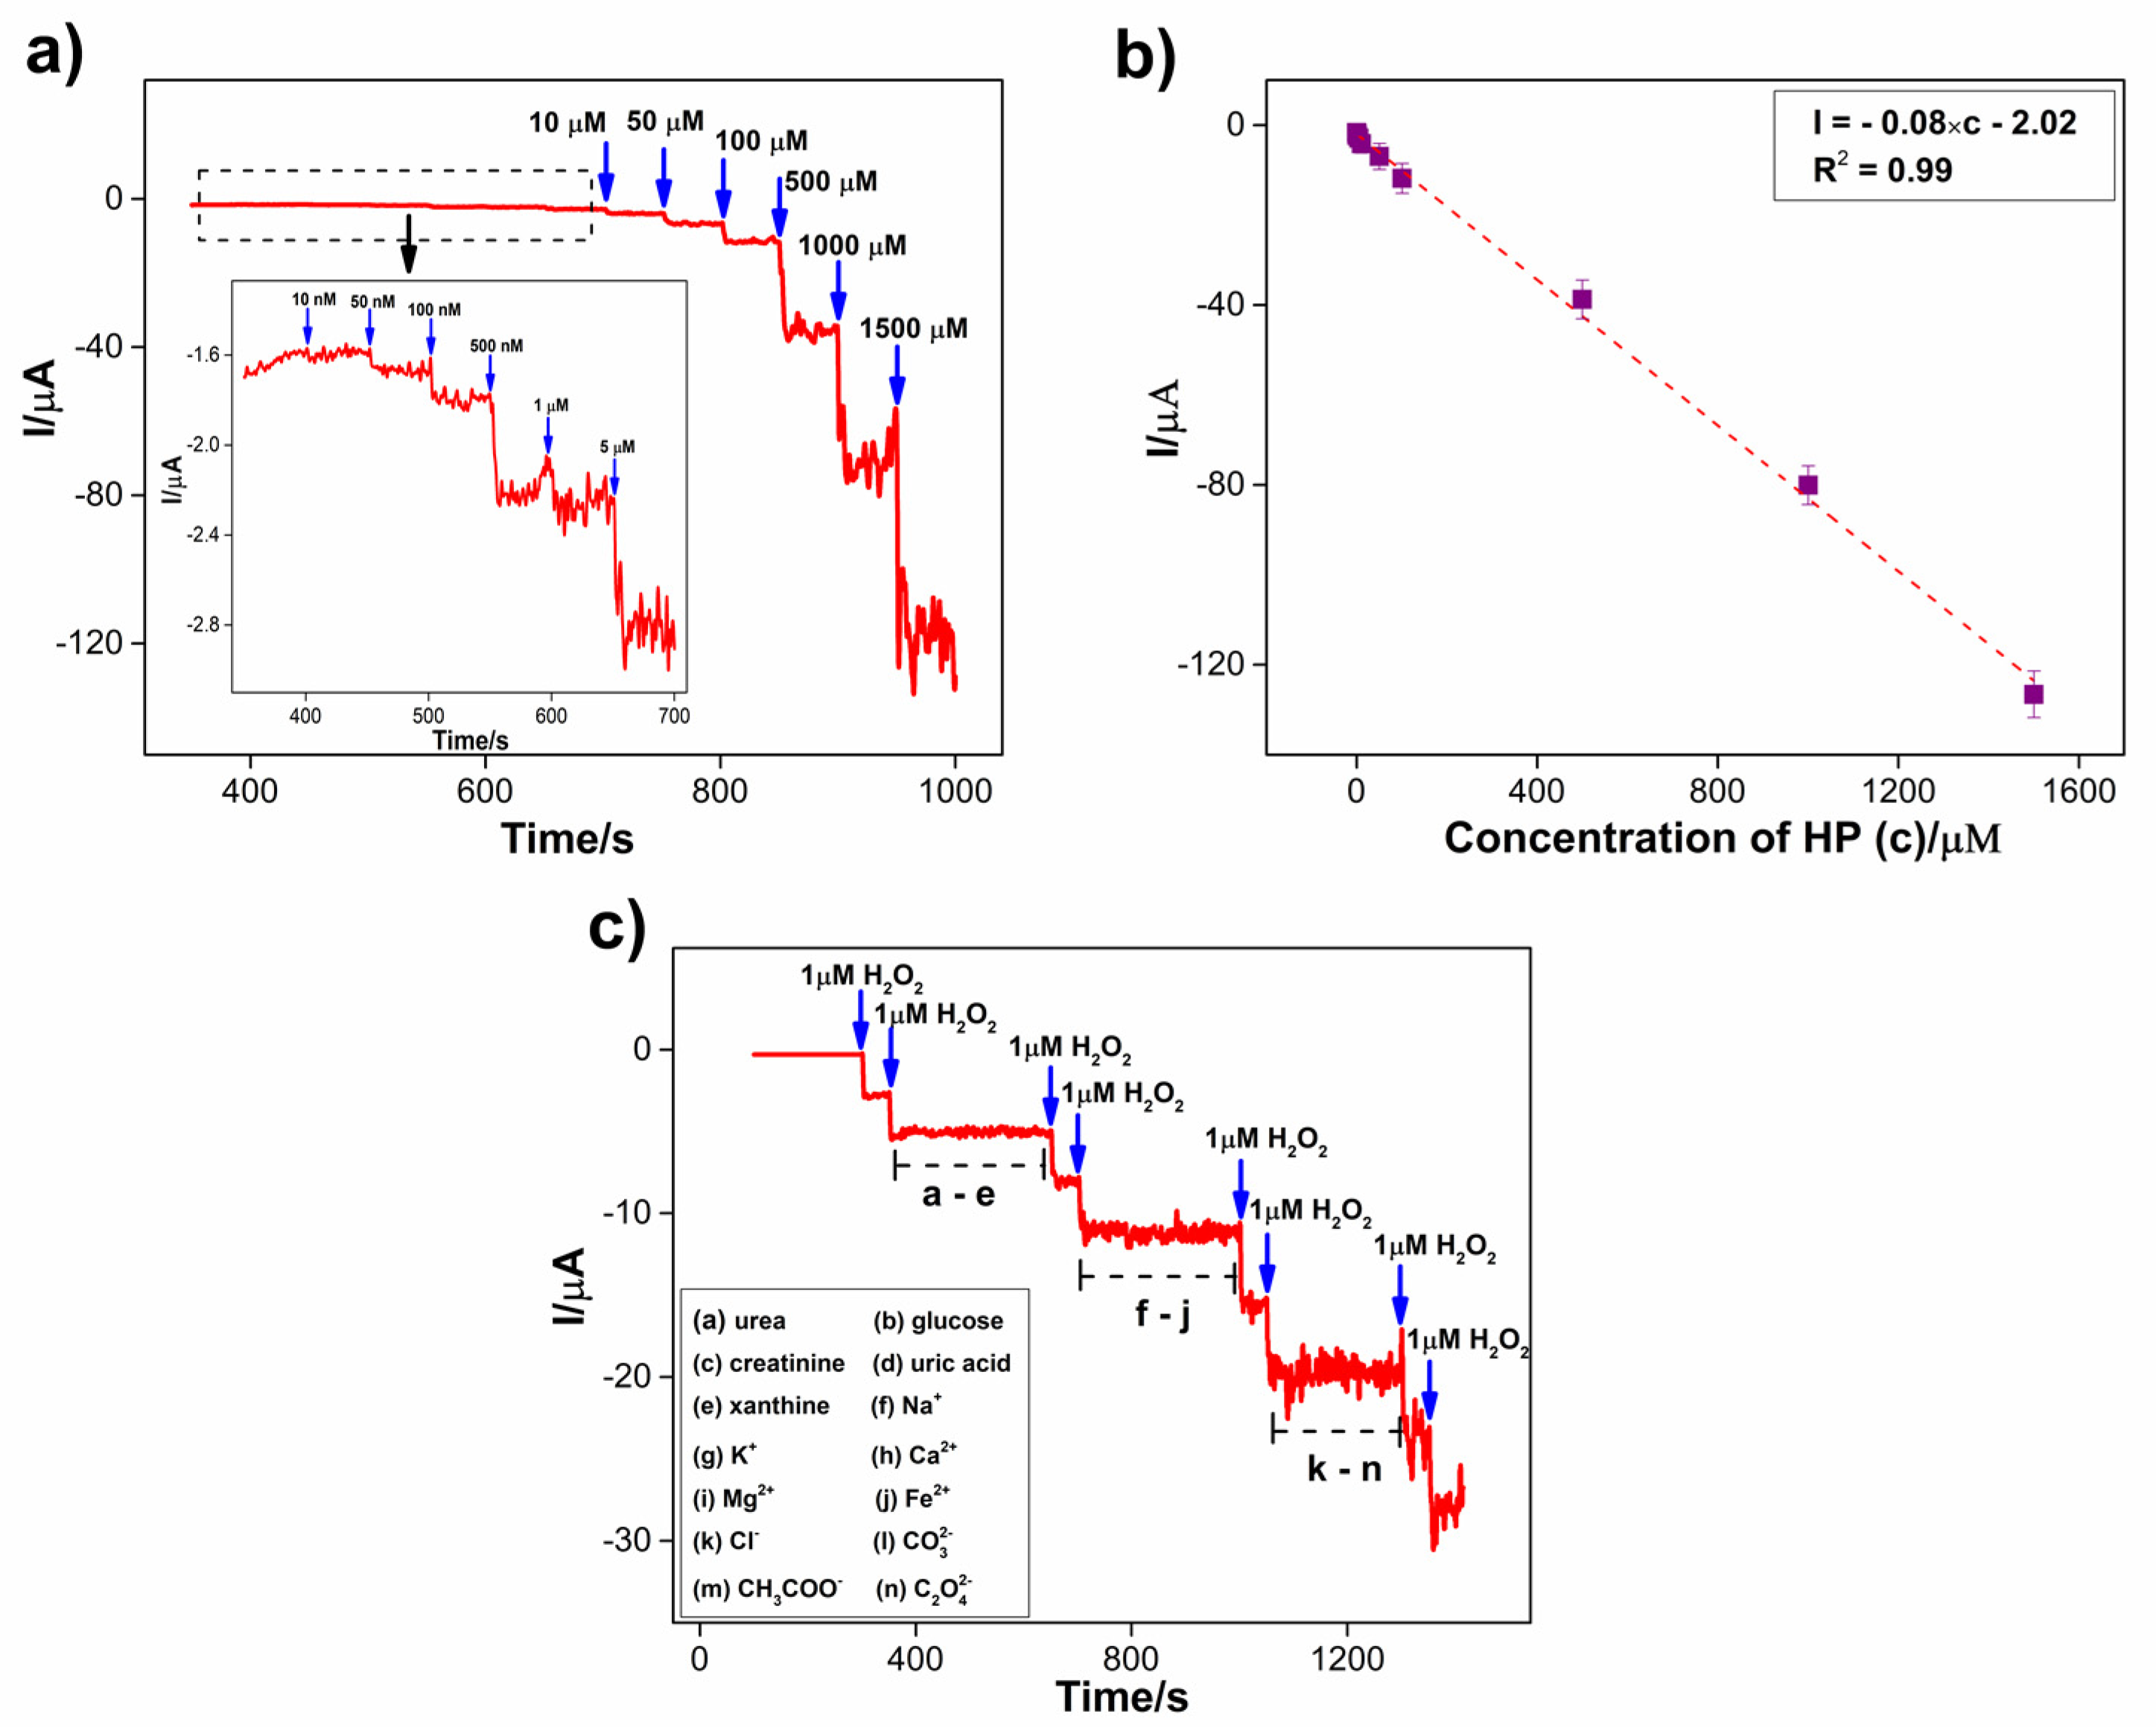
3.3.3. Amperometric Sensing of H2O2 at Co3S4/GCNNS Modified GCE
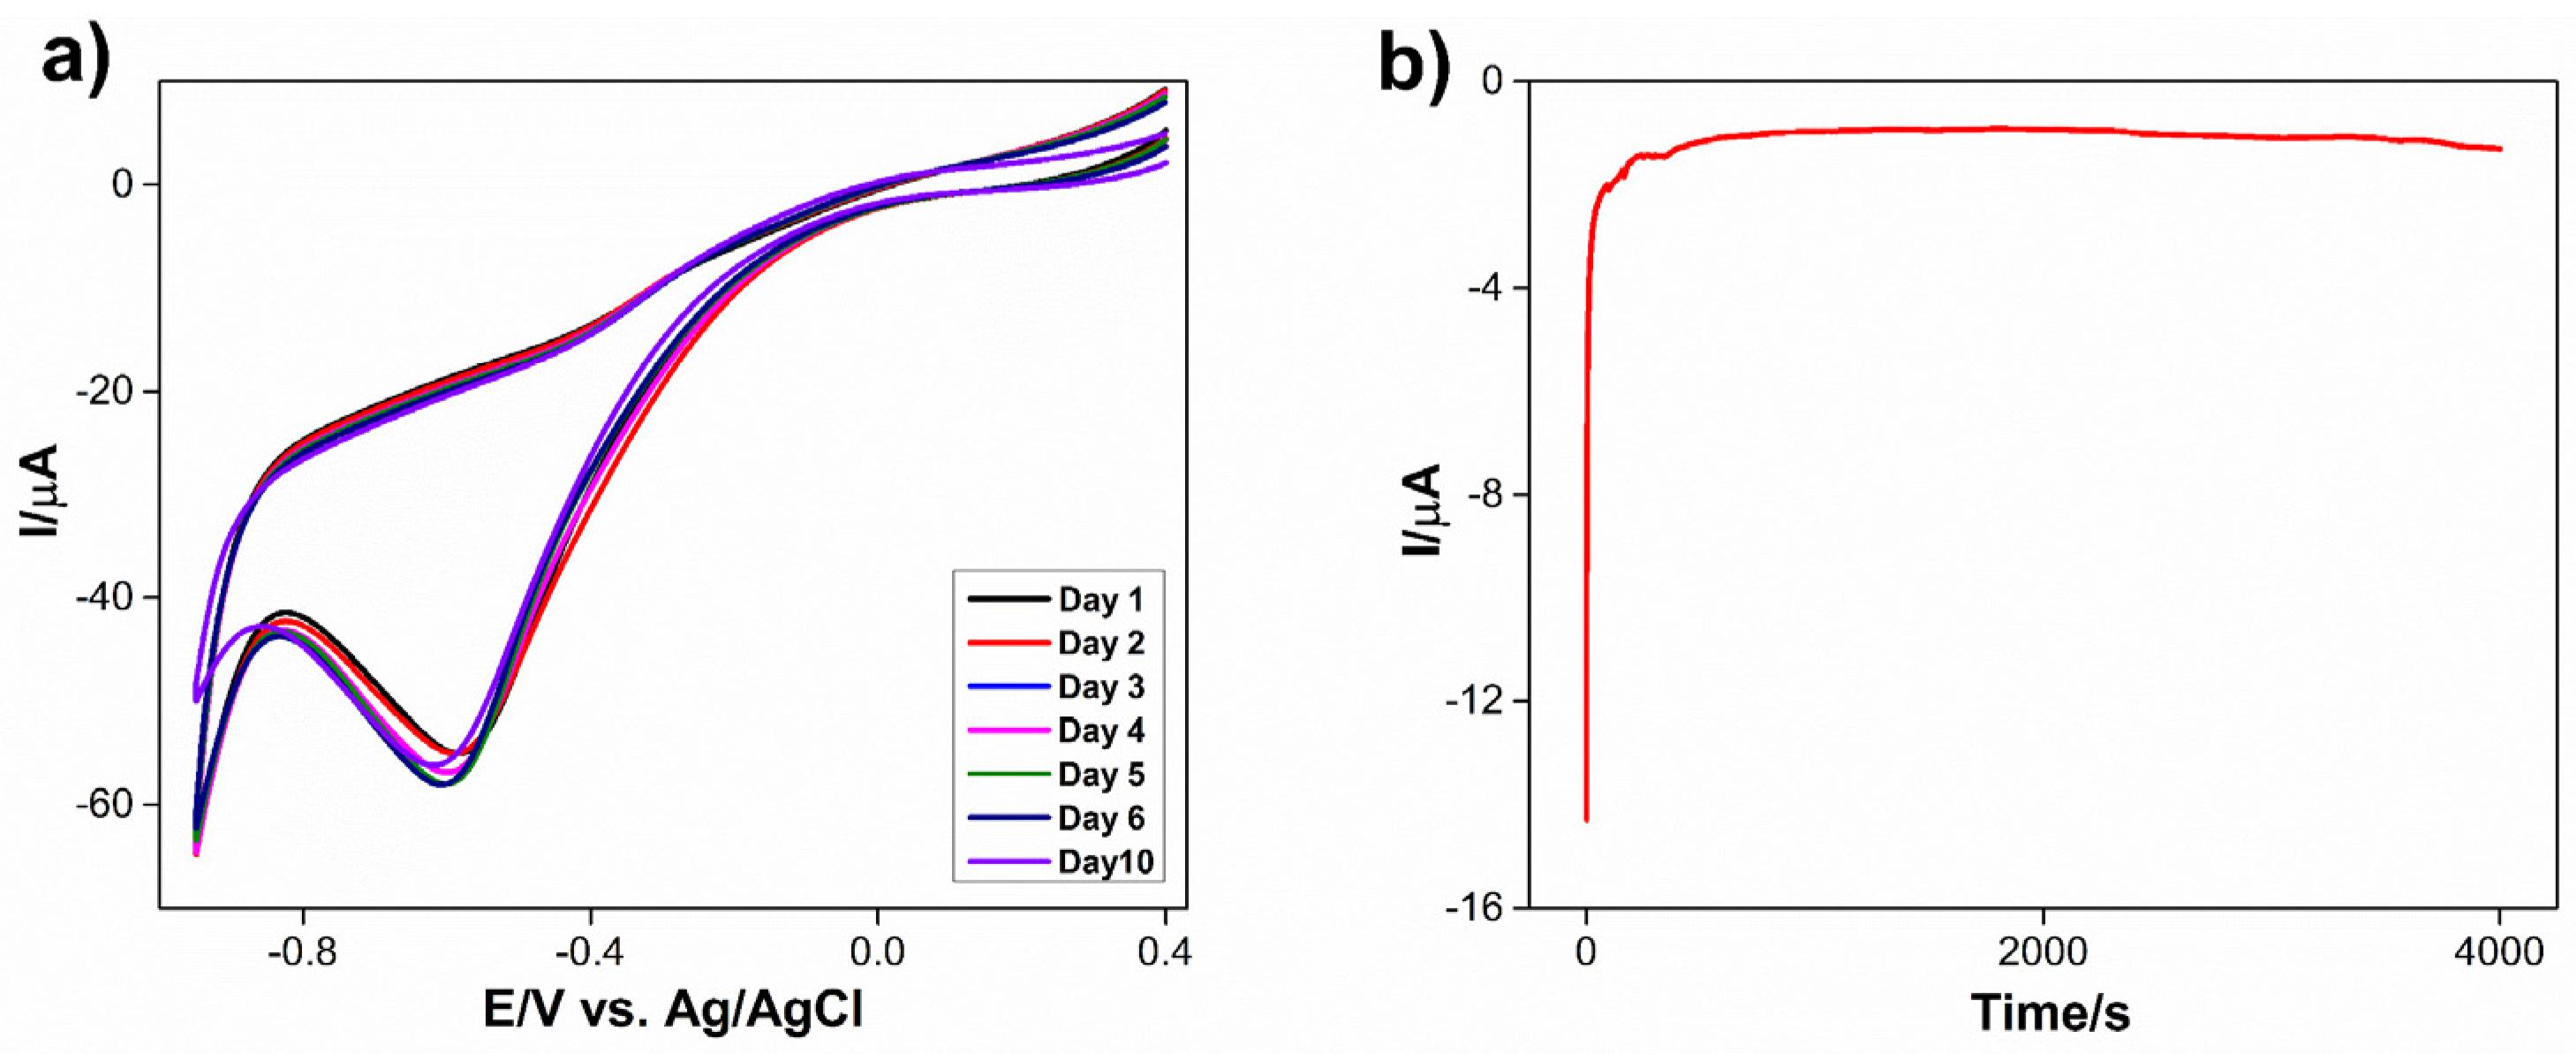
3.3.4. Stability of Co3S4/GCNNS Modified GCE Sensor
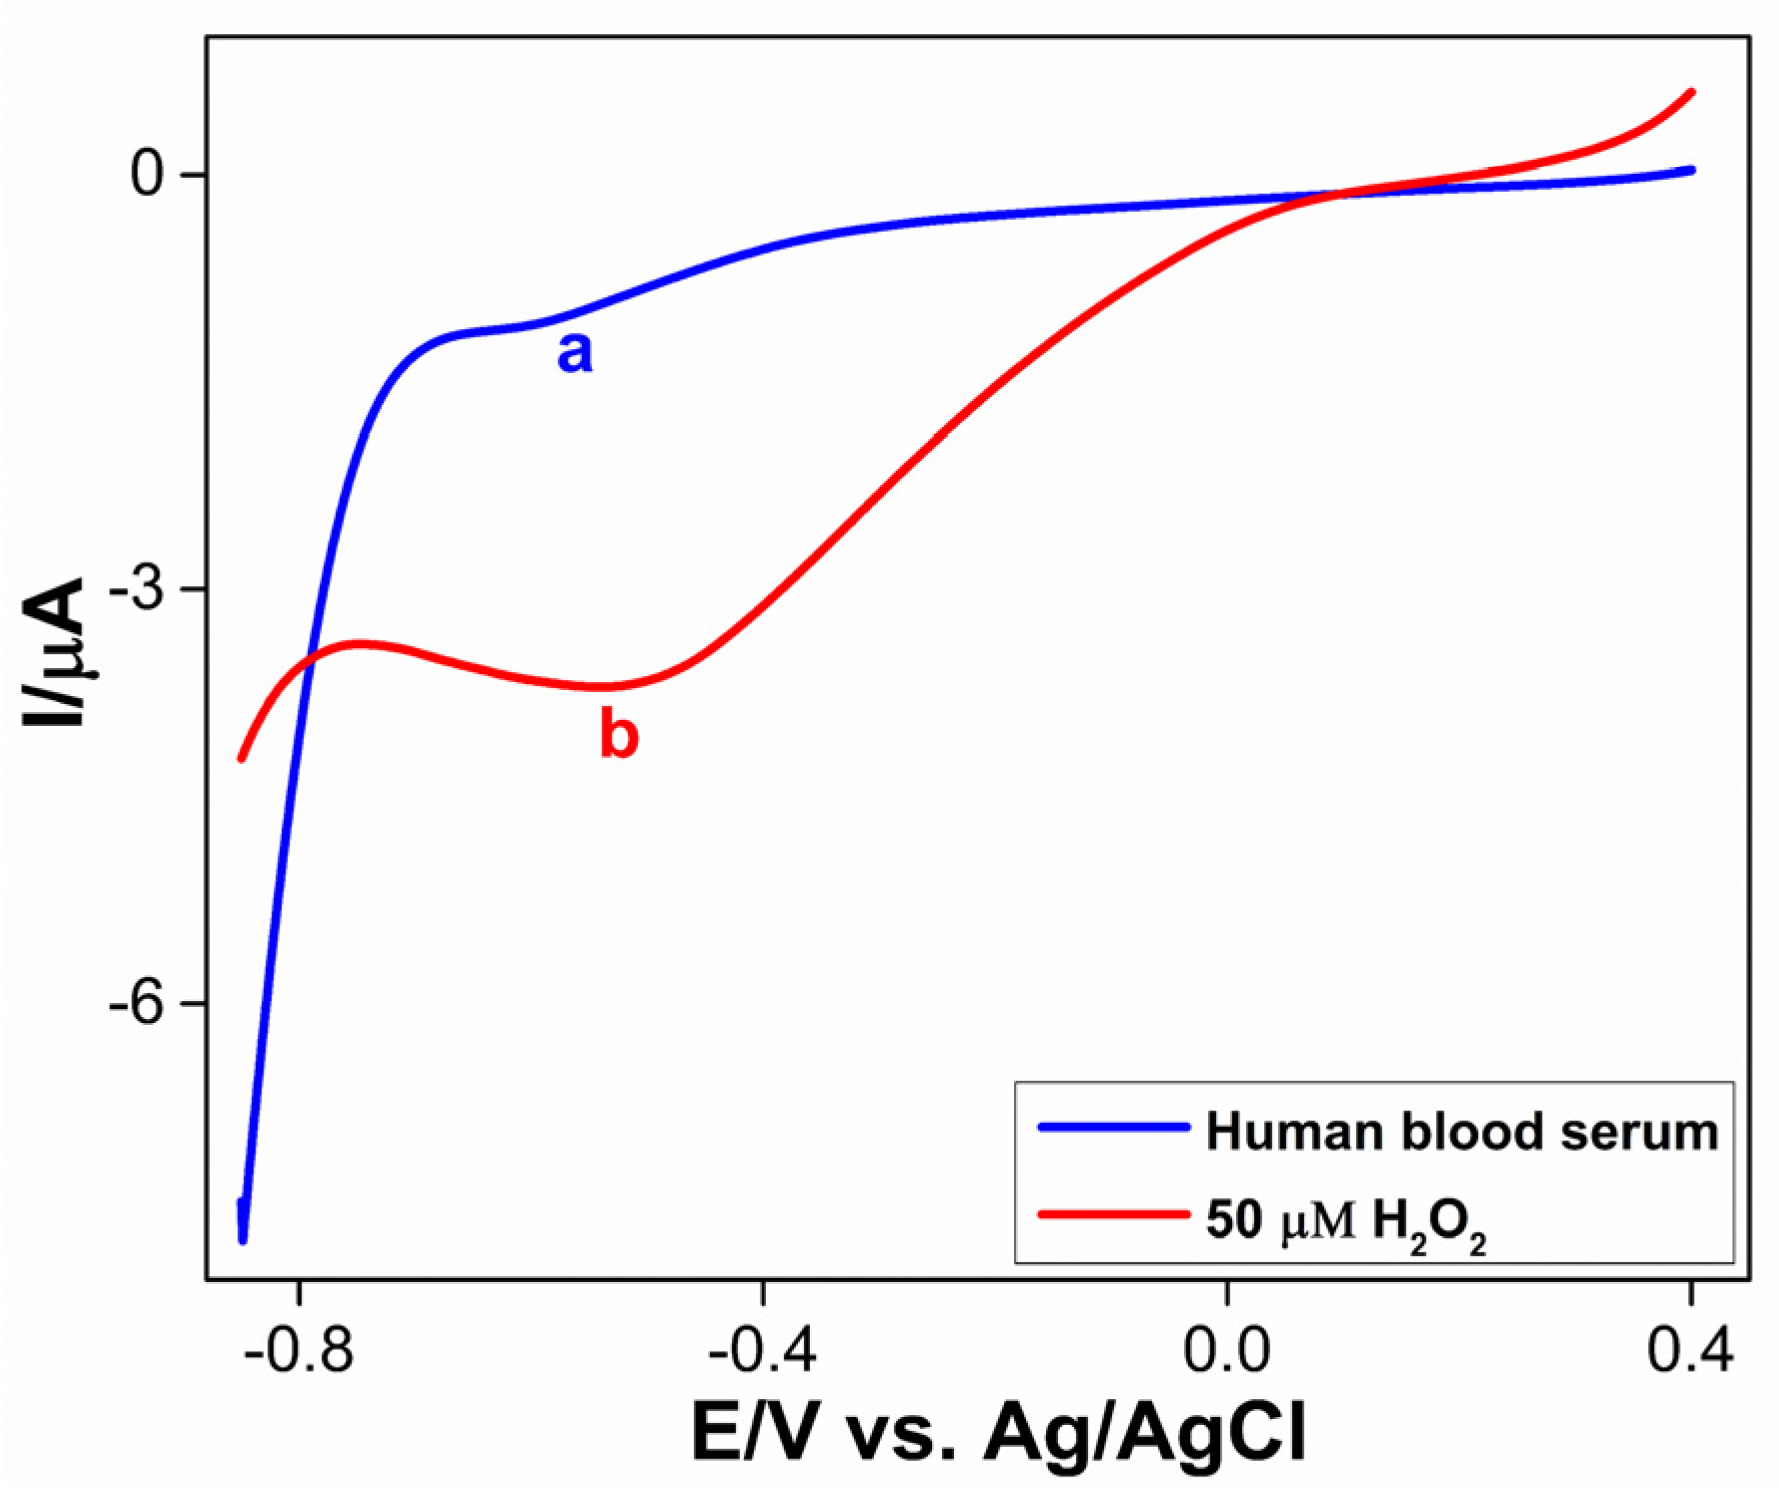
3.3.5. Real Sample Analysis
4. Conclusions
Supplementary Materials
Author Contributions
Funding
Institutional Review Board Statement
Informed Consent Statement
Data Availability Statement
Acknowledgments
Conflicts of Interest
References
- Dai, H.; Chen, Y.; Niu, X.; Pan, C.; Chen, H.; Chen, X. High-performance electrochemical biosensor for nonenzymatic H2O2 sensing based on Au@C-Co3O4 heterostructures. Biosens. Bioelectron. 2018, 118, 36–43. [Google Scholar] [CrossRef] [PubMed]
- Kubendhiran, S.; Thirumalraj, B.; Chen, S.-M.; Karuppiah, C. Electrochemical co-preparation of cobalt sulfide/reduced graphene oxide composite for electrocatalytic activity and determination of H2O2 in biological samples. J. Colloid Interface Sci. 2018, 509, 153–162. [Google Scholar] [CrossRef]
- Ye, M.; Yang, C.; Sun, Y.; Wang, J.; Wang, D.; Zhao, Y.; Zhu, Z.; Liu, P.; Zhu, J.; Li, C.; et al. ZnFe2O4 /Graphitic Carbon Nitride Nano/Microcomposites for the Enhanced Electrochemical Sensing of H2O2. ACS Appl. Nano Mater. 2022, 5, 10922–10932. [Google Scholar] [CrossRef]
- Wu, J.; Wu, Y.; Lu, L.; Zhang, D.; Wang, X. Single-atom Au catalyst loaded on CeO2: A novel single-atom nanozyme electrochemical H2O2 sensor. Talanta Open 2021, 4, 100075. [Google Scholar] [CrossRef]
- Shi, L.; Layani, M.; Cai, X.; Zhao, H.; Magdassi, S.; Lan, M. An inkjet printed Ag electrode fabricated on plastic substrate with a chemical sintering approach for the electrochemical sensing of hydrogen peroxide. Sens. Actuators B Chem. 2018, 256, 938–945. [Google Scholar] [CrossRef]
- Liu, Y.; Li, H.; Gong, S.; Chen, Y.; Xie, R.; Wu, Q.; Tao, J.; Meng, F.; Zhao, P. A novel non-enzymatic electrochemical biosensor based on the nanohybrid of bimetallic PdCu nanoparticles/carbon black for highly sensitive detection of H2O2 released from living cells. Sens. Actuators B Chem. 2019, 290, 249–257. [Google Scholar] [CrossRef]
- Klassen, N.; Marchington, D.; McGowan, H. H2O2 Determination by the I3- Method and by KMnO4 Titration. Anal. Chem. 1994, 66, 2921–2925. [Google Scholar] [CrossRef]
- Ye, S.; Hananya, N.; Green, O.; Chen, H.; Zhao, A.; Shen, J.; Shabat, D.; Yang, D. A Highly Selective and Sensitive Chemiluminescent Probe for Real-Time Monitoring of Hydrogen Peroxide in Cells and Animals. Angew. Chem. Int. Ed. 2020, 59, 14326–14330. [Google Scholar] [CrossRef]
- Khan, S.; Jin, E.; Sojic, N.; Pantano, P. A fluorescence-based imaging-fiber electrode chemical sensor for hydrogen peroxide. Anal. Chim. Acta 2000, 404, 213–221. [Google Scholar] [CrossRef]
- Beers, R.; Sizer, I. A spectrophotometric method for measuring the breakdown of hydrogen peroxide by catalase. J. Biol. Chem. 1952, 195, 133–140. [Google Scholar] [CrossRef]
- Karuppiah, C.; Venkatesh, K.; Arunachalam, P.; Ramaraj, S.; Al-Mayouf, A.; Yang, C.-C. Optimization of S-dopant on N, S co-doped graphene/CNT-Fe3C nanocomposite electrode for non-enzymatic H2O2 sensor. Mater. Lett. 2021, 285, 129001. [Google Scholar] [CrossRef]
- Zhu, C.; Yang, G.; Li, H.; Du, D.; Lin, Y. Electrochemical Sensors and Biosensors Based on Nanomaterials and Nanostructures. Anal. Chem. 2015, 87, 230–249. [Google Scholar] [CrossRef] [PubMed]
- Liu, H.; Weng, L.; Yang, C. A review on nanomaterial-based electrochemical sensors for H2O2, H2S and NO inside cells or released by cells. Microchim. Acta 2017, 184, 1267–1283. [Google Scholar] [CrossRef]
- Cao, D.; Chao, J.; Sun, L.; Wang, G. Catalytic behavior of Co3O4 in electroreduction of H2O2. J. Power Sources 2008, 179, 87–91. [Google Scholar] [CrossRef]
- Salimi, A.; Hallaj, R.; Soltanian, S.; Mamkhezri, H. Nanomolar detection of hydrogen peroxide on glassy carbon electrode modified with electrodeposited cobalt oxide nanoparticles. Anal. Chim. Acta 2007, 594, 24–31. [Google Scholar] [CrossRef]
- Li, S.-J.; Du, J.-M.; Zhang, J.-P.; Zhang, M.-J.; Chen, J. A glassy carbon electrode modified with a film composed of cobalt oxide nanoparticles and graphene for electrochemical sensing of H2O2. Microchim. Acta 2014, 181, 631–638. [Google Scholar] [CrossRef]
- Ullah, R.; Rasheed, M.; Abbas, S.; Rehman, K.; Shah, A.; Ullah, K.; Khan, Y.; Bibi, M.; Ahmad, M.; Ali, G. Electrochemical sensing of H2O2 using cobalt oxide modified TiO2 nanotubes. Curr. Appl. Phys. 2022, 38, 40–48. [Google Scholar] [CrossRef]
- Liu, T.; Zhang, X.; Fu, K.; Zhou, N.; Xiong, J.; Su, Z. Fabrication of Co3O4/NiCo2O4 Nanocomposite for Detection of H2O2 and Dopamine. Biosensors 2021, 11, 452. [Google Scholar] [CrossRef]
- Wang, H.; Shu, T.; Lin, C.; Sun, F.; Wang, Z.; Lin, B.; Wei, F.; Yao, K.X.; Qi, J.; Sui, Y. Hierarchical construction of Co3S4 nanosheet coated by 2D multi-layer MoS2 as an electrode for high performance supercapacitor. Appl. Surf. Sci. 2022, 578, 151897. [Google Scholar] [CrossRef]
- Xue, Z.; Lv, L.; Tian, Y.; Tan, S.; Ma, Q.; Tao, K.; Han, L. Co3S4 Nanoplate Arrays Decorated with Oxygen-Deficient CeO2 Nanoparticles for Supercapacitor Applications. ACS Appl. Nano Mater. 2021, 4, 3033–3043. [Google Scholar] [CrossRef]
- Ji, Z.; Li, N.; Xie, M.; Shen, X.; Dai, W.; Liu, K.; Xu, K.; Zhu, G. High-performance hybrid supercapacitor realized by nitrogen-doped carbon dots modified cobalt sulfide and reduced graphene oxide. Electrochim. Acta 2020, 334, 135632. [Google Scholar] [CrossRef]
- Yang, Z.; Bai, X.; Zhu, S.; Qi, C. Synthesis of porous Co3S4 for enhanced voltammetric nonenzymatic determination of glucose. Microchim. Acta 2020, 187, 98. [Google Scholar] [CrossRef]
- Huang, D.; Yang, L.; Li, X.; Zou, L.; Ye, B. A new electrochemical sensor for Taxifolin based on RGO-Co3S4@MoS2 modified electrode. J. Electroanal. Chem. 2019, 851, 113473. [Google Scholar] [CrossRef]
- Chen, H.; Cai, J.; Yang, J.; Zhong, Z.; Ma, M.; Deng, W.; Tan, Y.; Xie, Q. Synergistic electrocatalysis of Cu2S@Co3S4 core-shell heterostructures toward H2O2 reduction and their application for sensitive immunosensing of alpha fetoprotein. Sens. Actuators B Chem. 2021, 348, 130703. [Google Scholar] [CrossRef]
- Huang, H.-Q.; Li, Y.-Y.; Chen, S.-H.; Liu, Z.-G.; Cui, Y.-M.; Li, H.-Q.; Guo, Z.; Huang, X.-J. Noble-metal-free Fe3O4/Co3S4 nanosheets with oxygen vacancies as an efficient electrocatalyst for highly sensitive electrochemical detection of As(III). Anal. Chim. Acta 2022, 1189, 339208. [Google Scholar] [CrossRef] [PubMed]
- Idris, A.; Oseghe, E.; Msagati, T.; Kuvarega, A.; Feleni, U.; Mamba, B. Graphitic Carbon Nitride: A Highly Electroactive Nanomaterial for Environmental and Clinical Sensing. Sensors 2020, 20, 5743. [Google Scholar] [CrossRef]
- Puentes-Prado, E.; Gutiérrez-Granados, S.; Gómez-Solís, C.; Ramírez-García, G. Enhanced photo-electrochemical response of screen-printed electrodes based on g-C3N4 hollow spheres and other morphologies for sensing applications. FlatChem 2022, 35, 100412. [Google Scholar] [CrossRef]
- Ahmad, K.; Kim, H. Design and preparation of g-C3N4/rGO modified screen printed electrode for hydrogen peroxide sensing application. Synth. Met. 2022, 286, 117047. [Google Scholar] [CrossRef]
- Luo, Y.; Yan, Y.; Zheng, S.; Xue, H.; Pang, H. Graphitic carbon nitride based materials for electrochemical energy storage. J. Mater. Chem. A Mater. 2019, 7, 901–924. [Google Scholar] [CrossRef]
- Ajith, A.; John, S. Performance of graphitic carbon nitride nanosheets derived from liquid and thermal exfoliations towards the electrochemical reduction of nitrobenzene. New J. Chem. 2022, 46, 6446–6452. [Google Scholar] [CrossRef]
- Liu, H.; Zhang, Y.; Dong, Y.; Chu, X. Synthesis of ZnO/g-C3N4 Nanocomposite and Its Electrochemical Application in Hydrogen Peroxide Detection. Russ. J. Electrochem. 2021, 57, 808–815. [Google Scholar] [CrossRef]
- Atacan, K.; Özacar, M. Construction of a non-enzymatic electrochemical sensor based on CuO/g-C3N4 composite for selective detection of hydrogen peroxide. Mater. Chem. Phys. 2021, 266, 124527. [Google Scholar] [CrossRef]
- Chauhan, M.; Reddy, K.; Gopinath, C.; Deka, S. Copper Cobalt Sulfide Nanosheets Realizing a Promising Electrocatalytic Oxygen Evolution Reaction. ACS Catal. 2017, 7, 5871–5879. [Google Scholar] [CrossRef] [Green Version]
- Seredych, M.; Łoś, S.; Giannakoudakis, D.; Rodríguez-Castellón, E.; Bandosz, T. Photoactivity of g-C3N4 /S-Doped Porous Carbon Composite: Synergistic Effect of Composite Formation. ChemSusChem 2016, 9, 795–799. [Google Scholar] [CrossRef]
- Wang, Y.; Hao, X.; Zhang, L.; Jin, Z.; Zhao, T. Amorphous Co3S4 nanoparticle-modified tubular g-C3N4 forms step-scheme heterojunctions for photocatalytic hydrogen production. Catal. Sci. Technol. 2021, 11, 943–955. [Google Scholar] [CrossRef]
- Ramesh, A.; Gavaskar, D.; Nagaraju, P.; Duvvuri, S.; Vanjari, S.; Subrahmanyam, C. Mn-doped ZnO microspheres prepared by solution combustion synthesis for room temperature NH3 sensing. Appl. Surf. Sci. Adv. 2022, 12, 100349. [Google Scholar] [CrossRef]
- Gan, Z.; Shan, Y.; Chen, J.; Gui, Q.; Zhang, Q.; Nie, S.; Wu, X. The origins of the broadband photoluminescence from carbon nitrides and applications to white light emitting. Nano Res. 2016, 9, 1801–1812. [Google Scholar] [CrossRef]
- Shan, Y.; Wang, Y.; Shi, C.; Gan, Z. Relaxation of Excited Electrons on Carbon Nitrides Investigated by Electrochemiluminescence and Photoluminescence Spectra. J. Phys. Chem. C 2020, 124, 19314–19323. [Google Scholar] [CrossRef]
- Liang, Z.; Xue, Y.; Wang, X.; Zhang, X.; Tian, J.; Cui, H. The incorporation of cocatalyst cobalt sulfide into graphitic carbon nitride: Boosted photocatalytic hydrogen evolution performance and mechanism exploration. Nano Mater. Sci. 2022; in press. [Google Scholar] [CrossRef]
- Li, X.; Zhang, J.; Shen, L.; Ma, Y.; Lei, W.; Cui, Q.; Zou, G. Preparation and characterization of graphitic carbon nitride through pyrolysis of melamine. Appl. Phys. A 2009, 94, 387–392. [Google Scholar] [CrossRef]
- Yang, H.; Yin, J.; Cao, R.; Sun, P.; Zhang, S.; Xu, X. Constructing highly dispersed 0D Co3S4 quantum dots/2D g-C3N4 nanosheets nanocomposites for excellent photocatalytic performance. Sci. Bull. 2019, 64, 1510–1517. [Google Scholar] [CrossRef] [Green Version]
- Li, W.; Li, Y.; Yang, C.; Ma, Q.; Tao, K.; Han, L. Fabrication of 2D/2D nanosheet heterostructures of ZIF-derived Co3S4 and g-C3N4 for asymmetric supercapacitors with superior cycling stability. Dalton Trans. 2020, 49, 14017–14029. [Google Scholar] [CrossRef] [PubMed]
- Li, Y.; Xu, J.; Liu, Z.; Yu, H. Synthesis of Ni12P5 on Co3S4 material for effectively improved photocatalytic hydrogen production from water splitting under visible light. J. Mater. Sci. Mater. Electron. 2019, 30, 11694–11705. [Google Scholar] [CrossRef]
- Ye, L.; Fu, J.; Xu, Z.; Yuan, R.; Li, Z. Facile One-Pot Solvothermal Method to Synthesize Sheet-on-Sheet Reduced Graphene Oxide (RGO)/ZnIn2S4 Nanocomposites with Superior Photocatalytic Performance. ACS Appl. Mater. Interfaces 2014, 6, 3483–3490. [Google Scholar] [CrossRef] [PubMed]
- Jafarian, M.; Mahjani, M.; Heli, H.; Gobal, F.; Khajehsharifi, H.; Hamedi, M. A study of the electro-catalytic oxidation of methanol on a cobalt hydroxide modified glassy carbon electrode. Electrochim. Acta 2003, 48, 3423–3429. [Google Scholar] [CrossRef]
- Yang, Z.; Chen, C.-Y.; Chang, H.-T. Supercapacitors incorporating hollow cobalt sulfide hexagonal nanosheets. J. Power Sources 2011, 196, 7874–7877. [Google Scholar] [CrossRef]
- Shu, X.; Chen, Y.; Yuan, H.; Gao, S.; Xiao, D. H2O2 Sensor Based on the Room-Temperature Phosphorescence of Nano TiO2 /SiO2 Composite. Anal. Chem. 2007, 79, 3695–3702. [Google Scholar] [CrossRef]
- Wang, K.; Liu, Q.; Wu, X.-Y.; Guan, Q.-M.; Li, H.-N. Graphene enhanced electrochemiluminescence of CdS nanocrystal for H2O2 sensing. Talanta 2010, 82, 372–376. [Google Scholar] [CrossRef]
- Gan, Z.; Gui, Q.; Shan, Y.; Pan, P.; Zhang, N.; Zhang, L. Photoluminescence of MoS2 quantum dots quenched by hydrogen peroxide: A fluorescent sensor for hydrogen peroxide. J. Appl. Phys. 2016, 120, 104503. [Google Scholar] [CrossRef]
- Zhu, P.; Xu, Z.; Cai, L.; Chen, J. Porphyrin Iron-Grafted Mesoporous Silica Composites for Drug Delivery, Dye Degradation and Colorimetric Detection of Hydrogen Peroxide. Nanoscale Res. Lett. 2021, 16, 41. [Google Scholar] [CrossRef]
- Ding, L.; Chen, S.; Zhang, W.; Zhang, Y.; Wang, X. Fully Reversible Optical Sensor for Hydrogen Peroxide with Fast Response. Anal. Chem. 2018, 90, 7544–7551. [Google Scholar] [CrossRef]
- Wang, M.; Jiang, X.; Liu, J.; Guo, H.; Liu, C. Highly sensitive H2O2 sensor based on Co3O4 hollow sphere prepared via a template-free method. Electrochim. Acta 2015, 182, 613–620. [Google Scholar] [CrossRef]
- Gowthaman, N.; Shankar, S.; John, S.A. Substrate catalyzed formation of Au-Cu bimetallic nanoparticles as electrocatalyst for the reduction of dioxygen and hydrogen peroxide. J. Electroanal. Chem. 2018, 812, 37–44. [Google Scholar] [CrossRef]
- Gaikwad, R.; Thangaraj, P.; Sen, A. Direct and rapid measurement of hydrogen peroxide in human blood using a microfluidic device. Sci. Rep. 2021, 11, 2960. [Google Scholar] [CrossRef] [PubMed]
- Forman, H.; Bernardo, A.; Davies, K. What is the concentration of hydrogen peroxide in blood and plasma? Arch. Biochem. Biophys. 2016, 603, 48–53. [Google Scholar] [CrossRef] [PubMed]
- Hira, H.; Samal, P.; Kaur, A.; Kapoor, S. Plasma level of hypoxanthine/xanthine as markers of oxidative stress with different stages of obstructive sleep apnea syndrome. Ann. Saudi Med. 2014, 34, 308–313. [Google Scholar] [CrossRef] [PubMed]
- Chou, J.-C.; Wu, C.-Y.; Lin, S.-H.; Kuo, P.-Y.; Lai, C.-H.; Nien, Y.-H.; Wu, Y.-X.; Lai, T.-Y. The Analysis of the Urea Biosensors Using Different Sensing Matrices via Wireless Measurement System & Microfluidic Measurement System. Sensors 2019, 19, 3004. [Google Scholar] [CrossRef] [PubMed]


Disclaimer/Publisher’s Note: The statements, opinions and data contained in all publications are solely those of the individual author(s) and contributor(s) and not of MDPI and/or the editor(s). MDPI and/or the editor(s) disclaim responsibility for any injury to people or property resulting from any ideas, methods, instructions or products referred to in the content. |
© 2023 by the authors. Licensee MDPI, Basel, Switzerland. This article is an open access article distributed under the terms and conditions of the Creative Commons Attribution (CC BY) license (https://creativecommons.org/licenses/by/4.0/).
Share and Cite
Ramesh, A.; Ajith, A.; Gudipati, N.S.; Vanjari, S.R.K.; John, S.A.; Biju, V.; Subrahmanyam, C. Hybridization of Co3S4 and Graphitic Carbon Nitride Nanosheets for High-performance Nonenzymatic Sensing of H2O2. Biosensors 2023, 13, 108. https://doi.org/10.3390/bios13010108
Ramesh A, Ajith A, Gudipati NS, Vanjari SRK, John SA, Biju V, Subrahmanyam C. Hybridization of Co3S4 and Graphitic Carbon Nitride Nanosheets for High-performance Nonenzymatic Sensing of H2O2. Biosensors. 2023; 13(1):108. https://doi.org/10.3390/bios13010108
Chicago/Turabian StyleRamesh, Asha, Ajay Ajith, Neeraja Sinha Gudipati, Siva Rama Krishna Vanjari, S. Abraham John, Vasudevanpillai Biju, and Ch Subrahmanyam. 2023. "Hybridization of Co3S4 and Graphitic Carbon Nitride Nanosheets for High-performance Nonenzymatic Sensing of H2O2" Biosensors 13, no. 1: 108. https://doi.org/10.3390/bios13010108