An Apple Fungal Infection Detection Model Based on BPNN Optimized by Sparrow Search Algorithm


Abstract
:
1. Introduction
2. Materials and Methods
2.1. Materials
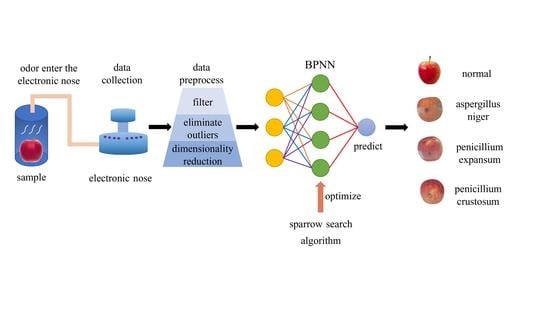
2.2. Methods
2.2.1. Data Preprocessing
Smooth Filter
Eliminate Outliers
Data Dimensionality Reduction
2.2.2. Pattern Recognition Model
3. Results
3.1. The Recognition Accuracy of the Model Optimized by SSA-BPNN Is Higher
3.2. SSA-BPNN Has Faster Convergence
4. Discussion
Author Contributions
Funding
Institutional Review Board Statement
Informed Consent Statement
Data Availability Statement
Conflicts of Interest
References
- Kang, N.J.; Lee, K.W.; Lee, S.J.; Lee, C.Y.; Lee, H.J. Effects of phenolics in Empire apples on hydrogen peroxide-induced inhibition of gap-junctional intercellular communication. Biofactors 2004, 21, 361–365. [Google Scholar] [CrossRef] [PubMed]
- Munir, N.; Rafique, M.; Altaf, I.; Sharif, N.; Naz, S. Antioxidant and antimicrobial activities of extracts from selected algal species. Bangladesh J. Bot. 2018, 47, 53–61. [Google Scholar]
- Guo, Z.; Wang, M.; Barimah, A.O.; Chen, Q.; Li, H.; Shi, J.; El-Seedi, H.R.; Zou, X. Label-free surface enhanced Raman scattering spectroscopy for discrimination and detection of dominant apple spoilage fungus. Int. J. Food Microbiol. 2020, 338, 108990. [Google Scholar] [CrossRef] [PubMed]
- Žebeljan, A.; Vico, I.; Duduk, N.; Žiberna, B.; Krajnc, A.U. Profiling changes in primary metabolites and antioxidants during apple fruit decay caused by Penicillium crustosum. Physiol. Mol. Plant Pathol. 2020, 113, 101586. [Google Scholar] [CrossRef]
- Berrada, H.; Buys, E.; Mañes, J.; Font, G. Determination of patulin in apple juice by GC–MS/MS: Stability study during storage. Toxicol. Lett. 2012, 211, S97. [Google Scholar] [CrossRef]
- Zeng, W.; Tao, H.; Li, Y.; Wang, J.; Xia, C.; Li, S.; Wang, M.; Wang, Q.; Miao, H. The flavor of Chinese kale sprouts is affected by genotypic variation of glucosinolates and their breakdown products. Food Chem. 2021, 359, 129824. [Google Scholar] [CrossRef]
- Liu, Y.; Furuno, S.; Akagawa, S.; Yatabe, R.; Onodera, T.; Fujiwara, N.; Takeda, H.; Uchida, S.; Toko, K. Odor Recognition of Thermal Decomposition Products of Electric Cables Using Odor Sensing Arrays. Chemosensors 2021, 9, 261. [Google Scholar] [CrossRef]
- Guo, Z.; Guo, C.; Sun, L.; Zuo, M.; Chen, Q.; El-Seedi, H.R.; Zou, X. Identification of the apple spoilage causative fungi and prediction of the spoilage degree using electronic nose. J. Food Process Eng. 2021, 44, e13816. [Google Scholar] [CrossRef]
- Nouri, B.; Mohtasebi, S.S.; Rafiee, S. Quality detection of pomegranate fruit infected with fungal disease. Int. J. Food Prop. 2020, 23, 9–21. [Google Scholar] [CrossRef]
- Voss, H.G.J.; Ayub, R.A.; Stevan, S.L. E-nose Prototype to Monitoring the Growth and Maturation of Peaches in the Orchard. IEEE Sens. J. 2020, 20, 11741–11750. [Google Scholar] [CrossRef]
- Yang, X.; Chen, J.; Jia, L.; Yu, W.; Wang, D.; Wei, W.; Li, S.; Tian, S.; Wu, D. Rapid and Non-Destructive Detection of Compression Damage of Yellow Peach Using an Electronic Nose and Chemometrics. Sensors 2020, 20, 1866. [Google Scholar] [CrossRef] [PubMed] [Green Version]
- Guo, Z.; Guo, C.; Chen, Q.; Ouyang, Q.; Shi, J.; El-Seedi, H.R.; Zou, X. Classification for Penicillium expansum Spoilage and Defect in Apples by Electronic Nose Combined with Chemometrics. Sensors 2020, 20, 2130. [Google Scholar] [CrossRef] [PubMed]
- Wu, H.; Wang, J. A Method for Prediction of Waterlogging Economic Losses in a Subway Station Project. Mathematics 2021, 9, 1421. [Google Scholar] [CrossRef]
- Jiang, H.; Wang, J.; Mao, W.; Chen, Q. Determination of aflatoxin B1 in wheat based on colourimetric sensor array technology: Optimization of sensor features and model parameters to improve the model generalization performance. Microchem. J. 2022, 175, 107173. [Google Scholar] [CrossRef]
- Sun, J.; Zhou, X.; Wu, X.; Zhang, X.; Li, Q. Identification of moisture content in tobacco plant leaves using outlier sample eliminating algorithms and hyperspectral data. Biochem. Biophys. Res. Commun. 2016, 471, 226–232. [Google Scholar] [CrossRef]
- Virtanen, J.; Hokkinen, L.; Karjalainen, M.; Kontunen, A.; Vuento, R.; Numminen, J.; Rautiainen, M.; Oksala, N.; Roine, A.; Kivekäs, I. In vitro detection of common rhinosinusitis bacteria by the eNose utilising differential mobility spectrometry. Eur. Arch. Oto-Rhino-Laryngol. 2018, 275, 2273–2279. [Google Scholar] [CrossRef]
- Ge, G.; Shi, Z.; Zhu, Y.; Yang, X.; Hao, Y. Land use/cover classification in an arid desert-oasis mosaic landscape of China using remote sensed imagery: Performance assessment of four machine learning algorithms. Glob. Ecol. Conserv. 2020, 22, e00971. [Google Scholar] [CrossRef]
- Tian, H.; Liu, H.; He, Y.; Chen, B.; Xiao, L.; Fei, Y.; Wang, G.; Yu, H.; Chen, C. Combined application of electronic nose analysis and back-propagation neural network and random forest models for assessing yogurt flavor acceptability. J. Food Meas. Charact. 2020, 14, 573–583. [Google Scholar] [CrossRef]
- Jiang, W.; Gao, D. Five typical stenches detection using an Electronic Nose. Sensors 2020, 20, 2514. [Google Scholar] [CrossRef]
- Kang, M.; Cho, I.; Park, J.; Jeong, J.; Lee, K.; Lee, B.; Henriquez, D.D.O.; Yoon, K.; Park, I. High Accuracy Real-Time Multi-Gas Identification by a Batch-Uniform Gas Sensor Array and Deep Learning Algorithm. ACS Sens. 2022, 7, 430–440. [Google Scholar] [CrossRef]
- Gu, S.; Wang, J.; Wang, Y. Early discrimination and growth tracking of Aspergillus spp. contamination in rice kernels using electronic nose. Food Chem. 2019, 292, 325–335. [Google Scholar] [CrossRef] [PubMed]
- Eberhart, R.; Kennedy, J. A new optimizer using particle swarm theory. In Proceedings of the Sixth International Symposium on Micro Machine and Human Science, MHS’95, Nagoya, Japan, 4–6 October 1995; IEEE: New York, NY, USA, 1995; pp. 39–43. [Google Scholar]
- Mirjalili, S.; Mirjalili, S.M.; Lewis, A. Grey wolf optimizer. Adv. Eng. Softw. 2014, 69, 6–61. [Google Scholar] [CrossRef]
- Xue, J.; Shen, B. A novel swarm intelligence optimization approach: Sparrow search algorithm. Syst. Sci. Control. Eng. 2020, 8, 22–34. [Google Scholar] [CrossRef]


| Sensor Number | Sensor Model | Sensitive Gas | Detection Precision (ppm) |
|---|---|---|---|
| 1 | 7NE/C2H4-20 | C2H4 | 0.4 |
| 2 | 7NE/H2S-50 | H2S | 1 |
| 3 | 7NE/H2S-1000 | H2S | 20 |
| 4 | 7NE/C2H4-200 | C2H4 | 4 |
| 5 | 7NE/C2H4-20 | C2H4 | 0.4 |
| 6 | 7NE/ETO-20 | C2H4O | 0.4 |
| 7 | 7NE/PID-300 | VOC | 6 |
| 8 | 7NE/CH2O-2000 | CH2O | 40 |
| Sensor Name | Sensitive Features | Representative Gas and Detection Precision (ppm) |
|---|---|---|
| W1C | Sensitive to aromatic compounds | Methylbenzene, 10 |
| W3C | Aromatic compounds, particularly sensitive to ammonia | Benzene, 10 |
| W5C | Aromatic compounds such as alkanes and compounds with relatively small polarity | Propane, 1 |
| W1S | Particularly sensitive to methane contained in specimens | Methane, 100 |
| W2S | Particularly sensitive to ethanol contained in specimens | Carbon monoxide, 100 |
| W3S | Sensitive to high-concentration alkanes, especially methane, in specimens | Methane, 100 |
| W5S | Sensitive to nitrogen oxides, extremely sensitive to negatively charged nitrogen oxides | Nitrogen dioxide, 1 |
| W6S | Only detects hydrogen | Hydrogen, 100 |
| W1W | Mainly sensitive to sulfides, also sensitive to organic sulfides | Hydrogen sulfide, 1 |
| W2W | Mainly sensitive to aromatic compounds and organic sulfides | Hydrogen sulfide, 1 |
| Model | Sample Set | Validation Set Accuracy | Standard Deviation of Accuracy |
|---|---|---|---|
| KNN | before removing | 62.37% | 0.326 |
| after removing | 68.29% | 0.163 | |
| BPNN | before removing | 56.38% | 0.452 |
| after removing | 69.21% | 0.263 | |
| SVM | before removing | 57.32% | 0.318 |
| after removing | 64.65% | 0.227 |
| Dimensionality Reduction Method | Model | Average Accuracy | Standard Deviation of Accuracy |
|---|---|---|---|
| SVM | 64.65% | 0.227 | |
| None | BPNN | 69.21% | 0.263 |
| KNN | 68.29% | 0.163 | |
| SVM | 66.29% | 0.138 | |
| PCA | BPNN | 75.38% | 0.149 |
| KNN | 73.85% | 0.104 | |
| SVM | 65.50% | 0.136 | |
| FA | BPNN | 72.14% | 0.147 |
| KNN | 63.53% | 0.119 | |
| SVM | 91.07% | 0.046 | |
| LDA | BPNN | 93.17% | 0.072 |
| KNN | 89.23% | 0.058 |
| Preprocessing | Model | TPR | F1 Score | Average Accuracy | Standard Deviation of Accuracy | Training Time (s) |
|---|---|---|---|---|---|---|
| \ | CNN | 61.03% | 0.564 | 57.80% | 0.071 | 270.16 |
| LDA | RF | 84.36% | 0.836 | 86.92% | 0.077 | 0.17 |
| LDA | KNN | 88.12% | 0.878 | 89.23% | 0.058 | 0.09 |
| LDA | SVM | 90.69% | 0.903 | 91.07% | 0.046 | 0.22 |
| LDA | BPNN | 92.75% | 0.929 | 93.17% | 0.072 | 63.12 |
| LDA | PSO-BPNN | 93.82% | 0.937 | 94.62% | 0.091 | 8936.21 |
| LDA | GWO-BPNN | 95.83% | 0.951 | 96.16% | 0.064 | 8723.43 |
| LDA | SSA-BPNN | 97.31% | 0.976 | 98.40% | 0.032 | 9193.02 |
Publisher’s Note: MDPI stays neutral with regard to jurisdictional claims in published maps and institutional affiliations. |
© 2022 by the authors. Licensee MDPI, Basel, Switzerland. This article is an open access article distributed under the terms and conditions of the Creative Commons Attribution (CC BY) license (https://creativecommons.org/licenses/by/4.0/).
Share and Cite
Zhao, C.; Ma, J.; Jia, W.; Wang, H.; Tian, H.; Wang, J.; Zhou, W. An Apple Fungal Infection Detection Model Based on BPNN Optimized by Sparrow Search Algorithm. Biosensors 2022, 12, 692. https://doi.org/10.3390/bios12090692
Zhao C, Ma J, Jia W, Wang H, Tian H, Wang J, Zhou W. An Apple Fungal Infection Detection Model Based on BPNN Optimized by Sparrow Search Algorithm. Biosensors. 2022; 12(9):692. https://doi.org/10.3390/bios12090692
Chicago/Turabian StyleZhao, Changtong, Jie Ma, Wenshen Jia, Huihua Wang, Hui Tian, Jihua Wang, and Wei Zhou. 2022. "An Apple Fungal Infection Detection Model Based on BPNN Optimized by Sparrow Search Algorithm" Biosensors 12, no. 9: 692. https://doi.org/10.3390/bios12090692