SMART-LAMP: A Smartphone-Operated Handheld Device for Real-Time Colorimetric Point-of-Care Diagnosis of Infectious Diseases via Loop-Mediated Isothermal Amplification

 ,
,  , , , , , ,
  and
and 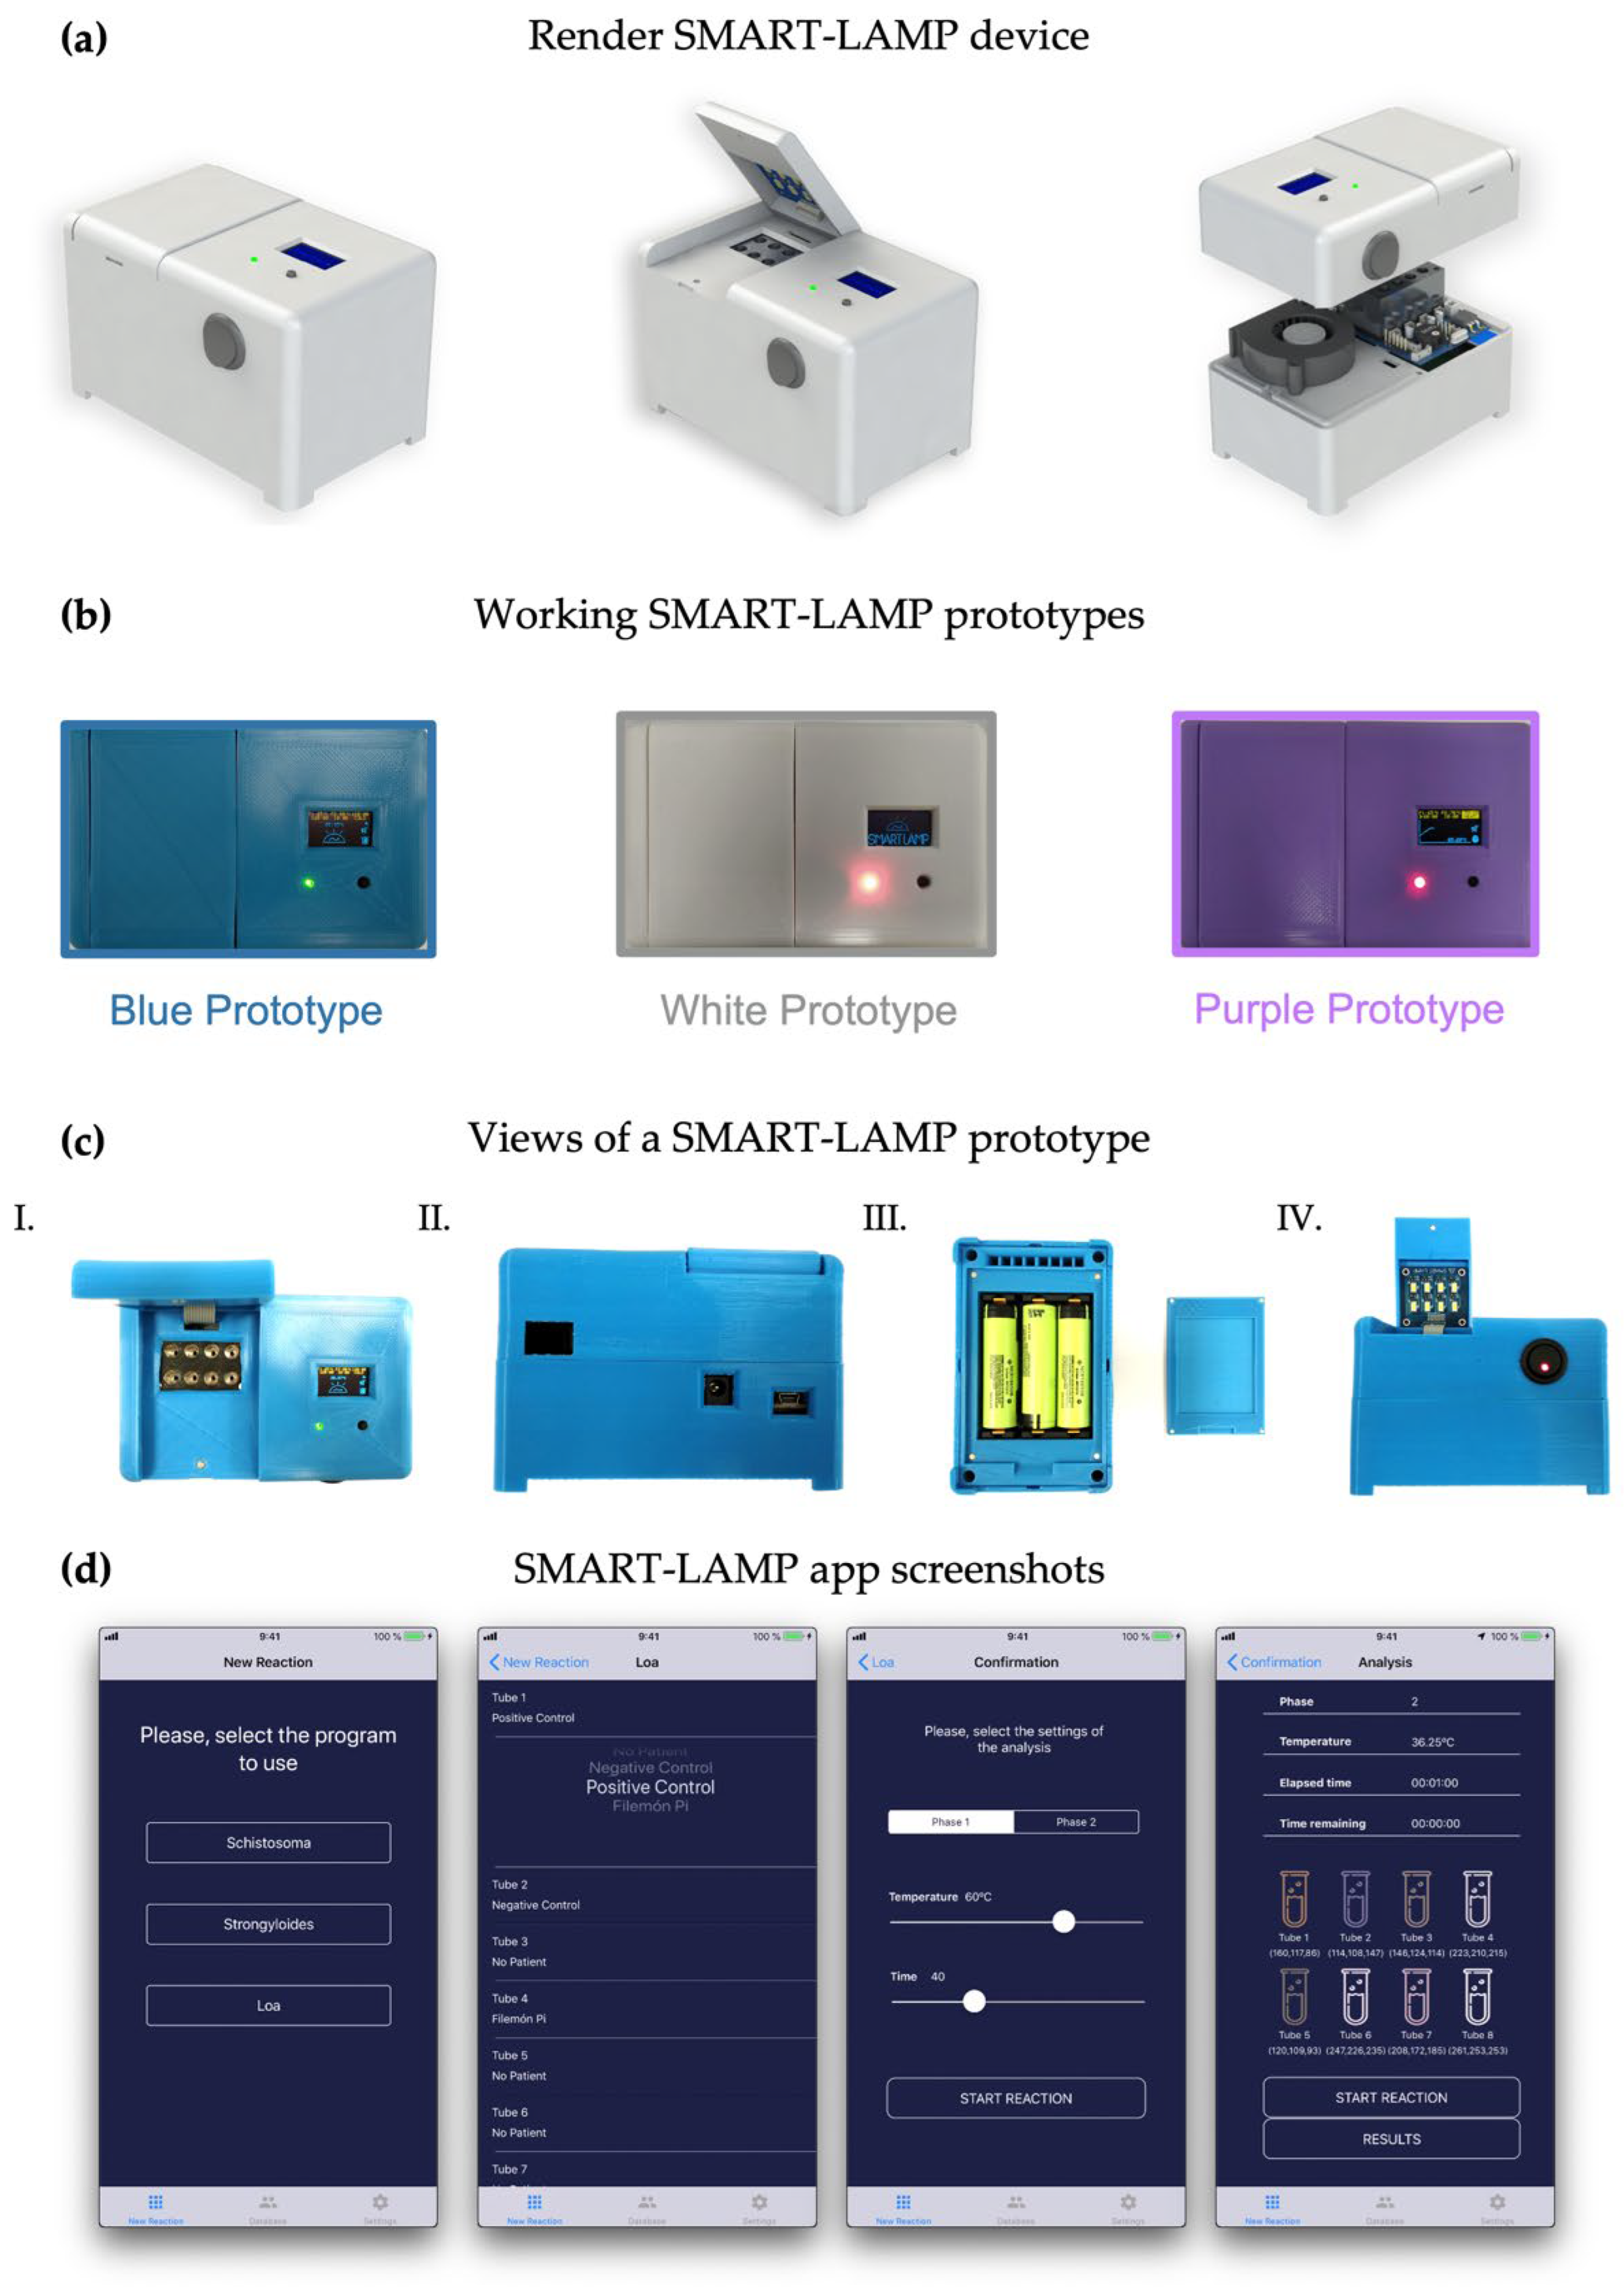
Abstract
:1. Introduction
2. Materials and Methods
2.1. Human Samples
2.2. DNA and RNA Purification
2.3. Fresh-LAMP and Fresh-RT-LAMP Assays
2.4. Dry-LAMP: Stabilization of LAMP Reaction Components for Ready-to-Use Tests
2.5. SMART-LAMP: Principal Modules and Characteristics
2.6. SMART-Lamp Assessment
2.6.1. Color Readout and Temperature Profile
2.6.2. Positive and Negative Predictive Values
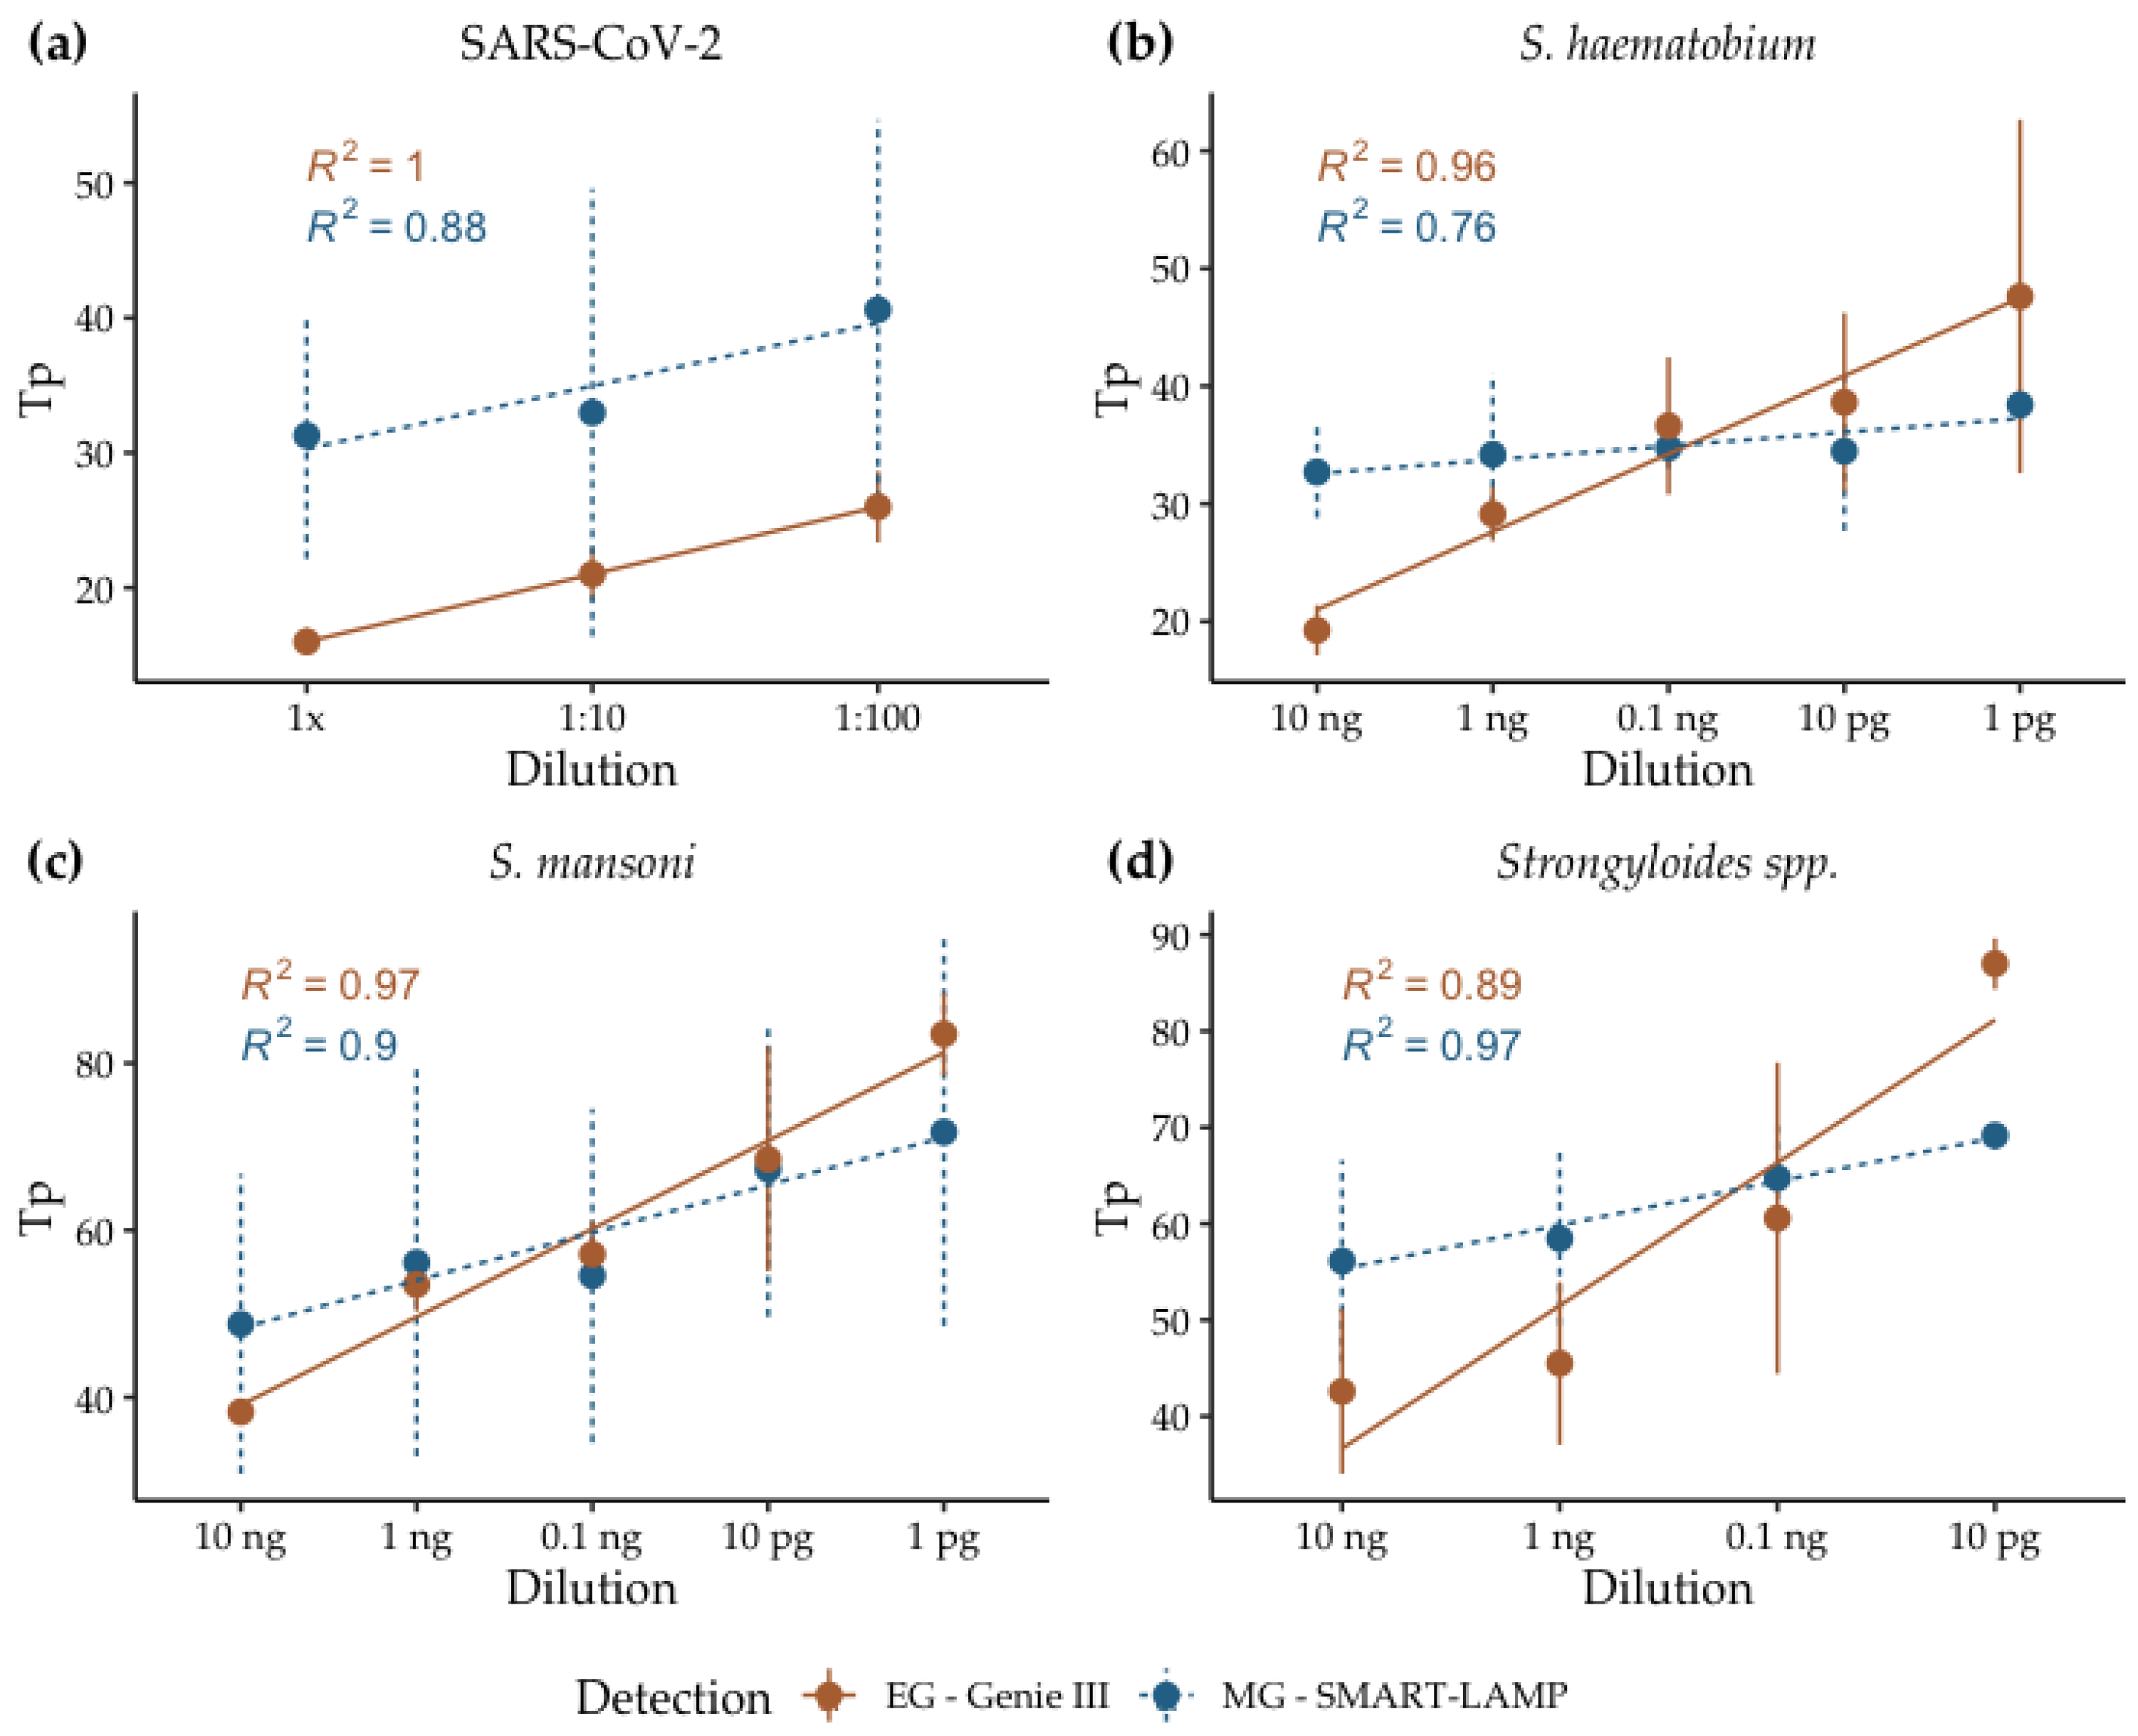
2.6.3. Analytical Sensitivity
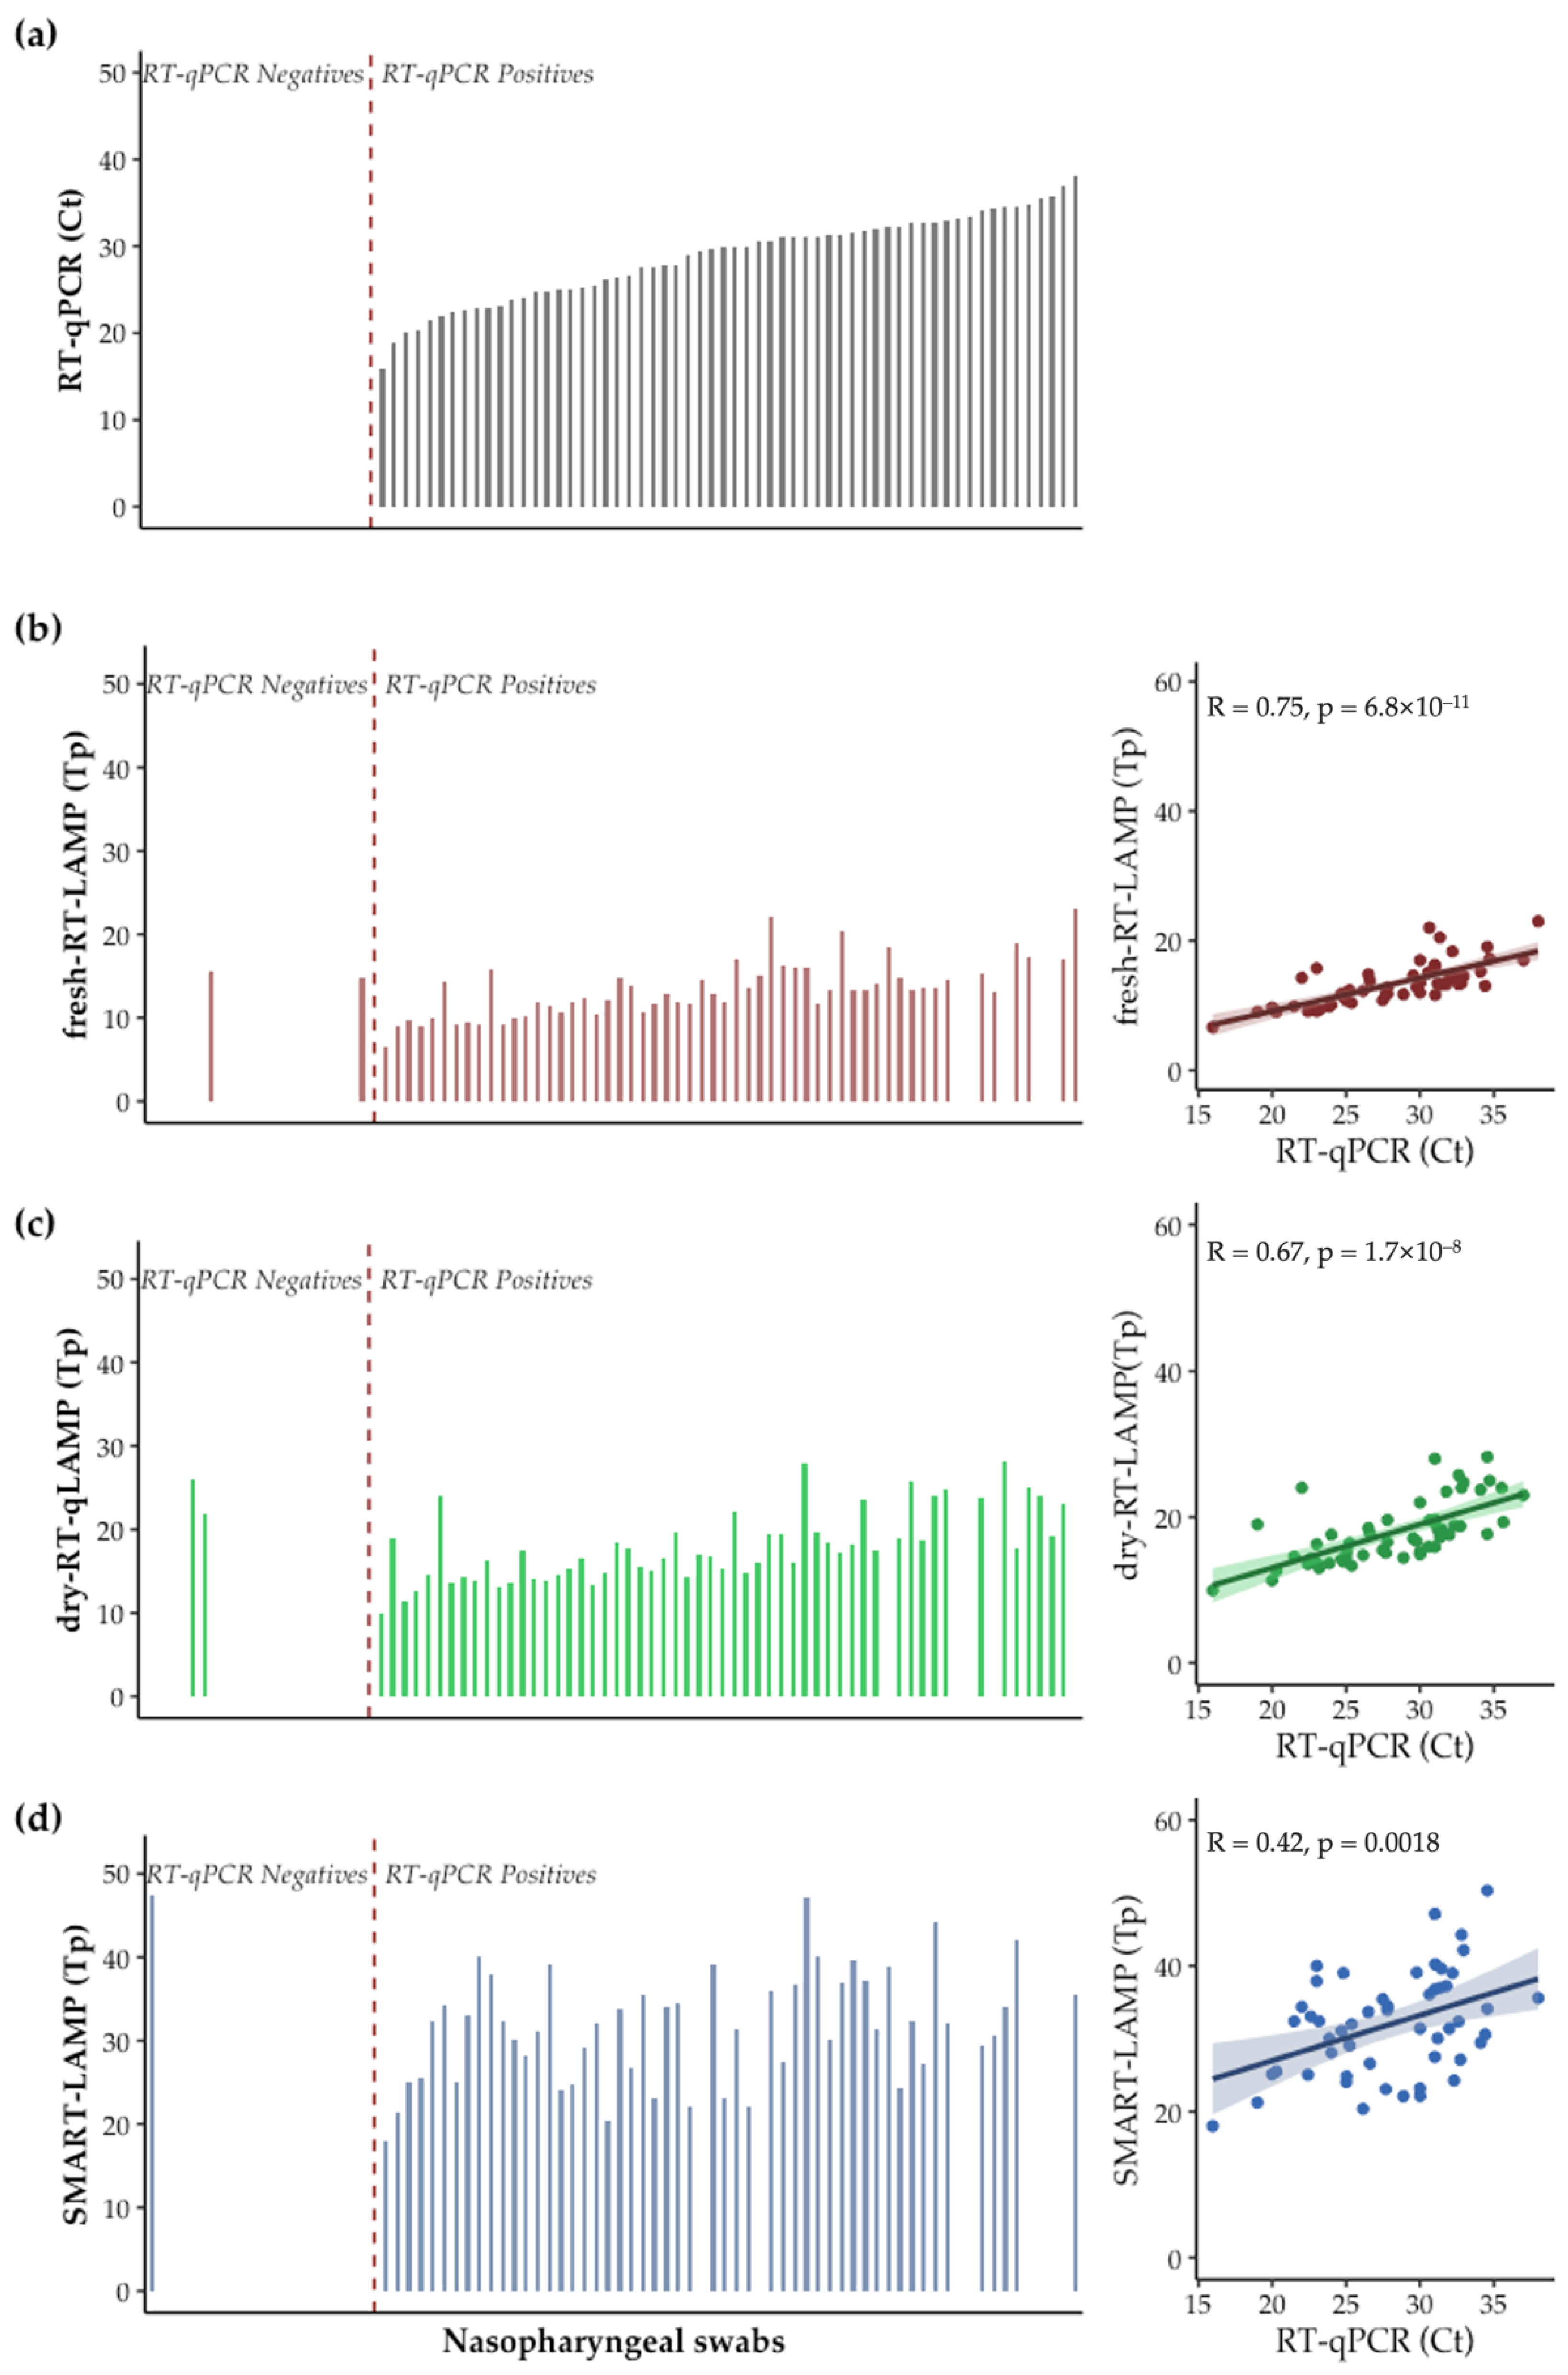
2.7. Proof of Concept: COVID-19 Patients Sample Analysis
2.8. Statistical Analysis
3. Results and Discussion
3.1. Device Design and Construction
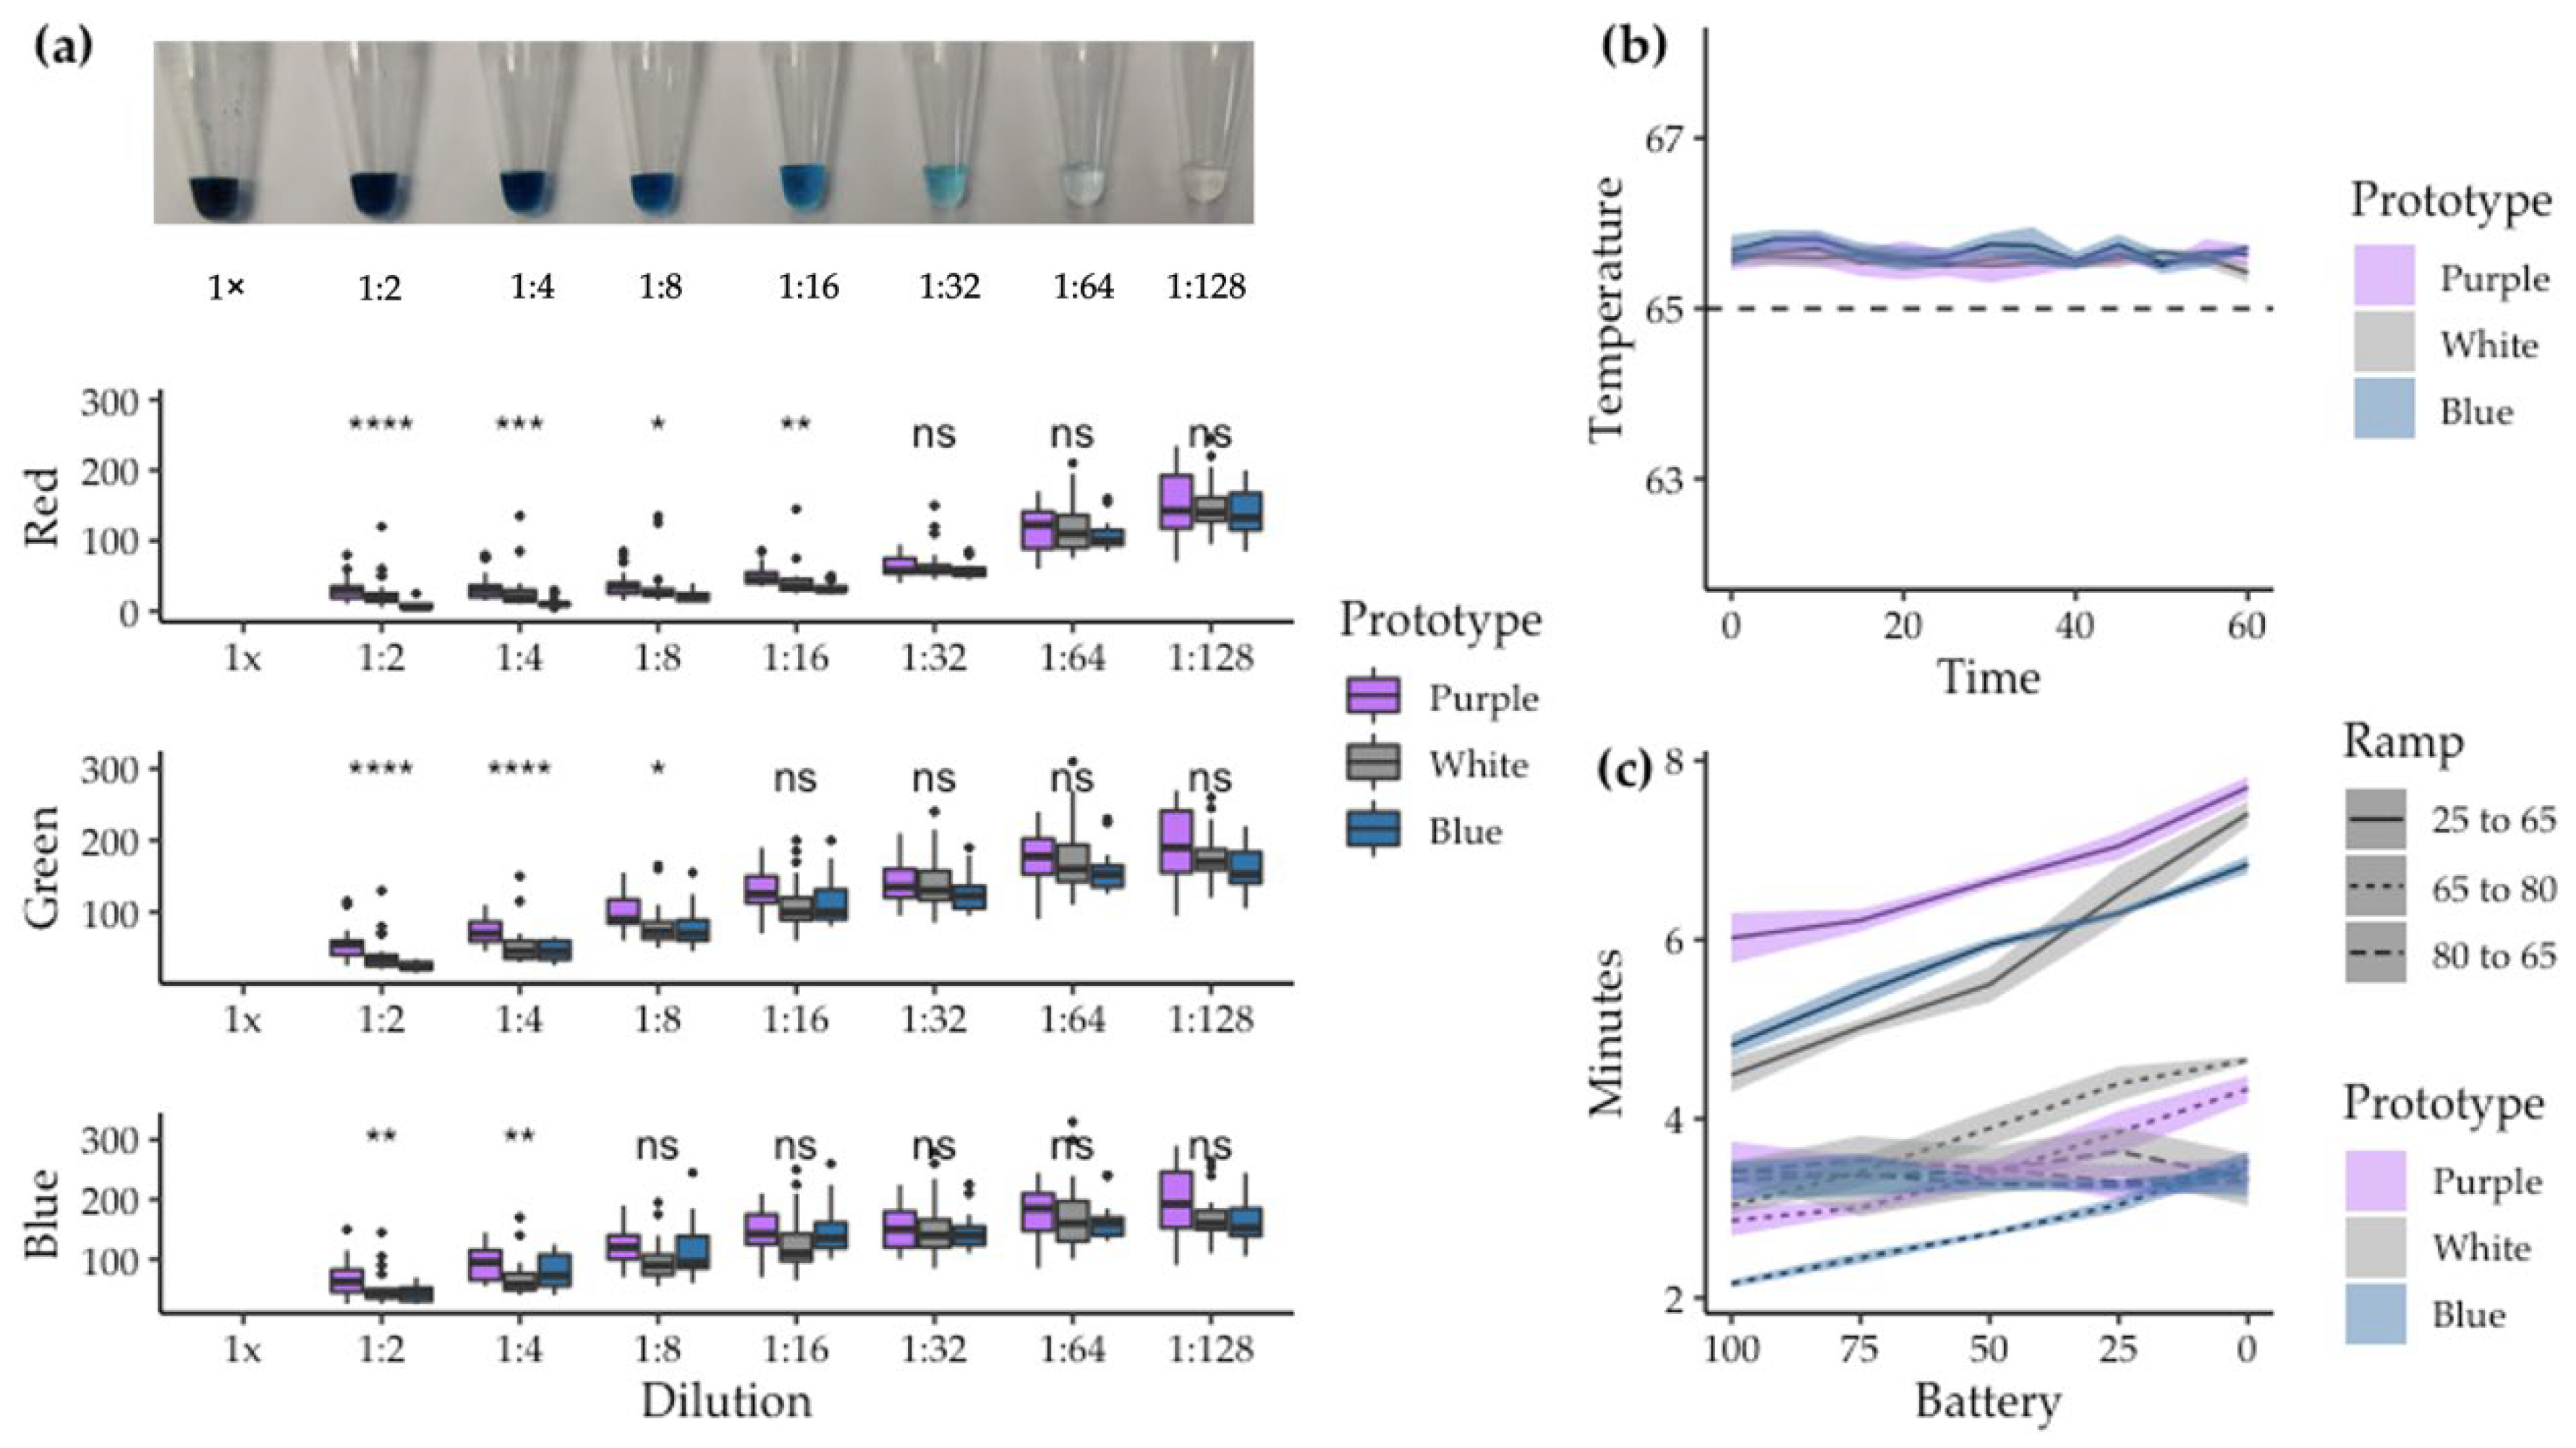
3.2. Color Readout and Temperature Profile Assessment of the SMART-LAMP
3.3. Positive and Negative Predictive Values of SMART-LAMP
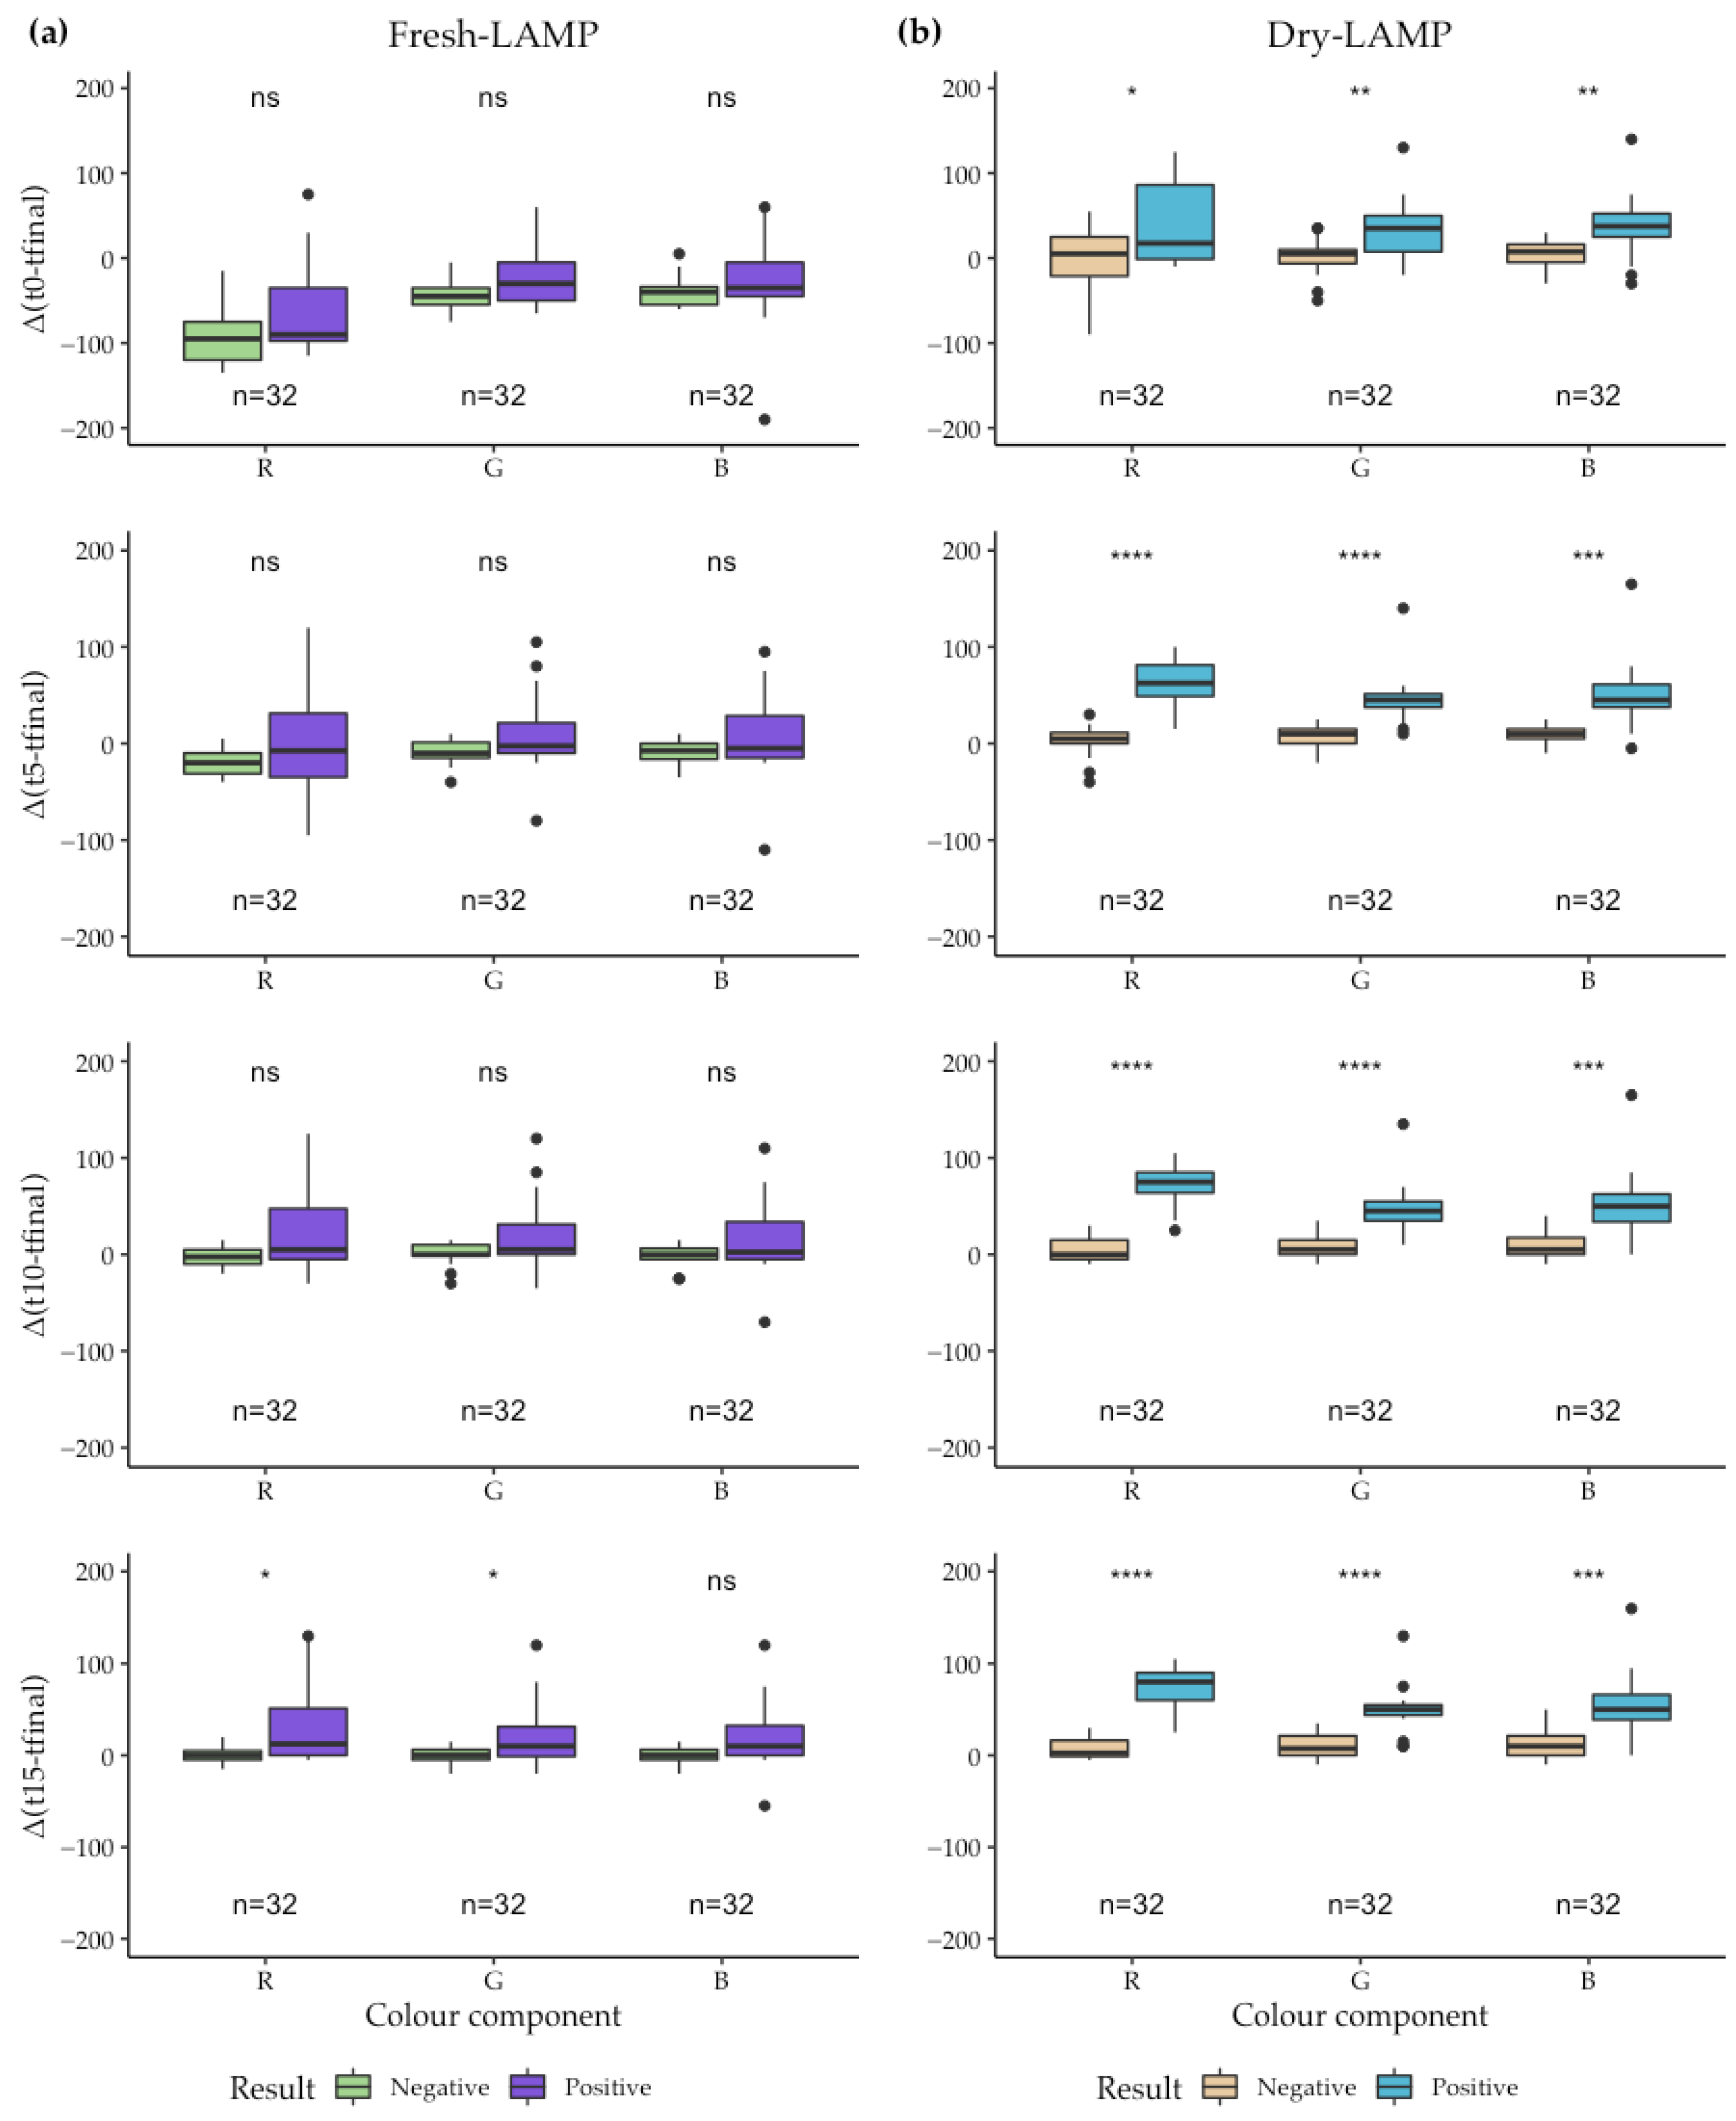
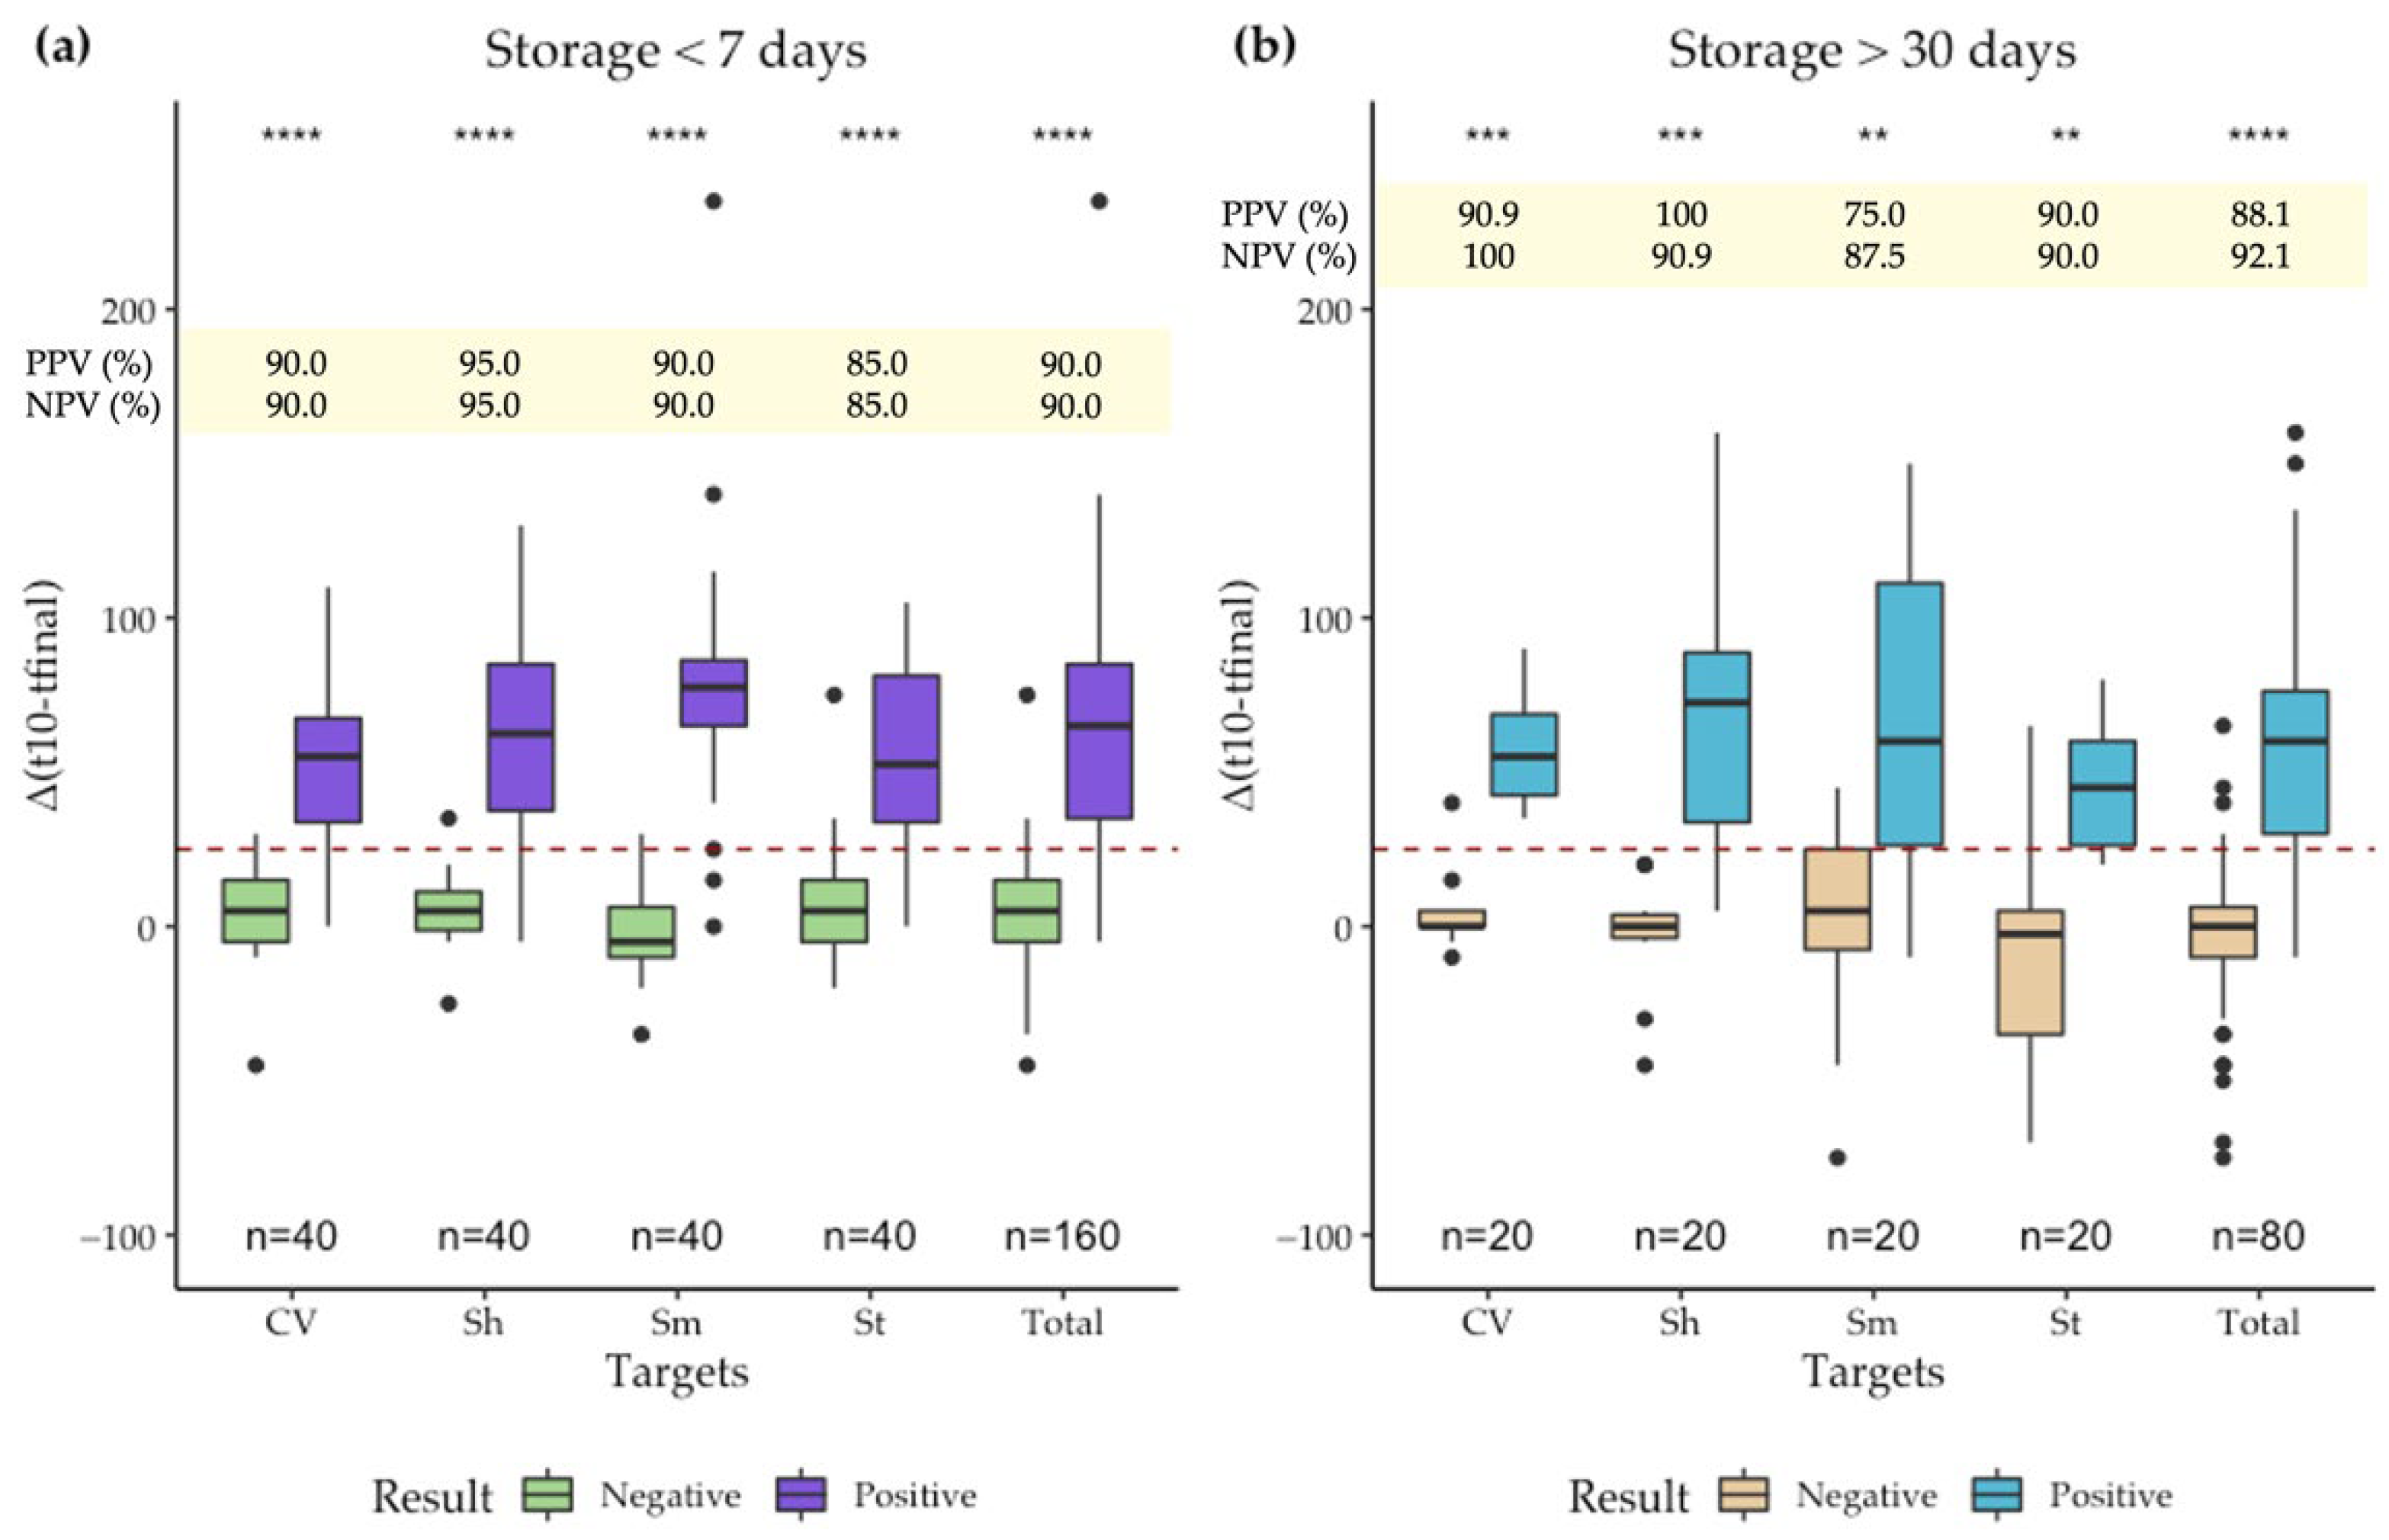
3.4. Analytical Sensitivity
3.5. Proof of Concept: COVID-19 Patients Sample Analysis
4. Conclusions
5. Patents
Supplementary Materials
Author Contributions
Funding
Institutional Review Board Statement
Informed Consent Statement
Data Availability Statement
Acknowledgments
Conflicts of Interest
References
- Daar, A.S.; Thorsteindottir, H.; Martin, D.K.; Smith, A.C.; Nast, S.; Singer, P.A. Top ten biotechnologies for improving health in developing countries. Nat. Genet. 2002, 32, 229–232. [Google Scholar] [CrossRef] [PubMed]
- Vashist, S.K. Point-of-care diagnostics: Recent advances and trends. Biosensors 2017, 7, 62. [Google Scholar] [CrossRef] [PubMed] [Green Version]
- Bharadwaj, M.; Bengtson, M.; Golverdingen, M.; Waling, L.; Dekker, C. Diagnosing point-of-care diagnostics for neglected tropical diseases. PLoS Negl. Trop. Dis. 2021, 15, e0009405. [Google Scholar] [CrossRef] [PubMed]
- Ritchie, H.; Mathieu, E.; Rodés-Guirao, L.; Appel, C.; Giattino, C.; Ortiz-Ospina, E.; Hasell, J.; Macdonald, B.; Beltekian, D.; Roser, M. Coronavirus Pandemic (COVID-19). Our World Data 2020. Available online: https://ourworldindata.org/coronavirus (accessed on 1 April 2022).
- Drain, P.K. Rapid Diagnostic Testing for SARS-CoV-2. N. Engl. J. Med. 2022, 386, 264–272. [Google Scholar] [CrossRef]
- Yeh, E.; Fu, C.; Hu, L.; Thakur, R.; Feng, J.; Lee, L.P. Self-powered integrated microfluidic point-of-care low-cost enabling ( SIMPLE ) chip. Sci. Adv. 2017, 3, e1501645. [Google Scholar] [CrossRef] [Green Version]
- Kettler, H.; White, K.; Hawkes, S. Mapping the Landscape of Diagnostics for Sexually Transmitted Infections: Key Findings and Recommandations; World Health Organization: Geneva, Switzerland, 2004; pp. 1–44. [Google Scholar]
- Land, K.J.; Boeras, D.I.; Chen, X.S.; Ramsay, A.R.; Peeling, R.W. REASSURED diagnostics to inform disease control strategies, strengthen health systems and improve patient outcomes. Nat. Microbiol. 2019, 4, 46–54. [Google Scholar] [CrossRef]
- Lisboa Bastos, M.; Tavaziva, G.; Abidi, S.K.; Campbell, J.R.; Haraoui, L.P.; Johnston, J.C.; Lan, Z.; Law, S.; MacLean, E.; Trajman, A.; et al. Diagnostic accuracy of serological tests for covid-19: Systematic review and meta-analysis. BMJ 2020, 370, m2516. [Google Scholar] [CrossRef]
- Notomi, T.; Okayama, H.; Masubuchi, H.; Yonekawa, T.; Watanabe, K.; Amino, N.; Hase, T. Loop-mediated isothermal amplification of DNA. Nucleic Acids Res. 2000, 28, e63. [Google Scholar] [CrossRef] [Green Version]
- Parida, M.; Posadas, G.; Inoue, S.; Hasebe, F.; Morita, K. Real-Time Reverse Transcription Loop-Mediated Isothermal Amplification for Rapid Detection of West Nile Virus Real-Time Reverse Transcription Loop-Mediated Isothermal Amplification for Rapid Detection of West Nile Virus. J. Clin. Microbiol. 2004, 257, 257–263. [Google Scholar] [CrossRef] [Green Version]
- García-Bernalt Diego, J.; Fernández-Soto, P.; Muro, A. LAMP in Neglected Tropical Diseases: A Focus on Parasites. Diagnostics 2021, 11, 521. [Google Scholar] [CrossRef] [PubMed]
- Ali, E.E.; Chew, L.; Yap, K.Y.L. Evolution and current status of mhealth research: A systematic review. BMJ Innov. 2016, 2, 33–40. [Google Scholar] [CrossRef]
- Wood, C.S.; Thomas, M.R.; Budd, J.; Mashamba-Thompson, T.P.; Herbst, K.; Pillay, D.; Peeling, R.W.; Johnson, A.M.; McKendry, R.A.; Stevens, M.M. Taking connected mobile-health diagnostics of infectious diseases to the field. Nature 2019, 566, 467–474. [Google Scholar] [CrossRef] [PubMed] [Green Version]
- GSM Association. Mobile economy. Gsma 2020, 2–62. [Google Scholar]
- Paul, R.; Ostermann, E.; Chen, Y.; Saville, A.C.; Yang, Y.; Gu, Z.; Whitfield, A.E.; Ristaino, J.B.; Wei, Q. Integrated microneedle-smartphone nucleic acid amplification platform for in-field diagnosis of plant diseases. Biosens. Bioelectron. 2021, 187, 113312. [Google Scholar] [CrossRef]
- Rodriguez-Manzano, J.; Malpartida-Cardenas, K.; Moser, N.; Pennisi, I.; Cavuto, M.; Miglietta, L.; Moniri, A.; Penn, R.; Satta, G.; Randell, P.; et al. Handheld point-of-care system for rapid detection of SARS-CoV-2 extracted RNA in under 20 min. ACS Cent. Sci. 2021, 7, 307–317. [Google Scholar] [CrossRef]
- Soares, R.R.G.; Akhtar, A.S.; Pinto, I.F.; Lapins, N.; Barrett, D.; Sandh, G.; Yin, X.; Pelechano, V.; Russom, A. Sample-to-answer COVID-19 nucleic acid testing using a low-cost centrifugal microfluidic platform with bead-based signal enhancement and smartphone read-out. Lab Chip 2021, 21, 2932–2944. [Google Scholar] [CrossRef]
- Xie, C.; Chen, S.; Zhang, L.; He, X.; Ma, Y.; Wu, H.; Zou, B.; Zhou, G. Multiplex detection of blood-borne pathogens on a self-driven microfluidic chip using loop-mediated isothermal amplification. Anal. Bioanal. Chem. 2021, 413, 2923–2931. [Google Scholar] [CrossRef]
- Yu, L.; Rodriguez-manzano, J.; Moser, N.; Moniri, A.; Malpartida-cardenas, K.; Fisher, M.C. Rapid Detection of Azole-Resistant Aspergillus fumigatus in Clinical and Environmental Isolates by Use of a Lab-on-a-Chip Diagnostic System. J. Clin. Microbiol. 2020, 58, e00843-20. [Google Scholar] [CrossRef]
- Priye, A.; Ball, C.S.; Meagher, R.J. Colorimetric-Luminance Readout for Quantitative Analysis of Fluorescence Signals with a Smartphone CMOS Sensor. Anal. Chem. 2018, 90, 12385–12389. [Google Scholar] [CrossRef]
- Nguyen, H.Q.; Nguyen, V.D.; Van Nguyen, H.; Seo, T.S. Quantification of colorimetric isothermal amplification on the smartphone and its open-source app for point-of-care pathogen detection. Sci. Rep. 2020, 10, 15123. [Google Scholar] [CrossRef] [PubMed]
- Nguyen, H.V.; Nguyen, V.D.; Liu, F.; Seo, T.S. An Integrated Smartphone-Based Genetic Analyzer for Qualitative and Quantitative Pathogen Detection. ACS Omega 2020, 5, 22208–22214. [Google Scholar] [CrossRef] [PubMed]
- Jayanath, N.Y.; Nguyen, L.T.; Vu, T.T.; Tran, L.D. Development of a portable electrochemical loop mediated isothermal amplification (LAMP) device for detection of hepatitis B virus. RSC Adv. 2018, 8, 34954–34959. [Google Scholar] [CrossRef] [PubMed] [Green Version]
- Yang, M.; Tang, Y.; Qi, L.; Zhang, S.; Liu, Y.; Lu, B.; Yu, J.; Zhu, K.; Li, B.; Du, Y. SARS-CoV-2 Point-of-Care (POC) Diagnosis Based on Commercial Pregnancy Test Strips and a Palm-Size Microfluidic Device. Anal. Chem. 2021, 93, 11956–11964. [Google Scholar] [CrossRef]
- Van Nguyen, H.; Phan, V.M.; Seo, T.S. A portable centrifugal genetic analyzer for multiplex detection of feline upper respiratory tract disease pathogens. Biosens. Bioelectron. 2021, 193, 113546. [Google Scholar] [CrossRef] [PubMed]
- Nayak, S.; Blumenfeld, N.R.; Laksanasopin, T.; Sia, S.K. Point-of-Care Diagnostics: Recent Developments in a Connected Age. Anal. Chem. 2017, 89, 102–123. [Google Scholar] [CrossRef] [Green Version]
- Arshavsky-Graham, S.; Segal, E. Lab-on-a-Chip Devices for Point-of-Care Medical Diagnostics. In Advances in Biochemical Engineering/Biotechnology; Springer: Berlin/Heidelberg, Germany, 2020. [Google Scholar]
- Fernández-Soto, P.; Gandasegui Arahuetes, J.; Sánchez Hernández, A.; López Abán, J.; Vicente Santiago, B.; Muro, A. A Loop-Mediated Isothermal Amplification (LAMP) Assay for Early Detection of Schistosoma mansoni in Stool Samples: A Diagnostic Approach in a Murine Model. PLoS Negl. Trop. Dis. 2014, 8, e3126. [Google Scholar] [CrossRef] [Green Version]
- Gandasegui, J.; Fernández-Soto, P.; Carranza-Rodríguez, C.; Pérez-Arellano, J.L.; Vicente, B.; López-Abán, J.; Muro, A. The rapid-heat LAMPellet method: A potential diagnostic method for human urogenital schistosomiasis. PLoS Negl. Trop. Dis. 2015, 9, e0003963. [Google Scholar] [CrossRef] [Green Version]
- Fernández-Soto, P.; Sánchez-Hernández, A.; Gandasegui, J.; Bajo Santos, C.; López-Abán, J.; Saugar, J.M.; Rodríguez, E.; Vicente, B.; Muro, A. Strong-LAMP: A LAMP Assay for Strongyloides spp. Detection in Stool and Urine Samples. Towards the Diagnosis of Human Strongyloidiasis Starting from a Rodent Model. PLoS Negl. Trop. Dis. 2016, 10, e0004836. [Google Scholar] [CrossRef]
- García-Bernalt Diego, J.; Fernández-Soto, P.; Domínguez-Gil, M.; Belhassen-García, M.; Bellido, J.L.M.; Muro, A. A Simple, Affordable, Rapid, Stabilized, Colorimetric, Versatile RT-LAMP Assay to Detect SARS-CoV-2. Diagnostics 2021, 11, 438. [Google Scholar] [CrossRef]
- García-Bernalt Diego, J.; Fernández-Soto, P.; Crego-Vicente, B.; Alonso-Castrillejo, S.; Febrer-Sendra, B.; Gómez-Sánchez, A.; Vicente, B.; López-Abán, J.; Muro, A. Progress in loop-mediated isothermal amplification assay for detection of Schistosoma mansoni DNA: Towards a ready-to-use test. Sci. Rep. 2019, 9, 14744. [Google Scholar] [CrossRef] [PubMed]
- Ang, K.H.; Chong, G.; Li, Y. PID control system analysis, design, and technology. IEEE Trans. Control Syst. Technol. 2005, 13, 559–576. [Google Scholar] [CrossRef] [Green Version]
- Beauregard, B. Arduino PID Library—Version 1.2.1. Available online: https://github.com/br3ttb/Arduino-PID-Library (accessed on 7 June 2022).
- Francek, P.; Piljic, I.; Dragic, L.; Mlinanc, H.; Kovac, M.; Gvozdanovic, D. Overcoming E-health interoperability obstacles: Integrating PHR and EHR using HL7 CCD. In Proceedings of the 57th International Symposium ELMAR (ELMAR), Zadar, Croatia, 28–30 September 2015; pp. 73–76. [Google Scholar] [CrossRef]
- Tsiftes, N.; Dunkels, A. A database in every sensor. In Proceedings of the 9th ACM Conference on Embedded Networked Sensor Systems, Seattle, WA, USA, 1–4 November 2011; pp. 316–329. [Google Scholar] [CrossRef]
- Tarascon, J.M.; Armand, M. Issues and challenges facing rechargeable lithium batteries. Nature 2001, 414, 359–367. [Google Scholar] [CrossRef] [PubMed]
- Wan, L.; Gao, J.; Chen, T.; Dong, C.; Li, H.; Wen, Y.Z.; Lun, Z.R.; Jia, Y.; Mak, P.I.; Martins, R.P. LampPort: A handheld digital microfluidic device for loop-mediated isothermal amplification (LAMP). Biomed. Microdevices 2019, 21, 9. [Google Scholar] [CrossRef] [PubMed]
- Dincer, C.; Bruch, R.; Kling, A.; Dittrich, P.S.; Urban, G.A. Multiplexed Point-of-Care Testing—xPOCT. Trends Biotechnol. 2017, 35, 728–742. [Google Scholar] [CrossRef] [Green Version]
- Chen, H.; Liu, K.; Li, Z.; Wang, P. Point of care testing for infectious diseases. Clin. Chim. Acta 2019, 493, 138–147. [Google Scholar] [CrossRef]
- Lee, C.-S. Grand Challenges in Microfluidics: A Call for Biological and Engineering Action. Front. Sens. 2020, 1, 583035. [Google Scholar] [CrossRef]
- Hayashida, K.; Kajino, K.; Hachaambwa, L.; Namangala, B.; Sugimoto, C. Direct Blood Dry LAMP: A Rapid, Stable, and Easy Diagnostic Tool for Human African Trypanosomiasis. PLoS Negl. Trop. Dis. 2015, 9, e0003578. [Google Scholar] [CrossRef]
- Leung, V.; Brooks, M.; Emerson, S.; Ali, M.M.; Filipe, C.D.M. Ready-to-use Thermally Stable Mastermix Pills for Molecular Biology Applications. Biotechnol. Prog. 2019, 35, e2764. [Google Scholar] [CrossRef]
- Xu, J.; Wang, J.; Zhong, Z.; Su, X.; Yang, K.; Chen, Z.; Zhang, D.; Li, T.; Wang, Y.; Zhang, S.; et al. Room-temperature-storable PCR mixes for SARS-CoV-2 detection. J. Clean. Prod. 2020, 84, 73–78. [Google Scholar] [CrossRef]
- Malferrari, M.; Francia, F.; Venturoli, G. Retardation of Protein Dynamics by Trehalose in Dehydrated Systems of Photosynthetic Reaction Centers. Insights from Electron Transfer and Thermal Denaturation Kinetics. J. Phys. Chem. B 2015, 119, 13600–13618. [Google Scholar] [CrossRef] [PubMed]
- Malferrari, M.; Savitsky, A.; Lubitz, W.; Möbius, K.; Venturoli, G. Protein Immobilization Capabilities of Sucrose and Trehalose Glasses: The Effect of Protein/Sugar Concentration Unraveled by High-Field EPR. J. Phys. Chem. Lett. 2016, 7, 4871–4877. [Google Scholar] [CrossRef] [PubMed]
- Fischbach, J.; Xander, N.C.; Frohme, M.; Glökler, J.F. Shining a light on LAMP assays- a comparison of LAMP visualization methods including the novel use of berberine. Biotechniques 2015, 58, 189–194. [Google Scholar] [CrossRef] [Green Version]
- Lucchi, N.W.; Ljolje, D.; Silva-Flannery, L.; Udhayakumar, V. Use of malachite green-loop mediated isothermal amplification for detection of plasmodium spp. parasites. PLoS ONE 2016, 11, e0151437. [Google Scholar] [CrossRef] [PubMed] [Green Version]
- Sun, Y.; Quyen, T.L.; Hung, T.Q.; Chin, W.H.; Wolff, A.; Bang, D.D. A lab-on-a-chip system with integrated sample preparation and loop-mediated isothermal amplification for rapid and quantitative detection of Salmonella spp. in food samples. Lab Chip 2015, 15, 1898–1904. [Google Scholar] [CrossRef] [Green Version]
- Evans, R.W. Diagnostic Testing for SARS-CoV-2; World Health Organization: Geneva, Switzerland, 2020. [Google Scholar]
- NZYTech. SARS-CoV-2 One-Step RT-PCR Kit, IVD. Instructions for Use; NZYtech: Lisbon, Portugal, 2021. [Google Scholar]
- Bokelmann, L.; Nickel, O.; Maricic, T.; Pääbo, S.; Meyer, M.; Borte, S.; Riesenberg, S. Point-of-care bulk testing for SARS-CoV-2 by combining hybridization capture with improved colorimetric LAMP. Nat. Commun. 2021, 12, 1467. [Google Scholar] [CrossRef]
- Chen, Y.; Shi, Y.; Chen, Y.; Yang, Z.; Wu, H.; Zhou, Z.; Li, J. Contamination-free visual detection of SARS-CoV-2 with CRISPR/Cas12a: A promising method in the point-of-care detection. Biosens. Bioelectron. 2020, 169, 112642. [Google Scholar] [CrossRef]
- Diaz, L.M.; Johnson, B.E.; Jenkins, D.M. Real-time optical analysis of a colorimetric LAMP assay for SARS-CoV-2 in saliva with a handheld instrument improves accuracy compared with endpoint assessment. J. Biomol. Tech. 2021, 32, 158–171. [Google Scholar] [CrossRef]
- Papadakis, G.; Pantazis, A.K.; Fikas, N.; Chatziioannidou, S.; Tsiakalou, V.; Michaelidou, K.; Pogka, V.; Megariti, M.; Vardaki, M.; Giarentis, K.; et al. Portable real-time colorimetric LAMP-device for rapid quantitative detection of nucleic acids in crude samples. Sci. Rep. 2022, 12, 3775. [Google Scholar] [CrossRef]
- Mohammed, M.I.; Haswell, S.; Gibson, I. Lab-on-a-chip or Chip-in-a-lab: Challenges of Commercialization Lost in Translation. Procedia Technol. 2015, 20, 54–59. [Google Scholar] [CrossRef] [Green Version]
- Paul, R.; Ostermann, E.; Wei, Q. Advances in point-of-care nucleic acid extraction technologies for rapid diagnosis of human and plant diseases. Biosens. Bioelectron. 2020, 169, 112592. [Google Scholar] [CrossRef] [PubMed]
- Sachdeva, S.; Davis, R.W.; Saha, A.K. Microfluidic Point-of-Care Testing: Commercial Landscape and Future Directions. Front. Bioeng. Biotechnol. 2021, 8, 602659. [Google Scholar] [CrossRef] [PubMed]
- Soroka, M.; Wasowicz, B.; Rymaszewska, A. Loop-mediated isothermal amplification (Lamp): The better sibling of pcr? Cells 2021, 10, 1931. [Google Scholar] [CrossRef] [PubMed]


Publisher’s Note: MDPI stays neutral with regard to jurisdictional claims in published maps and institutional affiliations. |
© 2022 by the authors. Licensee MDPI, Basel, Switzerland. This article is an open access article distributed under the terms and conditions of the Creative Commons Attribution (CC BY) license (https://creativecommons.org/licenses/by/4.0/).
Share and Cite
García-Bernalt Diego, J.; Fernández-Soto, P.; Márquez-Sánchez, S.; Santos Santos, D.; Febrer-Sendra, B.; Crego-Vicente, B.; Muñoz-Bellido, J.L.; Belhassen-García, M.; Corchado Rodríguez, J.M.; Muro, A. SMART-LAMP: A Smartphone-Operated Handheld Device for Real-Time Colorimetric Point-of-Care Diagnosis of Infectious Diseases via Loop-Mediated Isothermal Amplification. Biosensors 2022, 12, 424. https://doi.org/10.3390/bios12060424
García-Bernalt Diego J, Fernández-Soto P, Márquez-Sánchez S, Santos Santos D, Febrer-Sendra B, Crego-Vicente B, Muñoz-Bellido JL, Belhassen-García M, Corchado Rodríguez JM, Muro A. SMART-LAMP: A Smartphone-Operated Handheld Device for Real-Time Colorimetric Point-of-Care Diagnosis of Infectious Diseases via Loop-Mediated Isothermal Amplification. Biosensors. 2022; 12(6):424. https://doi.org/10.3390/bios12060424
Chicago/Turabian StyleGarcía-Bernalt Diego, Juan, Pedro Fernández-Soto, Sergio Márquez-Sánchez, Daniel Santos Santos, Begoña Febrer-Sendra, Beatriz Crego-Vicente, Juan Luis Muñoz-Bellido, Moncef Belhassen-García, Juan M. Corchado Rodríguez, and Antonio Muro. 2022. "SMART-LAMP: A Smartphone-Operated Handheld Device for Real-Time Colorimetric Point-of-Care Diagnosis of Infectious Diseases via Loop-Mediated Isothermal Amplification" Biosensors 12, no. 6: 424. https://doi.org/10.3390/bios12060424