Intelligent Classification Technique of Hand Motor Imagery Using EEG Beta Rebound Follow-Up Pattern


Abstract
:
1. Introduction
2. Materials and Methods
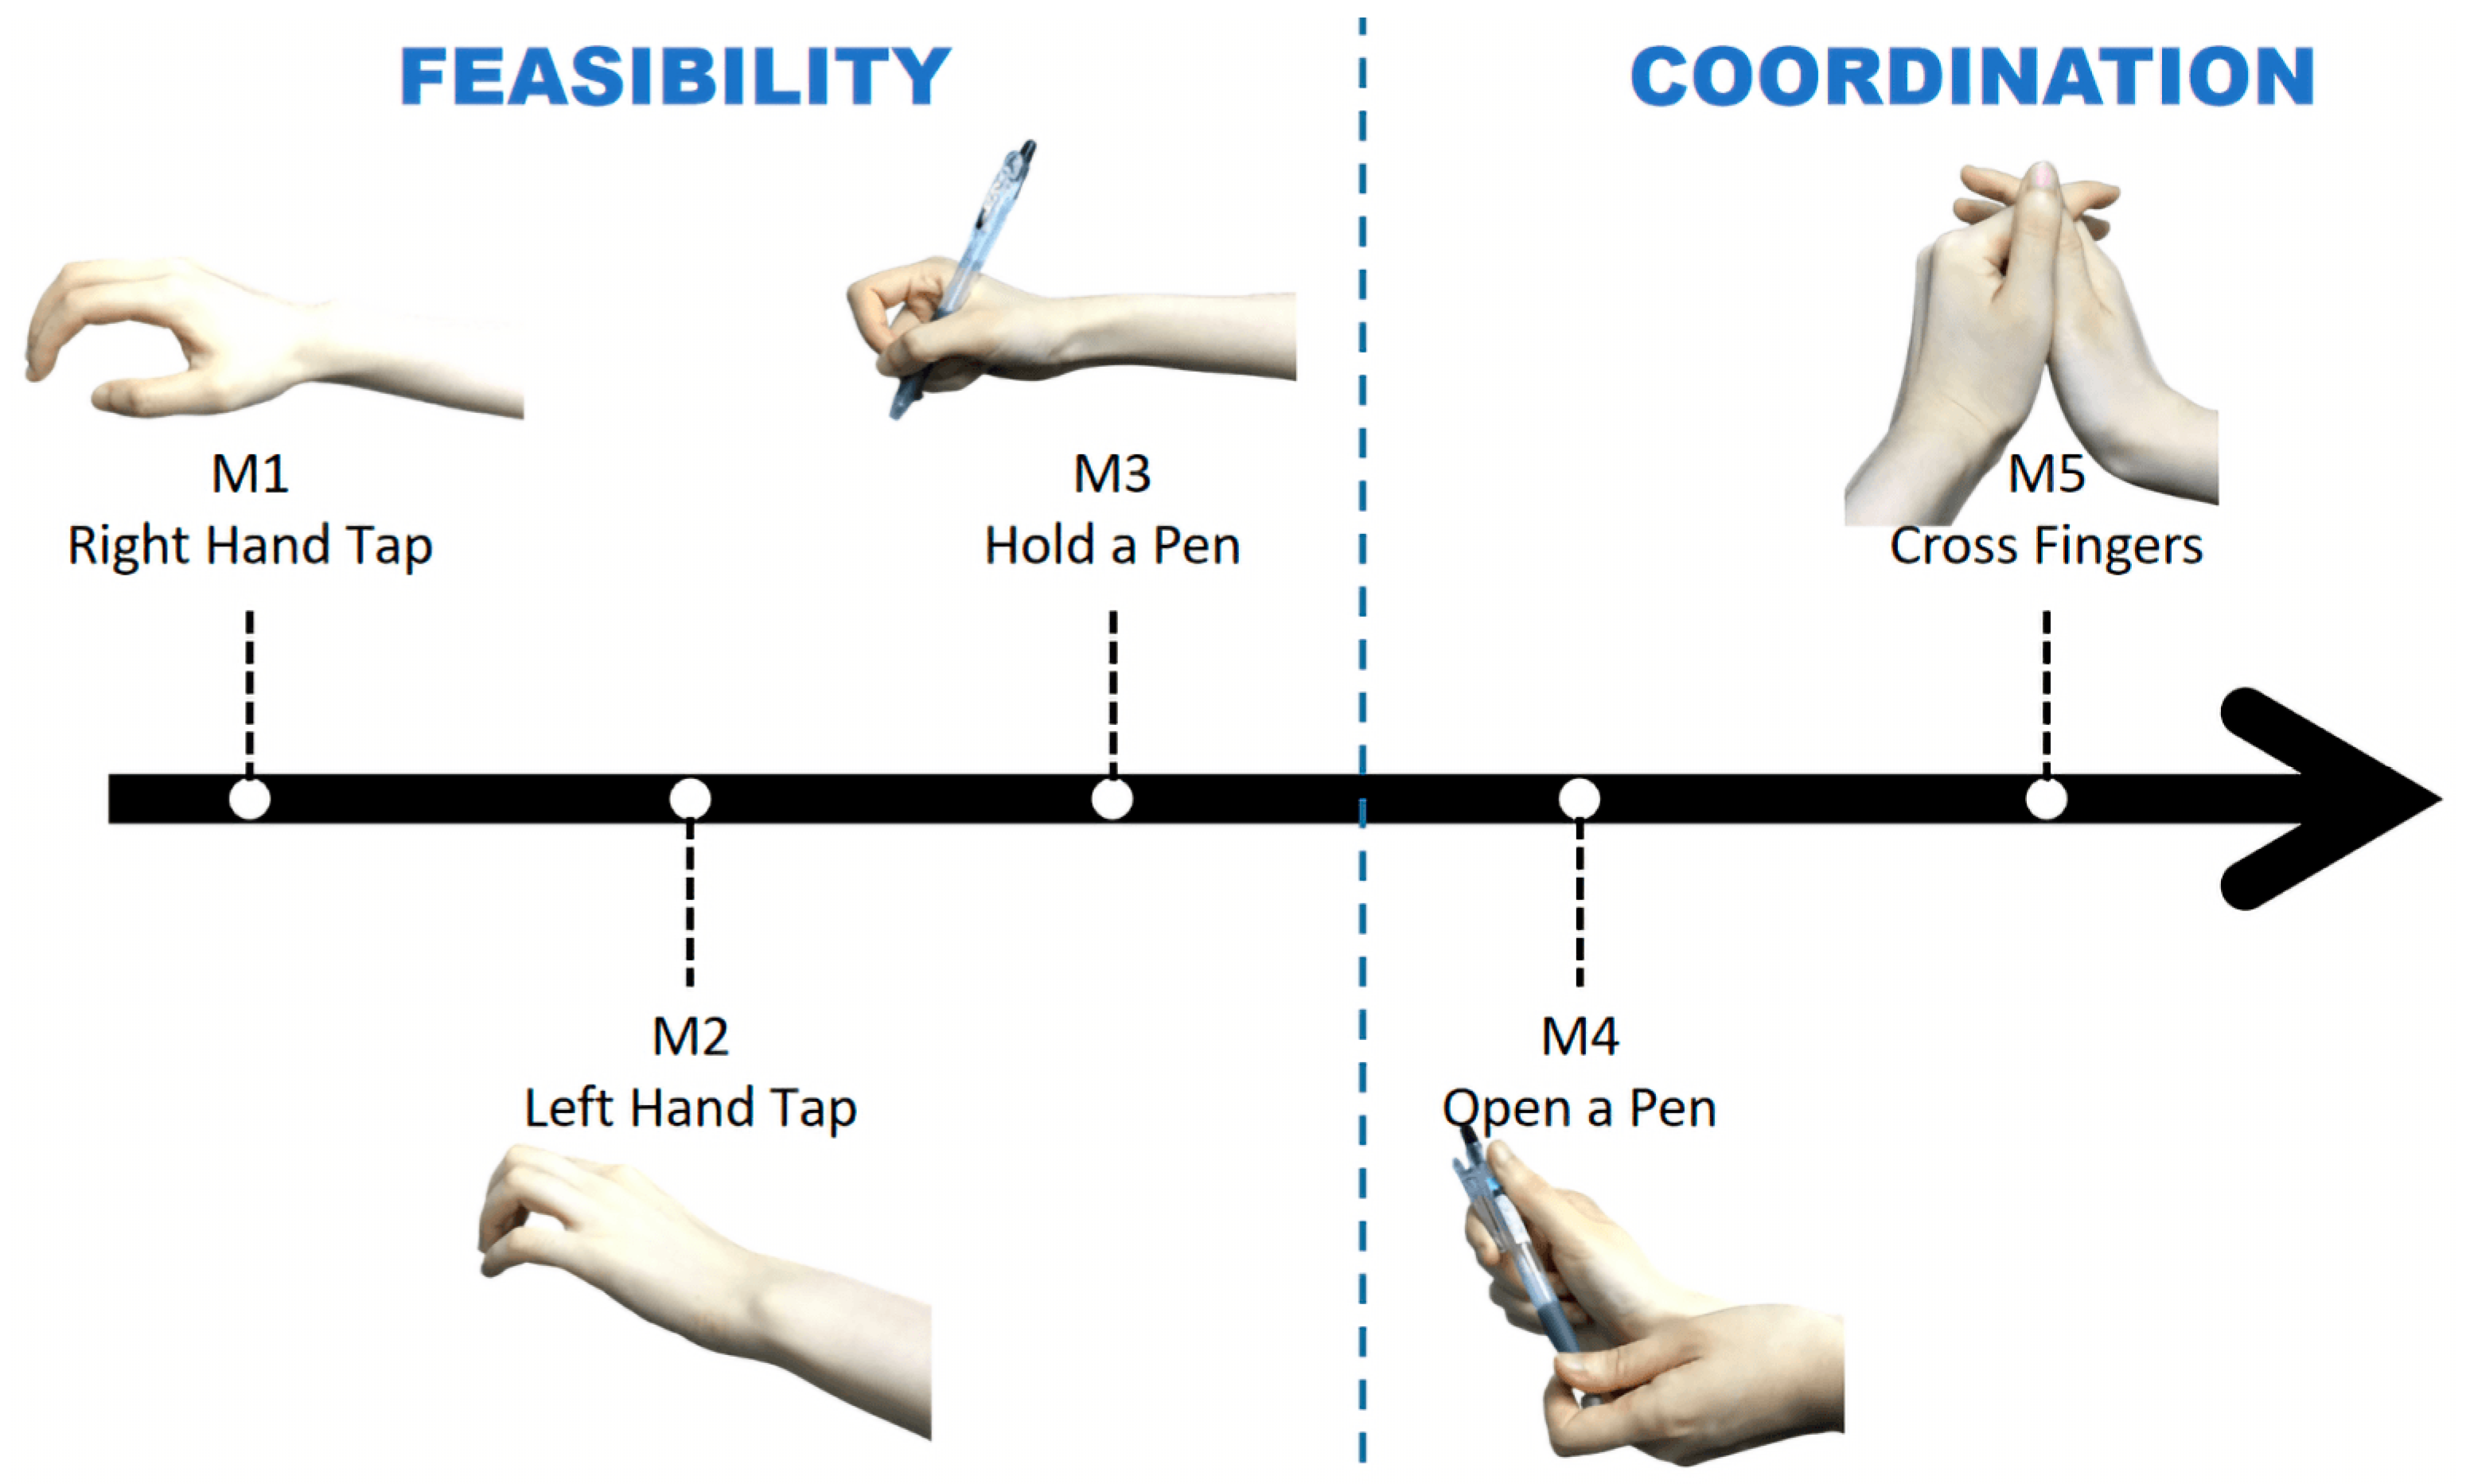
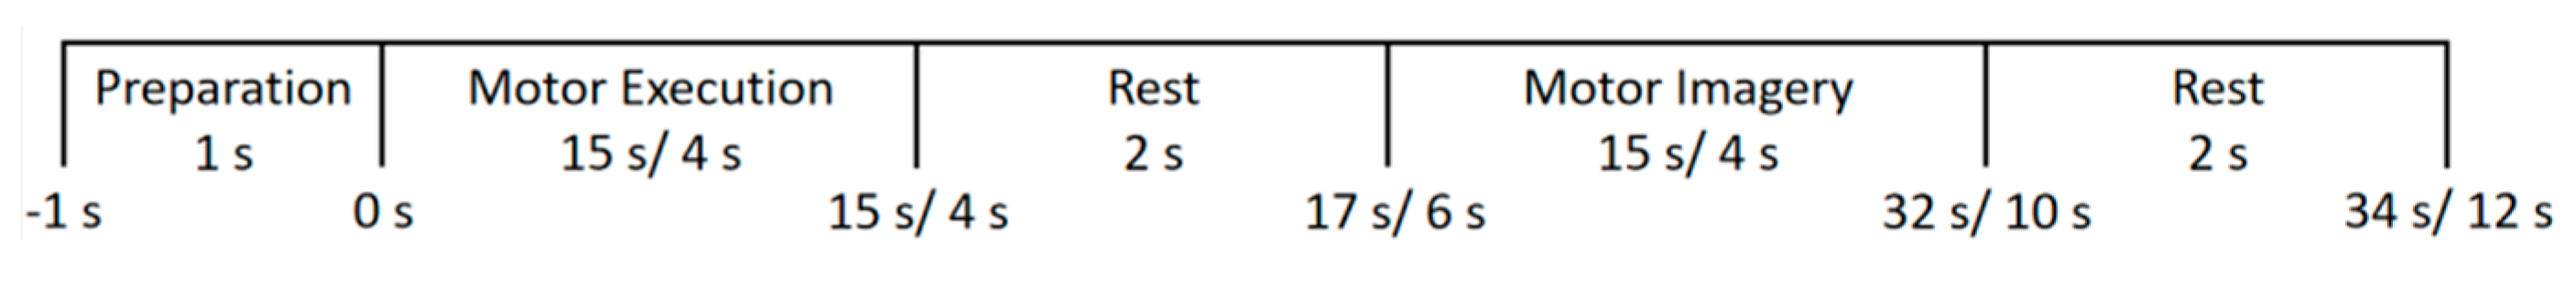
2.1. Experiments
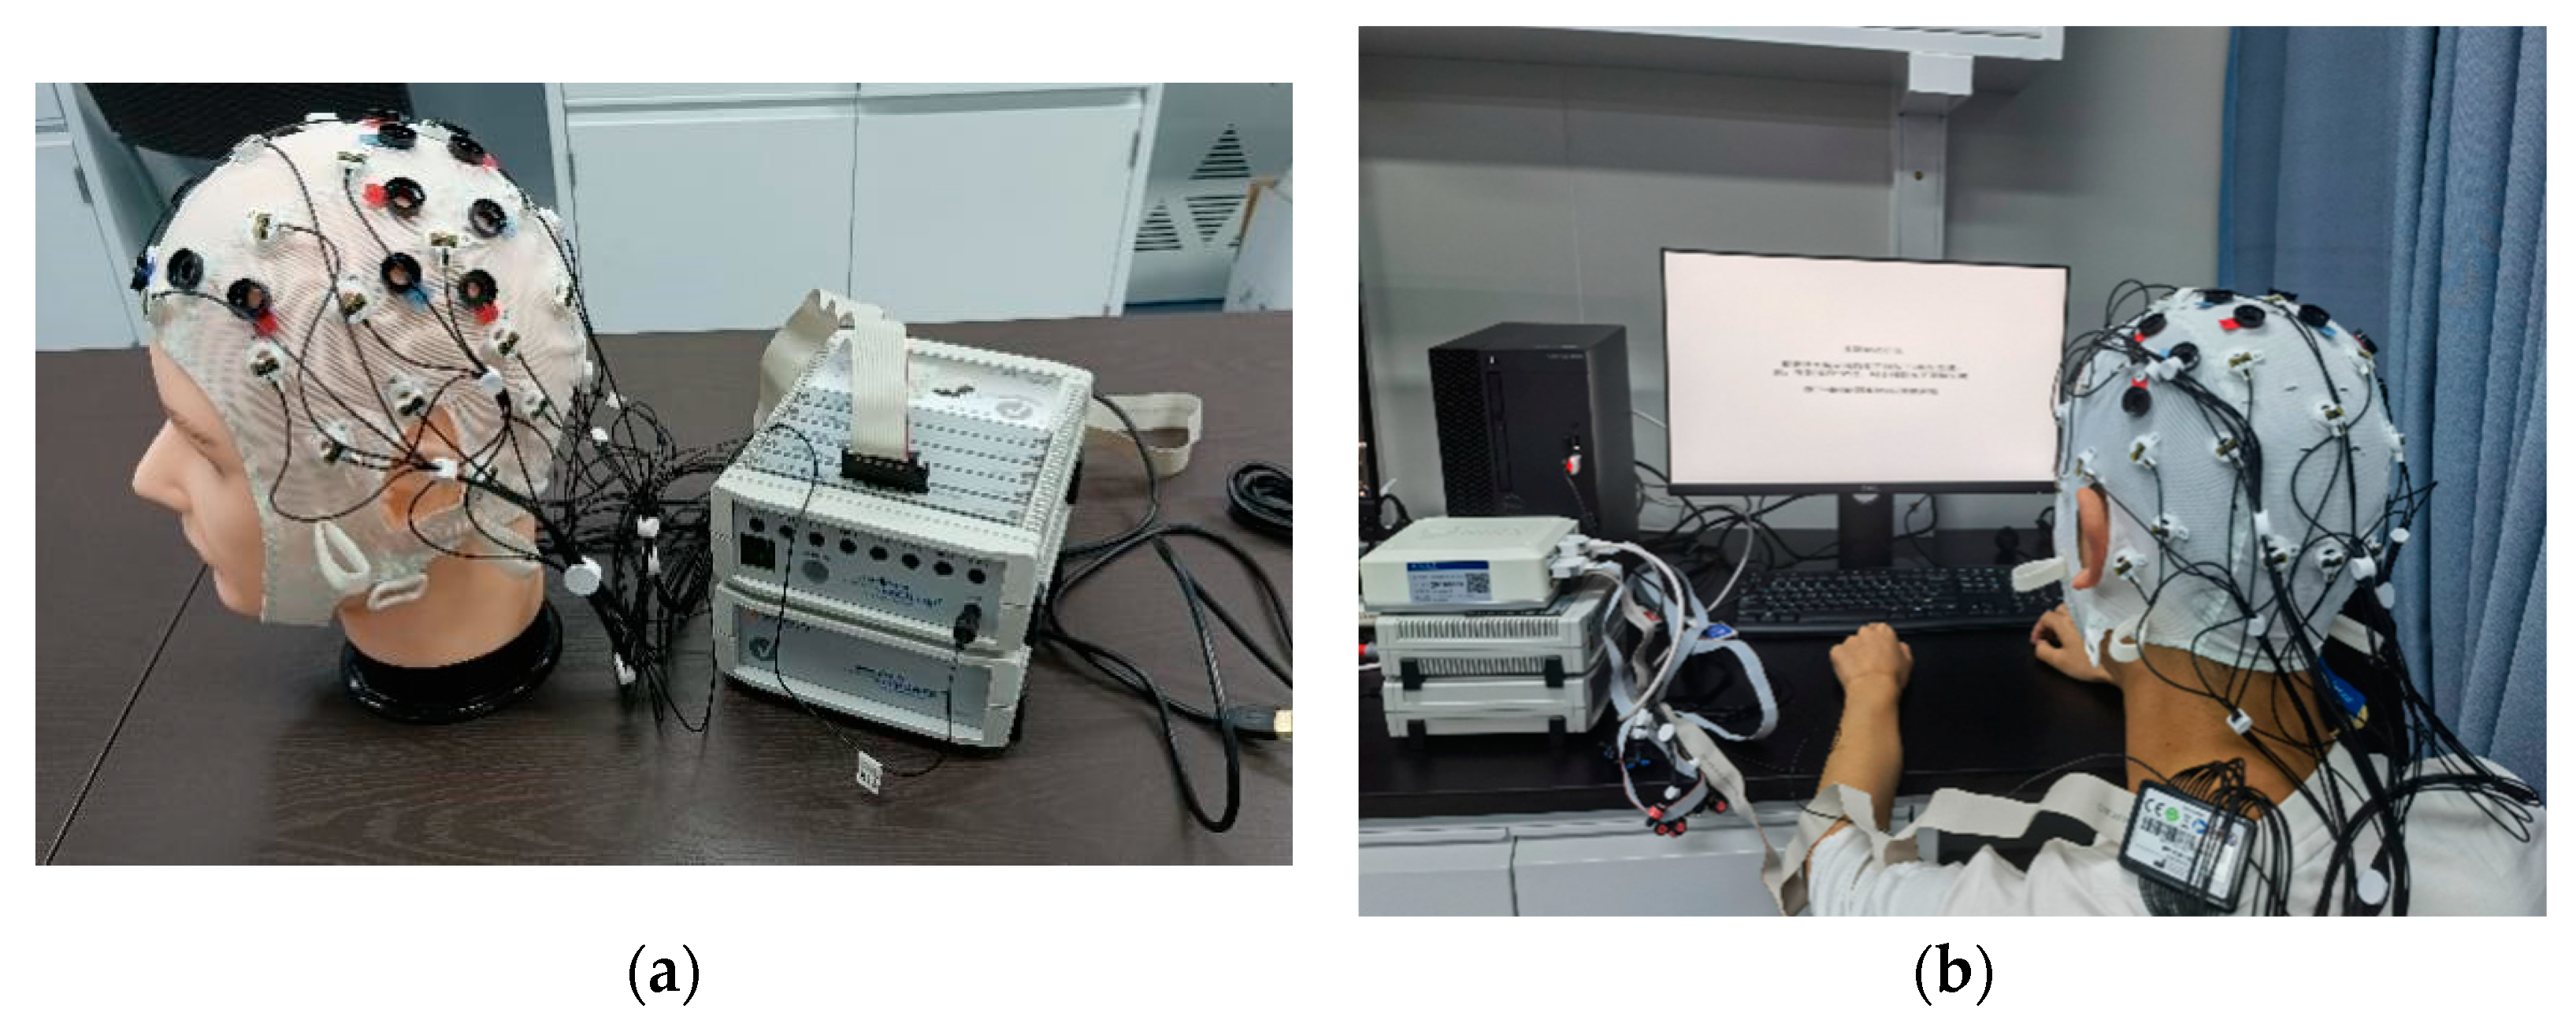
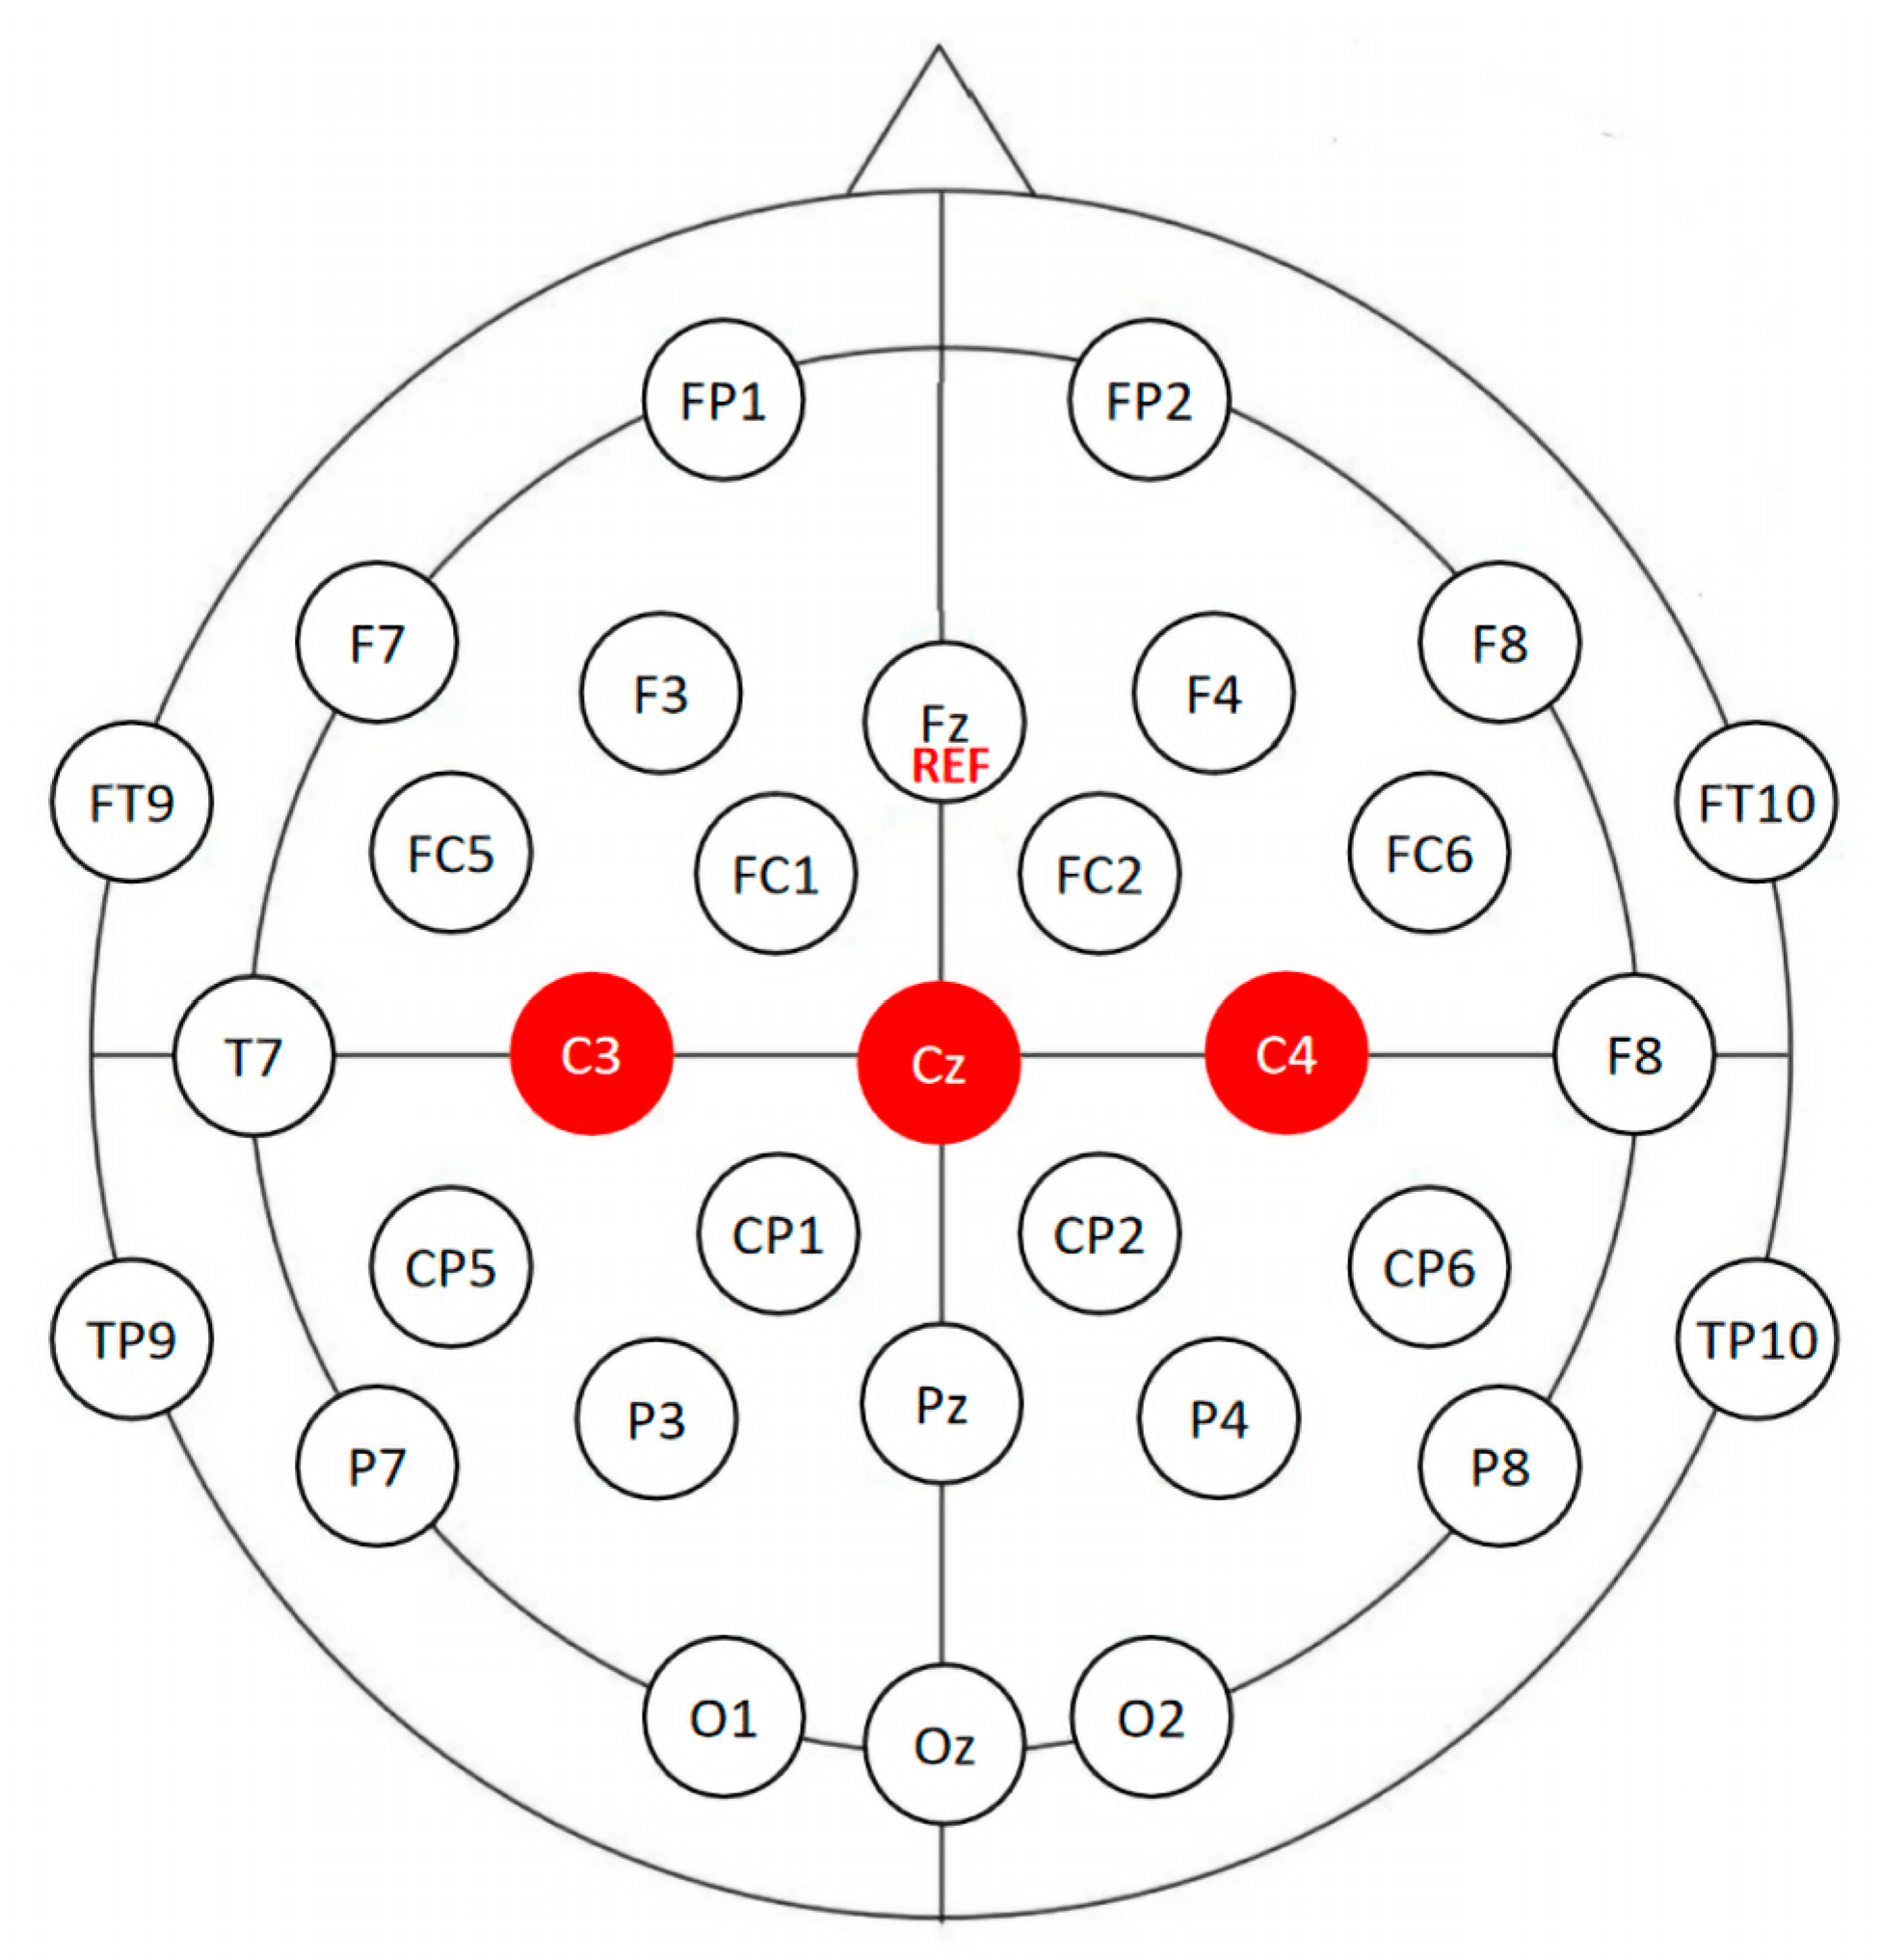
2.2. EEG System
2.3. Data Recording and Preprocessing
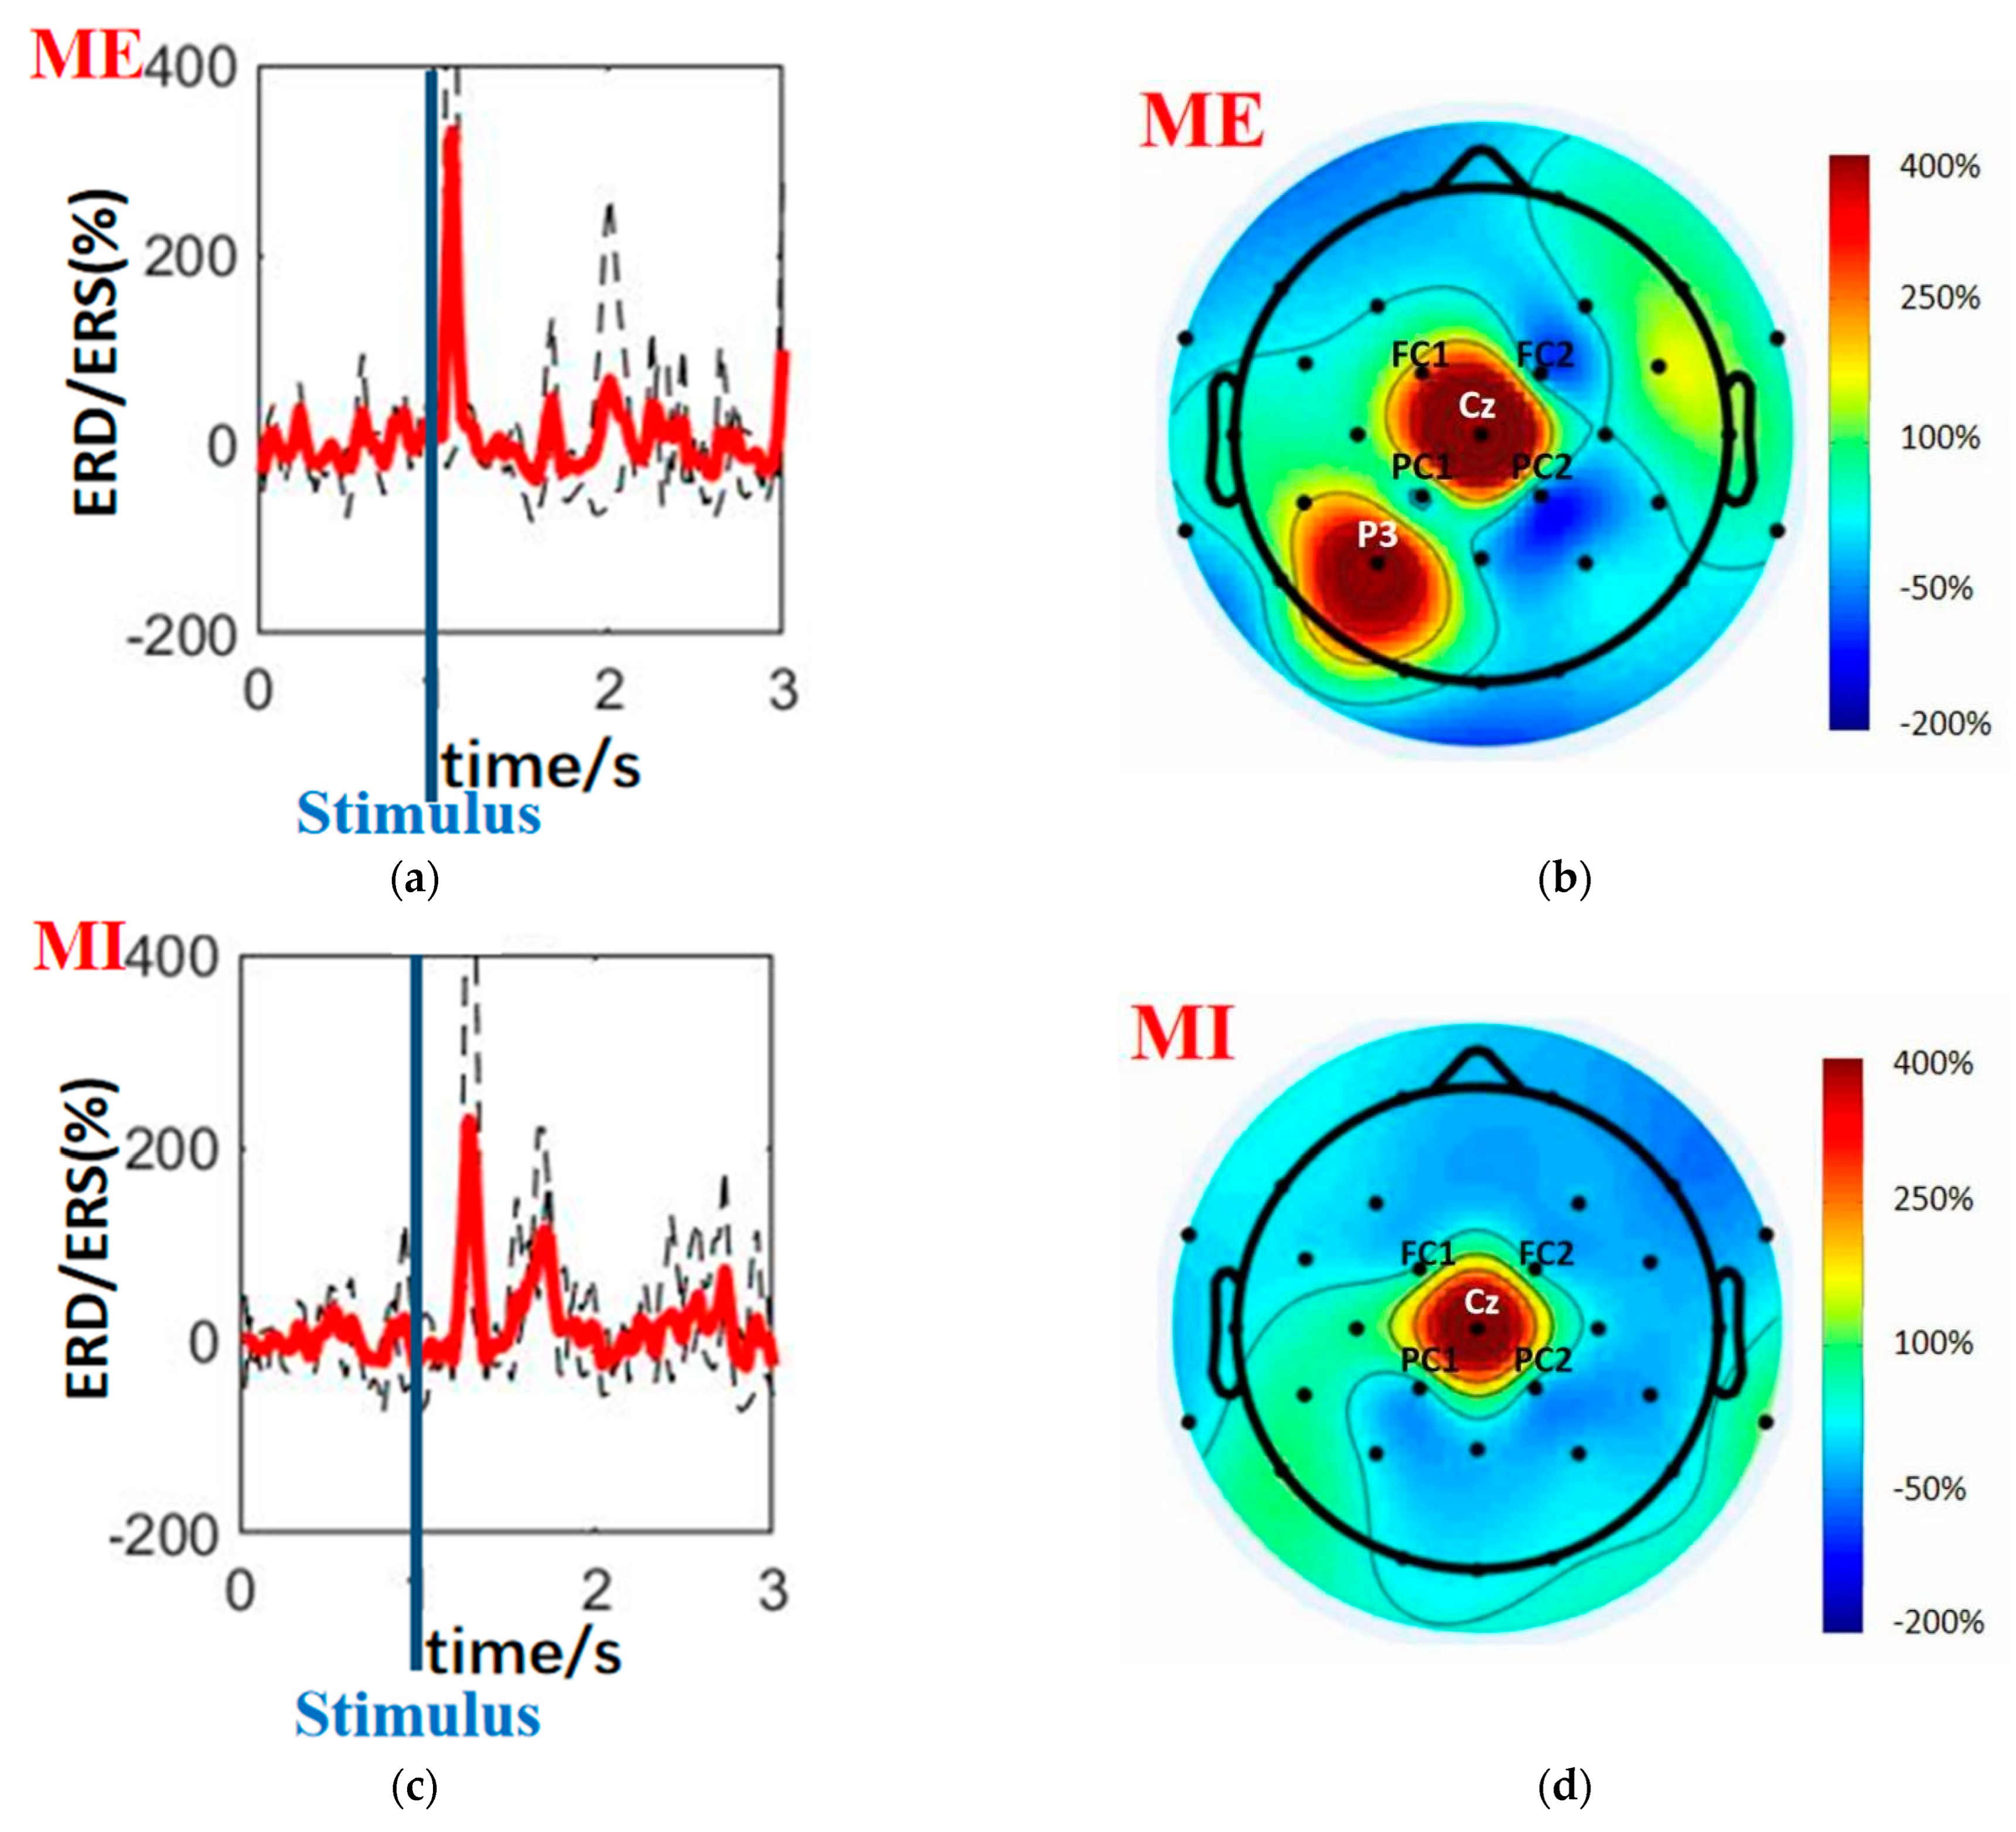
2.4. Event-Related Desynchronization/Synchronization Analysis
2.5. Feature Extraction
2.6. Support Vector Machine Classifier
2.7. Feature Selection
3. Results
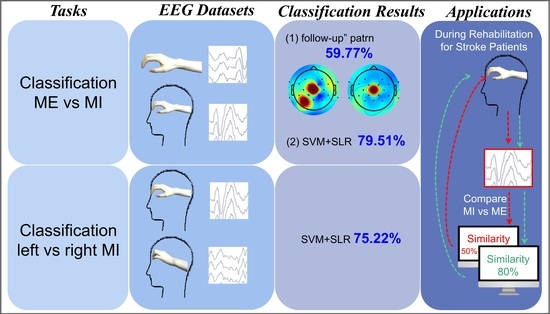
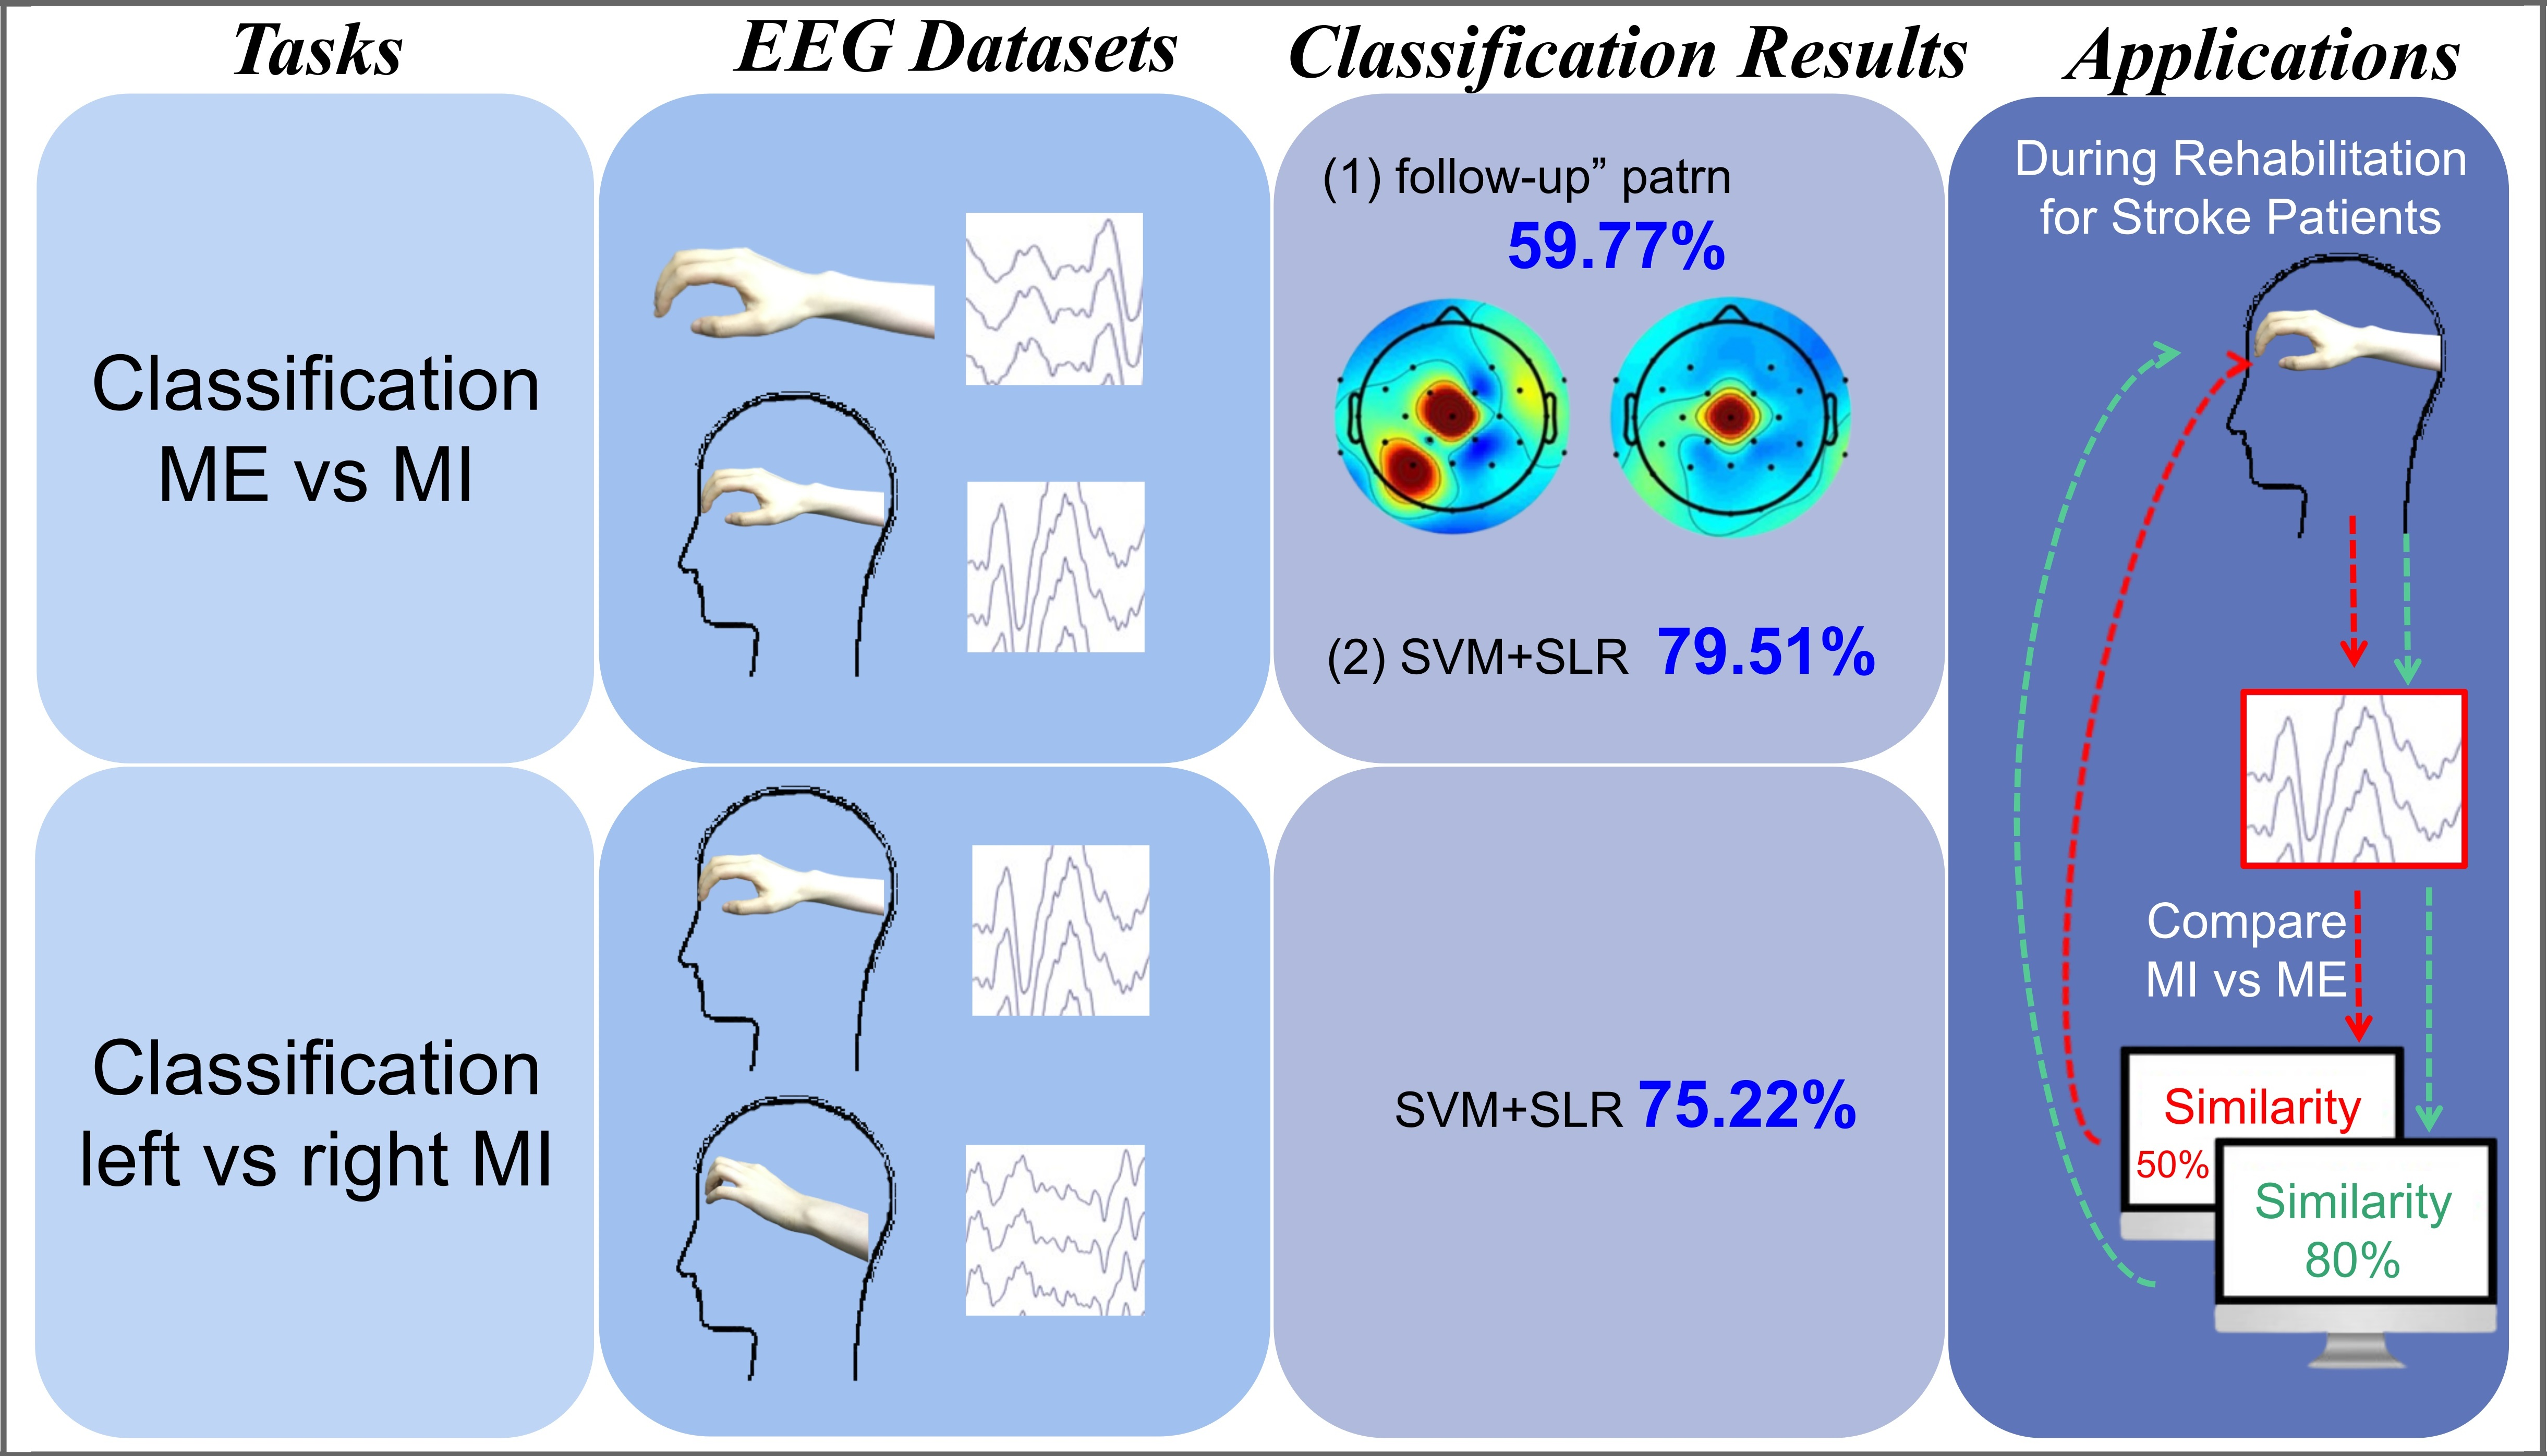
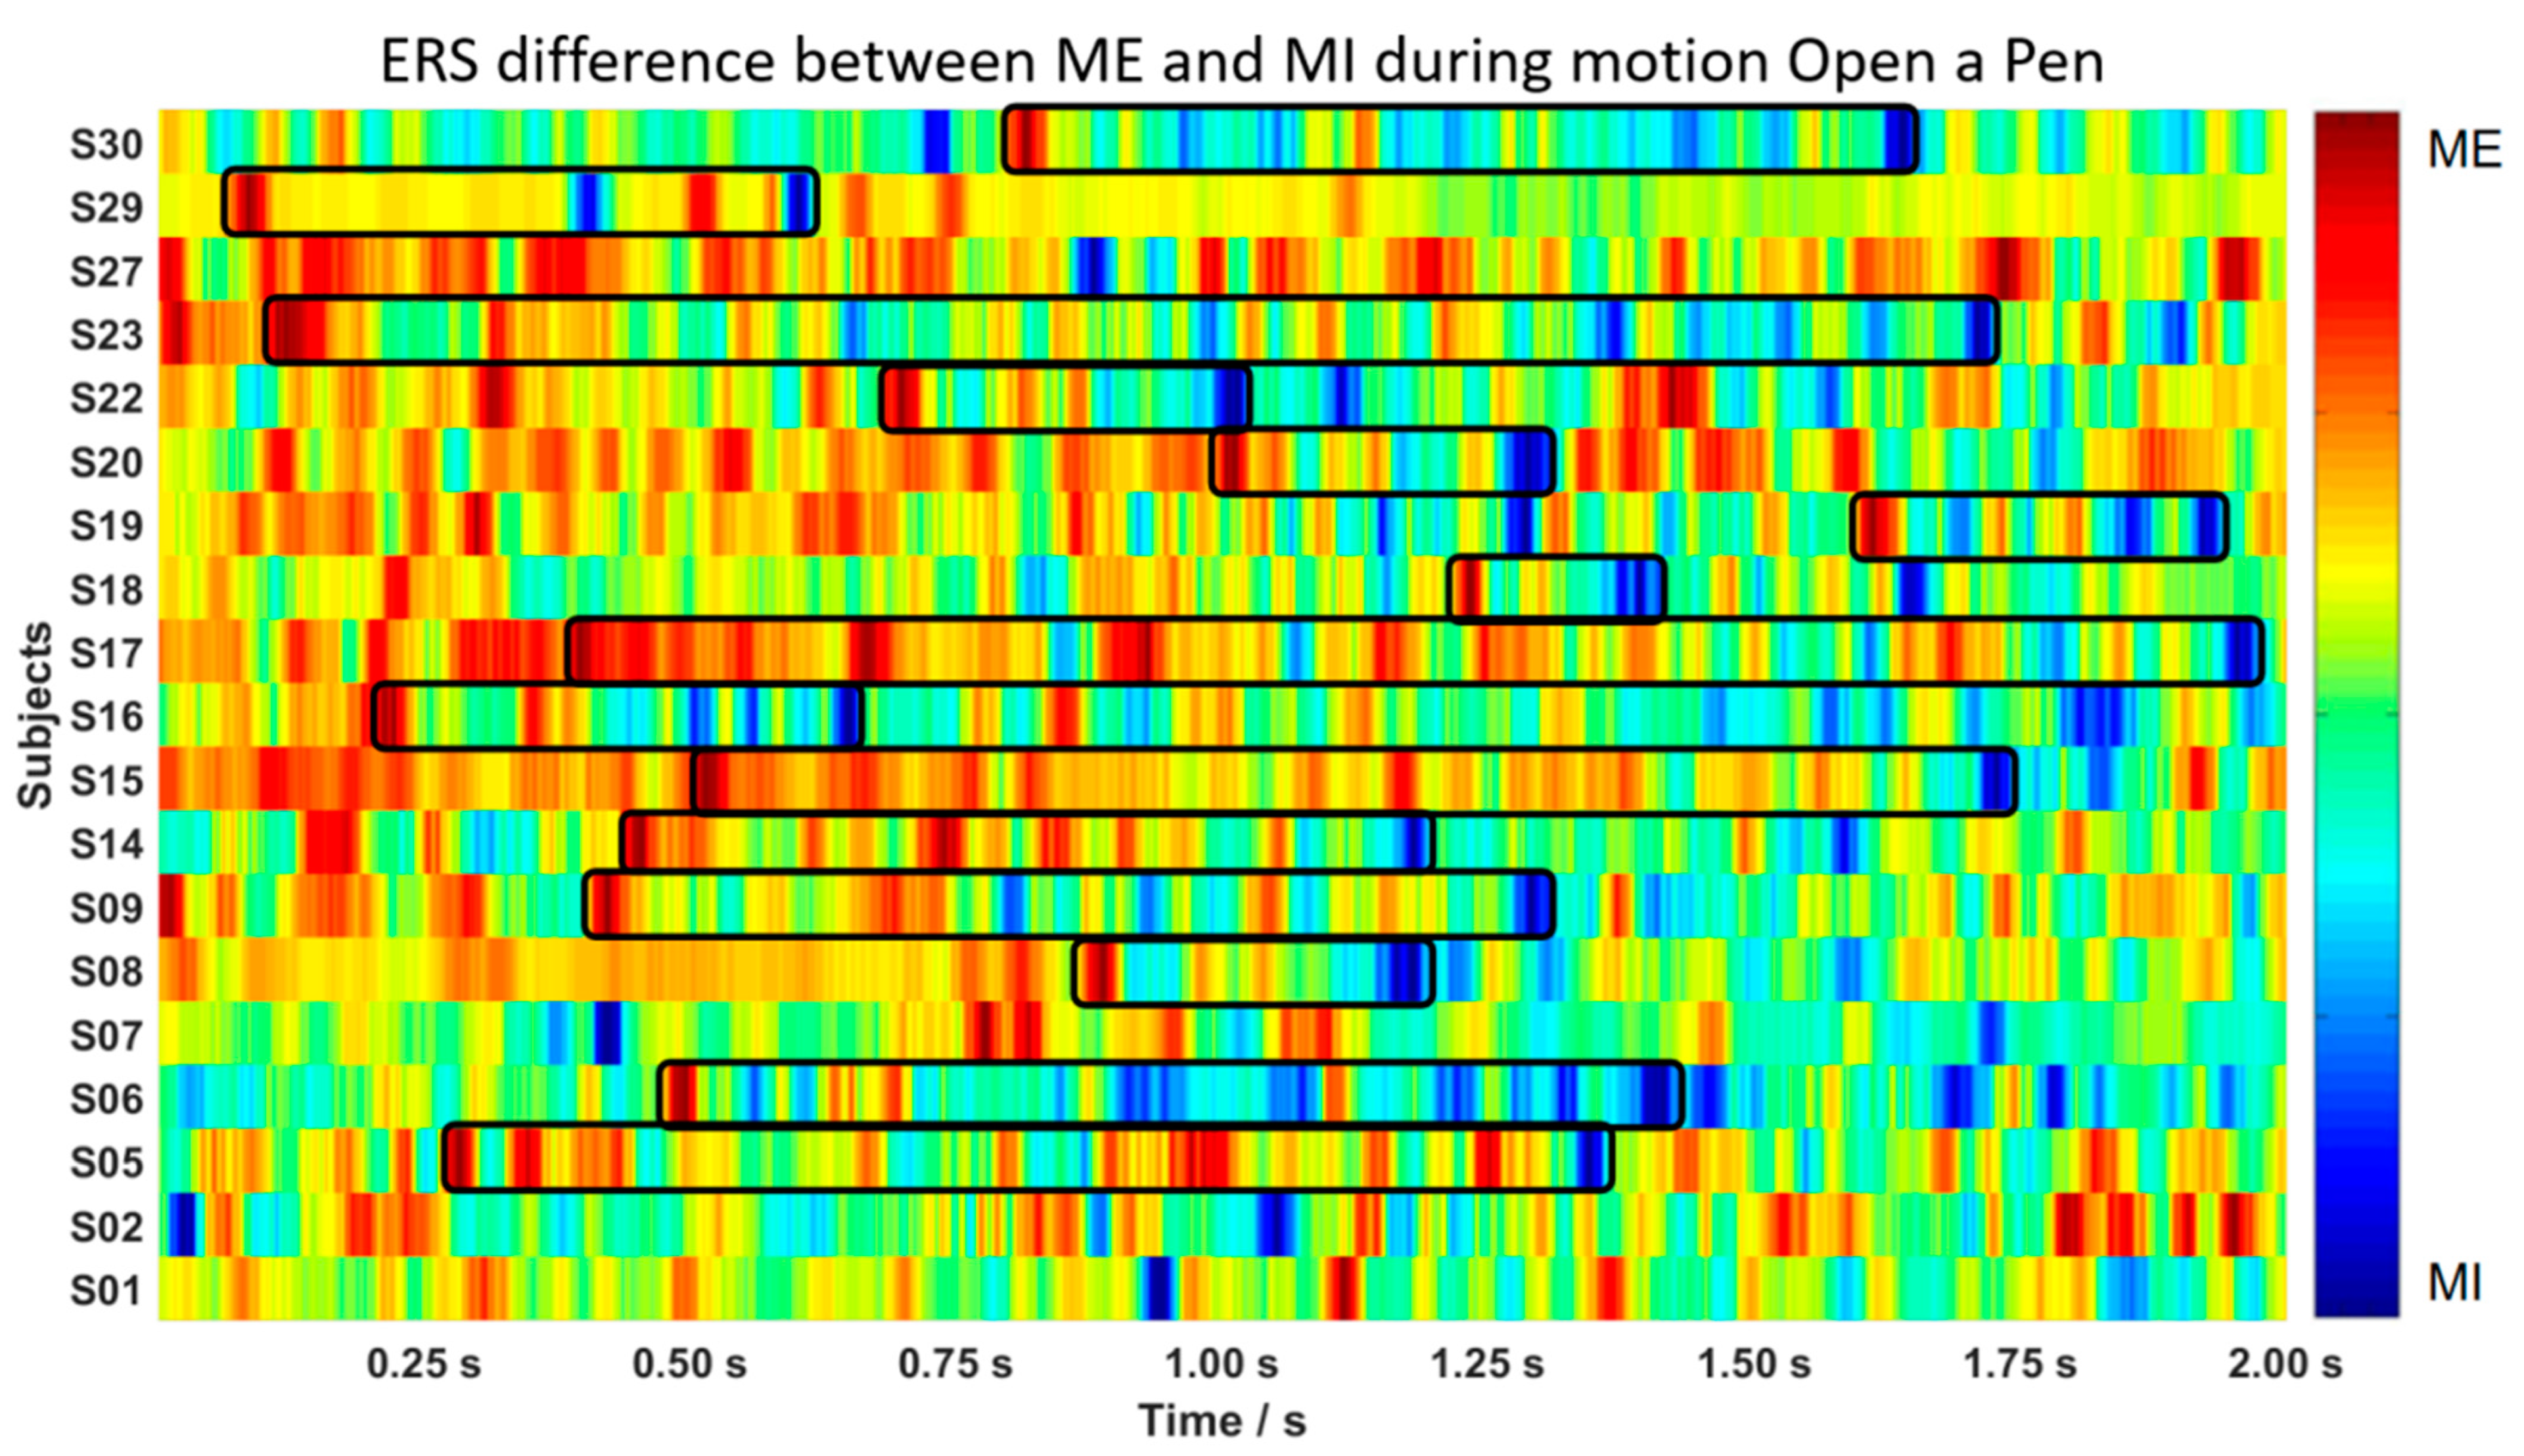
3.1. “Follow-Up” Pattern
3.2. ME versus MI Classification
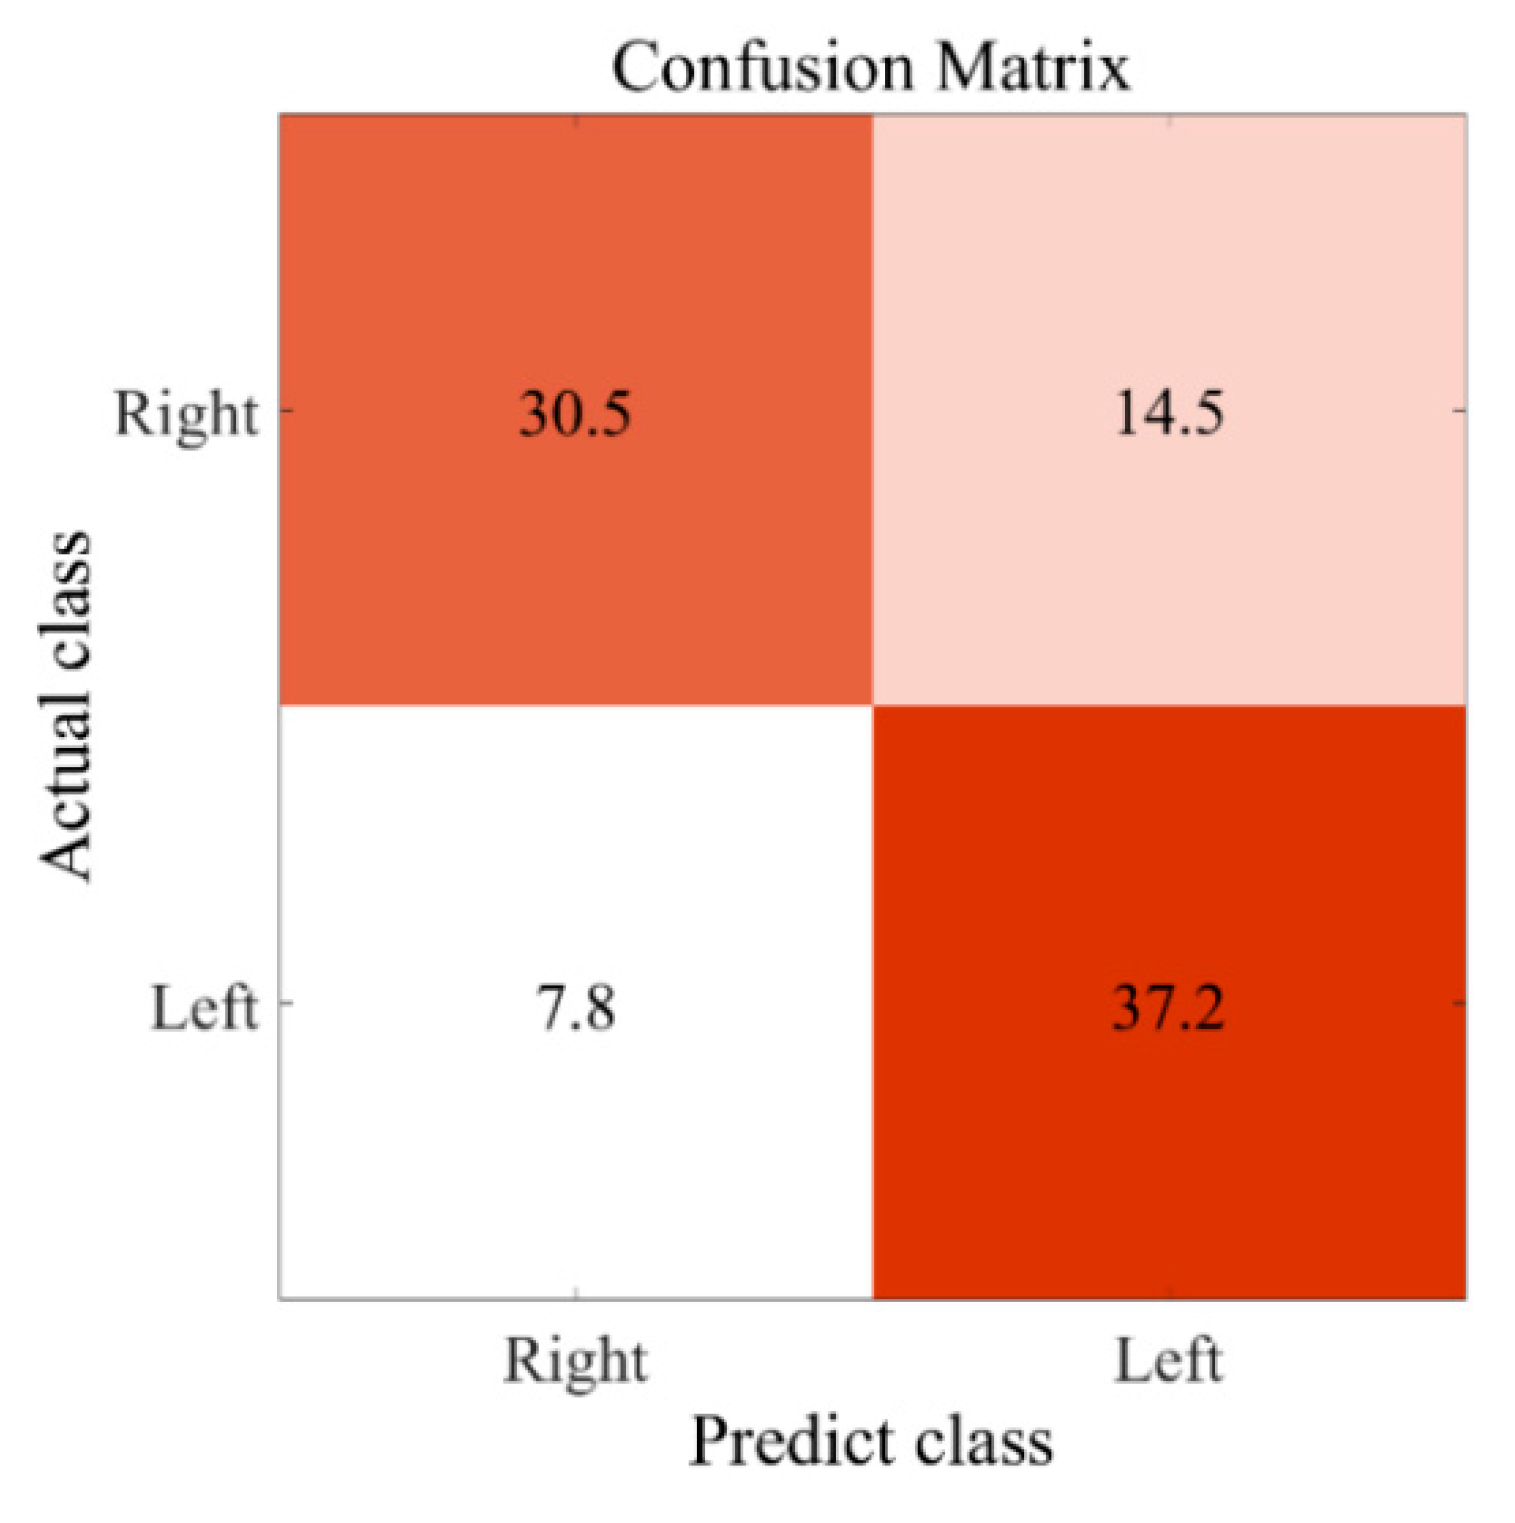
3.3. Left—Versus Right-Hand Motor Imagery Classification
3.4. Comparison and Analyses of Classification Accuracies
4. Discussion
5. Conclusions
Author Contributions
Funding
Institutional Review Board Statement
Informed Consent Statement
Data Availability Statement
Acknowledgments
Conflicts of Interest
References
- López, N.D.; Pereira, E.M.; Centeno, E.J.; Page, J.C.M. Motor imagery as a complementary technique for functional recovery after stroke: A systematic review. Top. Stroke Rehabil. 2019, 26, 576–587. [Google Scholar] [CrossRef] [PubMed]
- Carrasco, D.G.; Cantalapiedra, J.A. Effectiveness of motor imagery or mental practice in functional recovery after stroke: A systematic review. Neurología 2016, 31, 43–52. [Google Scholar] [CrossRef]
- Chen, M.; Lin, C.-H. What is in your hand influences your purchase intention: Effect of motor fluency on motor simulation. Curr. Psychol. 2021, 40, 3226–3234. [Google Scholar] [CrossRef]
- Deng, X.; Yu, Z.L.; Lin, C.; Gu, Z.; Li, Y. A bayesian shared control approach for wheelchair robot with brain machine interface. IEEE Trans. Neural Syst. Rehabil. Eng. 2019, 28, 328–338. [Google Scholar] [CrossRef]
- López-Larraz, E.; Sarasola-Sanz, A.; Irastorza-Landa, N.; Birbaumer, N.; Ramos-Murguialday, A. Brain-machine interfaces for rehabilitation in stroke: A review. NeuroRehabilitation 2018, 43, 77–97. [Google Scholar] [CrossRef] [Green Version]
- Cincotti, F.; Pichiorri, F.; Aricò, P.; Aloise, F.; Leotta, F.; Fallani, F.D.V.; Millán, J.D.R.; Molinari, M.; Mattia, D. EEG-based Brain-Computer Interface to support post-stroke motor rehabilitation of the upper limb. In Proceedings of the Annual International Conference of the IEEE Engineering in Medicine and Biology Society, San Diego, CA, USA, 28 August–1 September 2012; pp. 4112–4115. [Google Scholar]
- Ang, K.K.; Guan, C.T.; Chua, K.S.G.; Ang, B.T.; Kuah, C.W.K.; Wang, C.C.; Phua, K.S.; Chin, Z.Y.; Zhang, H.H. A Large Clinical Study on the Ability of Stroke Patients to Use an EEG-Based Motor Imagery Brain-Computer Interface. Clin. Eeg Neurosci. 2011, 42, 253–258. [Google Scholar] [CrossRef]
- Han, C.-H.; Müller, K.-R.; Hwang, H.-J. Brain-switches for asynchronous brain-computer interfaces: A systematic review. Electronics 2020, 9, 422. [Google Scholar] [CrossRef] [Green Version]
- Leeb, R.; Friedman, D.; Müller-Putz, G.R.; Scherer, R.; Slater, M.; Pfurtscheller, G. Self-paced (asynchronous) BCI control of a wheelchair in virtual environments: A case study with a tetraplegic. Comput. Intell. Neurosci. 2007, 2007, 79642. [Google Scholar] [CrossRef] [Green Version]
- Müller-Putz, G.R.; Kaiser, V.; Solis-Escalante, T.; Pfurtscheller, G. Fast set-up asynchronous brain-switch based on detection of foot motor imagery in 1-channel EEG. Med. Biol. Eng. Comput. 2010, 48, 229–233. [Google Scholar] [CrossRef]
- Lee, S.-B.; Kim, H.-J.; Kim, H.; Jeong, J.-H.; Lee, S.-W.; Kim, D.-J. Comparative analysis of features extracted from EEG spatial, spectral and temporal domains for binary and multiclass motor imagery classification. Inf. Sci. 2019, 502, 190–200. [Google Scholar] [CrossRef]
- Yang, H.; Sakhavi, S.; Ang, K.K.; Guan, C. On the use of convolutional neural networks and augmented CSP features for multi-class motor imagery of EEG signals classification. In Proceedings of the 37th Annual International Conference of the IEEE Engineering in Medicine and Biology Society (EMBC), Milan, Italy, 25–29 August 2015; pp. 2620–2623. [Google Scholar]
- Park, S.H.; Lee, D.; Lee, S.G. Filter Bank Regularized Common Spatial Pattern Ensemble for Small Sample Motor Imagery Classification. IEEE Trans. Neural Syst. Rehabil. 2018, 26, 498–505. [Google Scholar] [CrossRef] [PubMed]
- Park, Y.; Chung, W. Frequency-Optimized Local Region Common Spatial Pattern Approach for Motor Imagery Classification. IEEE Trans. Neural Syst. Rehabil. 2019, 27, 1378–1388. [Google Scholar] [CrossRef] [PubMed]
- Wang, L.; Xu, G.; Yang, S.; Wang, J.; Guo, M.; Yan, W. Motor imagery BCI research based on sample entropy and SVM. In Proceedings of the Sixth International Conference on Electromagnetic Field Problems and Applications, Dalian, China, 19–21 June 2012; pp. 1–4. [Google Scholar]
- Chatterjee, R.; Bandyopadhyay, T. EEG based Motor Imagery Classification using SVM and MLP. In Proceedings of the 2nd international conference on Computational Intelligence and Networks (CINE), Bhubaneswar, India, 11 January 2016; pp. 84–89. [Google Scholar]
- Padfield, N.; Zabalza, J.; Zhao, H.; Masero, V.; Ren, J. EEG-based brain-computer interfaces using motor-imagery: Techniques and challenges. Sensors 2019, 19, 1423. [Google Scholar] [CrossRef] [PubMed] [Green Version]
- Gu, L.; Yu, Z.; Ma, T.; Wang, H.; Li, Z.; Fan, H. EEG-based Classification of Lower Limb Motor Imagery with Brain Network Analysis. Neuroscience 2020, 436, 93–109. [Google Scholar] [CrossRef]
- Pfurtscheller, G.; Neuper, C.; Brunner, C.; Silva, F.L.D. Beta rebound after different types of motor imagery in man. Neurosci. Lett. 2005, 378, 156–159. [Google Scholar] [CrossRef]
- Chen, C.; Zhang, J.; Belkacem, A.N.; Zhang, S.; Xu, R.; Hao, B.; Gao, Q.; Shin, D.; Wang, C.; Ming, D. G-causality brain connectivity differences of finger movements between motor execution and motor imagery. J. Healthc. Eng. 2019, 2019, 5068283. [Google Scholar] [CrossRef] [Green Version]
- Kim, Y.K.; Park, E.; Lee, A.; Im, C.-H.; Kim, Y.-H. Changes in network connectivity during motor imagery and execution. PLoS ONE 2018, 13, e0190715. [Google Scholar] [CrossRef] [Green Version]
- Miller, K.J.; Schalk, G.; Fetz, E.E.; Nijs, M.D.; Ojemann, J.G.; Rao, R.P. Cortical activity during motor execution, motor imagery, and imagery-based online feedback. Proc. Natl. Acad. Sci. USA 2010, 107, 4430–4435. [Google Scholar] [CrossRef] [Green Version]
- Dai, M.; Zheng, D.; Liu, S.; Zhang, P. Transfer kernel common spatial patterns for motor imagery brain-computer interface classification. Comput. Math. Methods Med. 2018, 2018, 9871603. [Google Scholar] [CrossRef]
- Ge, S.; Yang, Q.; Wang, R.; Lin, P.; Gao, J.; Leng, Y.; Yang, Y.; Wang, H. A brain-computer interface based on a few-channel EEG-fNIRS bimodal system. IEEE Access 2017, 5, 208–218. [Google Scholar] [CrossRef]
- Herman, P.; Prasad, G.; McGinnity, T.M.; Coyle, D. Comparative analysis of spectral approaches to feature extraction for EEG-based motor imagery classification. IEEE Trans. Neural Syst. Rehabil. Eng. 2008, 16, 317–326. [Google Scholar] [CrossRef] [PubMed]
- O’Brien, A.; Bertolucci, F.; Torrealba-Acosta, G.; Huerta, R.; Fregni, F.; Thibaut, A. Non-invasive brain stimulation for fine motor improvement after stroke: A meta-analysis. Eur. J. Neurol. 2018, 25, 1017–1026. [Google Scholar] [CrossRef] [PubMed]
- Erdoĝan, S.B.; Özsarfati, E.; Dilek, B.; Kadak, K.S.; Hanoĝlu, L.; Akın, A. Classification of motor imagery and execution signals with population-level feature sets: Implications for probe design in fNIRS based BCI. J. Neural Eng. 2019, 16, 026029. [Google Scholar] [CrossRef] [PubMed]
- Pfurtscheller, G.; Silva, F.H.L.D. Event-related EEG/MEG synchronization and desynchronization: Basic principles. Clin. Neurophysiol. 1999, 110, 1842–1857. [Google Scholar] [CrossRef]
- Delgado-Bonal, A.; Marshak, A. Approximate entropy and sample entropy: A comprehensive tutorial. Entropy 2019, 21, 541. [Google Scholar] [CrossRef] [PubMed] [Green Version]
- Gubert, P.H.; Costa, M.H.; Silva, C.D.; Trofino-Neto, A. The performance impact of data augmentation in CSP-based motor-imagery systems for BCI applications. Biomed. Signal Processing Control. 2020, 62, 102152. [Google Scholar] [CrossRef]
- Chatterjee, R.; Bandyopadhyay, T.; Sanyal, D.K.; Guha, D. Comparative analysis of feature extraction techniques in motor imagery EEG signal classification. In Proceedings of the First International Conference on Smart System, Innovations and Computing, Jaipur, India, 15–16 April 2017; pp. 73–83. [Google Scholar]
- Paul, J.K.; Iype, T.; Dileep, R.; Hagiwara, Y.; Koh, J.W.; Acharya, U.R. Characterization of fibromyalgia using sleep EEG signals with nonlinear dynamical features. Comput. Biol. Med. 2019, 111, 103331. [Google Scholar] [CrossRef]
- Espenhahn, S.; Rossiter, H.E.; Wijk, B.C.V.; Redman, N.; Rondina, J.M.; Diedrichsen, J.; Ward, N.S. Sensorimotor cortex beta oscillations reflect motor skill learning ability after stroke. Brain Commun. 2020, 2, fcaa161. [Google Scholar] [CrossRef]
- Malan, N.S.; Sharma, S. Feature selection using regularized neighbourhood component analysis to enhance the classification performance of motor imagery signals. Comput. Biol. Med. 2019, 107, 118–126. [Google Scholar] [CrossRef]
- Tang, Z.; Li, C.; Sun, S. Single-trial EEG classification of motor imagery using deep convolutional neural networks. Optik 2017, 130, 11–18. [Google Scholar] [CrossRef]
- Voinas, A.E.; Das, R.; Khan, M.A.; Brunner, I.; Puthusserypady, S. Motor Imagery EEG Signal Classification for Stroke Survivors Rehabilitation. In Proceedings of the 10th International Winter Conference on Brain-Computer Interface (BCI), Gangwon-do, Korea, 21–23 February 2022; pp. 1–5. [Google Scholar]
- Ge, S.; Liu, H.; Lin, P.; Gao, J.; Xiao, C.; Li, Z. Neural basis of action observation and understanding from first-and third-person perspectives: An fMRI study. Front. Behav. Neurosci. 2018, 12, 283. [Google Scholar] [CrossRef] [PubMed] [Green Version]
- Hong, K.-S.; Ghafoor, U.; Khan, M.J. Brain-machine interfaces using functional near-infrared spectroscopy: A review. Artif. Life Robot. 2020, 25, 204–218. [Google Scholar] [CrossRef]
- Fukuma, R.; Yanagisawa, T.; Yokoi, H.; Hirata, M.; Yoshimine, T.; Saitoh, Y.; Kamitani, Y.; Kishima, H. Training in use of brain–machine Interface-controlled robotic hand improves accuracy decoding two types of hand movements. Front. Neurosci. 2018, 12, 478. [Google Scholar] [CrossRef] [PubMed] [Green Version]
- Wu, Y.; Jiang, D.; Liu, X.; Bayford, R.; Demosthenous, A. A human–machine interface using electrical impedance tomography for hand prosthesis control. IEEE Trans. Biomed. Circuits Syst. 2018, 12, 1322–1333. [Google Scholar] [CrossRef] [PubMed] [Green Version]
- Uchitel, J.; Vidal-Rosas, E.E.; Cooper, R.J.; Zhao, H. Wearable, Integrated EEG–fNIRS Technologies: A Review. Sensors 2021, 21, 6106. [Google Scholar] [CrossRef]
- Jin, J.; Li, S.; Daly, I.; Miao, Y.; Liu, C.; Wang, X.; Cichocki, A. The study of generic model set for reducing calibration time in P300-based brain–computer interface. IEEE Trans. Neural Syst. Rehabil. Eng. 2019, 28, 3–12. [Google Scholar] [CrossRef]
- Ravi, A.; Beni, N.H.; Manuel, J.; Jiang, N. Comparing user-dependent and user-independent training of CNN for SSVEP BCI. J. Neural Eng. 2020, 17, 026028. [Google Scholar] [CrossRef]
- Nazari, M.R.; Nasrabadi, A.M.; Daliri, M.R. Single-trial decoding of motion direction during visual attention from local field potential signals. IEEE Access 2021, 9, 66450–66461. [Google Scholar] [CrossRef]
- Yao, L.; Sheng, X.; Mrachacz-Kersting, N.; Zhu, X.; Farina, D.; Jiang, N. Performance of brain–computer interfacing based on tactile selective sensation and motor imagery. IEEE Trans. Neural Syst. Rehabil. Eng. 2017, 26, 60–68. [Google Scholar] [CrossRef] [Green Version]
- Chin, Z.Y.; Zhang, X.; Wang, C.; Ang, K.K. EEG-based discrimination of different cognitive workload levels from mental arithmetic. In Proceedings of the 40th Annual International Conference of the IEEE Engineering in Medicine and Biology Society (EMBC), Honlulu, HI, USA, 17–21 July 2018; pp. 1984–1987. [Google Scholar]
- Ge, S.; Wang, P.; Liu, H.; Lin, P.; Gao, J.; Wang, R.; Iramina, K.; Zhang, Q.; Zheng, W. Neural activity and decoding of action observation using combined EEG and fNIRS measurement. Front. Hum. Neurosci. 2019, 13, 357. [Google Scholar] [CrossRef] [Green Version]
- Leng, Y.; Zhu, Y.; Ge, S.; Qian, X.; Zhang, J. Neural temporal dynamics of social exclusion elicited by averted gaze: An event-related potentials study. Front. Behav. Neurosci. 2018, 12, 21. [Google Scholar] [CrossRef] [PubMed] [Green Version]
- Lindig-León, C.; Bougrain, L. Comparison of sensorimotor rhythms in EEG signals during simple and combined motor imageries over the contra and ipsilateral hemispheres. In Proceedings of the 37th Annual International Conference of the IEEE Engineering in Medicine and Biology Society (EMBC), Milan, Italy, 25–29 August 2015; pp. 3953–3956. [Google Scholar]
- Hashimoto, Y.; Ushiba, J.; Kimura, A.; Liu, M.; Tomita, Y. Change in brain activity through virtual reality-based brain-machine communication in a chronic tetraplegic subject with muscular dystrophy. BMC Neurosci. 2010, 11, 1–9. [Google Scholar] [CrossRef] [PubMed] [Green Version]
- Ai, Q.; Chen, A.; Chen, K.; Liu, Q.; Zhou, T.; Xin, S.; Ji, Z. Feature extraction of four-class motor imagery EEG signals based on functional brain network. J. Neural Eng. 2019, 16, 026032. [Google Scholar] [CrossRef] [PubMed]
- Isa, N.M.; Amir, A.; Ilyas, M.; Razalli, M. Motor imagery classification in Brain computer interface (BCI) based on EEG signal by using machine learning technique. Bull. Electr. Eng. Inform. 2019, 8, 269–275. [Google Scholar] [CrossRef]
- Roy, Y.; Banville, H.; Albuquerque, I.; Gramfort, A.; Falk, T.H.; Faubert, J. Deep learning-based electroencephalography analysis: A systematic review. J. Neural Eng. 2019, 16, 051001. [Google Scholar] [CrossRef]
- Rejer, I. EEG feature selection for BCI based on motor imaginary task. Found. Comput. Decis. Sci. 2012, 37, 283. [Google Scholar] [CrossRef] [Green Version]
- Pineda, J.A. The functional significance of mu rhythms: Translating “seeing” and “hearing” into “doing”. Brain Res. Rev. 2005, 50, 57–68. [Google Scholar] [CrossRef]
- Yu, J.; Ang, K.K.; Guan, C.; Wang, C. A multimodal fNIRS and EEG-based BCI study on motor imagery and passive movement. In Proceedings of the 6th International IEEE/EMBS Conference on Neural Engineering (NER), San Diego, CA, USA, 6–8 November 2013; pp. 5–8. [Google Scholar]
- Selim, S.; Tantawi, M.M.; Shedeed, H.A.; Badr, A. A CSP\AM-BA-SVM Approach for Motor Imagery BCI System. IEEE Access 2018, 6, 49192–49208. [Google Scholar] [CrossRef]
- Vidaurre, C.; Blankertz, B. Towards a cure for BCI illiteracy. Brain Topogr. 2010, 23, 194–198. [Google Scholar] [CrossRef] [Green Version]


| Feature Vectors | Size (No. of Trials × No. of Features) |
|---|---|
| Statistical Features | 532 × 6 |
| Wavelet-based Features | 532 × 3 |
| Power Features | 532 × 4 |
| Total | 532 × 13 |
| Feature Vectors | Size (No. of Trials × No. of Features) |
|---|---|
| Statistical Features | 100 × 18 |
| Wavelet-based Features | 100 × 9 |
| Power Features | 100 × 24 |
| SampEn | 100 × 6 |
| CSP | 100 × 2 |
| Total | 100 × 59 |
| Subjects | Percentage (%) | Subjects | Percentage (%) |
|---|---|---|---|
| S01 | 50.00 | S17 | 57.14 |
| S02 | 50.00 | S18 | 85.71 |
| S05 | 57.14 | S19 | 42.86 |
| S06 | 78.57 | S20 | 57.14 |
| S07 | 42.86 | S22 | 57.14 |
| S08 | 64.29 | S23 | 64.29 |
| S09 | 50.00 | S27 | 64.29 |
| S14 | 71.43 | S29 | 71.43 |
| S15 | 71.43 | S30 | 50.00 |
| S16 | 50.00 | Mean ± SD | 59.77 ± 11.95 |
| Motions | Percentage (%) | Motions | Percentage (%) |
|---|---|---|---|
| Tap: Right Finger 1 | 57.89 | Tap: Left Finger 4 | 57.89 |
| Tap: Right Finger 2 | 36.84 | Tap: Left Finger 5 | 42.10 |
| Tap: Right Finger 3 | 57.89 | Hold a Pen | 63.16 |
| Tap: Right Finger 4 | 63.16 | Open a Pen | 84.21 |
| Tap: Right Finger 5 | 52.63 | Finger-crossing | 89.47 |
| Tap: Left Finger 1 | 68.42 | Arm Movement | 52.63 |
| Tap: Left Finger 2 | 52.63 | Mean ± SD | 59.77 ± 13.58 |
| Tap: Left Finger 3 | 57.89 |
| Models | Features Left | Accuracy |
|---|---|---|
| SVM | 59 | 62.00% |
| SLR-LAP | 2 | 57.78% |
| SLR-VAR | 9 | 50.22% |
| L1-SLR-LAP | 42 | 75.22% |
| L1-SLR-COMP | 35 | 58.67% |
| Authors | EEG Channels | Participants | Feature Extraction | Classifiers | Feature Selection | Average Accuracy |
|---|---|---|---|---|---|---|
| This work | 3 | 10 | Statistics, Wavelet Coefficients, Average Power, SampEn, CSP | SVM | L1-SLR-LAP | 75.2% |
| Malan et al., 2019 [34] | 3 | 10 | DTCWT | SVM | GA | 78.9% |
| PCA | 64.3% | |||||
| ReliefF | 75.7% | |||||
| RNCA | 80.7% | |||||
| Tang et al., 2017 [35] | 28 | 2 | Power spectrum | SVM | - | 77.2% |
| Voinas et al., 2022 [36] | 16 | 6 | WPD+HOS | RF | - | 71.0% |
| CSP | 66.0% | |||||
| Filter Bank CSP | 69.0% |
Publisher’s Note: MDPI stays neutral with regard to jurisdictional claims in published maps and institutional affiliations. |
© 2022 by the authors. Licensee MDPI, Basel, Switzerland. This article is an open access article distributed under the terms and conditions of the Creative Commons Attribution (CC BY) license (https://creativecommons.org/licenses/by/4.0/).
Share and Cite
Wang, J.; Chen, Y.-H.; Yang, J.; Sawan, M. Intelligent Classification Technique of Hand Motor Imagery Using EEG Beta Rebound Follow-Up Pattern. Biosensors 2022, 12, 384. https://doi.org/10.3390/bios12060384
Wang J, Chen Y-H, Yang J, Sawan M. Intelligent Classification Technique of Hand Motor Imagery Using EEG Beta Rebound Follow-Up Pattern. Biosensors. 2022; 12(6):384. https://doi.org/10.3390/bios12060384
Chicago/Turabian StyleWang, Jiachen, Yun-Hsuan Chen, Jie Yang, and Mohamad Sawan. 2022. "Intelligent Classification Technique of Hand Motor Imagery Using EEG Beta Rebound Follow-Up Pattern" Biosensors 12, no. 6: 384. https://doi.org/10.3390/bios12060384