Toward In Vivo MRI of the Tissue Proton Exchange Rate in Humans


Abstract
:1. Introduction
2. Methods
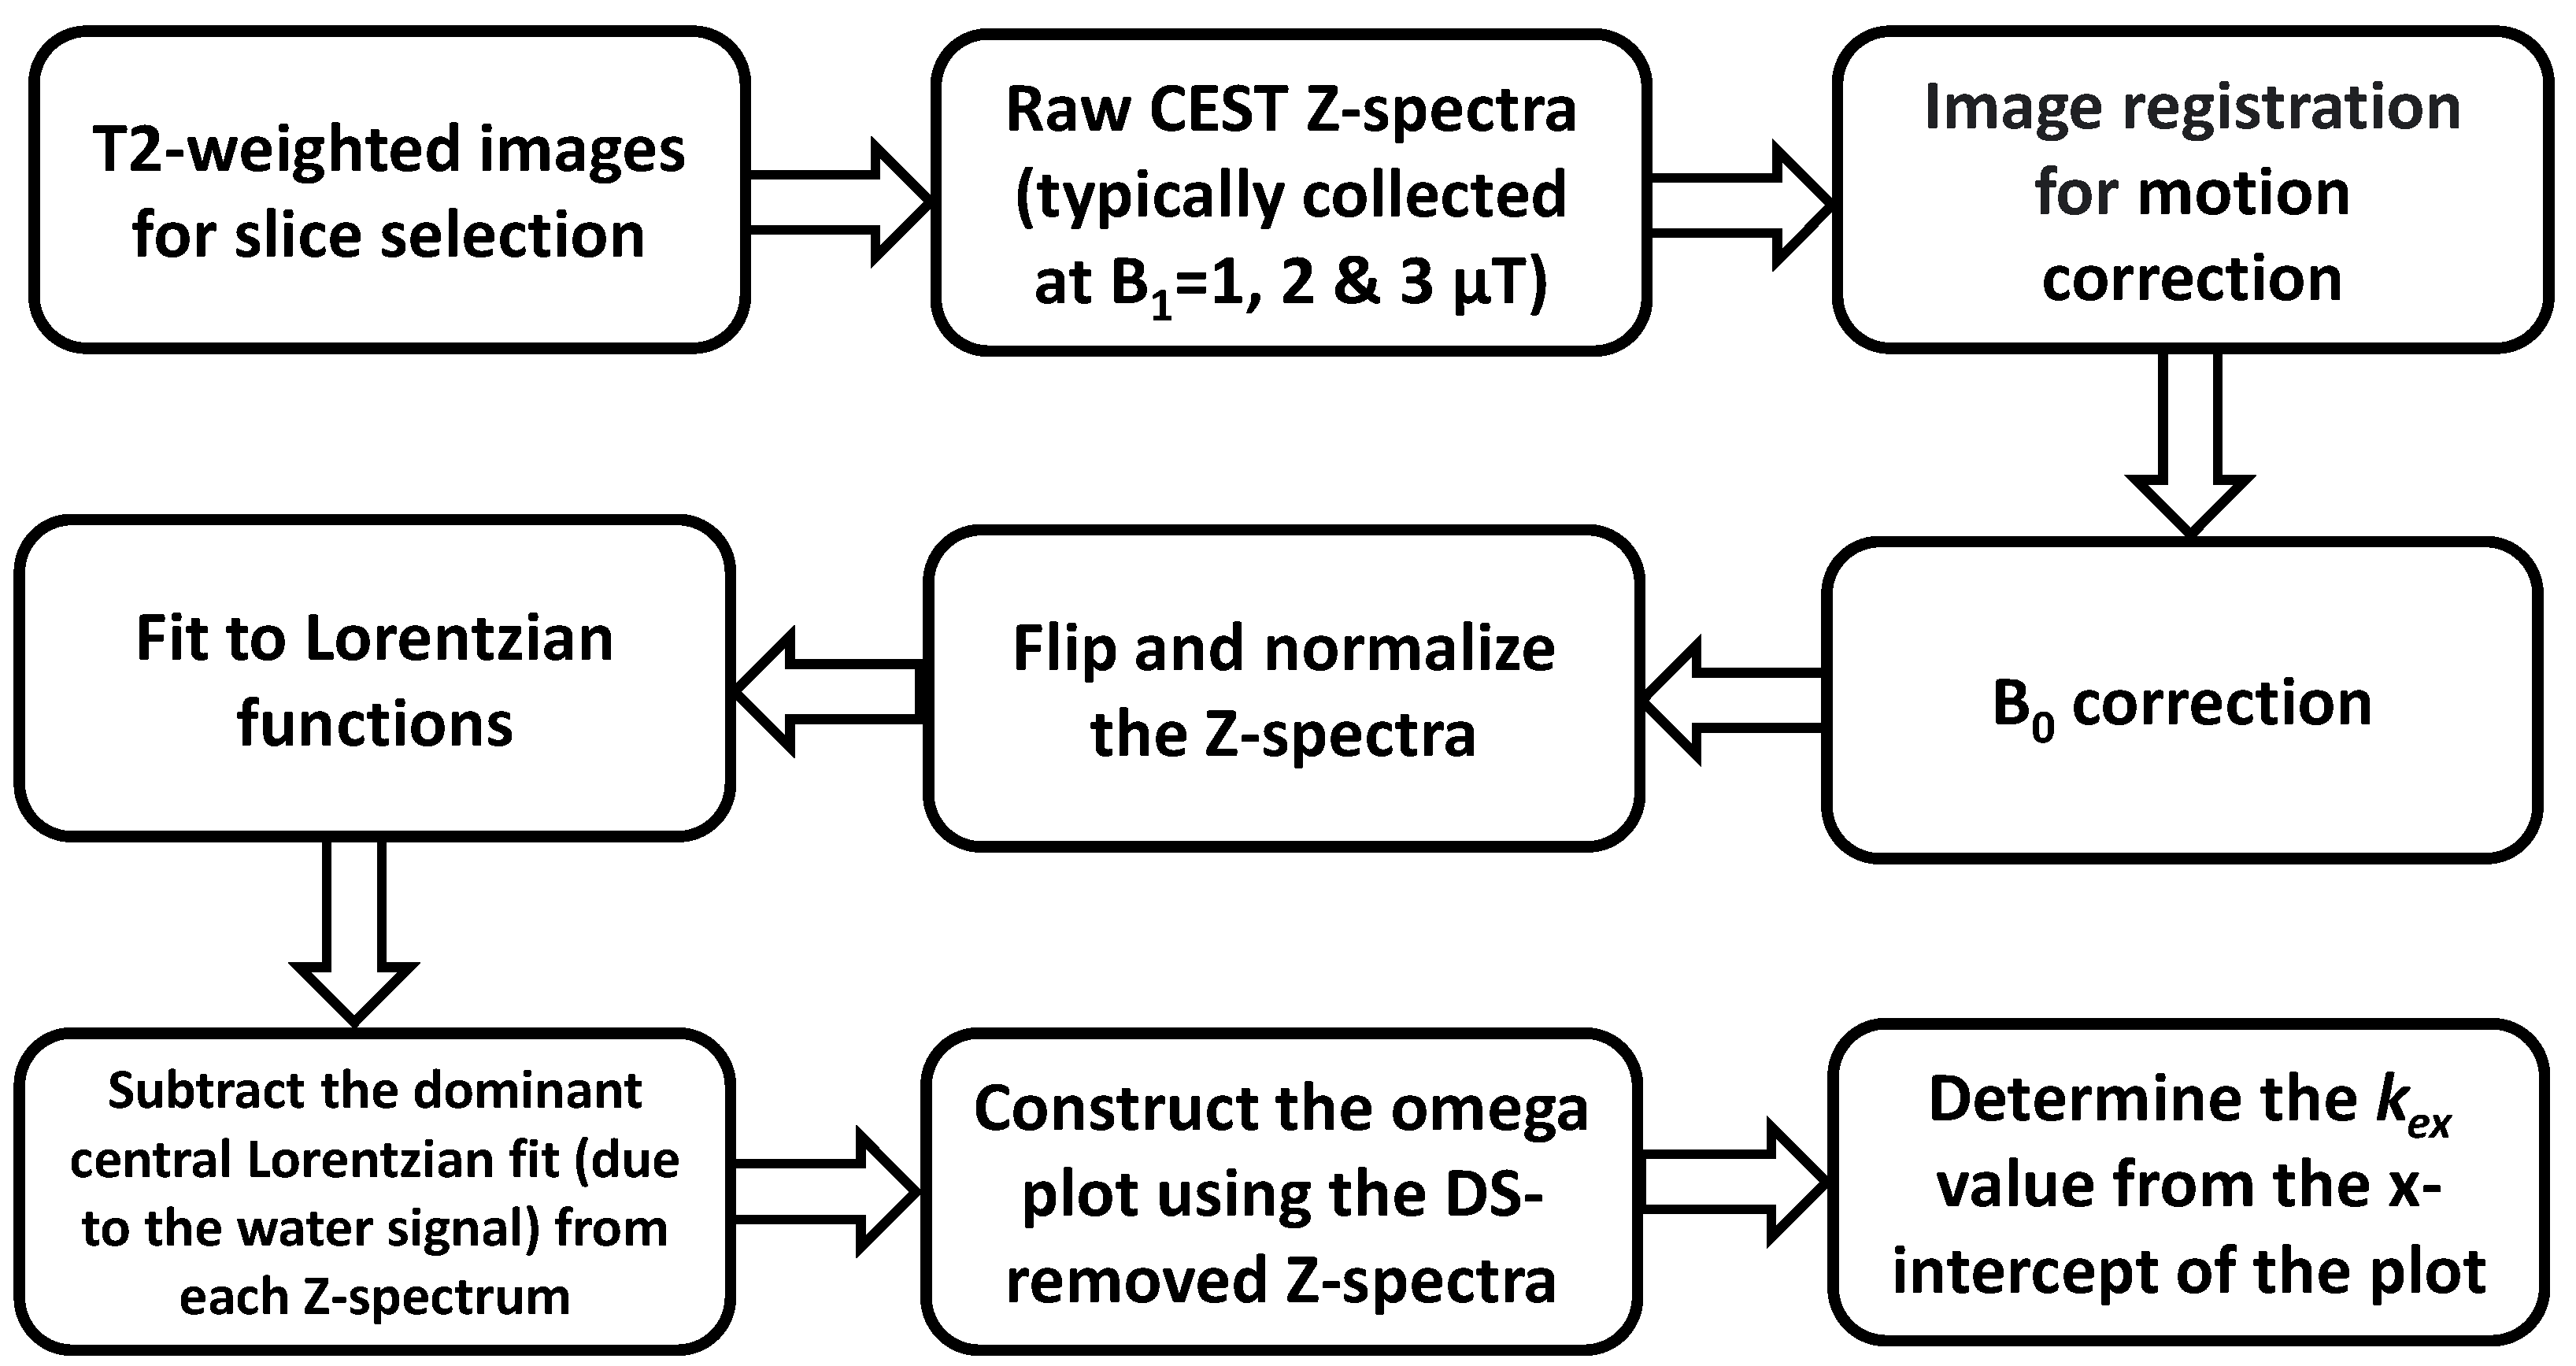
2.1. Basic Principles
2.2. DS Removing
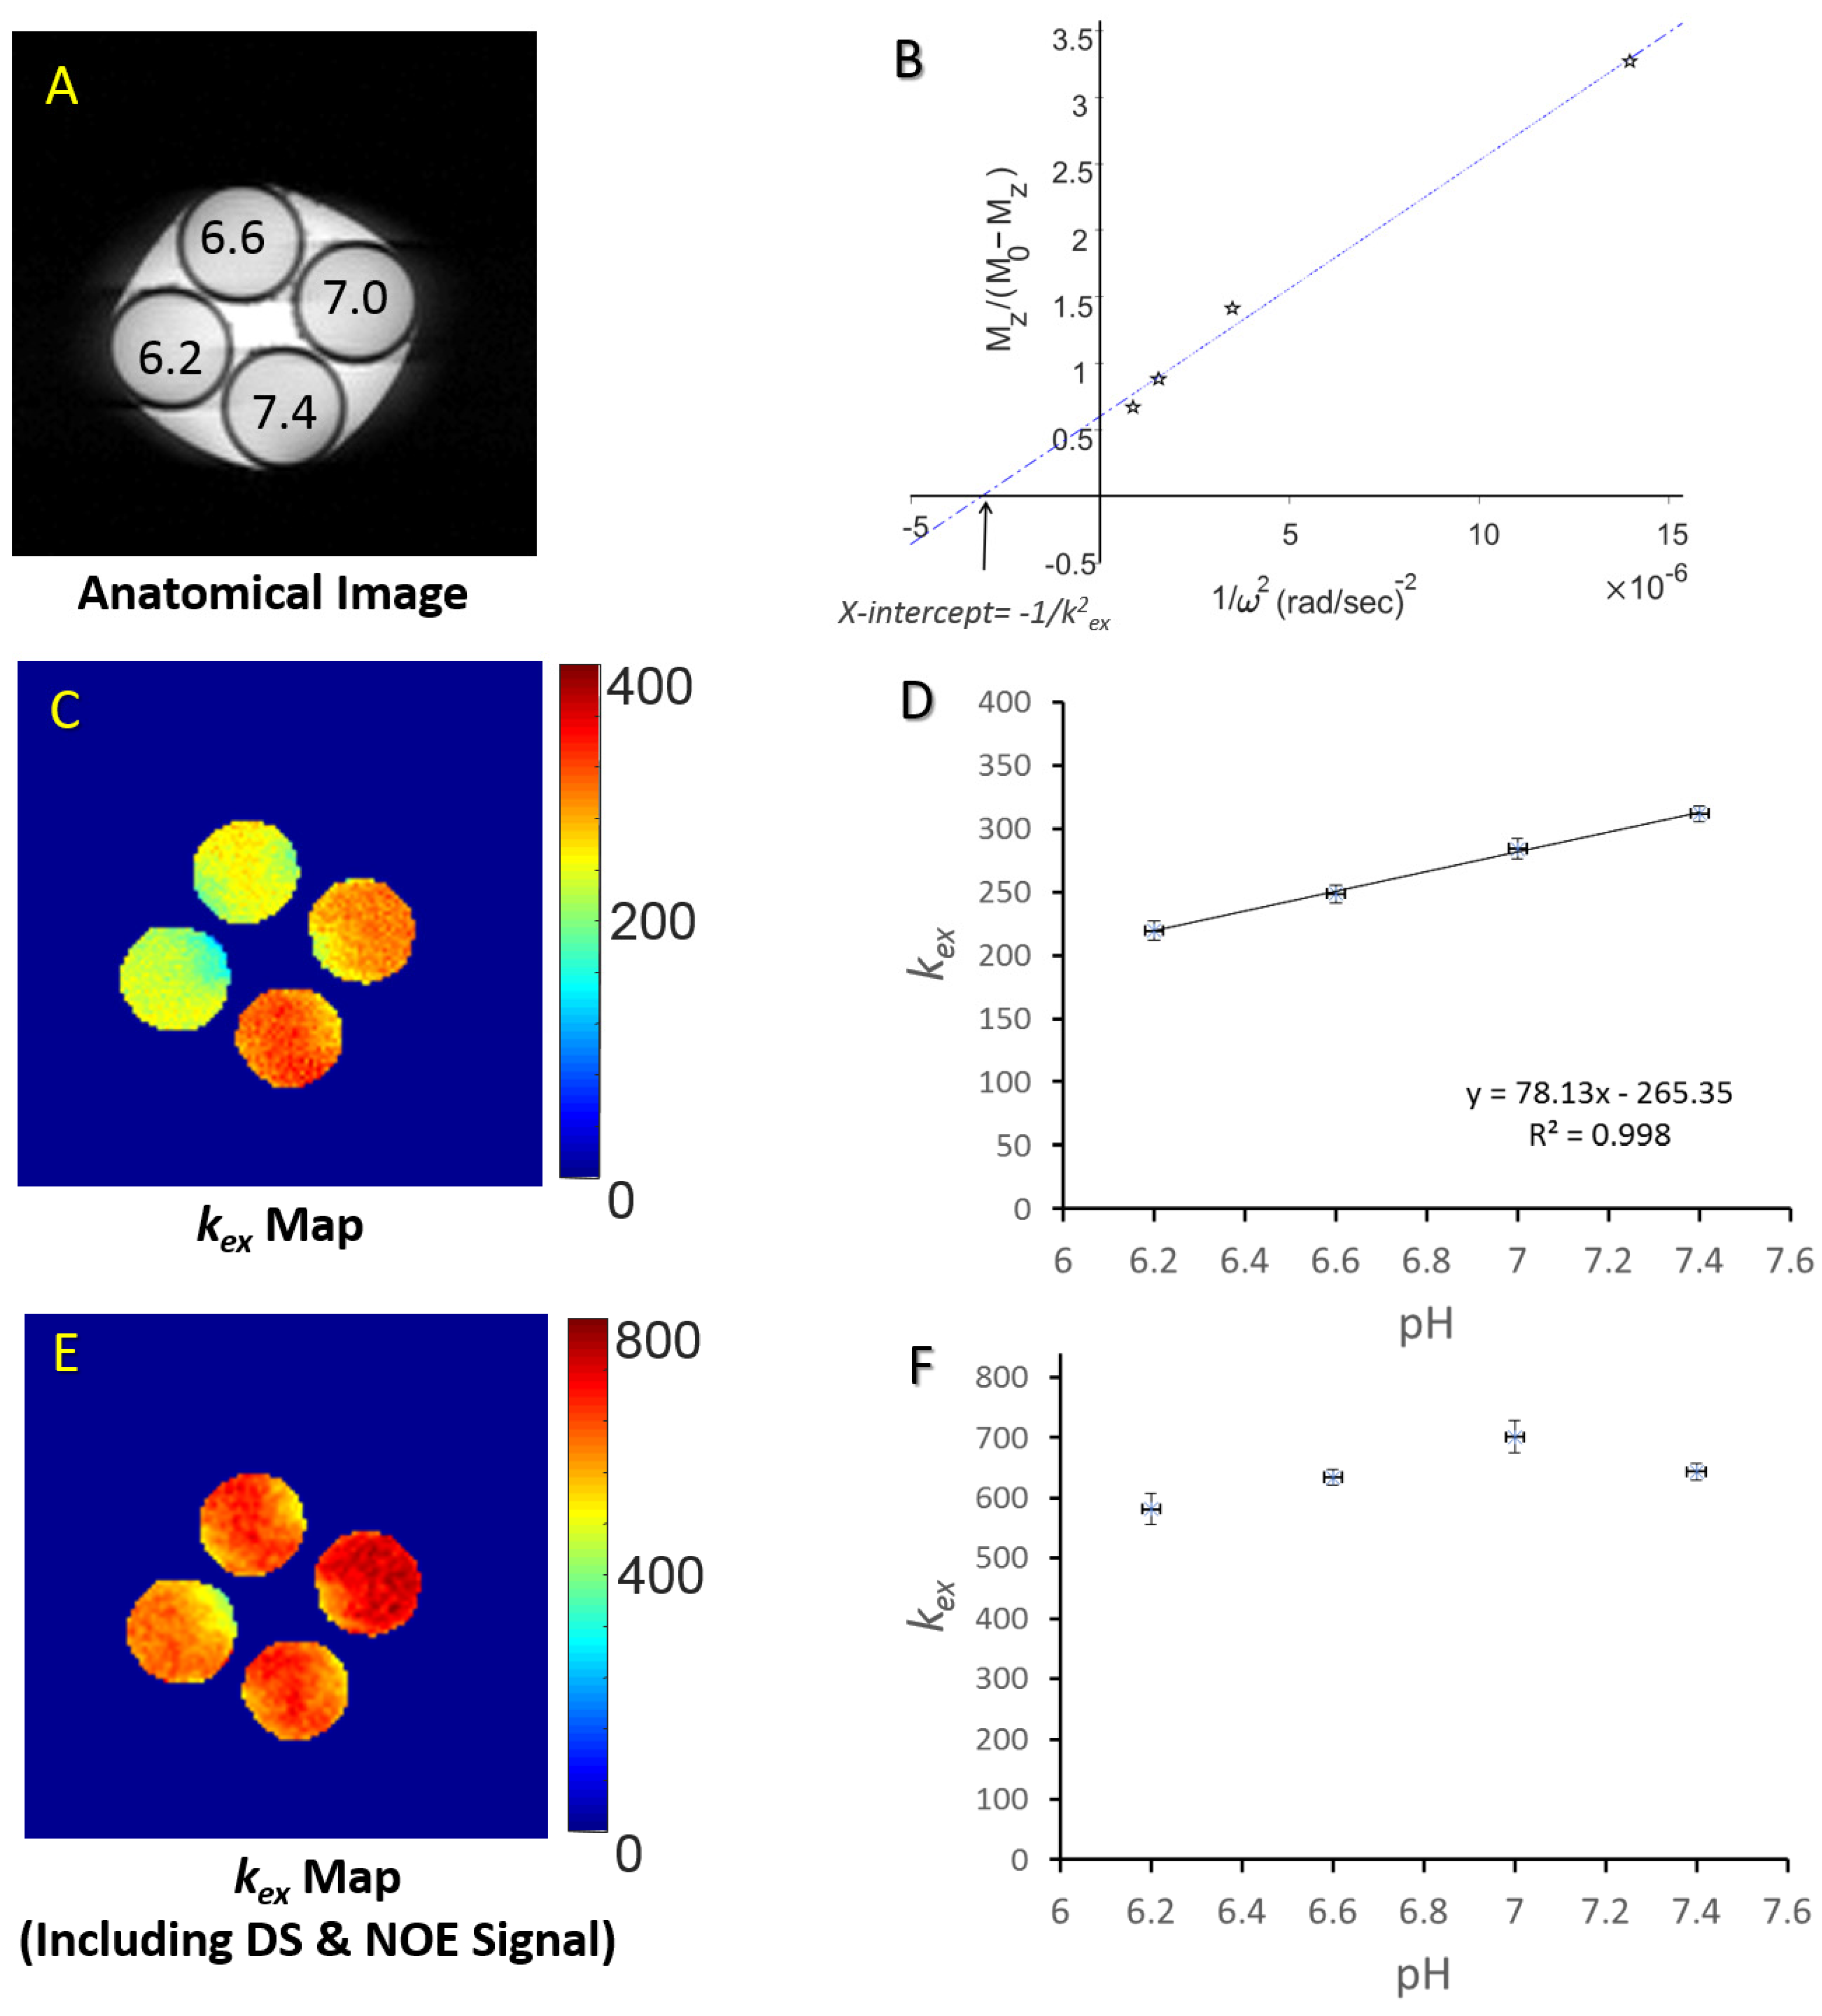
3. Validation
4. Applications
4.1. Mapping the Healthy Human Brain
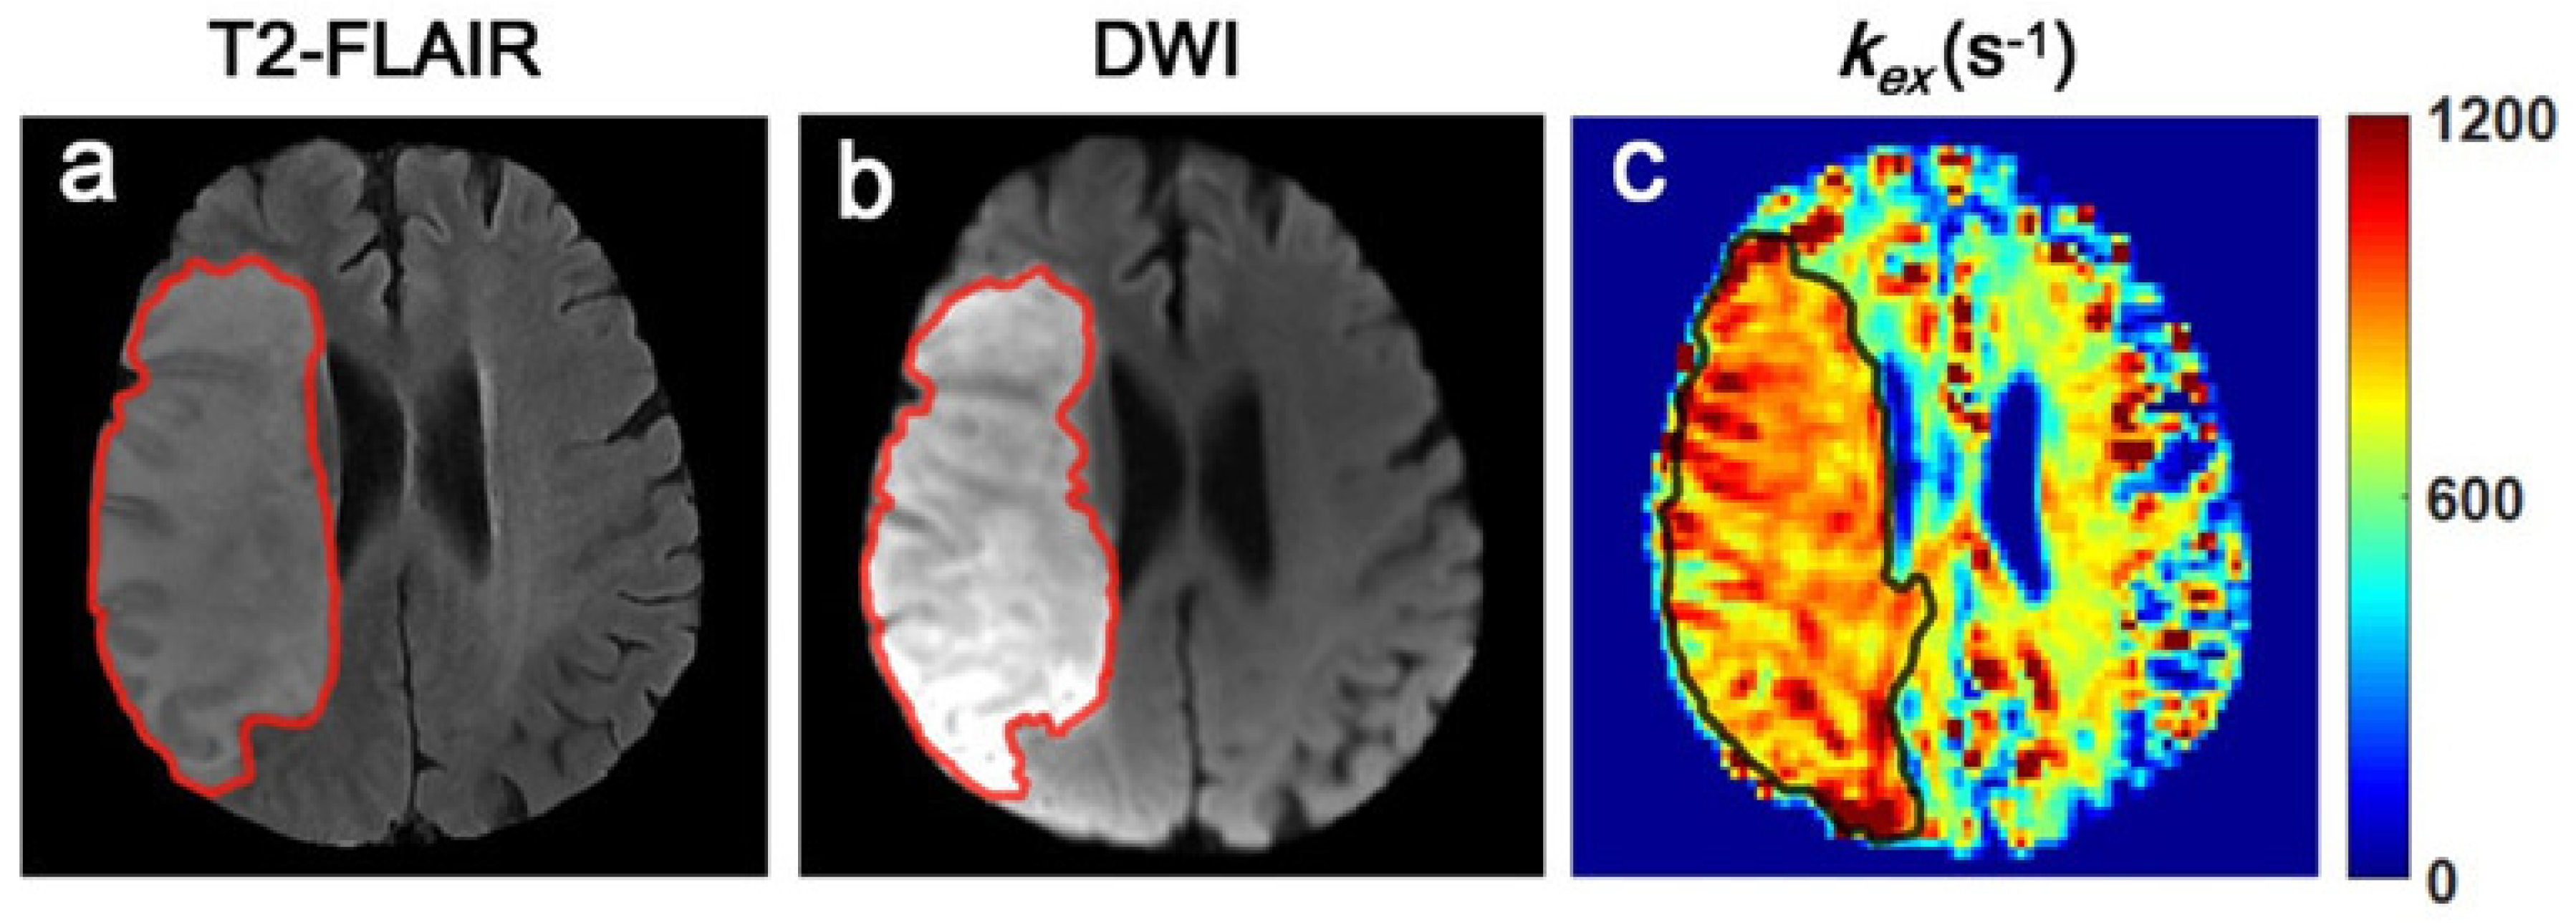
4.2. Detecting the Metabolic Disturbance of Ischemic Stroke Tissues
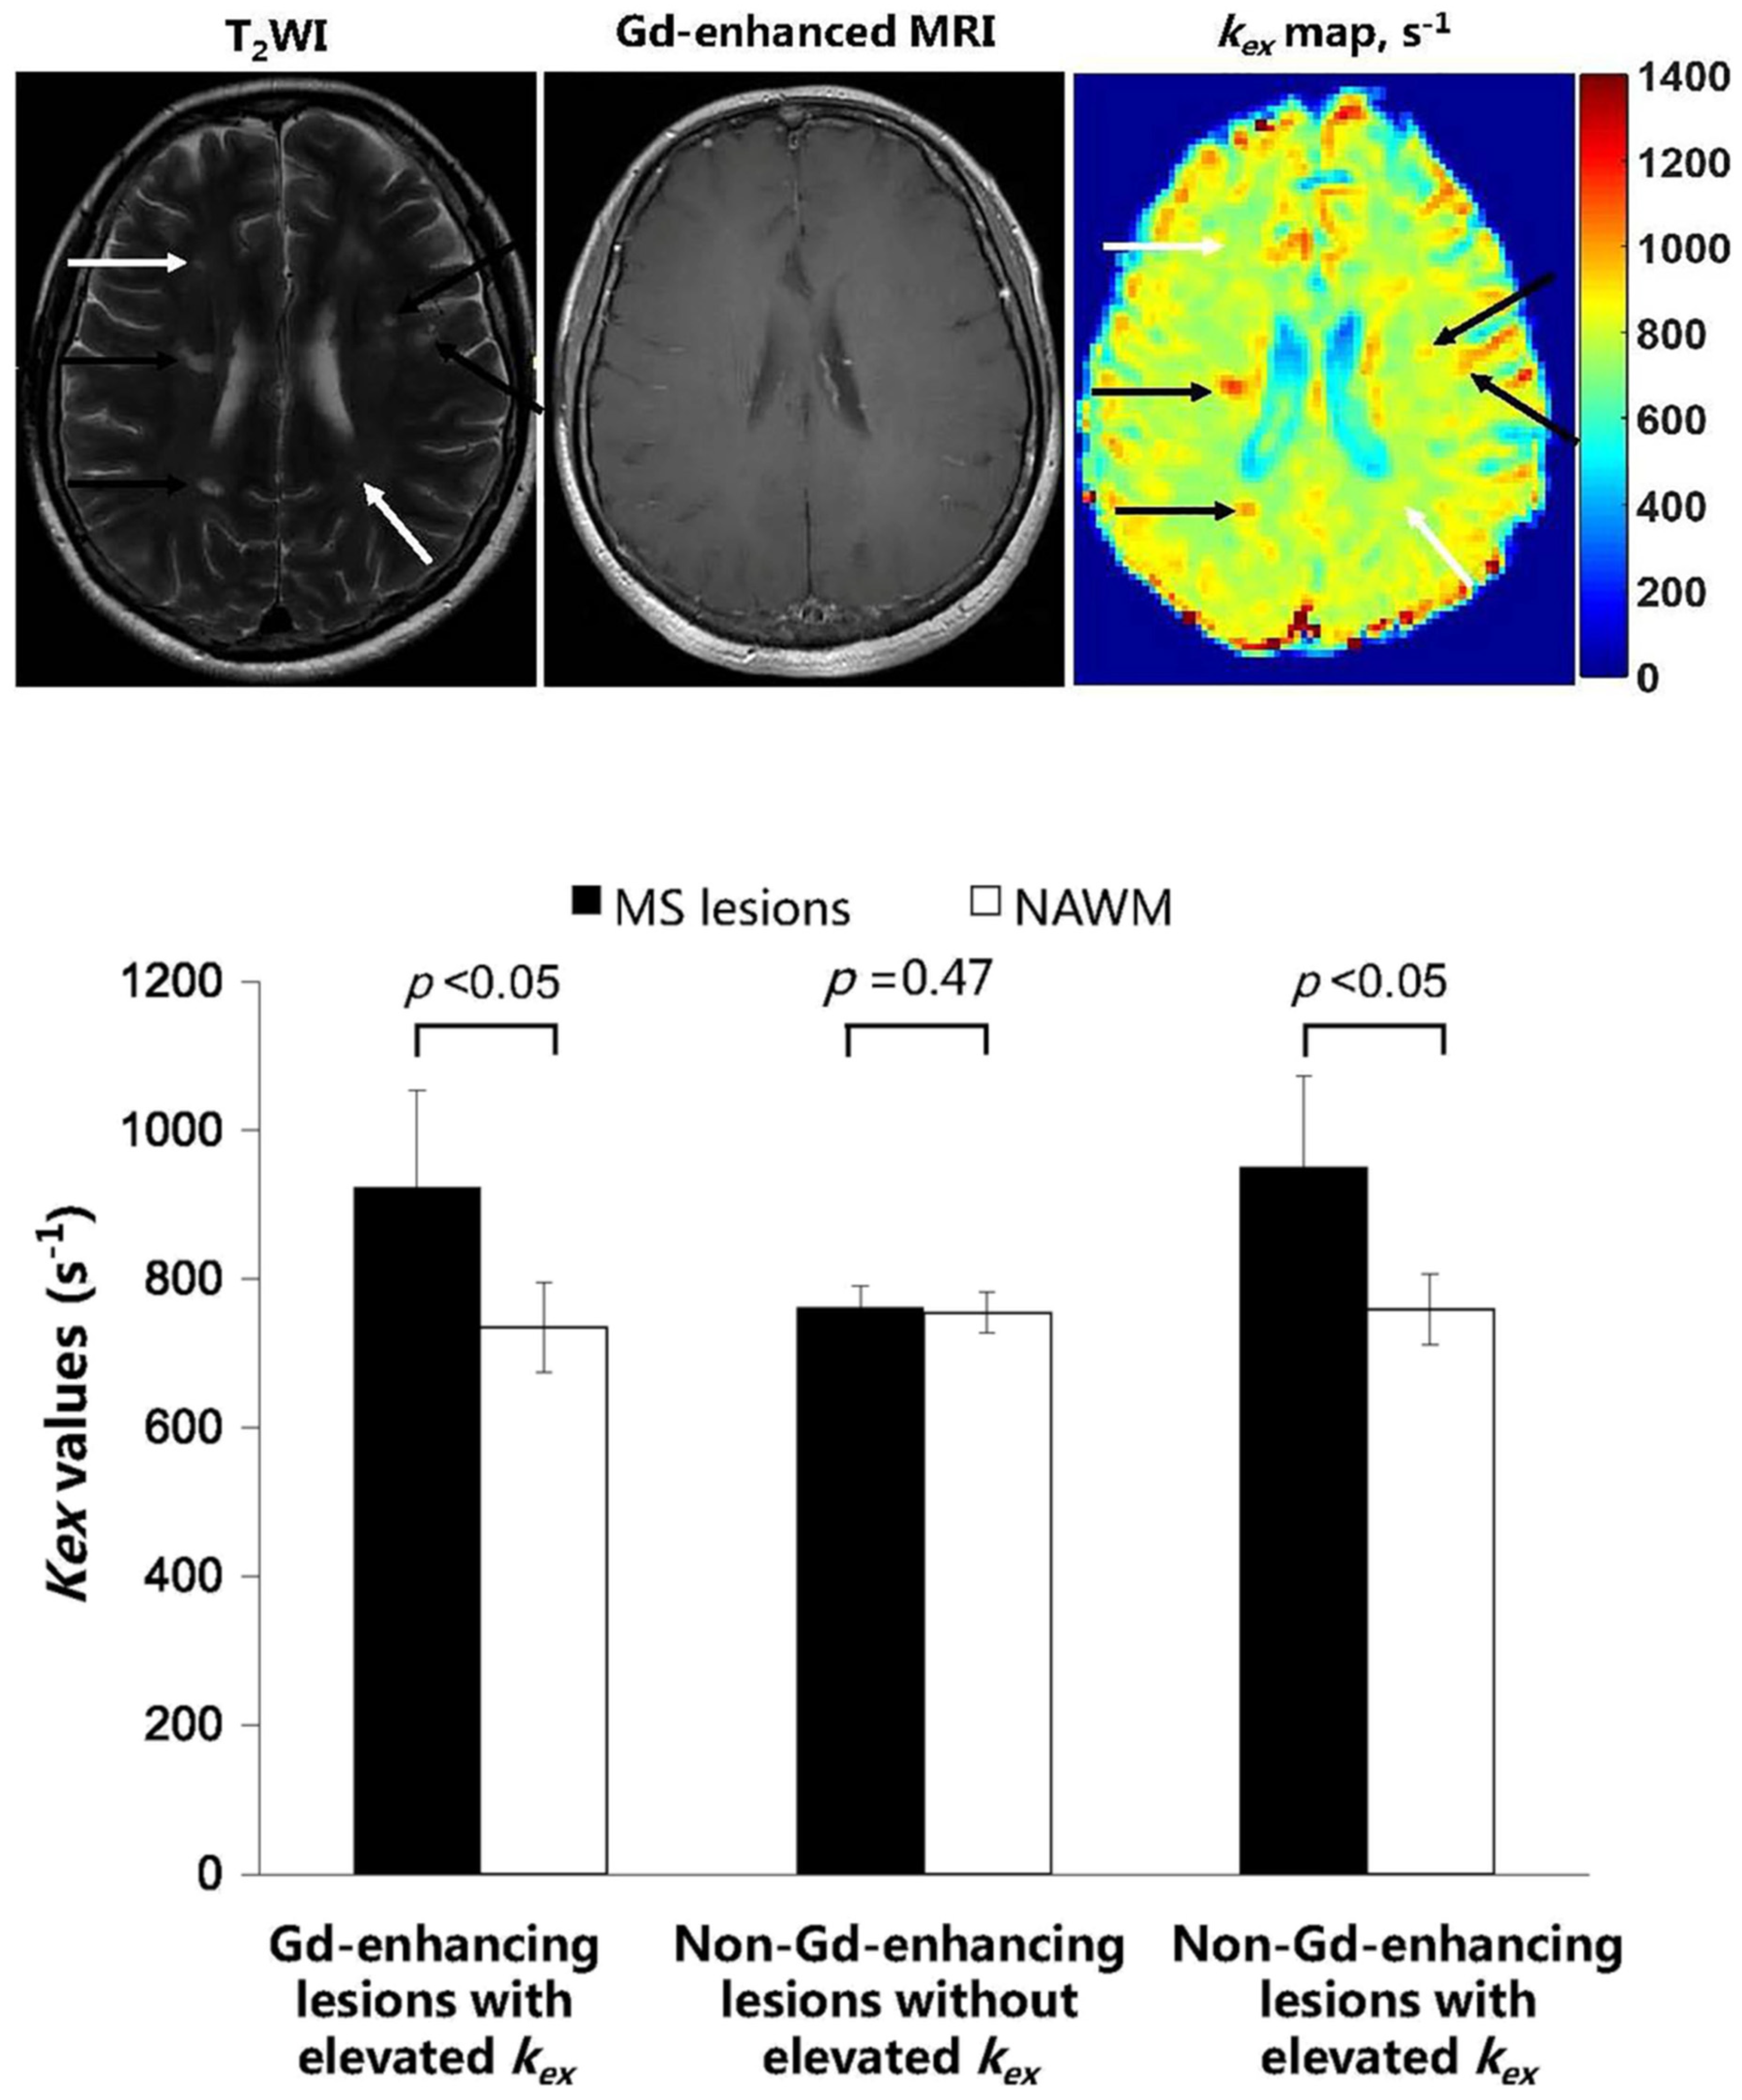
4.3. Detecting and Grading MS Lesions
5. Discussion
6. Challenges and Opportunities
7. Conclusions
Funding
Conflicts of Interest
References
- Zhou, J.Y.; Tryggestad, E.; Wen, Z.B.; Lal, B.; Zhou, T.T.; Grossman, R.; Wang, S.L.; Yan, K.; Fu, D.X.; Ford, E.; et al. Differentiation between glioma and radiation necrosis using molecular magnetic resonance imaging of endogenous proteins and peptides. Nat. Med. 2011, 17, 130–308. [Google Scholar] [CrossRef] [PubMed] [Green Version]
- Dula, A.N.; Asche, E.M.; Landman, B.A.; Welch, E.B.; Pawate, S.; Sriram, S.; Gore, J.C.; Smith, S.A. Development of chemical exchange saturation transfer at 7 T. Magn. Reson. Med. 2011, 66, 831–838. [Google Scholar] [CrossRef] [PubMed] [Green Version]
- Dula, A.N.; Smith, S.A.; Gore, J.C. Application of chemical exchange saturation transfer (CEST) MRI for endogenous contrast at 7 Tesla. J. Neuroimaging 2013, 23, 526–532. [Google Scholar] [CrossRef] [PubMed] [Green Version]
- By, S.; Barry, R.L.; Smith, A.K.; Lyttle, B.D.; Box, B.A.; Bagnato, F.R.; Pawate, S.; Smith, S.A. Amide proton transfer CEST of the cervical spinal cord in multiple sclerosis patients at 3T. Magn. Reson. Med. 2018, 79, 806–814. [Google Scholar] [CrossRef]
- Sartoretti, E.; Sartoretti, T.; Wyss, M.; Becker, A.S.; Schwenk, A.; van Smoorenburg, L.; Najafi, A.; Binkert, C.; Thoeny, H.C.; Zhou, J.; et al. Amide Proton Transfer Weighted Imaging Shows Differences in Multiple Sclerosis Lesions and White Matter Hyperintensities of Presumed Vascular Origin. Front. Neurol. 2019, 10, 1307. [Google Scholar] [CrossRef]
- van Zijl, P.C.; Jones, C.K.; Ren, J.; Malloy, C.R.; Sherry, A.D. MRI detection of glycogen in vivo by using chemical exchange saturation transfer imaging (glycoCEST). Proc. Natl. Acad. Sci. USA 2007, 104, 4359–4364. [Google Scholar] [CrossRef] [Green Version]
- Ling, W.; Regatte, R.R.; Navon, G.; Jerschow, A. Assessment of glycosaminoglycan concentration in vivo by chemical exchange-dependent saturation transfer (gagCEST). Proc. Natl. Acad. Sci. USA 2008, 105, 2266–2270. [Google Scholar] [CrossRef] [Green Version]
- Cai, K.; Haris, M.; Singh, A.; Kogan, F.; Greenberg, J.H.; Hariharan, H.; Detre, J.A.; Reddy, R. Magnetic resonance imaging of glutamate. Nat. Med. 2012, 18, 302–306. [Google Scholar] [CrossRef] [Green Version]
- Haris, M.; Nath, K.; Cai, K.; Singh, A.; Crescenzi, R.; Kogan, F.; Verma, G.; Reddy, S.; Hariharan, H.; Melhem, E.R.; et al. Imaging of glutamate neurotransmitter alterations in Alzheimer’s disease. NMR. Biomed. 2013, 26, 386–391. [Google Scholar] [CrossRef] [Green Version]
- Cai, K.; Singh, A.; Roalf, D.R.; Nanga, R.P.; Haris, M.; Hariharan, H.; Gur, R.; Reddy, R. Mapping glutamate in subcortical brain structures using high-resolution GluCEST MRI. NMR. Biomed. 2013, 26, 1278–1284. [Google Scholar] [CrossRef] [Green Version]
- Haris, M.; Cai, K.; Singh, A.; Hariharan, H.; Reddy, R. In vivo mapping of brain myo-inositol. Neuroimage 2011, 54, 2079–2085. [Google Scholar] [CrossRef] [PubMed] [Green Version]
- Haris, M.; Singh, A.; Cai, K.; Nath, K.; Crescenzi, R.; Kogan, F.; Hariharan, H.; Reddy, R. MICEST: A potential tool for non-invasive detection of molecular changes in Alzheimer’s disease. J. Neurosci. Methods 2013, 212, 87–93. [Google Scholar] [CrossRef] [PubMed] [Green Version]
- Cai, K.; Singh, A.; Poptani, H.; Li, W.; Yang, S.; Lu, Y.; Hariharan, H.; Zhou, X.J.; Reddy, R. CEST signal at 2ppm (CEST@2ppm) from Z-spectral fitting correlates with creatine distribution in brain tumor. NMR. Biomed. 2015, 28, 1–8. [Google Scholar] [CrossRef] [Green Version]
- Chen, L.; Zeng, H.; Xu, X.; Yadav, N.N.; Cai, S.; Puts, N.A.; Barker, P.B.; Li, T.; Weiss, R.G.; van Zijl, P.C.M.; et al. Investigation of the contribution of total creatine to the CEST Z-spectrum of brain using a knockout mouse model. NMR. Biomed. 2017, 30, e3834. [Google Scholar] [CrossRef]
- Singh, A.; Debnath, A.; Cai, K.; Bagga, P.; Haris, M.; Hariharan, H.; Reddy, R. Evaluating the feasibility of creatine-weighted CEST MRI in human brain at 7 T using a Z-spectral fitting approach. NMR. Biomed. 2019, 32, e4176. [Google Scholar] [CrossRef] [PubMed]
- Jones, C.K.; Huang, A.; Xu, J.; Edden, R.A.E.; Schar, M.; Hua, J.; Oskolkov, N.; Zaca, D.; Zhou, J.; McMahon, M.T.; et al. Nuclear Overhauser enhancement (NOE) imaging in the human brain at 7T. Neuroimage 2013, 77, 114–124. [Google Scholar] [CrossRef] [PubMed] [Green Version]
- Shaghaghi, M.; Chen, W.; Scotti, A.; Ye, H.; Zhang, Y.; Zhu, W.; Cai, K. In vivo quantification of proton exchange rate in healthy human brains with omega plot. Quant. Imaging. Med. Surg. 2019, 9, 1686–1696. [Google Scholar] [CrossRef]
- Mori, S.; Abeygunawardana, C.; van Zijl, P.C.; Berg, J.M. Water exchange filter with improved sensitivity (WEX II) to study solvent-exchangeable protons. Application to the consensus zinc finger peptide CP-1. J. Magn. Reson. B. 1996, 110, 96–101. [Google Scholar] [CrossRef]
- Haris, M.; Nanga, R.P.; Singh, A.; Cai, K.; Kogan, F.; Hariharan, H.; Reddy, R. Exchange rates of creatine kinase metabolites: Feasibility of imaging creatine by chemical exchange saturation transfer MRI. NMR. Biomed. 2012, 25, 1305–1309. [Google Scholar] [CrossRef]
- McMahon, M.T.; Gilad, A.A.; Zhou, J.; Sun, P.Z.; Bulte, J.W.; van Zijl, P.C. Quantifying exchange rates in chemical exchange saturation transfer agents using the saturation time and saturation power dependencies of the magnetization transfer effect on the magnetic resonance imaging signal (QUEST and QUESP): Ph calibration for poly-L-lysine and a starburst dendrimer. Magn. Reson. Med. 2006, 55, 836–847. [Google Scholar] [CrossRef] [Green Version]
- Woessner, D.E.; Zhang, S.; Merritt, M.E.; Sherry, A.D. Numerical solution of the Bloch equations provides insights into the optimum design of PARACEST agents for MRI. Magn. Reson. Med. 2005, 53, 790–799. [Google Scholar] [CrossRef] [PubMed]
- Zhou, Z.; Han, P.; Zhou, B.; Christodoulou, A.G.; Shaw, J.L.; Deng, Z.; Li, D. Chemical exchange saturation transfer fingerprinting for exchange rate quantification. Magn. Reson. Med. 2018, 80, 1352–1363. [Google Scholar] [CrossRef]
- Heo, H.Y.; Han, Z.; Jiang, S.; Schar, M.; van Zijl, P.C.M.; Zhou, J. Quantifying amide proton exchange rate and concentration in chemical exchange saturation transfer imaging of the human brain. Neuroimage 2019, 189, 202–213. [Google Scholar] [CrossRef]
- Chen, L.Q.; Howison, C.M.; Jeffery, J.J.; Robey, I.F.; Kuo, P.H.; Pagel, M.D. Evaluations of extracellular pH within in vivo tumors using acidoCEST MRI. Magn. Reson. Med. 2014, 72, 1408–1417. [Google Scholar] [CrossRef] [PubMed] [Green Version]
- Dixon, W.T.; Ren, J.; Lubag, A.J.; Ratnakar, J.; Vinogradov, E.; Hancu, I.; Lenkinski, R.E.; Sherry, A.D. A concentration-independent method to measure exchange rates in PARACEST agents. Magn. Reson. Med. 2010, 63, 625–632. [Google Scholar] [CrossRef] [PubMed] [Green Version]
- Randtke, E.A.; Chen, L.Q.; Pagel, M.D. The reciprocal linear QUEST analysis method facilitates the measurements of chemical exchange rates with CEST MRI. Contrast. Media. Mol. Imaging 2014, 9, 252–258. [Google Scholar] [CrossRef] [Green Version]
- Zhang, S.; Merritt, M.; Woessner, D.E.; Lenkinski, R.E.; Sherry, A.D. PARACEST agents: Modulating MRI contrast via water proton exchange. Acc. Chem. Res. 2003, 36, 783–790. [Google Scholar] [CrossRef]
- McMahon, M.T.; Gilad, A.A.; DeLiso, M.A.; Cromer Berman, S.M.; Bulte, J.W.; van Zijl, P.C. New “multicolor” polypeptide diamagnetic chemical exchange saturation transfer (DIACEST) contrast agents for MRI. Magn. Reson. Med. Off. J. Int. Soc. Magn. Reson. Med. 2008, 60, 803–812. [Google Scholar] [CrossRef] [Green Version]
- Vinogradov, E.; Sherry, A.D.; Lenkinski, R.E. CEST: From basic principles to applications, challenges and opportunities. J. Magn. Reson. 2013, 229, 155–172. [Google Scholar] [CrossRef] [Green Version]
- Sun, P.Z.; Wang, Y.; Dai, Z.; Xiao, G.; Wu, R. Quantitative chemical exchange saturation transfer (qCEST) MRI--RF spillover effect-corrected omega plot for simultaneous determination of labile proton fraction ratio and exchange rate. Contrast. Media. Mol. Imaging 2014, 9, 268–275. [Google Scholar] [CrossRef]
- van Zijl, P.C.M.; Yadav, N.N. Chemical exchange saturation transfer (CEST): What is in a name and what isn’t? Magn. Reson. Med. 2011, 65, 927–948. [Google Scholar] [CrossRef] [PubMed] [Green Version]
- Zhou, J.; Wilson, D.A.; Sun, P.Z.; Klaus, J.A.; Van Zijl, P.C.M. Quantitative description of proton exchange processes between water and endogenous and exogenous agents for WEX, CEST, and APT experiments. Magn. Reson. Med. 2004, 51, 945–952. [Google Scholar] [CrossRef] [PubMed]
- Snoussi, K.; Bulte, J.W.M.; Gueron, M.; van Zijl, P.C.M. Sensitive CEST agents based on nucleic acid imino proton exchange: Detection of poly(rU) and of a dendrimer-poly(rU) model for nucleic acid delivery and pharmacology. Magn. Reson. Med. 2003, 49, 998–1005. [Google Scholar] [CrossRef] [PubMed]
- Zhou, J.Y.; Payen, J.F.; Wilson, D.A.; Traystman, R.J.; van Zijl, P.C.M. Using the amide proton signals of intracellular proteins and peptides to detect pH effects in MRI. Nat. Med. 2003, 9, 1085–1090. [Google Scholar] [CrossRef]
- Zaiss, M.S.B.; Stieltjes, B.; Bachert, P. Enhancement of MT and CEST contrast via Heuristic fitting of Z-spectra. In Proceedings of the 20th Annual Meeting ISMRM, Melbourne, Australia, 6 May 2012; p. 5136. [Google Scholar]
- Desmond, K.L.; Moosvi, F.; Stanisz, G.J. Mapping of Amide, Amine, and Aliphatic Peaks in the CEST Spectra of Murine Xenografts at 7 T. Magn. Reson. Med. 2014, 71, 1841–1853. [Google Scholar] [CrossRef]
- Cai, K.; Tain, R.-W.; Zhou, X.J.; Damen, F.C.; Scotti, A.M.; Hariharan, H.; Poptani, H.; Reddy, R. Creatine CEST MRI for differentiating gliomas with different degrees of aggressiveness. Mol. Imaging Biol. 2017, 19, 225–232. [Google Scholar] [CrossRef] [Green Version]
- Bie, C.Y.L.; Chen, Y.; Zhang, L.; Song, X.; He, X. Progressive Registration for Dynamic Salicylate Enhancement (DSE) Image in Chemical Exchange Saturation Transfer (CEST) MRI. In Proceedings of the 7th International Workshop on Chemical Exchange Saturation Transfer (CEST) Imaging, Beijing, China, 7–10 August 2022. [Google Scholar]
- Wu, R.; Xiao, G.; Zhou, I.Y.; Ran, C.; Sun, P.Z. Quantitative chemical exchange saturation transfer (qCEST) MRI–omega plot analysis of RF-spillover-corrected inverse CEST ratio asymmetry for simultaneous determination of labile proton ratio and exchange rate. NMR. Biomed. 2015, 28, 376–383. [Google Scholar] [CrossRef] [Green Version]
- Wang, Z.; Shaghaghi, M.; Zhang, S.; Zhang, G.; Zhou, Y.; Wu, D.; Zhang, Z.; Zhu, W.; Cai, K. Novel proton exchange rate MRI presents unique contrast in brains of ischemic stroke patients. J. Neurosci. Methods. 2020, 346, 108926. [Google Scholar] [CrossRef]
- Ye, H.; Shaghaghi, M.; Chen, Q.; Zhang, Y.; Lutz, S.E.; Chen, W.; Cai, K. In Vivo Proton Exchange Rate (kex) MRI for the Characterization of Multiple Sclerosis Lesions in Patients. J. Magn. Reson. Imaging 2020, 53, 408–415. [Google Scholar] [CrossRef]
- Thompson, A.J.; Banwell, B.L.; Barkhof, F.; Carroll, W.M.; Coetzee, T.; Comi, G.; Correale, J.; Fazekas, F.; Filippi, M.; Freedman, M.S. Diagnosis of multiple sclerosis: 2017 revisions of the McDonald criteria. Lancet. Neurol. 2018, 17, 162–173. [Google Scholar] [CrossRef]
- Frischer, J.M.; Weigand, S.D.; Guo, Y.; Kale, N.; Parisi, J.E.; Pirko, I.; Mandrekar, J.; Bramow, S.; Metz, I.; Brück, W. Clinical and pathological insights into the dynamic nature of the white matter multiple sclerosis plaque. Ann. Neurol. 2015, 78, 710–721. [Google Scholar] [CrossRef] [Green Version]
- Bauckneht, M.; Capitanio, S.; Raffa, S.; Roccatagliata, L.; Pardini, M.; Lapucci, C.; Marini, C.; Sambuceti, G.; Inglese, M.; Gallo, P.; et al. Molecular imaging of multiple sclerosis: From the clinical demand to novel radiotracers. EJNMMI. Radiopharm. Chem. 2019, 4, 6. [Google Scholar] [CrossRef] [PubMed] [Green Version]
- Wu, C.; Wang, C.; Popescu, D.C.; Zhu, W.; Somoza, E.A.; Zhu, J.; Condie, A.G.; Flask, C.A.; Miller, R.H.; Macklin, W.; et al. A novel PET marker for in vivo quantification of myelination. Bioorg. Med. Chem. 2010, 18, 8592–8599. [Google Scholar] [CrossRef] [PubMed] [Green Version]
- Bodini, B.; Veronese, M.; Garcia-Lorenzo, D.; Battaglini, M.; Poirion, E.; Chardain, A.; Freeman, L.; Louapre, C.; Tchikviladze, M.; Papeix, C.; et al. Dynamic Imaging of Individual Remyelination Profiles in Multiple Sclerosis. Ann. Neurol. 2016, 79, 726–738. [Google Scholar] [CrossRef] [PubMed] [Green Version]
- Vomacka, L.; Albert, N.L.; Lindner, S.; Unterrainer, M.; Mahler, C.; Brendel, M.; Ermoschkin, L.; Gosewisch, A.; Brunegraf, A.; Buckley, C.; et al. TSPO imaging using the novel PET ligand [(18)F]GE-180: Quantification approaches in patients with multiple sclerosis. EJNMMI. Res. 2017, 7, 89. [Google Scholar] [CrossRef] [Green Version]
- Dalton, C.M.; Brex, P.A.; Miszkiel, K.A.; Fernando, K.; MacManus, D.G.; Plant, G.T.; Thompson, A.J.; Miller, D.H. New T2 lesions enable an earlier diagnosis of multiple sclerosis in clinically isolated syndromes. Ann. Neurol. 2003, 53, 673–676. [Google Scholar] [CrossRef]
- McDonald, W.I.; Compston, A.; Edan, G.; Goodkin, D.; Hartung, H.P.; Lublin, F.D.; McFarland, H.F.; Paty, D.W.; Polman, C.H.; Reingold, S.C.; et al. Recommended diagnostic criteria for multiple sclerosis: Guidelines from the International Panel on the diagnosis of multiple sclerosis. Ann. Neurol. 2001, 50, 121–127. [Google Scholar] [CrossRef]
- Bagnato, F.; Jeffries, N.; Richert, N.D.; Stone, R.D.; Ohayon, J.M.; McFarland, H.F.; Frank, J.A. Evolution of T1 black holes in patients with multiple sclerosis imaged monthly for 4 years. Brain. 2003, 126, 1782–1789. [Google Scholar] [CrossRef] [Green Version]
- Kearney, H.; Miller, D.H.; Ciccarelli, O. Spinal cord MRI in multiple sclerosis--diagnostic, prognostic and clinical value. Nat. Rev. Neurol. 2015, 11, 327–338. [Google Scholar] [CrossRef]
- Cotton, F.; Weiner, H.L.; Jolesz, F.A.; Guttmann, C.R. MRI contrast uptake in new lesions in relapsing-remitting MS followed at weekly intervals. Neurology 2003, 60, 640–646. [Google Scholar] [CrossRef]
- He, J.; Grossman, R.I.; Ge, Y.; Mannon, L.J. Enhancing patterns in multiple sclerosis: Evolution and persistence. AJNR. Am. J. Neuroradiol. 2001, 22, 664–669. [Google Scholar] [PubMed]
- Kaunzner, U.W.; Kang, Y.; Zhang, S.; Morris, E.; Yao, Y.; Pandya, S.; Hurtado Rua, S.M.; Park, C.; Gillen, K.M.; Nguyen, T.D.; et al. Quantitative susceptibility mapping identifies inflammation in a subset of chronic multiple sclerosis lesions. Brain. A. J. Neurol. 2019, 142, 133–145. [Google Scholar] [CrossRef] [PubMed] [Green Version]
- Elliott, C.; Belachew, S.; Wolinsky, J.S.; Hauser, S.L.; Kappos, L.; Barkhof, F.; Bernasconi, C.; Fecker, J.; Model, F.; Wei, W.; et al. Chronic white matter lesion activity predicts clinical progression in primary progressive multiple sclerosis. Brain. A. J. Neurol. 2019, 142, 2787–2799. [Google Scholar] [CrossRef] [PubMed] [Green Version]
- Elliott, C.; Wolinsky, J.S.; Hauser, S.L.; Kappos, L.; Barkhof, F.; Bernasconi, C.; Wei, W.; Belachew, S.; Arnold, D.L. Slowly expanding/evolving lesions as a magnetic resonance imaging marker of chronic active multiple sclerosis lesions. Mult. Scler. 2018, 25, 1915–1925. [Google Scholar] [CrossRef] [PubMed] [Green Version]
- Matthews, P.M. Chronic inflammation in multiple sclerosis—Seeing what was always there. Nat. Rev. Neurol. 2019, 15, 582–593. [Google Scholar] [CrossRef]
- Tommasin, S.; Giannì, C.; De Giglio, L.; Pantano, P. Neuroimaging techniques to assess inflammation in multiple sclerosis. Neuroscience 2019, 403, 4–16. [Google Scholar] [CrossRef]
- Gulani, V.; Webb, A.G.; Duncan, I.D.; Lauterbur, P.C. Apparent diffusion tensor measurements in myelin-deficient rat spinal cords. Magn. Reson. Med. 2001, 45, 191–195. [Google Scholar] [CrossRef]
- Klawiter, E.C.; Schmidt, R.E.; Trinkaus, K.; Liang, H.F.; Budde, M.D.; Naismith, R.T.; Song, S.K.; Cross, A.H.; Benzinger, T.L. Radial diffusivity predicts demyelination in ex vivo multiple sclerosis spinal cords. Neuroimage 2011, 55, 1454–1460. [Google Scholar] [CrossRef] [Green Version]
- Valsasina, P.; Rocca, M.A.; Agosta, F.; Benedetti, B.; Horsfield, M.A.; Gallo, A.; Rovaris, M.; Comi, G.; Filippi, M. Mean diffusivity and fractional anisotropy histogram analysis of the cervical cord in MS patients. Neuroimage 2005, 26, 822–828. [Google Scholar] [CrossRef]
- MacKay, A.; Whittall, K.; Adler, J.; Li, D.; Paty, D.; Graeb, D. In vivo visualization of myelin water in brain by magnetic resonance. Magn. Reson. Med. 1994, 31, 673–677. [Google Scholar] [CrossRef]
- Horch, R.A.; Gore, J.C.; Does, M.D. Origins of the ultrashort-T2 1H NMR signals in myelinated nerve: A direct measure of myelin content? Magn. Reson. Med. 2011, 66, 24–31. [Google Scholar] [CrossRef] [PubMed] [Green Version]
- Laule, C.; Leung, E.; Lis, D.K.; Traboulsee, A.L.; Paty, D.W.; MacKay, A.L.; Moore, G.R. Myelin water imaging in multiple sclerosis: Quantitative correlations with histopathology. Mult. Scler. 2006, 12, 747–753. [Google Scholar] [CrossRef]
- Sheth, V.; Shao, H.; Chen, J.; Vandenberg, S.; Corey-Bloom, J.; Bydder, G.M.; Du, J. Magnetic resonance imaging of myelin using ultrashort Echo time (UTE) pulse sequences: Phantom, specimen, volunteer and multiple sclerosis patient studies. Neuroimage 2016, 136, 37–44. [Google Scholar] [CrossRef] [PubMed] [Green Version]
- Weiger, M.; Froidevaux, R.; Baadsvik, E.L.; Brunner, D.O.; Rosler, M.B.; Pruessmann, K.P. Advances in MRI of the myelin bilayer. Neuroimage 2020, 217, 116888. [Google Scholar] [CrossRef] [PubMed]
- Wisnieff, C.; Ramanan, S.; Olesik, J.; Gauthier, S.; Wang, Y.; Pitt, D. Quantitative susceptibility mapping (QSM) of white matter multiple sclerosis lesions: Interpreting positive susceptibility and the presence of iron. Magn. Reson. Med. 2015, 74, 564–570. [Google Scholar] [CrossRef] [PubMed] [Green Version]
- Fernando, K.T.; Tozer, D.J.; Miszkiel, K.A.; Gordon, R.M.; Swanton, J.K.; Dalton, C.M.; Barker, G.J.; Plant, G.T.; Thompson, A.J.; Miller, D.H. Magnetization transfer histograms in clinically isolated syndromes suggestive of multiple sclerosis. Brain 2005, 128, 2911–2925. [Google Scholar] [CrossRef] [PubMed]
- Schmierer, K.; Scaravilli, F.; Altmann, D.R.; Barker, G.J.; Miller, D.H. Magnetization transfer ratio and myelin in postmortem multiple sclerosis brain. Ann. Neurol. 2004, 56, 407–415. [Google Scholar] [CrossRef]
- Rausch, M.; Hiestand, P.; Baumann, D.; Cannet, C.; Rudin, M. MRI-based monitoring of inflammation and tissue damage in acute and chronic relapsing EAE. Magn. Reson. Med. 2003, 50, 309–314. [Google Scholar] [CrossRef]
- Ge, Y.; Grossman, R.I.; Udupa, J.K.; Babb, J.S.; Kolson, D.L.; McGowan, J.C. Magnetization transfer ratio histogram analysis of gray matter in relapsing-remitting multiple sclerosis. AJNR. Am. J. Neuroradiol. 2001, 22, 470–475. [Google Scholar]
- Caramanos, Z.; Narayanan, S.; Arnold, D.L. 1H-MRS quantification of tNA and tCr in patients with multiple sclerosis: A meta-analytic review. Brain 2005, 128, 2483–2506. [Google Scholar] [CrossRef] [Green Version]
- MacMillan, E.L.; Tam, R.; Zhao, Y.; Vavasour, I.M.; Li, D.K.; Oger, J.; Freedman, M.S.; Kolind, S.H.; Traboulsee, A.L. Progressive multiple sclerosis exhibits decreasing glutamate and glutamine over two years. Mult. Scler. 2016, 22, 112–116. [Google Scholar] [CrossRef] [PubMed] [Green Version]
- Kirov, I.I.; Tal, A.; Babb, J.S.; Herbert, J.; Gonen, O. Serial proton MR spectroscopy of gray and white matter in relapsing-remitting MS. Neurology 2013, 80, 39–46. [Google Scholar] [CrossRef] [PubMed] [Green Version]
- Liu, T.; Chen, Y.; Thomas, A.M.; Song, X. CEST MRI with distribution-based analysis for assessment of early stage disease activity in a mouse model of multiple sclerosis: An initial study. NMR. Biomed. 2019, 32, e4139. [Google Scholar] [CrossRef]
- Nathoo, N.; Yong, V.W.; Dunn, J.F. Understanding disease processes in multiple sclerosis through magnetic resonance imaging studies in animal models. Neuroimage Clin. 2014, 4, 743–756. [Google Scholar] [CrossRef] [PubMed] [Green Version]
- Perazella, M.A. Current status of gadolinium toxicity in patients with kidney disease. Clin. J. Am. Soc. Nephrol. 2009, 4, 461–469. [Google Scholar] [CrossRef] [PubMed] [Green Version]
- Kanda, T.; Ishii, K.; Kawaguchi, H.; Kitajima, K.; Takenaka, D. High signal intensity in the dentate nucleus and globus pallidus on unenhanced T1-weighted MR images: Relationship with increasing cumulative dose of a gadolinium-based contrast material. Radiology 2014, 270, 834–841. [Google Scholar] [CrossRef] [Green Version]
- Mehta, V.; Pei, W.; Yang, G.; Li, S.; Swamy, E.; Boster, A.; Schmalbrock, P.; Pitt, D. Iron is a sensitive biomarker for inflammation in multiple sclerosis lesions. PLoS ONE 2013, 8, e57573. [Google Scholar] [CrossRef]
- Liu, G.; Song, X.; Chan, K.W.; McMahon, M.T. Nuts and bolts of chemical exchange saturation transfer MRI. NMR. Biomed. 2013, 26, 810–828. [Google Scholar] [CrossRef]
- Wu, B.; Warnock, G.; Zaiss, M.; Lin, C.; Chen, M.; Zhou, Z.; Mu, L.; Nanz, D.; Tuura, R.; Delso, G. An overview of CEST MRI for non-MR physicists. EJNMMI. Phys. 2016, 3, 1–21. [Google Scholar] [CrossRef] [Green Version]
- Tain, R.W.; Scotti, A.M.; Cai, K. Improving the detection specificity of endogenous MRI for reactive oxygen species (ROS). J. Magn. Reson. Imaging 2019, 50, 583–591. [Google Scholar] [CrossRef]
- Tietze, A.; Blicher, J.; Mikkelsen, I.K.; Østergaard, L.; Strother, M.K.; Smith, S.A.; Donahue, M.J. Assessment of ischemic penumbra in patients with hyperacute stroke using amide proton transfer (APT) chemical exchange saturation transfer (CEST) MRI. NMR. Biomed. 2014, 27, 163–174. [Google Scholar] [CrossRef] [PubMed] [Green Version]
- Karaszewski, B.; Wardlaw, J.M.; Marshall, I.; Cvoro, V.; Wartolowska, K.; Haga, K.; Armitage, P.A.; Bastin, M.E.; Dennis, M.S. Measurement of brain temperature with magnetic resonance spectroscopy in acute ischemic stroke. Ann. Neurol. 2006, 60, 438–446. [Google Scholar] [CrossRef] [PubMed]
- Graham, S.H.; Chen, J.; Sharp, F.R.; Simon, R.P. Limiting ischemic injury by inhibition of excitatory amino acid release. J. Cereb. Blood. Flow. Metab. 1993, 13, 88–97. [Google Scholar] [CrossRef] [Green Version]
- Kimberly, W.T.; Wang, Y.; Pham, L.; Furie, K.L.; Gerszten, R.E. Metabolite profiling identifies a branched chain amino acid signature in acute cardioembolic stroke. Stroke 2013, 44, 1389–1395. [Google Scholar] [CrossRef] [PubMed] [Green Version]
- Melani, A.; Pantoni, L.; Corsi, C.; Bianchi, L.; Monopoli, A.; Bertorelli, R.; Pepeu, G.; Pedata, F. Striatal outflow of adenosine, excitatory amino acids, γ-aminobutyric acid, and taurine in awake freely moving rats after middle cerebral artery occlusion: Correlations with neurological deficit and histopathological damage. Stroke 1999, 30, 2448–2455. [Google Scholar] [CrossRef]
- Pascual, J.M.; Carceller, F.; Roda, J.M.; Cerdán, S. Glutamate, glutamine, and GABA as substrates for the neuronal and glial compartments after focal cerebral ischemia in rats. Stroke 1998, 29, 1048–1057. [Google Scholar] [CrossRef] [Green Version]
- Yang, M.; Wang, S.; Hao, F.; Li, Y.; Tang, H.; Shi, X. NMR analysis of the rat neurochemical changes induced by middle cerebral artery occlusion. Talanta 2012, 88, 136–144. [Google Scholar] [CrossRef]
- Alessandro Scotti, R.-W.T.; Li, W.; Zhou, X.J.; Cai, K. ROS detection by endogenous contrast MRI: Specificity and translational premises. In Proceedings of the 26th ISMRM, Honolulu, HI, USA, 22–24 April 2017. [Google Scholar]
- Tain, R.W.; Scotti, A.M.; Li, W.G.; Zhou, X.J.; Cai, K.J. Imaging short-lived reactive oxygen species (ROS) with endogenous contrast MRI. J. Magn. Reson. Imaging 2018, 47, 222–229. [Google Scholar] [CrossRef]
- Chan, P.H. Reactive oxygen radicals in signaling and damage in the ischemic brain. J. Cereb. Blood. Flow. Metab. 2001, 21, 2–14. [Google Scholar] [CrossRef]
- Haider, L.; Fischer, M.T.; Frischer, J.M.; Bauer, J.; Höftberger, R.; Botond, G.; Esterbauer, H.; Binder, C.J.; Witztum, J.L.; Lassmann, H. Oxidative damage in multiple sclerosis lesions. Brain 2011, 134, 1914–1924. [Google Scholar] [CrossRef] [Green Version]
- Su, C.; Xu, S.; Lin, D.; He, H.; Chen, Z.; Damen, F.C.; Ke, C.; Lv, X.; Cai, K. Multi-parametric Z-spectral MRI may have a good performance for glioma stratification in clinical patients. Eur. Radiol. 2022, 32, 101–111. [Google Scholar] [CrossRef] [PubMed]
- Zhang, J.; Zhu, W.; Tain, R.; Zhou, X.J.; Cai, K. Improved Differentiation of Low-Grade and High-Grade Gliomas and Detection of Tumor Proliferation Using APT Contrast Fitted from Z-Spectrum. Mol. Imaging Biol. 2018, 20, 623–631. [Google Scholar] [CrossRef] [PubMed]


Publisher’s Note: MDPI stays neutral with regard to jurisdictional claims in published maps and institutional affiliations. |
© 2022 by the authors. Licensee MDPI, Basel, Switzerland. This article is an open access article distributed under the terms and conditions of the Creative Commons Attribution (CC BY) license (https://creativecommons.org/licenses/by/4.0/).
Share and Cite
Shaghaghi, M.; Cai, K. Toward In Vivo MRI of the Tissue Proton Exchange Rate in Humans. Biosensors 2022, 12, 815. https://doi.org/10.3390/bios12100815
Shaghaghi M, Cai K. Toward In Vivo MRI of the Tissue Proton Exchange Rate in Humans. Biosensors. 2022; 12(10):815. https://doi.org/10.3390/bios12100815
Chicago/Turabian StyleShaghaghi, Mehran, and Kejia Cai. 2022. "Toward In Vivo MRI of the Tissue Proton Exchange Rate in Humans" Biosensors 12, no. 10: 815. https://doi.org/10.3390/bios12100815