In Silico Investigation of SNR and Dermis Sensitivity for Optimum Dual-Channel Near-Infrared Glucose Sensor Designs for Different Skin Colors


Abstract
:1. Introduction
2. Methods
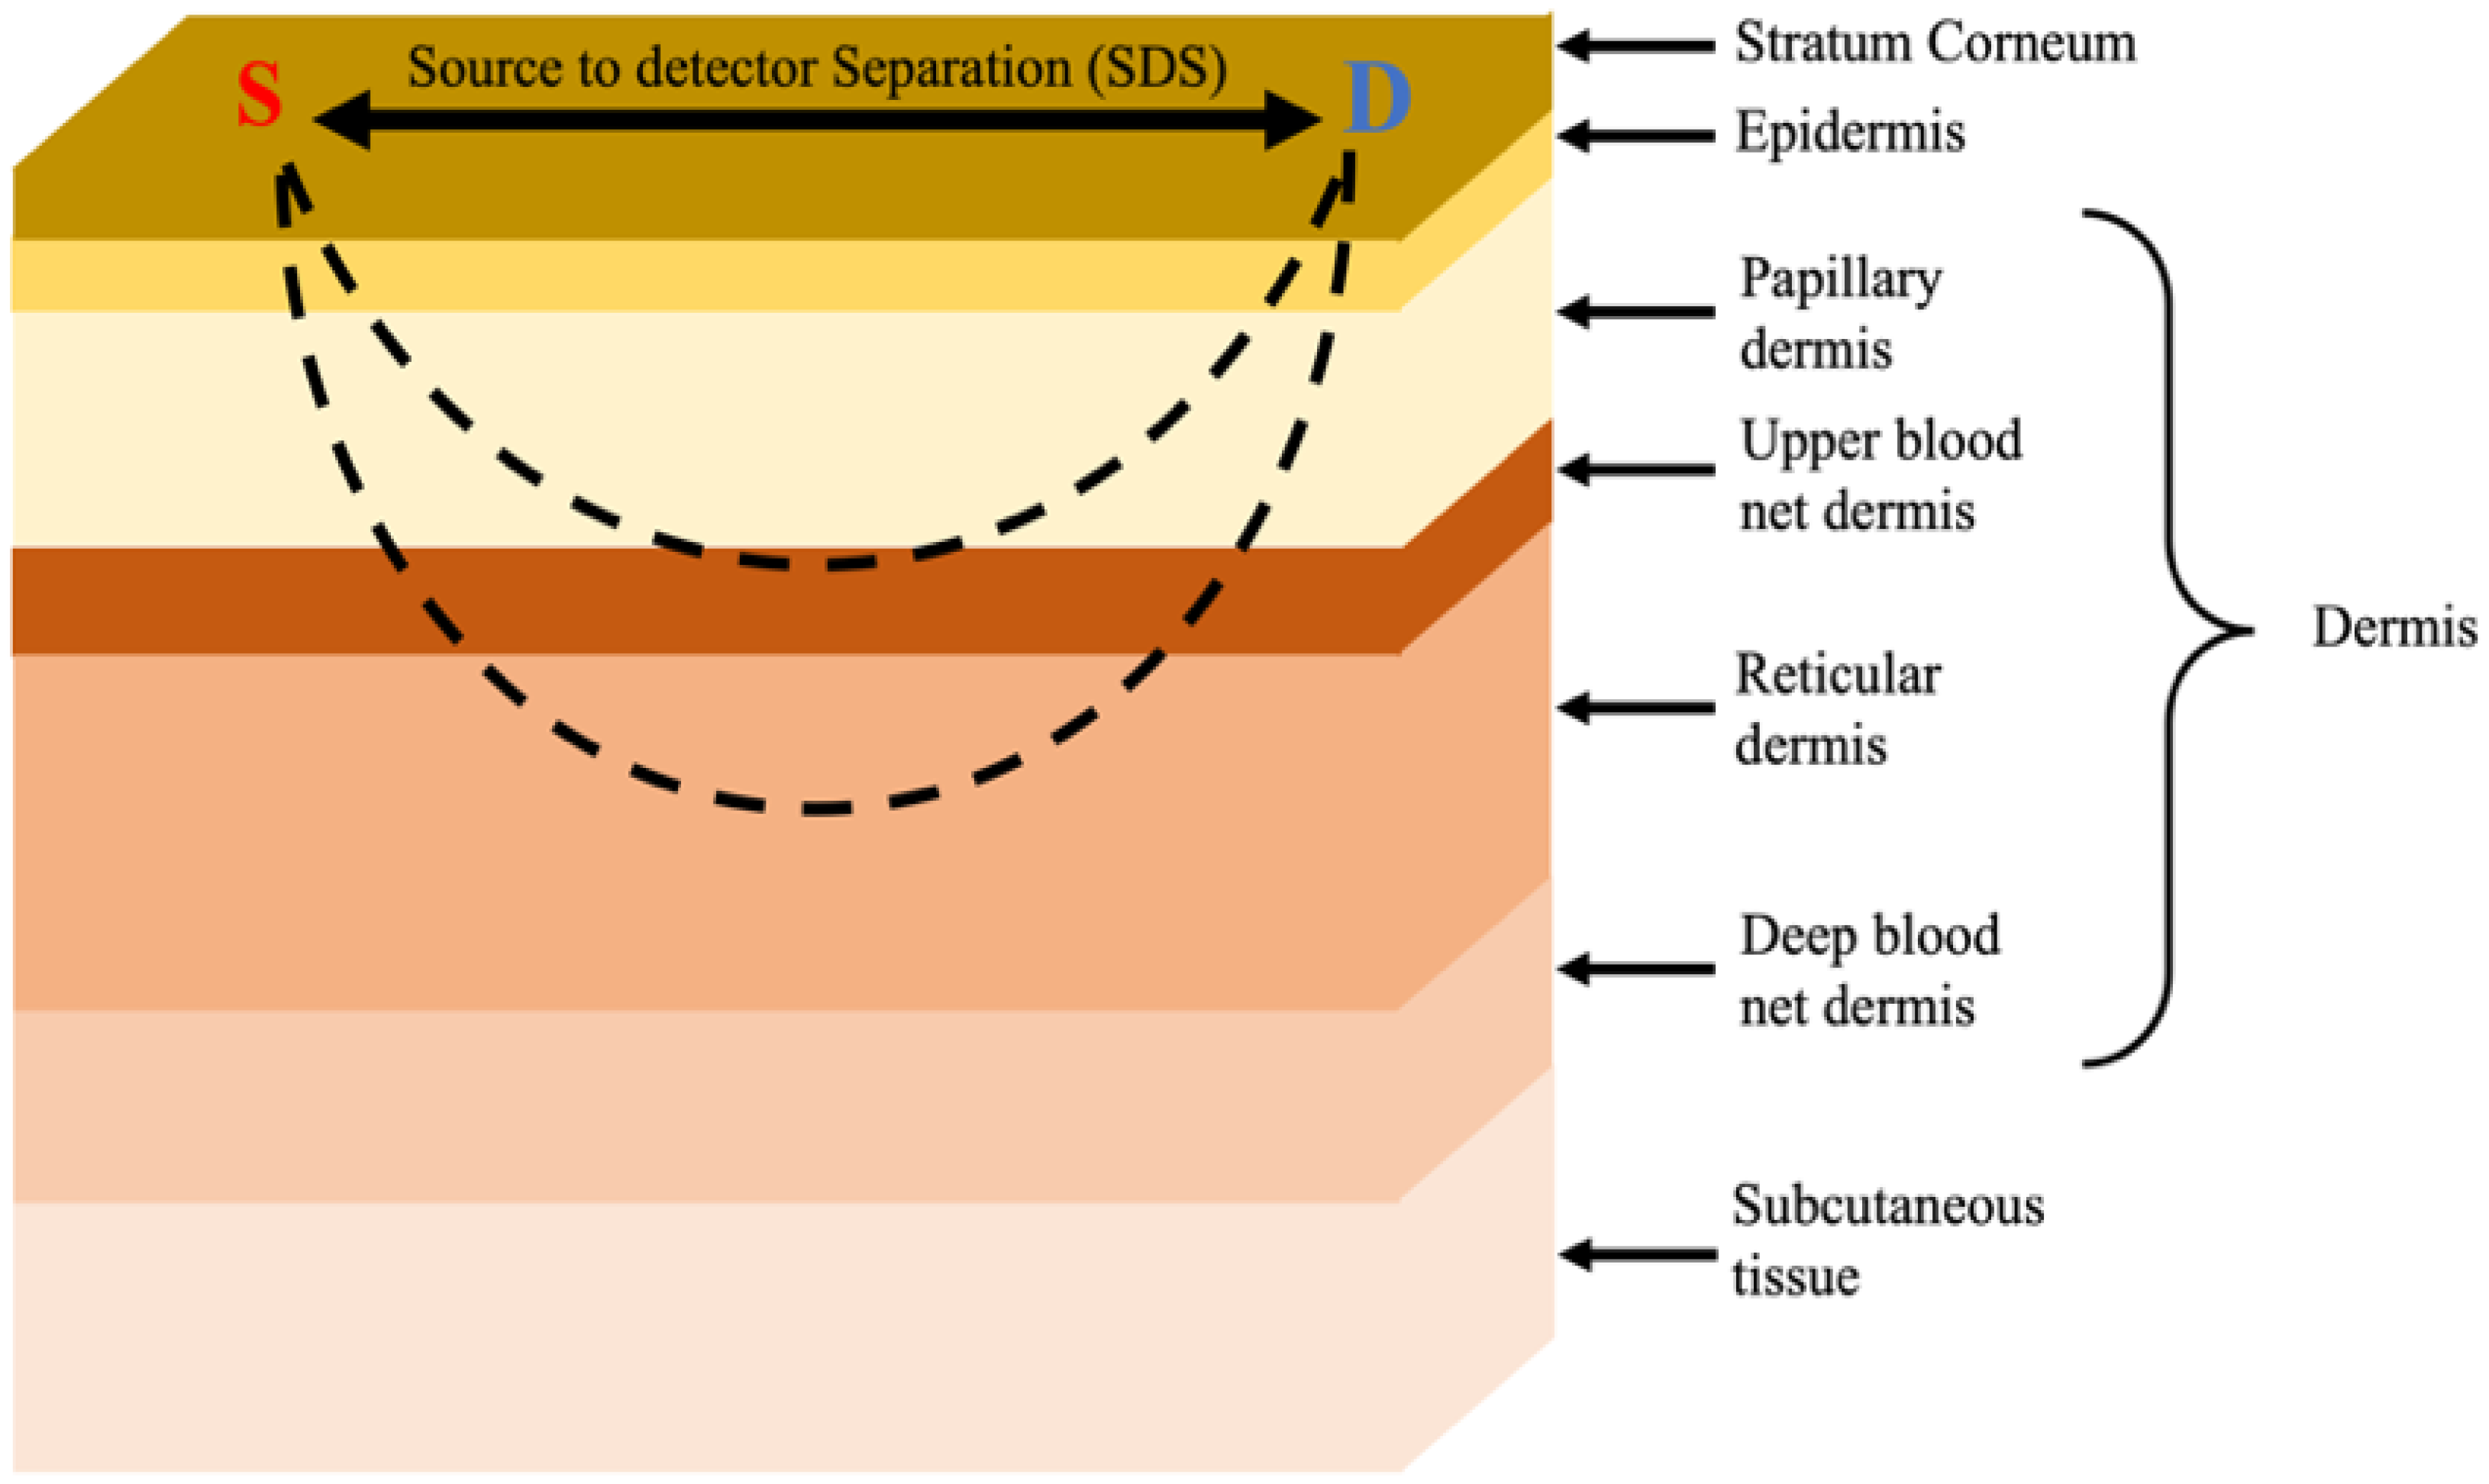
Monte Carlo Skin Model
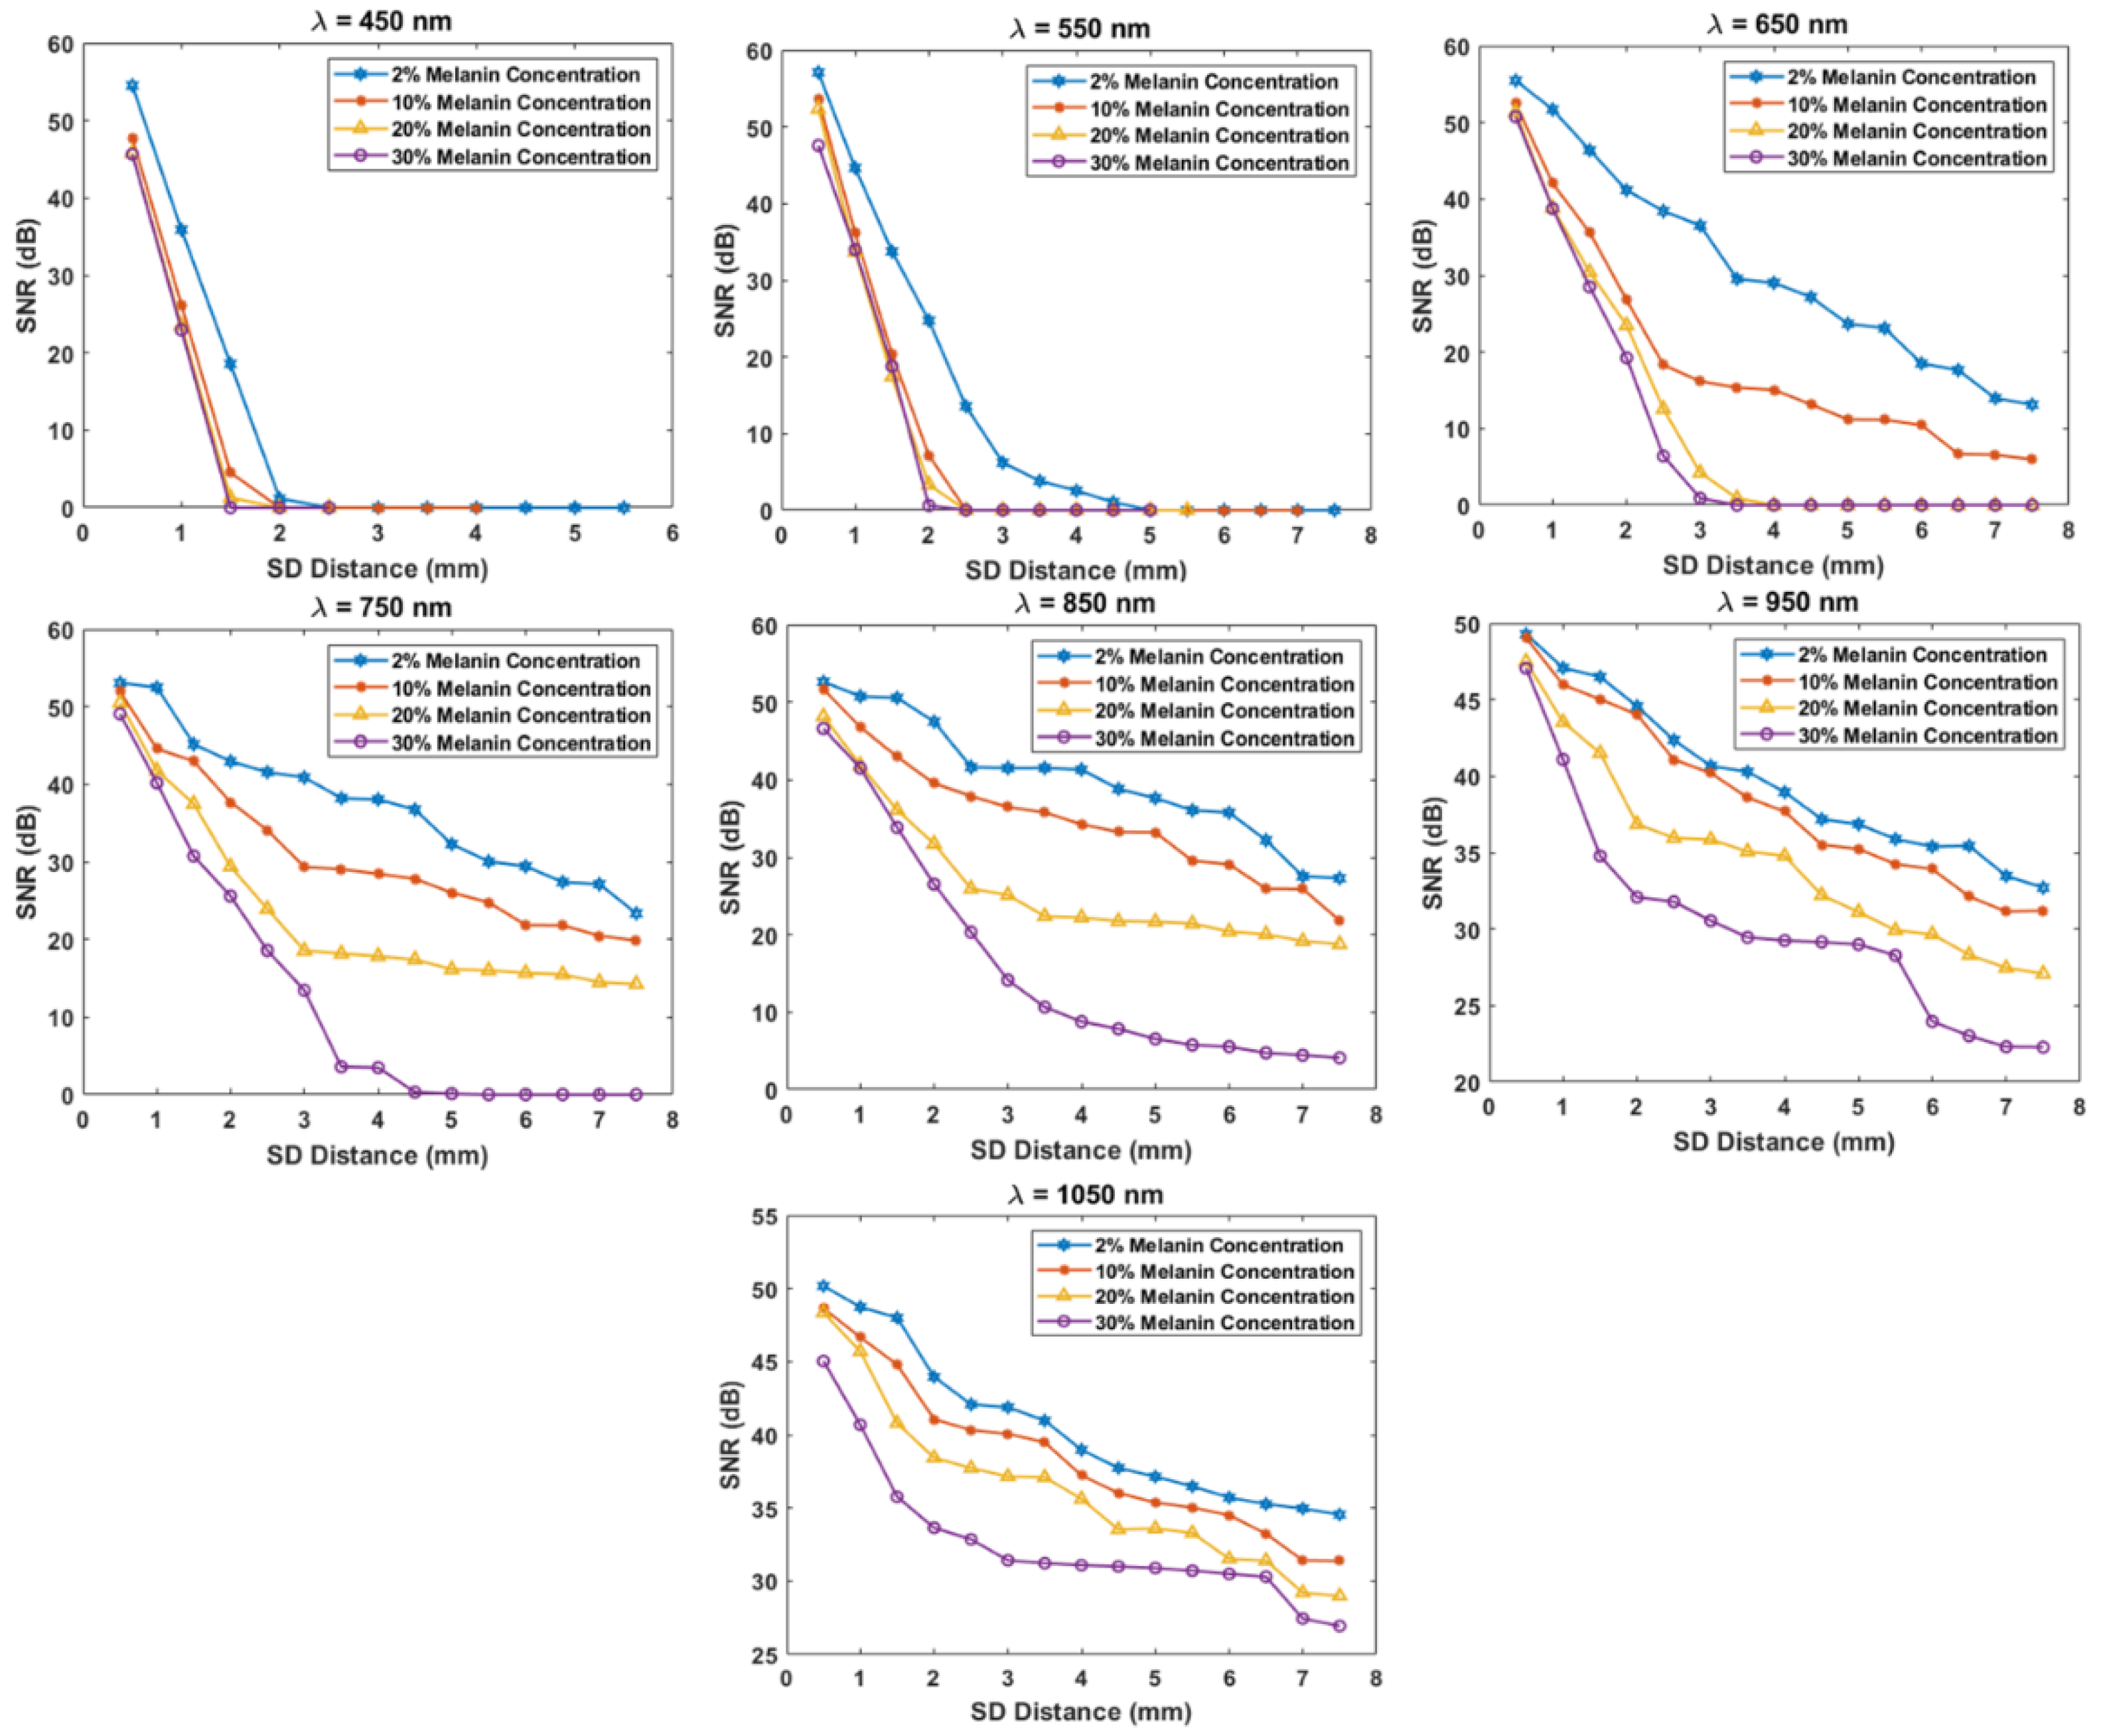
3. Results and Discussion
4. Conclusions
Funding
Institutional Review Board Statement
Informed Consent Statement
Data Availability Statement
Conflicts of Interest
References
- Zekri, M.; Dinani, S.; Kamali, M. Regulation of blood glucose concentration in type 1 diabetics using single order sliding mode control combined with fuzzy on-line tunable gain, a simulation study. J. Med. Signals Sens. 2015, 5, 131–140. [Google Scholar] [CrossRef] [PubMed]
- Tang, L.; Chang, S.J.; Chen, C.-J.; Liu, J.-T. Non-Invasive Blood Glucose Monitoring Technology: A Review. Sensors 2020, 20, 6925. [Google Scholar] [CrossRef] [PubMed]
- Wang, J. Electrochemical Glucose Biosensors. Chem. Rev. 2008, 108, 814–825. [Google Scholar] [CrossRef] [PubMed]
- Keenan, D.B.; Mastrototaro, J.J.; Voskanyan, G.; Steil, G.M. Delays in Minimally Invasive Continuous Glucose Monitoring Devices: A Review of Current Technology. J. Diabetes Sci. Technol. 2009, 3, 1207–1214. [Google Scholar] [CrossRef]
- Chen, C.; Xie, Q.; Yang, D.; Xiao, H.; Fu, Y.; Tan, Y.; Yao, S. Recent advances in electrochemical glucose biosensors: A review. RSC Adv. 2013, 3, 4473–4491. [Google Scholar] [CrossRef]
- Ajjan, R.; Slattery, D.; Wright, E. Continuous Glucose Monitoring: A Brief Review for Primary Care Practitioners. Adv. Ther. 2019, 36, 579–596. [Google Scholar] [CrossRef]
- Li, K.; Daniels, J.; Liu, C.; Herrero-Vinas, P.; Georgiou, P. Convolutional Recurrent Neural Networks for Glucose Prediction. IEEE J. Biomed. Health Inform. 2020, 24, 603–613. [Google Scholar] [CrossRef]
- Shang, T.; Zhang, J.Y.; Thomas, A.; Arnold, M.A.; Vetter, B.N.; Heinemann, L.; Klonoff, D.C. Products for Monitoring Glucose Levels in the Human Body With Noninvasive Optical, Noninvasive Fluid Sampling, or Minimally Invasive Technologies. J. Diabetes Sci. Technol. 2022, 16, 168–214. [Google Scholar] [CrossRef]
- Jernelv, I.L.; Milenko, K.; Fuglerud, S.S.; Hjelme, D.R.; Ellingsen, R.; Aksnes, A. A review of optical methods for continuous glucose monitoring. Appl. Spectrosc. Rev. 2019, 54, 543–572. [Google Scholar] [CrossRef]
- Alsunaidi, B.; Althobaiti, M.; Tamal, M.; Albaker, W.; Al-Naib, I. A Review of Non-Invasive Optical Systems for Continuous Blood Glucose Monitoring. Sensors 2021, 21, 6820. [Google Scholar] [CrossRef]
- Sim, J.Y.; Ahn, C.-G.; Jeong, E.-J.; Kim, B.K. In vivo Microscopic Photoacoustic Spectroscopy for Non-Invasive Glucose Monitoring Invulnerable to Skin Secretion Products. Sci. Rep. 2018, 8, 1059. [Google Scholar] [CrossRef] [PubMed]
- Phan, Q.-H.; Lo, Y.-L. Differential Mueller matrix polarimetry technique for non-invasive measurement of glucose concentration on human fingertip. Opt. Express 2017, 25, 15179–15187. [Google Scholar] [CrossRef] [PubMed]
- Chen, T.-L.; Lo, Y.-L.; Liao, C.-C.; Phan, Q.-H. Noninvasive measurement of glucose concentration on human fingertip by optical coherence tomography. J. Biomed. Opt. 2018, 23, 047001. [Google Scholar] [CrossRef]
- Abd Salam, N.A.; Saad, W.H.M.; Manap, Z.; Salehuddin, F. The Evolution of Non-invasive Blood Glucose Monitoring System for Personal Application. J. Telecommun. Electron. Comput. Eng. 2016, 8, 59–65. [Google Scholar]
- Naseer, N.; Hong, K.-S. fNIRS-based brain-computer interfaces: A review. Front. Hum. Neurosci. 2015, 9, 3. [Google Scholar] [CrossRef] [PubMed]
- Althobaiti, M.; Al-Naib, I. Recent Developments in Instrumentation of Functional Near-Infrared Spectroscopy Systems. Appl. Sci. 2020, 10, 6522. [Google Scholar] [CrossRef]
- Vavadi, H.; Mostafa, A.; Zhou, F.; Uddin, K.M.S.; Althobaiti, M.; Xu, C.; Bansal, R.; Ademuyiwa, F.; Poplack, S.; Zhu, Q. Compact ultrasound-guided diffuse optical tomography system for breast cancer imaging. J. Biomed. Opt. 2018, 24, 21203–21209. [Google Scholar] [CrossRef]
- Fang, Q.; Selb, J.; Carp, S.A.; Boverman, G.; Miller, E.L.; Brooks, D.H.; Moore, R.H.; Kopans, D.B.; Boas, D.A. Combined Optical and X-ray Tomosynthesis Breast Imaging. Radiology 2011, 258, 89–97. [Google Scholar] [CrossRef]
- Althobaiti, M.; Vavadi, H.; Zhu, Q. An Automated Preprocessing Method for Diffuse Optical Tomography to Improve Breast Cancer Diagnosis. Technol. Cancer Res. Treat. 2018, 17, 1533033818802791. [Google Scholar] [CrossRef]
- Rachim, V.P.; Chung, W.-Y. Wearable-band type visible-near infrared optical biosensor for non-invasive blood glucose monitoring. Sens. Actuators B Chem. 2019, 286, 173–180. [Google Scholar] [CrossRef]
- Haxha, S.; Jhoja, J. Optical Based Noninvasive Glucose Monitoring Sensor Prototype. IEEE Photon. J. 2016, 8, 6805911. [Google Scholar] [CrossRef] [Green Version]
- Srichan, C.; Srichan, W.; Danvirutai, P.; Ritsongmuang, C.; Sharma, A.; Anutrakulchai, S. Non-invasively accuracy enhanced blood glucose sensor using shallow dense neural networks with NIR monitoring and medical features. Sci. Rep. 2022, 12, 1769. [Google Scholar] [CrossRef] [PubMed]
- Qu, J.Y.; Wilson, B.C. Monte Carlo modeling studies of the effect of physiological factors andother analytes on the determination of glucose concentration in vivoby near infrared optical absorption and scattering measurements. J. Biomed. Opt. 1997, 2, 319–325. [Google Scholar] [CrossRef] [PubMed]
- Kessoku, S.; Maruo, K.; Okawa, S.; Masamoto, K.; Yamada, Y. Influence of blood glucose level on the scattering coefficient of the skin in near-infrared spectroscopy. In Proceedings of the ASME/JSME 2011 8th Thermal Engineering Joint Conference (AJTEC2011), Honolulu, HI, USA, 13–17 March 2011. [Google Scholar]
- Tarumi, M.; Shimada, M.; Murakami, T.; Tamura, M.; Shimada, M.; Arimoto, H.; Yamada, Y. Simulation study of in vitro glucose measurement by NIR spectroscopy and a method of error reduction. Phys. Med. Biol. 2003, 48, 2373–2390. [Google Scholar] [CrossRef] [PubMed]
- Althobaiti, M.; Al-Naib, I. Optimization of Dual-Channel Near-Infrared Non-Invasive Glucose Level Measurement Sensors Based On Monte-Carlo Simulations. IEEE Photon. J. 2021, 13, 3700109. [Google Scholar] [CrossRef]
- Jacques, S.L. Optical properties of biological tissues: A review. Phys. Med. Biol. 2013, 58, R37–R61. [Google Scholar] [CrossRef]
- Keiser, G. Biophotonics: Concepts to Applications; Springer: Singapore, 2016. [Google Scholar]
- Meglinski, I.; Matcher, S. Computer simulation of the skin reflectance spectra. Comput. Methods Programs Biomed. 2003, 70, 179–186. [Google Scholar] [CrossRef]
- Chatterjee, S.; Budidha, K.; Qassem, M.; Kyriacou, P.A. In-silico investigation towards the non-invasive optical detection of blood lactate. Sci. Rep. 2021, 11, 14274. [Google Scholar] [CrossRef]
- Chatterjee, S.; Budidha, K.; Kyriacou, P.A. Investigating the origin of photoplethysmography using a multiwavelength Monte Carlo model. Physiol. Meas. 2020, 41, 084001. [Google Scholar] [CrossRef]
- Petrov, G.I.; Doronin, A.; Whelan, H.T.; Meglinski, I.; Yakovlev, V.V. Human tissue color as viewed in high dynamic range optical spectral transmission measurements. Biomed. Opt. Express 2012, 3, 2154–2161. [Google Scholar] [CrossRef]
- Fang, Q.; Boas, D.A. Monte Carlo Simulation of Photon Migration in 3D Turbid Media Accelerated by Graphics Processing Units. Opt. Express 2009, 17, 20178–20190. [Google Scholar] [CrossRef] [PubMed] [Green Version]
- Yan, S.; Fang, Q. Hybrid mesh and voxel based Monte Carlo algorithm for accurate and efficient photon transport modeling in complex bio-tissues. Biomed. Opt. Express 2020, 11, 6262–6270. [Google Scholar] [CrossRef] [PubMed]
- Yao, R.; Intes, X.; Fang, Q. Direct approach to compute Jacobians for diffuse optical tomography using perturbation Monte Carlo-based photon “replay”. Biomed. Opt. Express 2018, 9, 4588–4603. [Google Scholar] [CrossRef]
- Delbeck, S.; Vahlsing, T.; Leonhardt, S.; Steiner, G.; Heise, H.M. Non-invasive monitoring of blood glucose using optical methods for skin spectroscopy—Opportunities and recent advances. Anal. Bioanal. Chem. 2019, 411, 63–77. [Google Scholar] [CrossRef] [PubMed]
- Saidi, I.S. Transcutaneous Optical Measurement of Hyperbilirubinemia in Neonates. Ph.D. Thesis, Rice University, Houston, TX, USA, 1992. [Google Scholar]
- Nishidate, I.; Aizu, Y.; Mishina, H. Estimation of melanin and hemoglobin in skin tissue using multiple regression analysis aided by Monte Carlo simulation. J. Biomed. Opt. 2004, 9, 700–710. [Google Scholar] [CrossRef]
- Jacques, S.L.; Glickman, R.D.; Schwartz, J.A. Internal absorption coefficient and threshold for pulsed laser disruption of melanosomes isolated from retinal pigment epithelium. In SPIE—The International Society for Optical Engineering, Proceedings of the Laser-Tissue Interaction VII, San Jose, CA, USA, 27 January–2 February 1996; SPIE: Bellingham WA, USA, 1996; Volume 2681. [Google Scholar] [CrossRef]
- Brigadoi, S.; Cooper, R. How short is short? Optimum source–detector distance for short-separation channels in functional near-infrared spectroscopy. Neurophotonics 2015, 2, 025005. [Google Scholar] [CrossRef] [PubMed]
- Yuan, Y.; Yu, L.; Doğan, Z.; Fang, Q. Graphics processing units-accelerated adaptive nonlocal means filter for denoising three-dimensional Monte Carlo photon transport simulations. J. Biomed. Opt. 2018, 23, 121618. [Google Scholar] [CrossRef]


| Skin Layer | Vblood | Thickness (mm) | |
|---|---|---|---|
| Stratum corneum | 0 | 0.05 | 0.02 mm |
| Epidermis | 0 | 0.2 | 0.25 mm |
| Papillary dermis | 0.04 | 0.5 | 0.1 mm |
| Upper blood net dermis | 0.3 | 0.6 | 0.08 mm |
| Reticular dermis | 0.04 | 0.7 | 0.2 mm |
| Deep blood net dermis | 0.1 | 0.7 | 0.3 mm |
| Subcutaneous tissue | 0.05 | 0.7 | 2 mm |
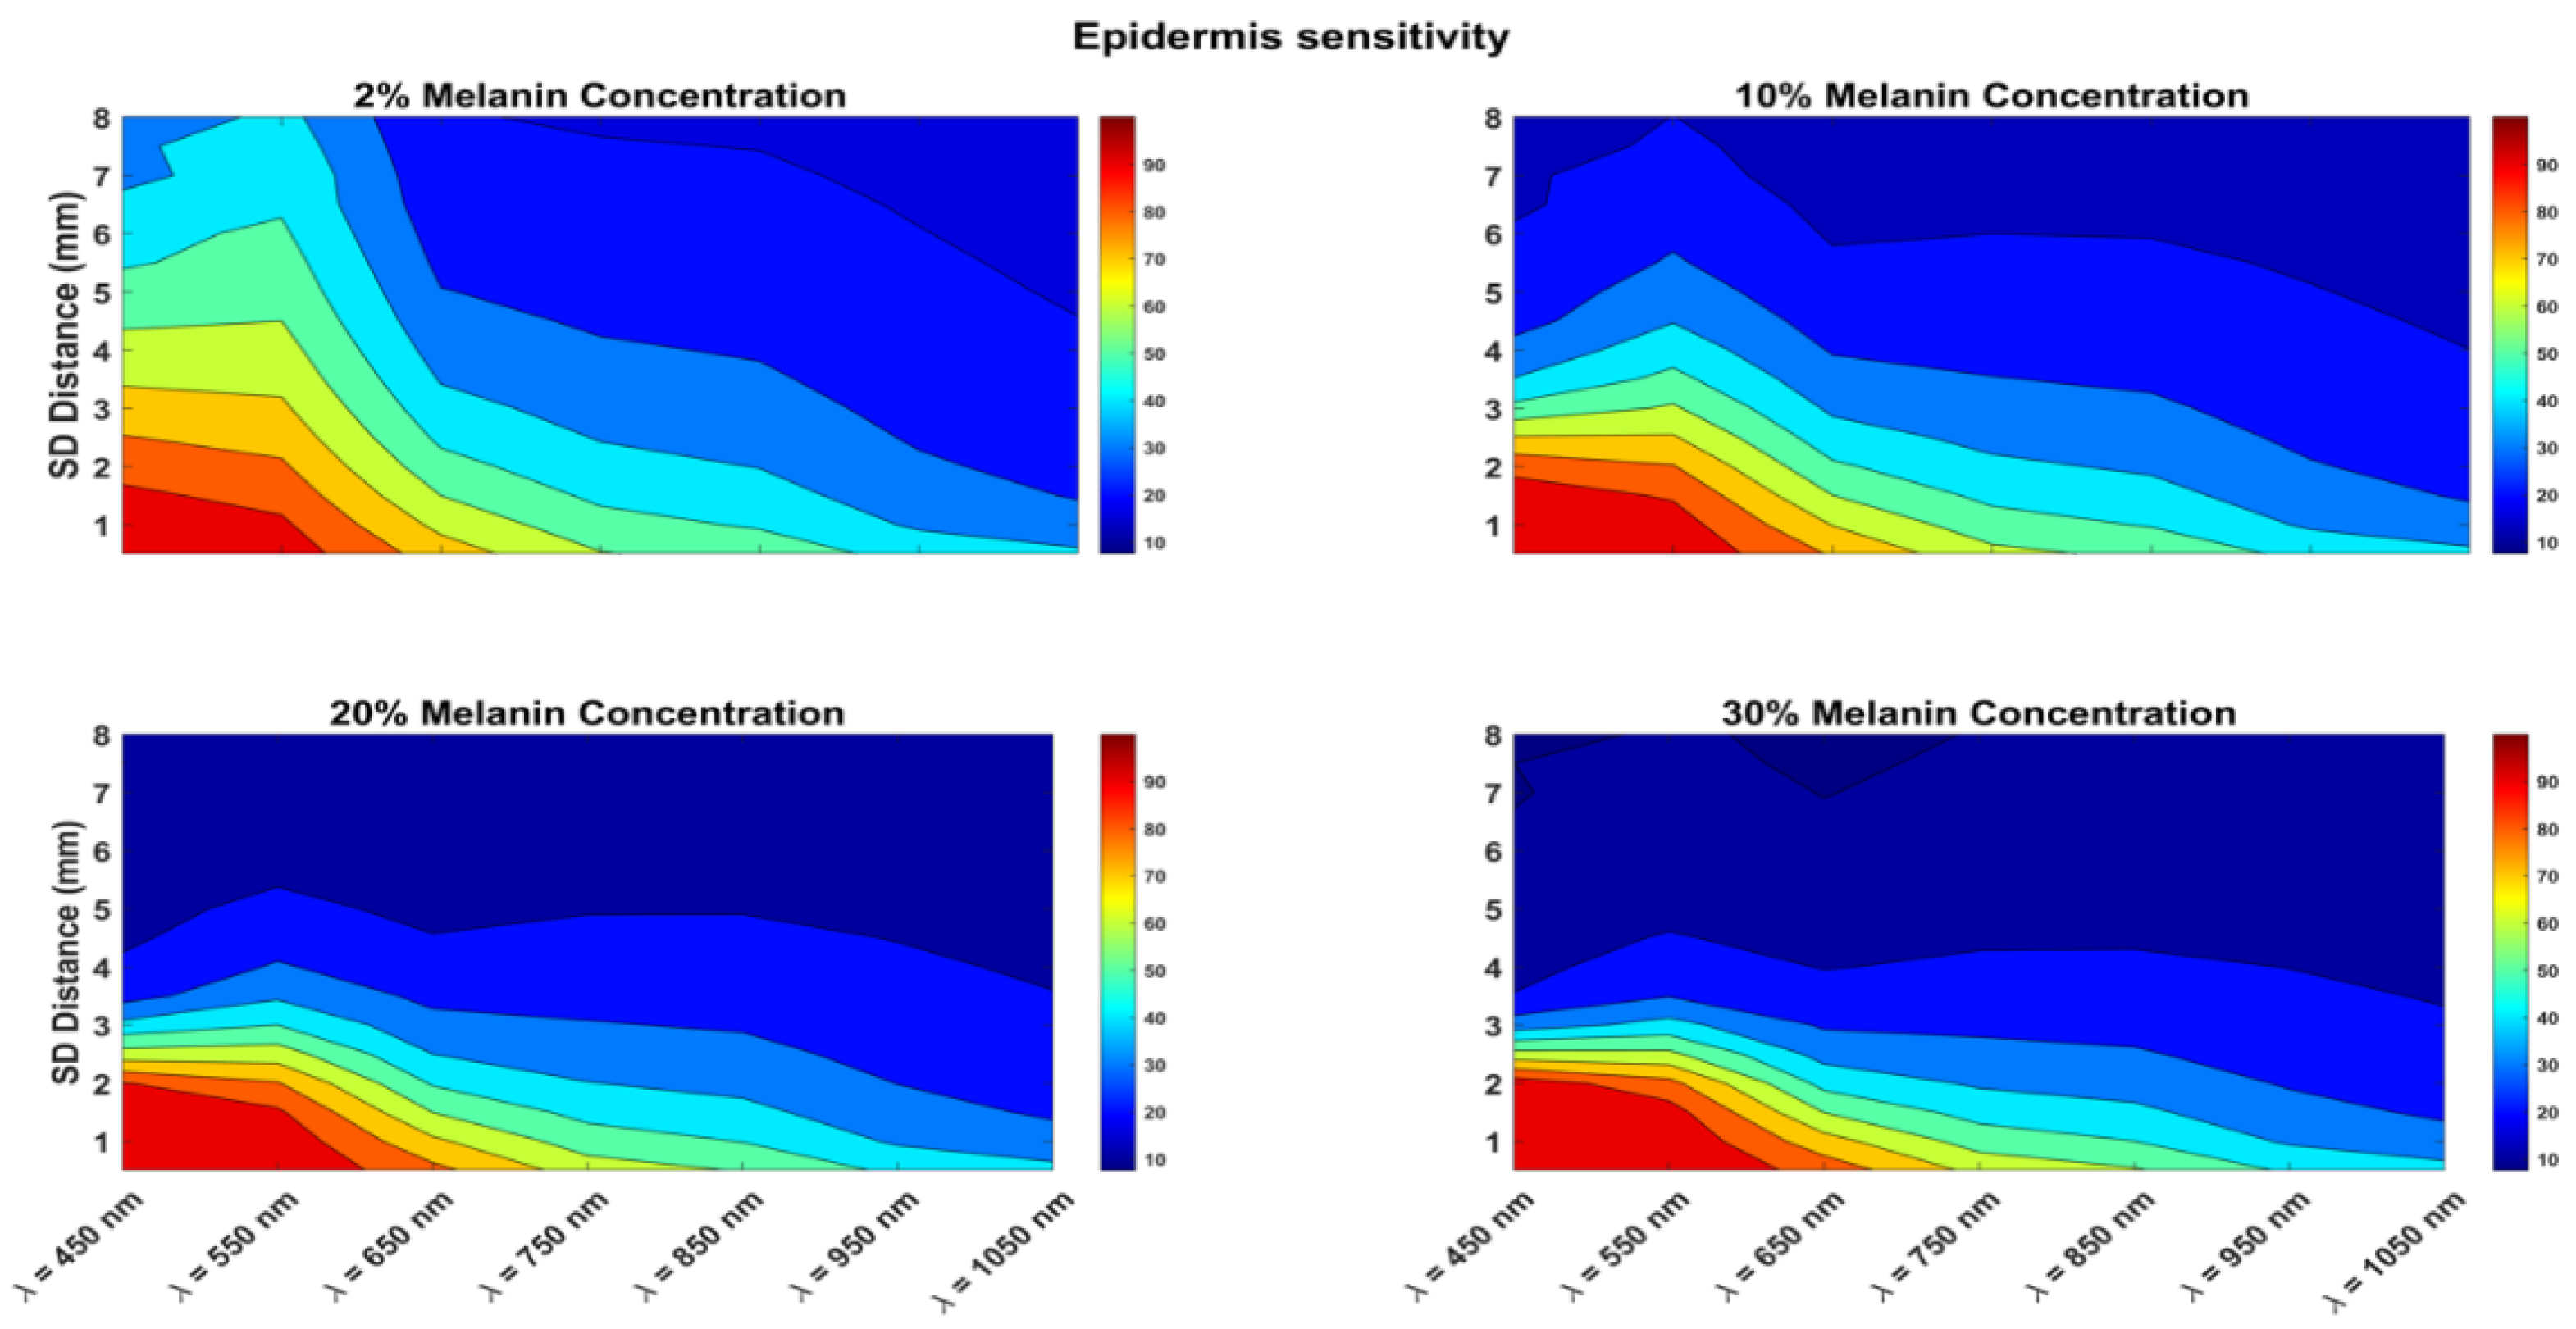
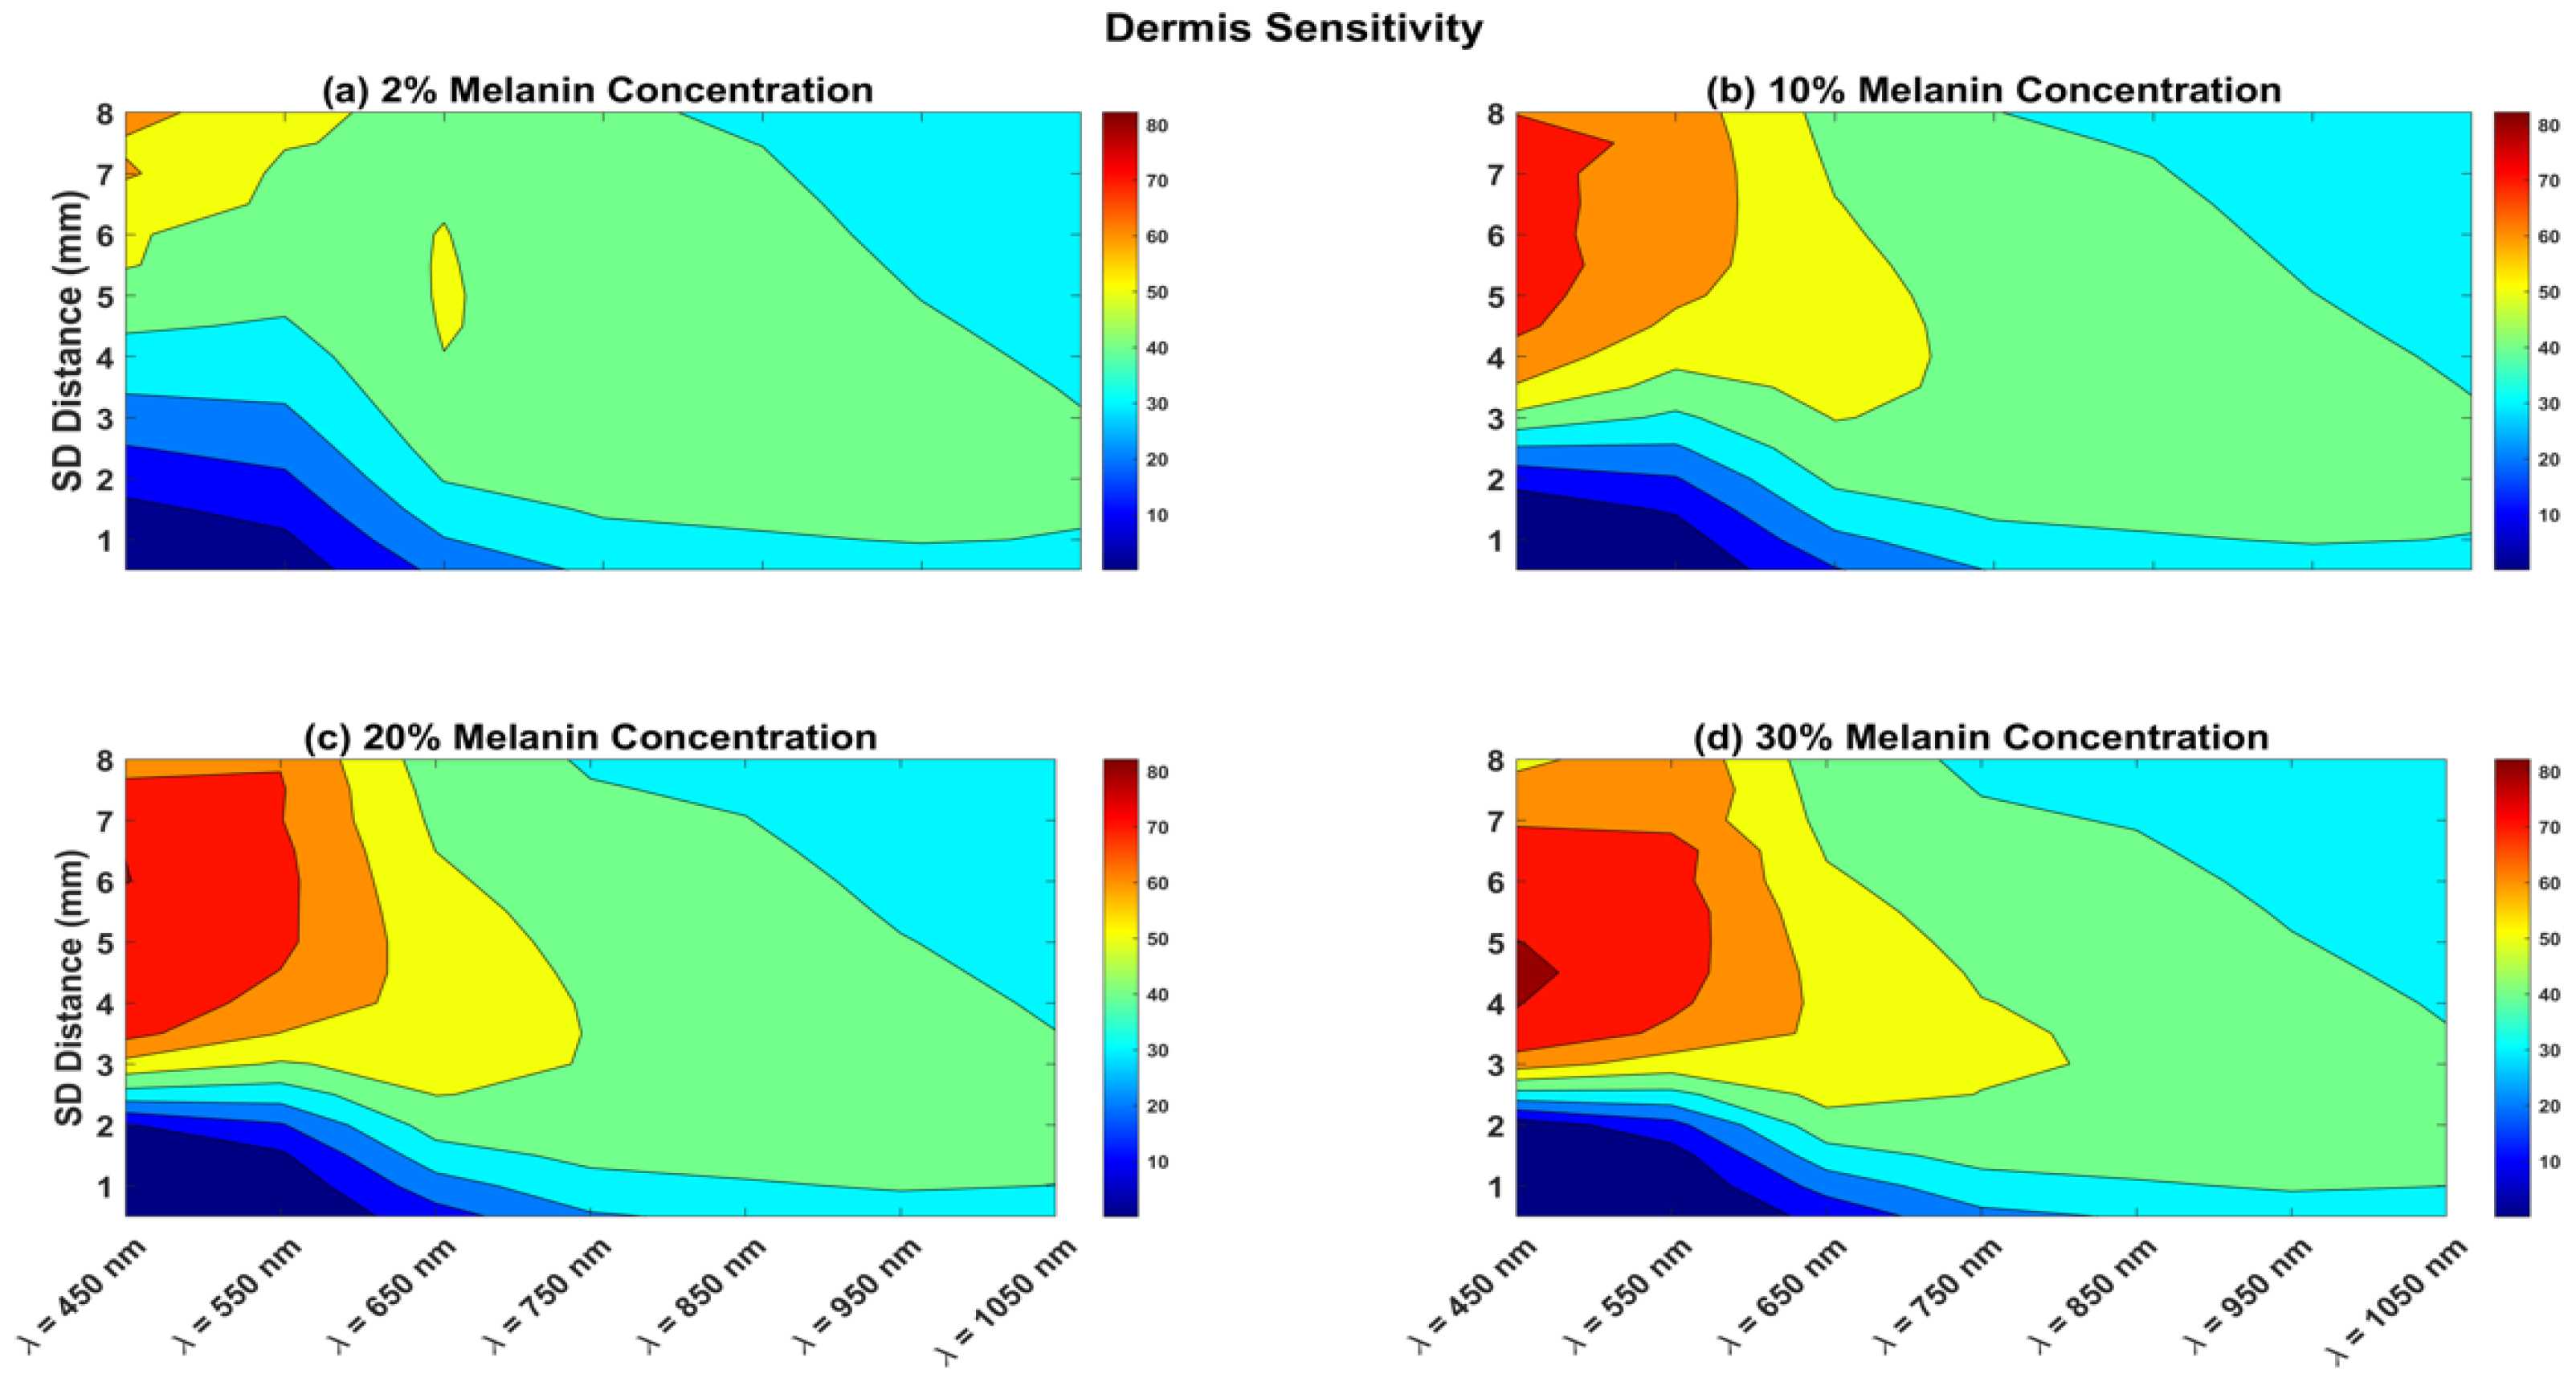
| Melanin Concentration | Optimal for Short Channel | Optimal for Long Channel | ||
|---|---|---|---|---|
| Wavelength | SDS | Wavelength | SDS | |
| 2% | 550 nm | 2.5 mm | 650 nm | 4–6 mm |
| 10% | 650 nm | 2 mm | 650 nm | 4–6 mm |
| 20% | 550 nm | 1.5 mm | 750 nm | 4–5 mm |
| 30% | 550 nm | 1.5 mm | 950/1050 nm | 4–5 mm |
Publisher’s Note: MDPI stays neutral with regard to jurisdictional claims in published maps and institutional affiliations. |
© 2022 by the author. Licensee MDPI, Basel, Switzerland. This article is an open access article distributed under the terms and conditions of the Creative Commons Attribution (CC BY) license (https://creativecommons.org/licenses/by/4.0/).
Share and Cite
Althobaiti, M. In Silico Investigation of SNR and Dermis Sensitivity for Optimum Dual-Channel Near-Infrared Glucose Sensor Designs for Different Skin Colors. Biosensors 2022, 12, 805. https://doi.org/10.3390/bios12100805
Althobaiti M. In Silico Investigation of SNR and Dermis Sensitivity for Optimum Dual-Channel Near-Infrared Glucose Sensor Designs for Different Skin Colors. Biosensors. 2022; 12(10):805. https://doi.org/10.3390/bios12100805
Chicago/Turabian StyleAlthobaiti, Murad. 2022. "In Silico Investigation of SNR and Dermis Sensitivity for Optimum Dual-Channel Near-Infrared Glucose Sensor Designs for Different Skin Colors" Biosensors 12, no. 10: 805. https://doi.org/10.3390/bios12100805