Polymer Optical Waveguide Grating-Based Biosensor to Detect Effective Drug Concentrations of Ginkgolide A for Inhibition of PMVEC Apoptosis

 , , ,
, , ,
Abstract
:1. Introduction
2. Experiment
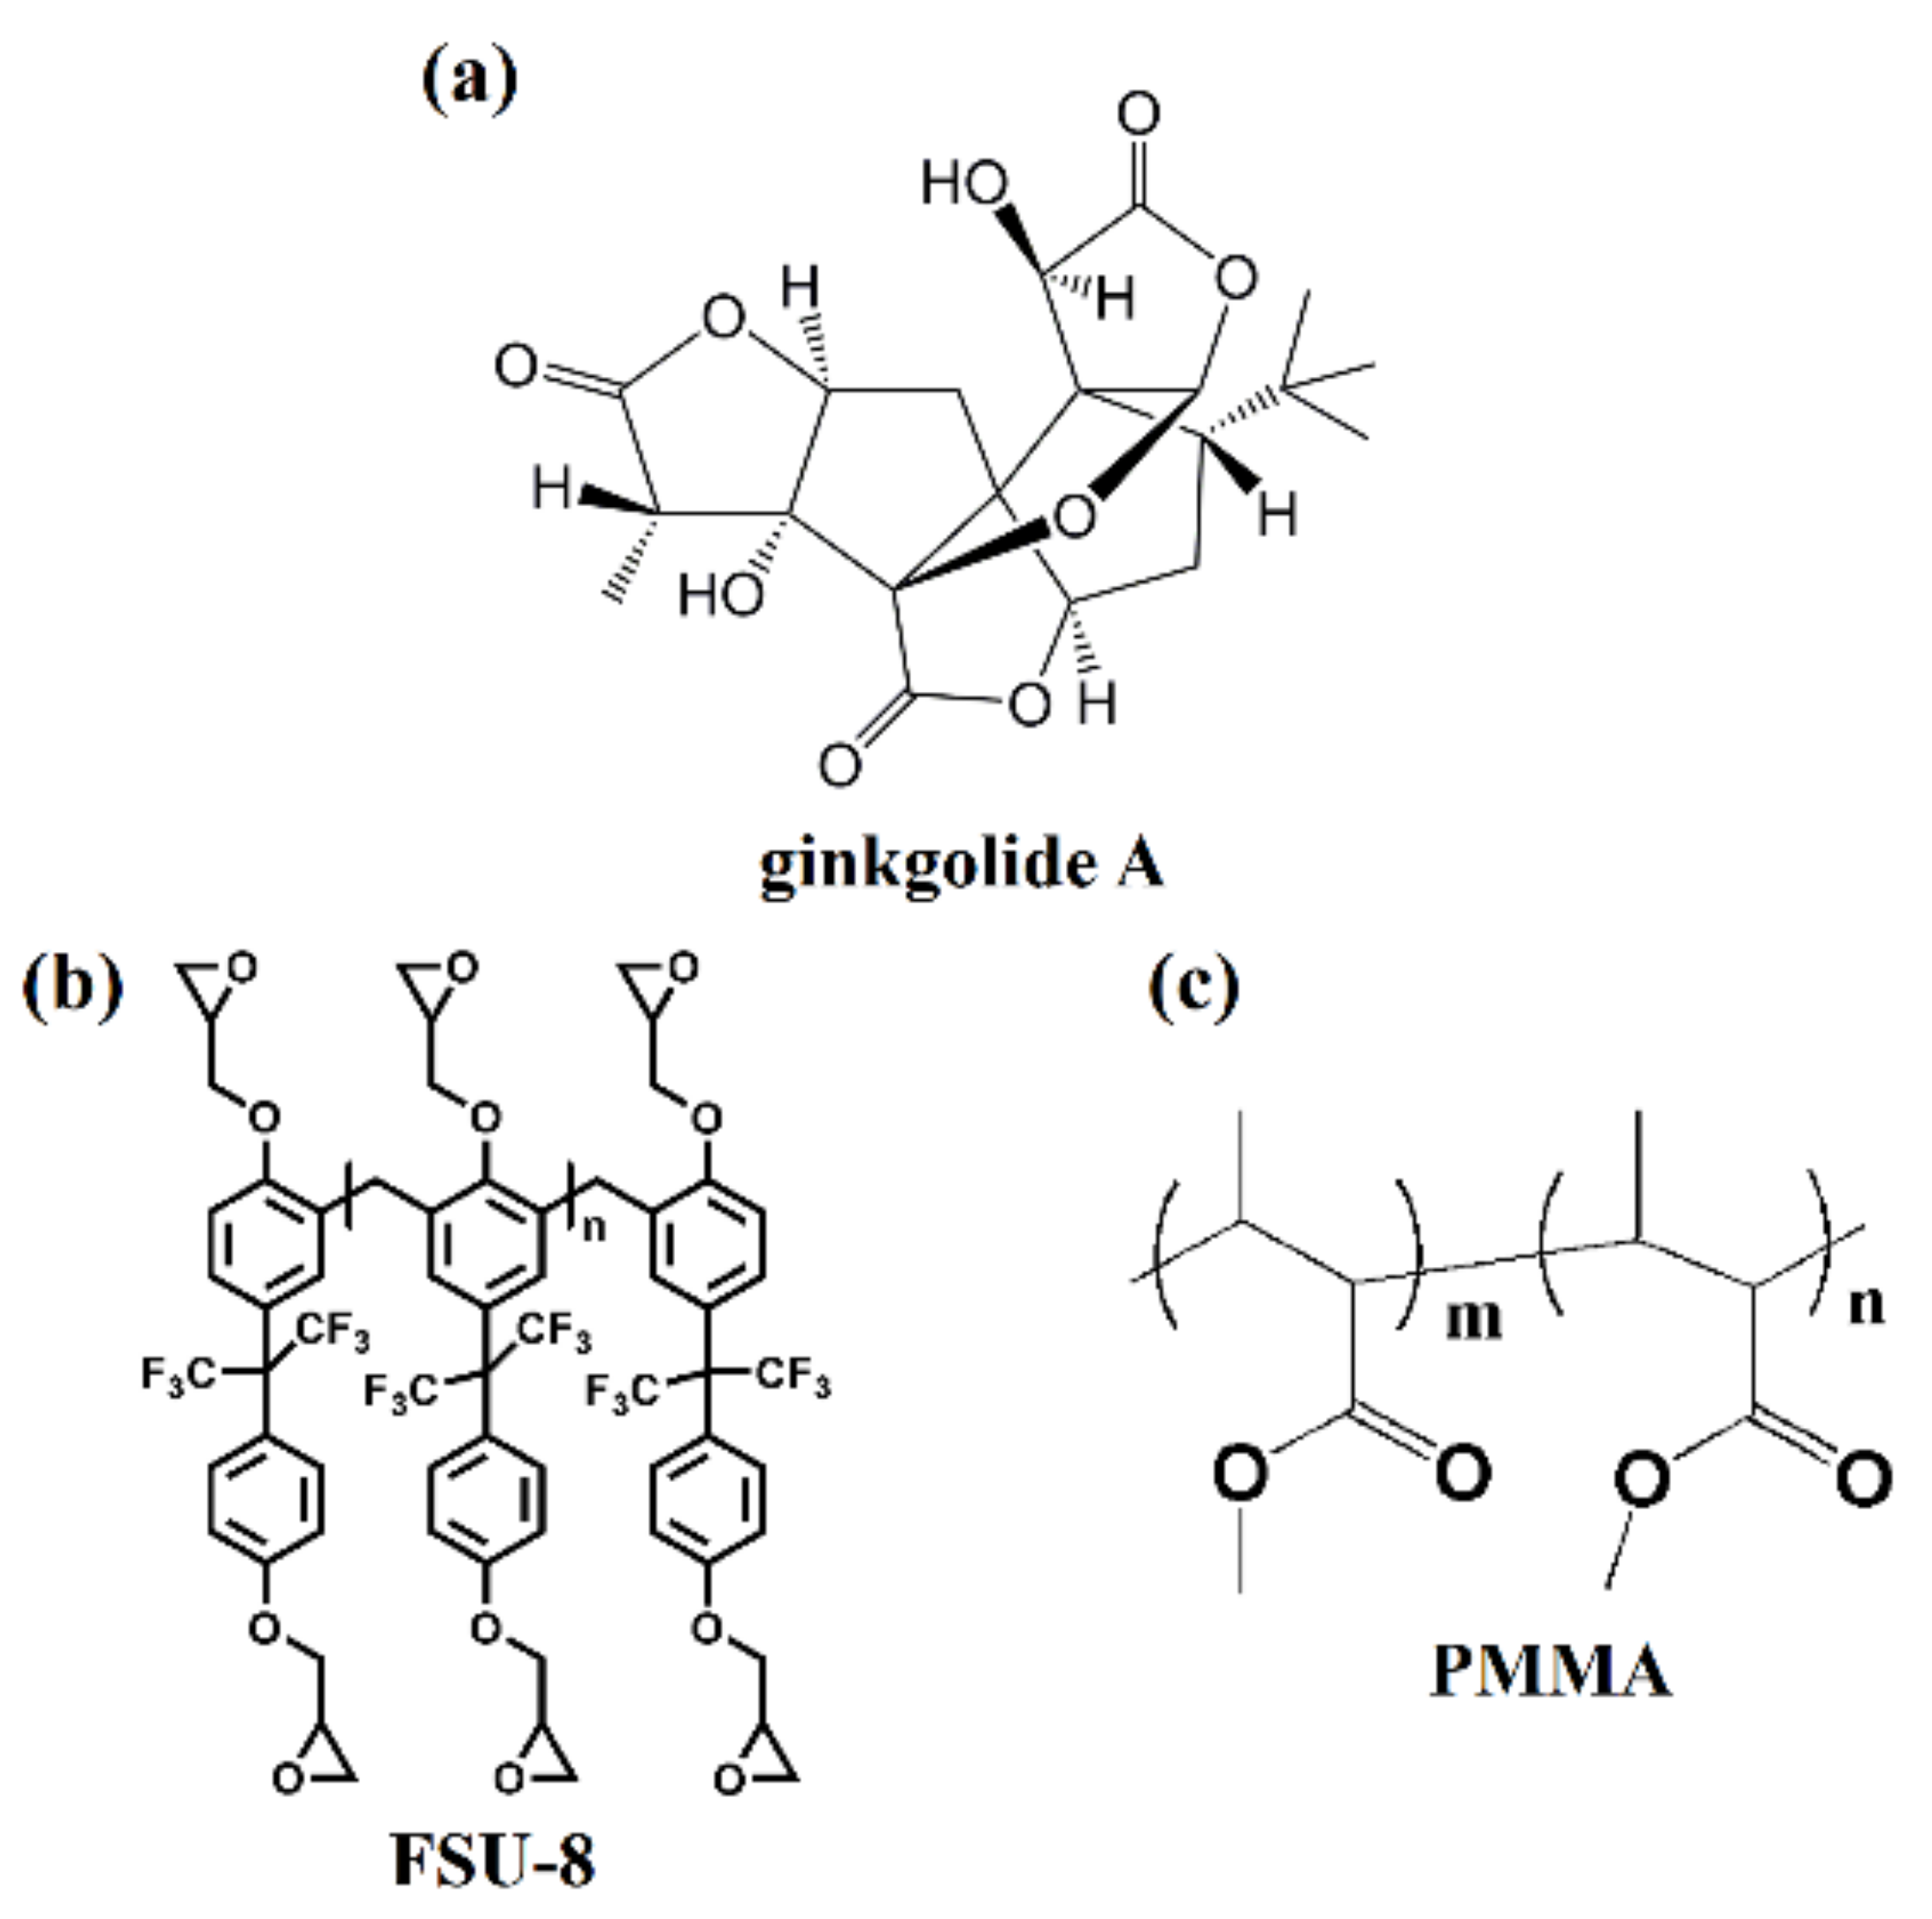
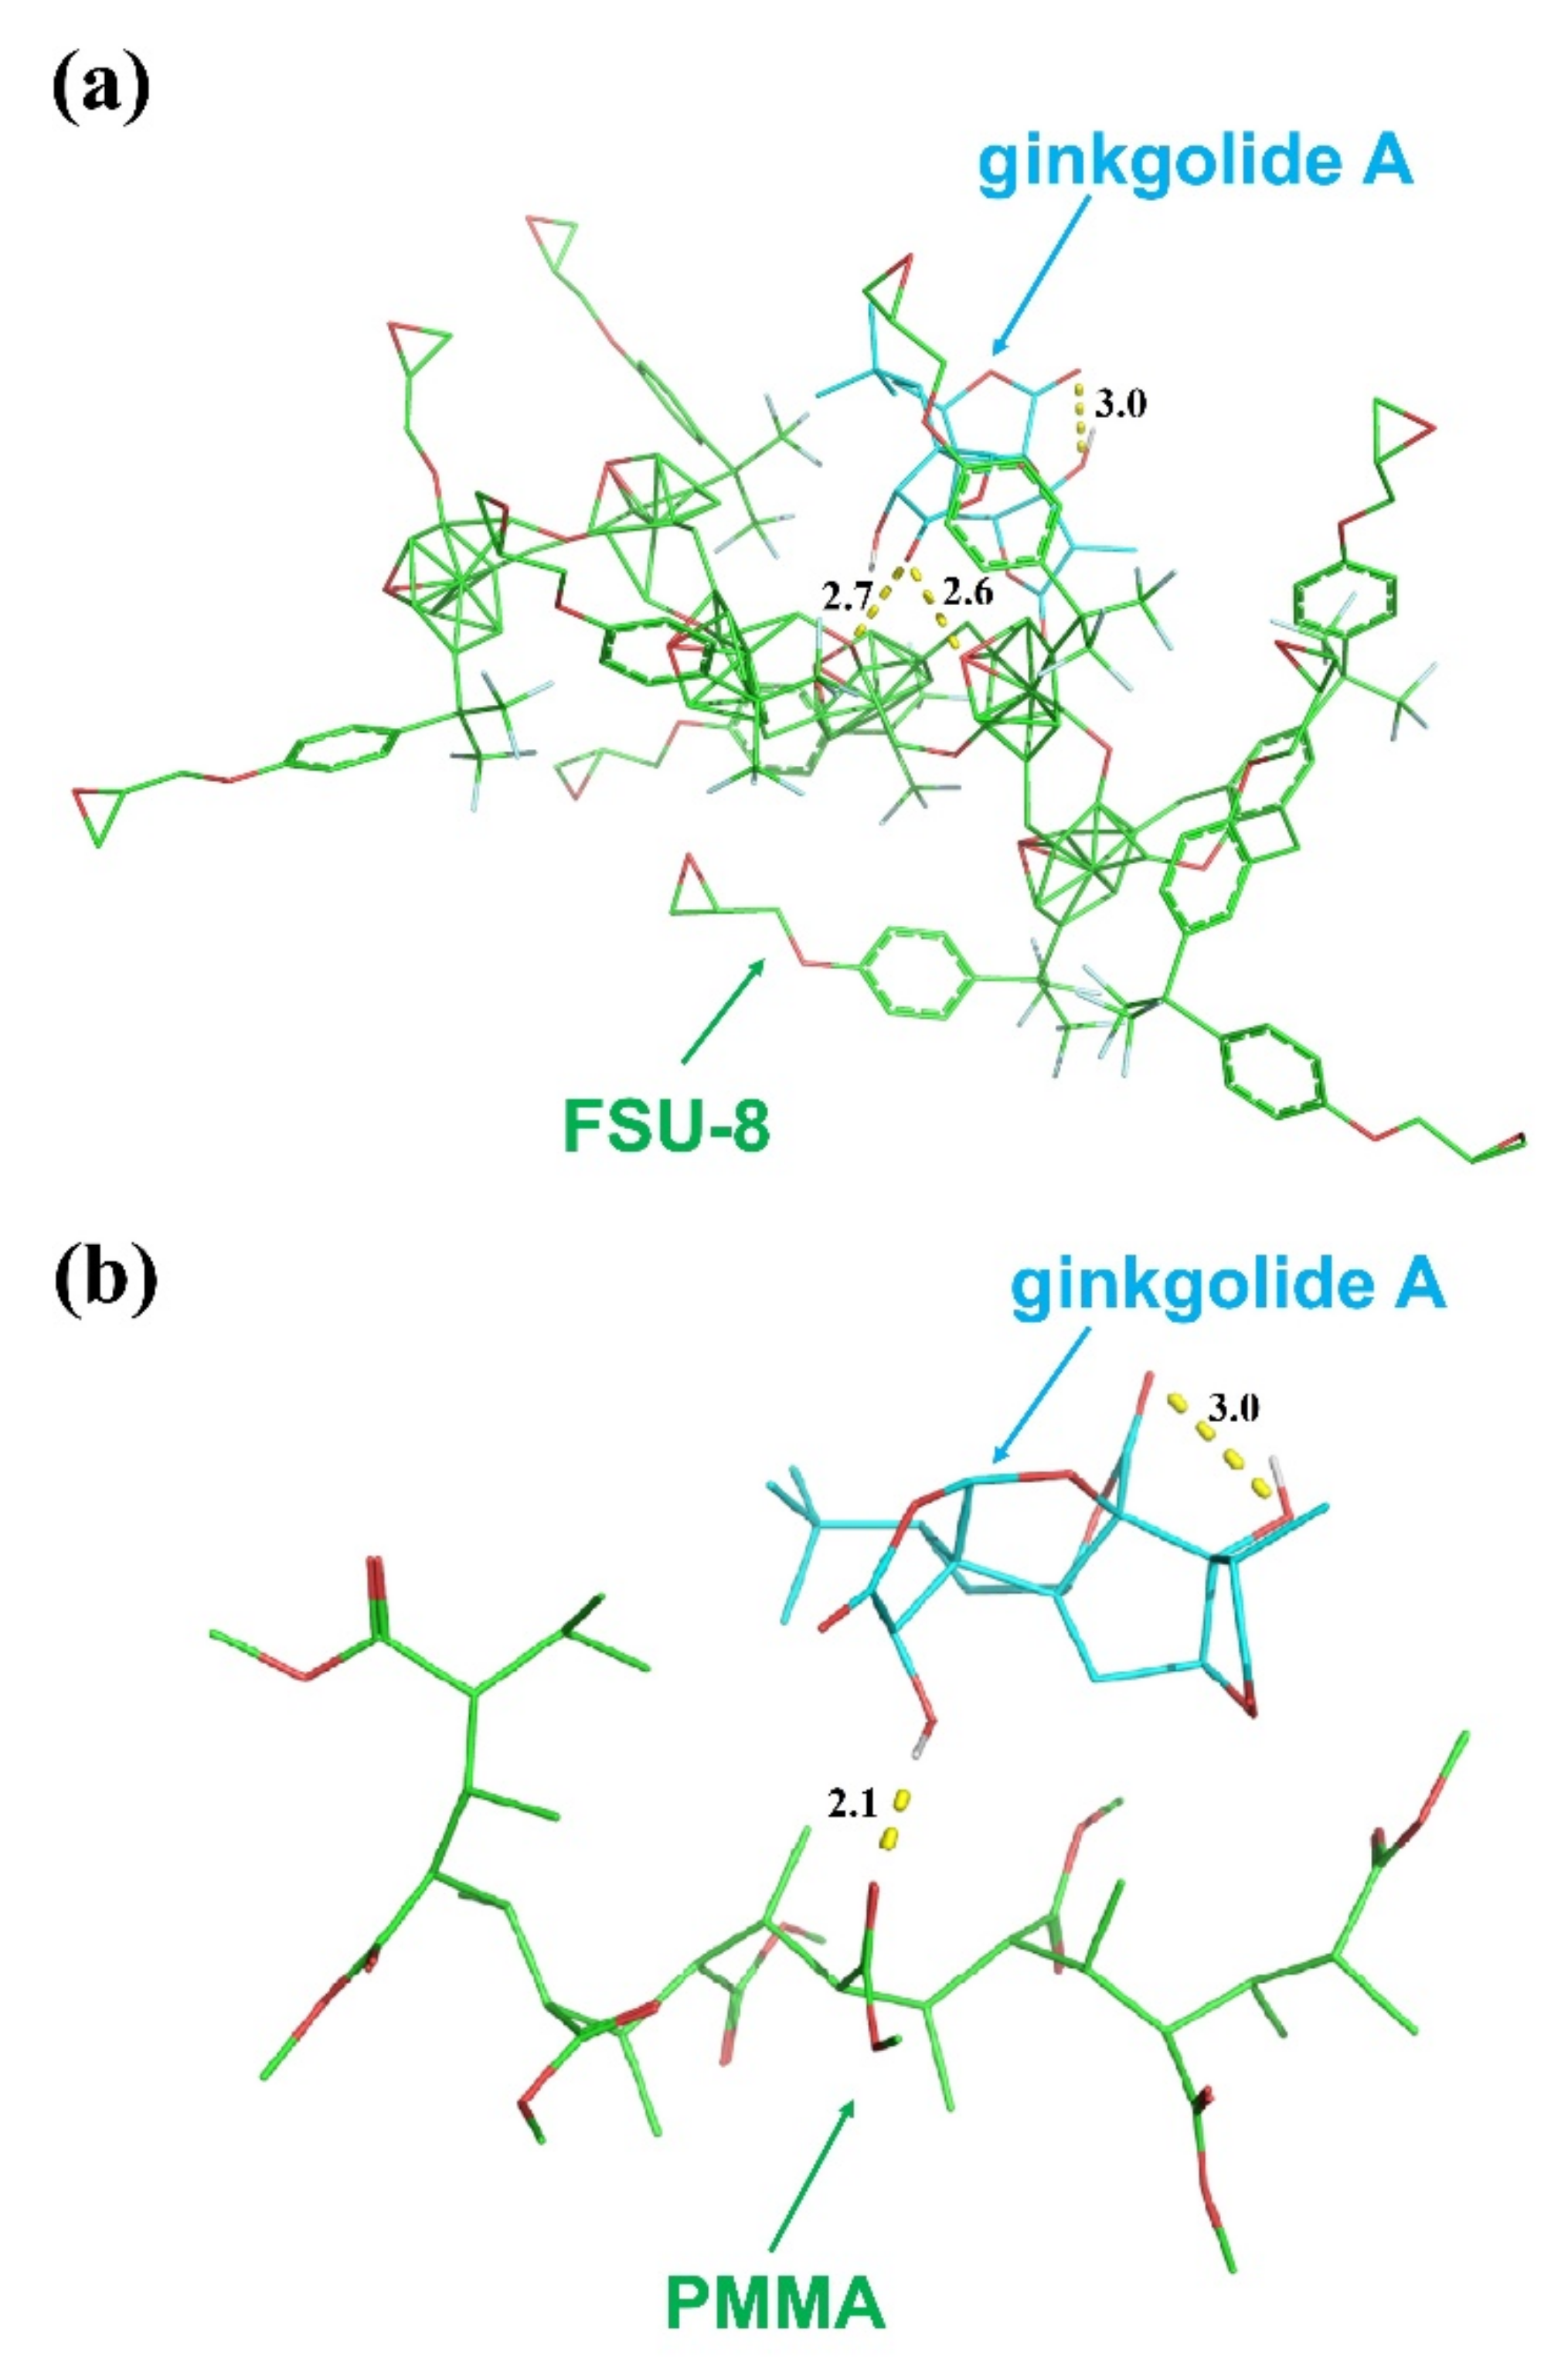
2.1. Sensing Polymer Waveguide Materials
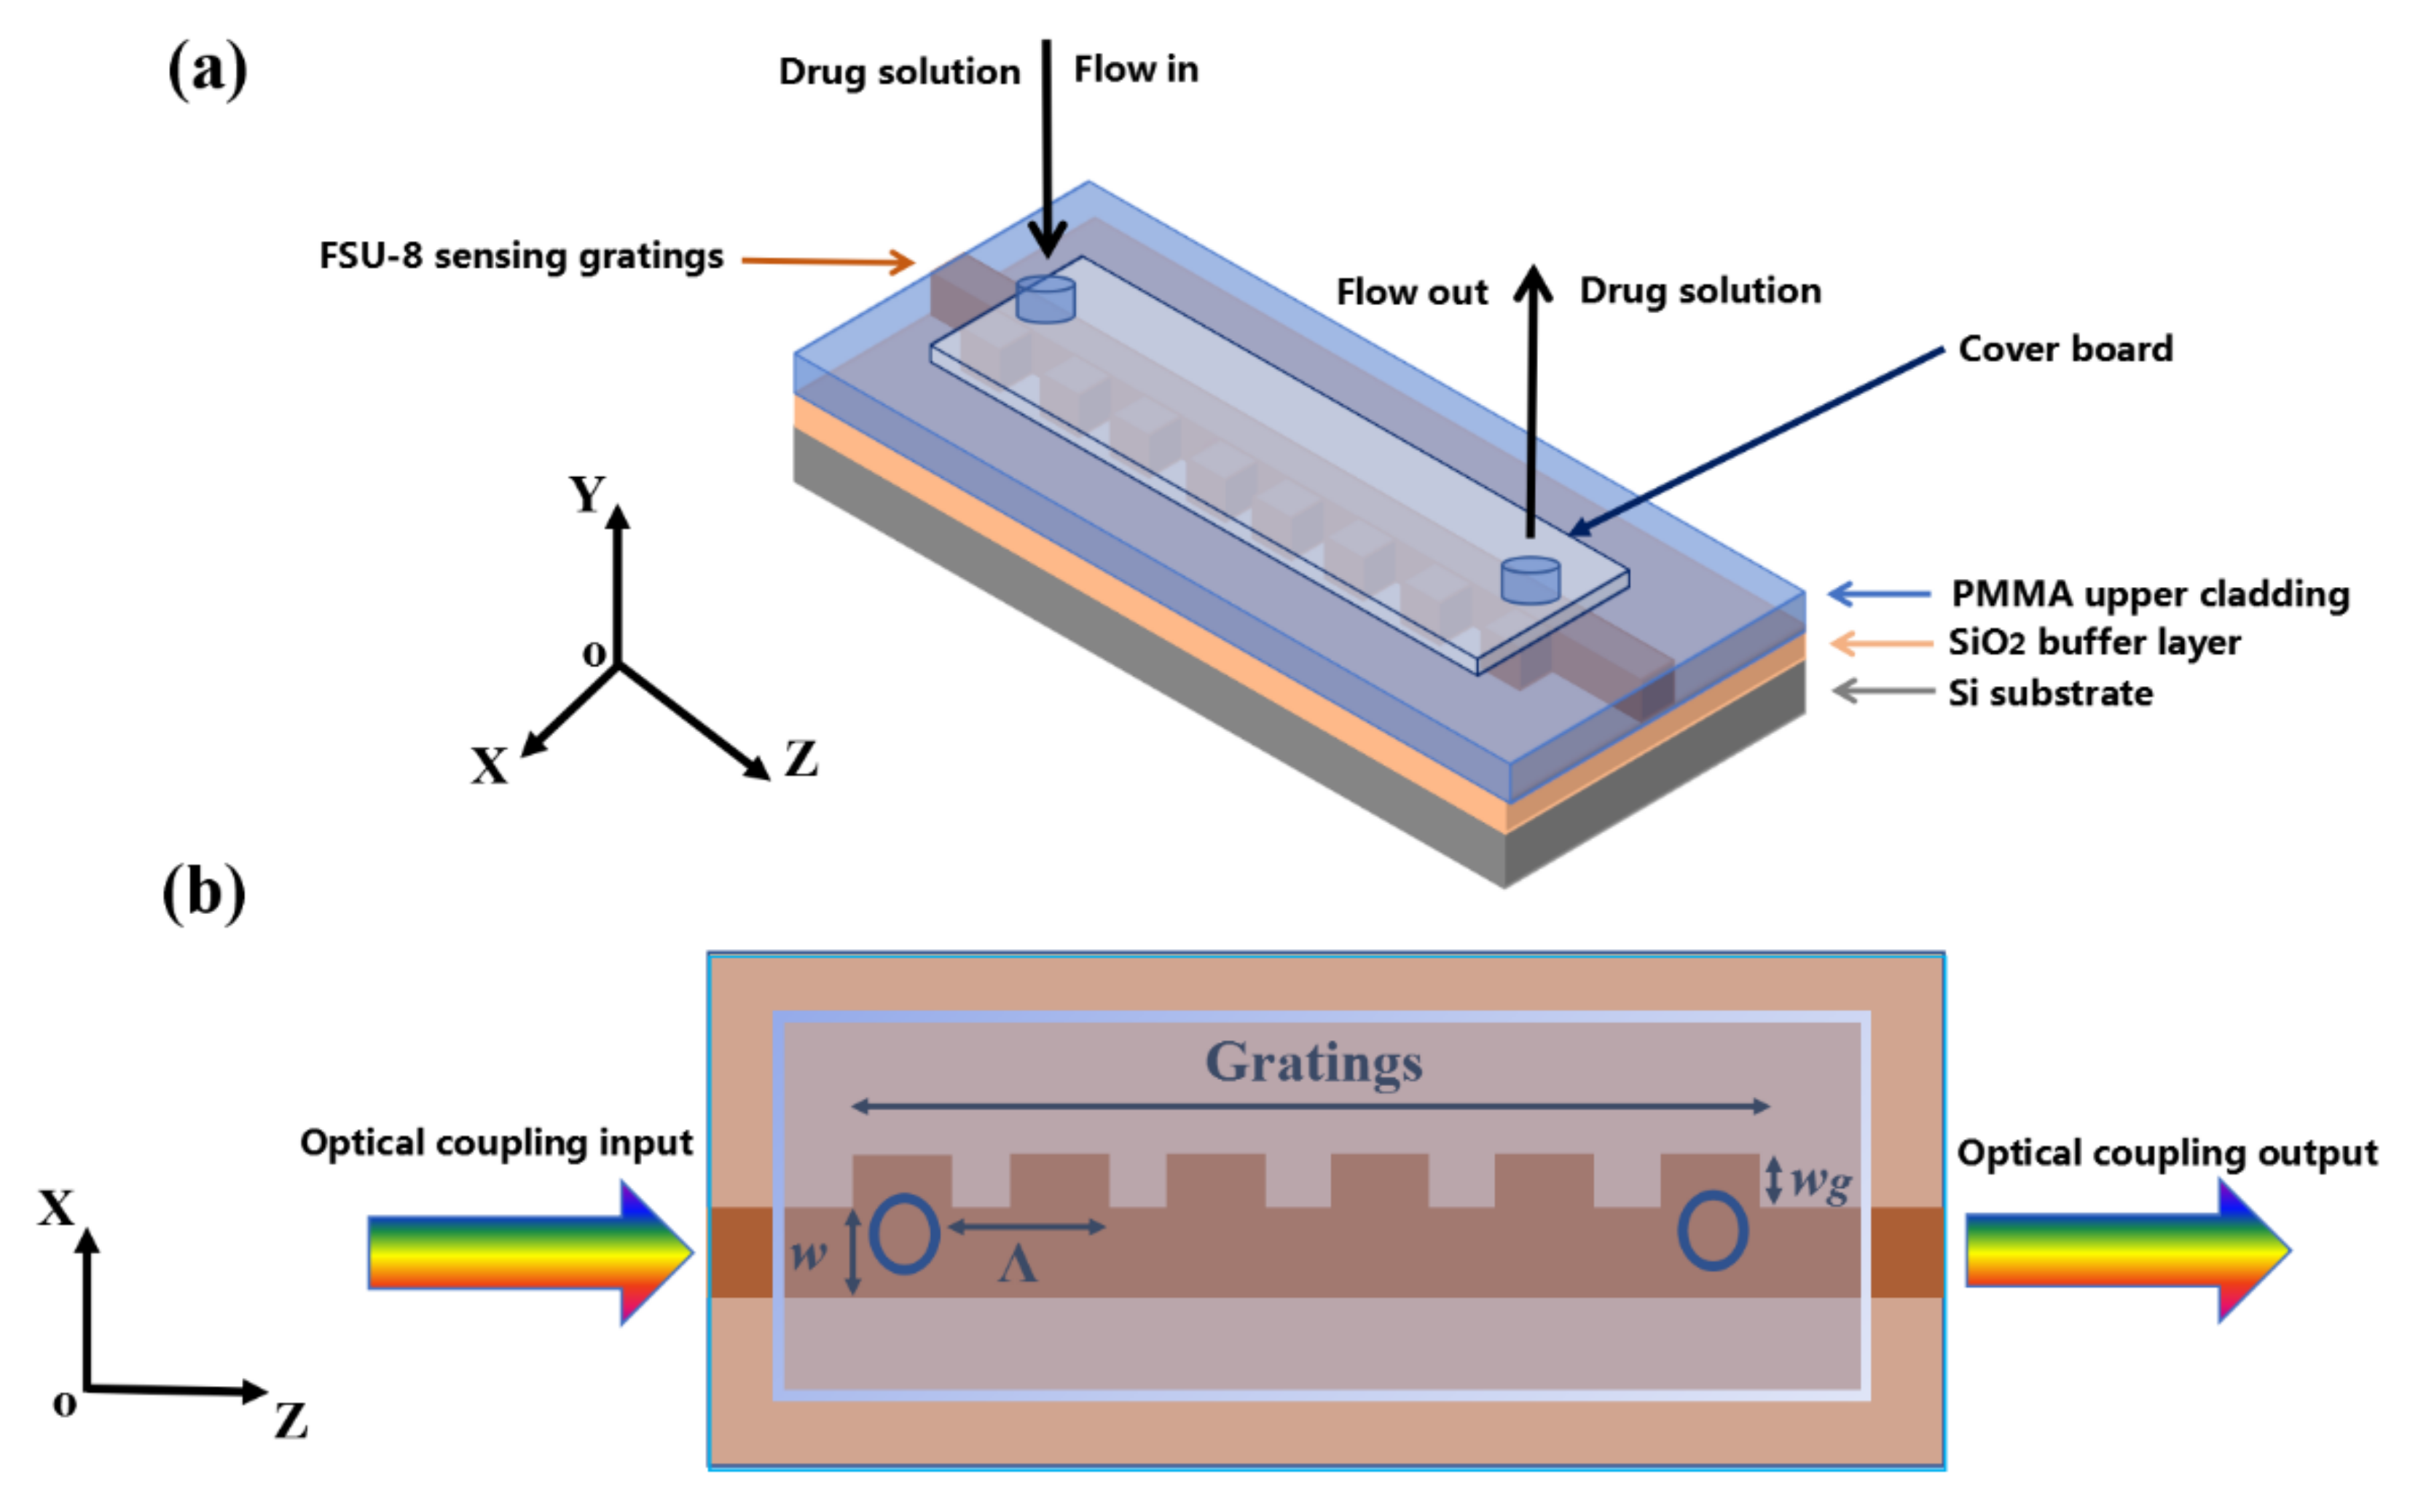
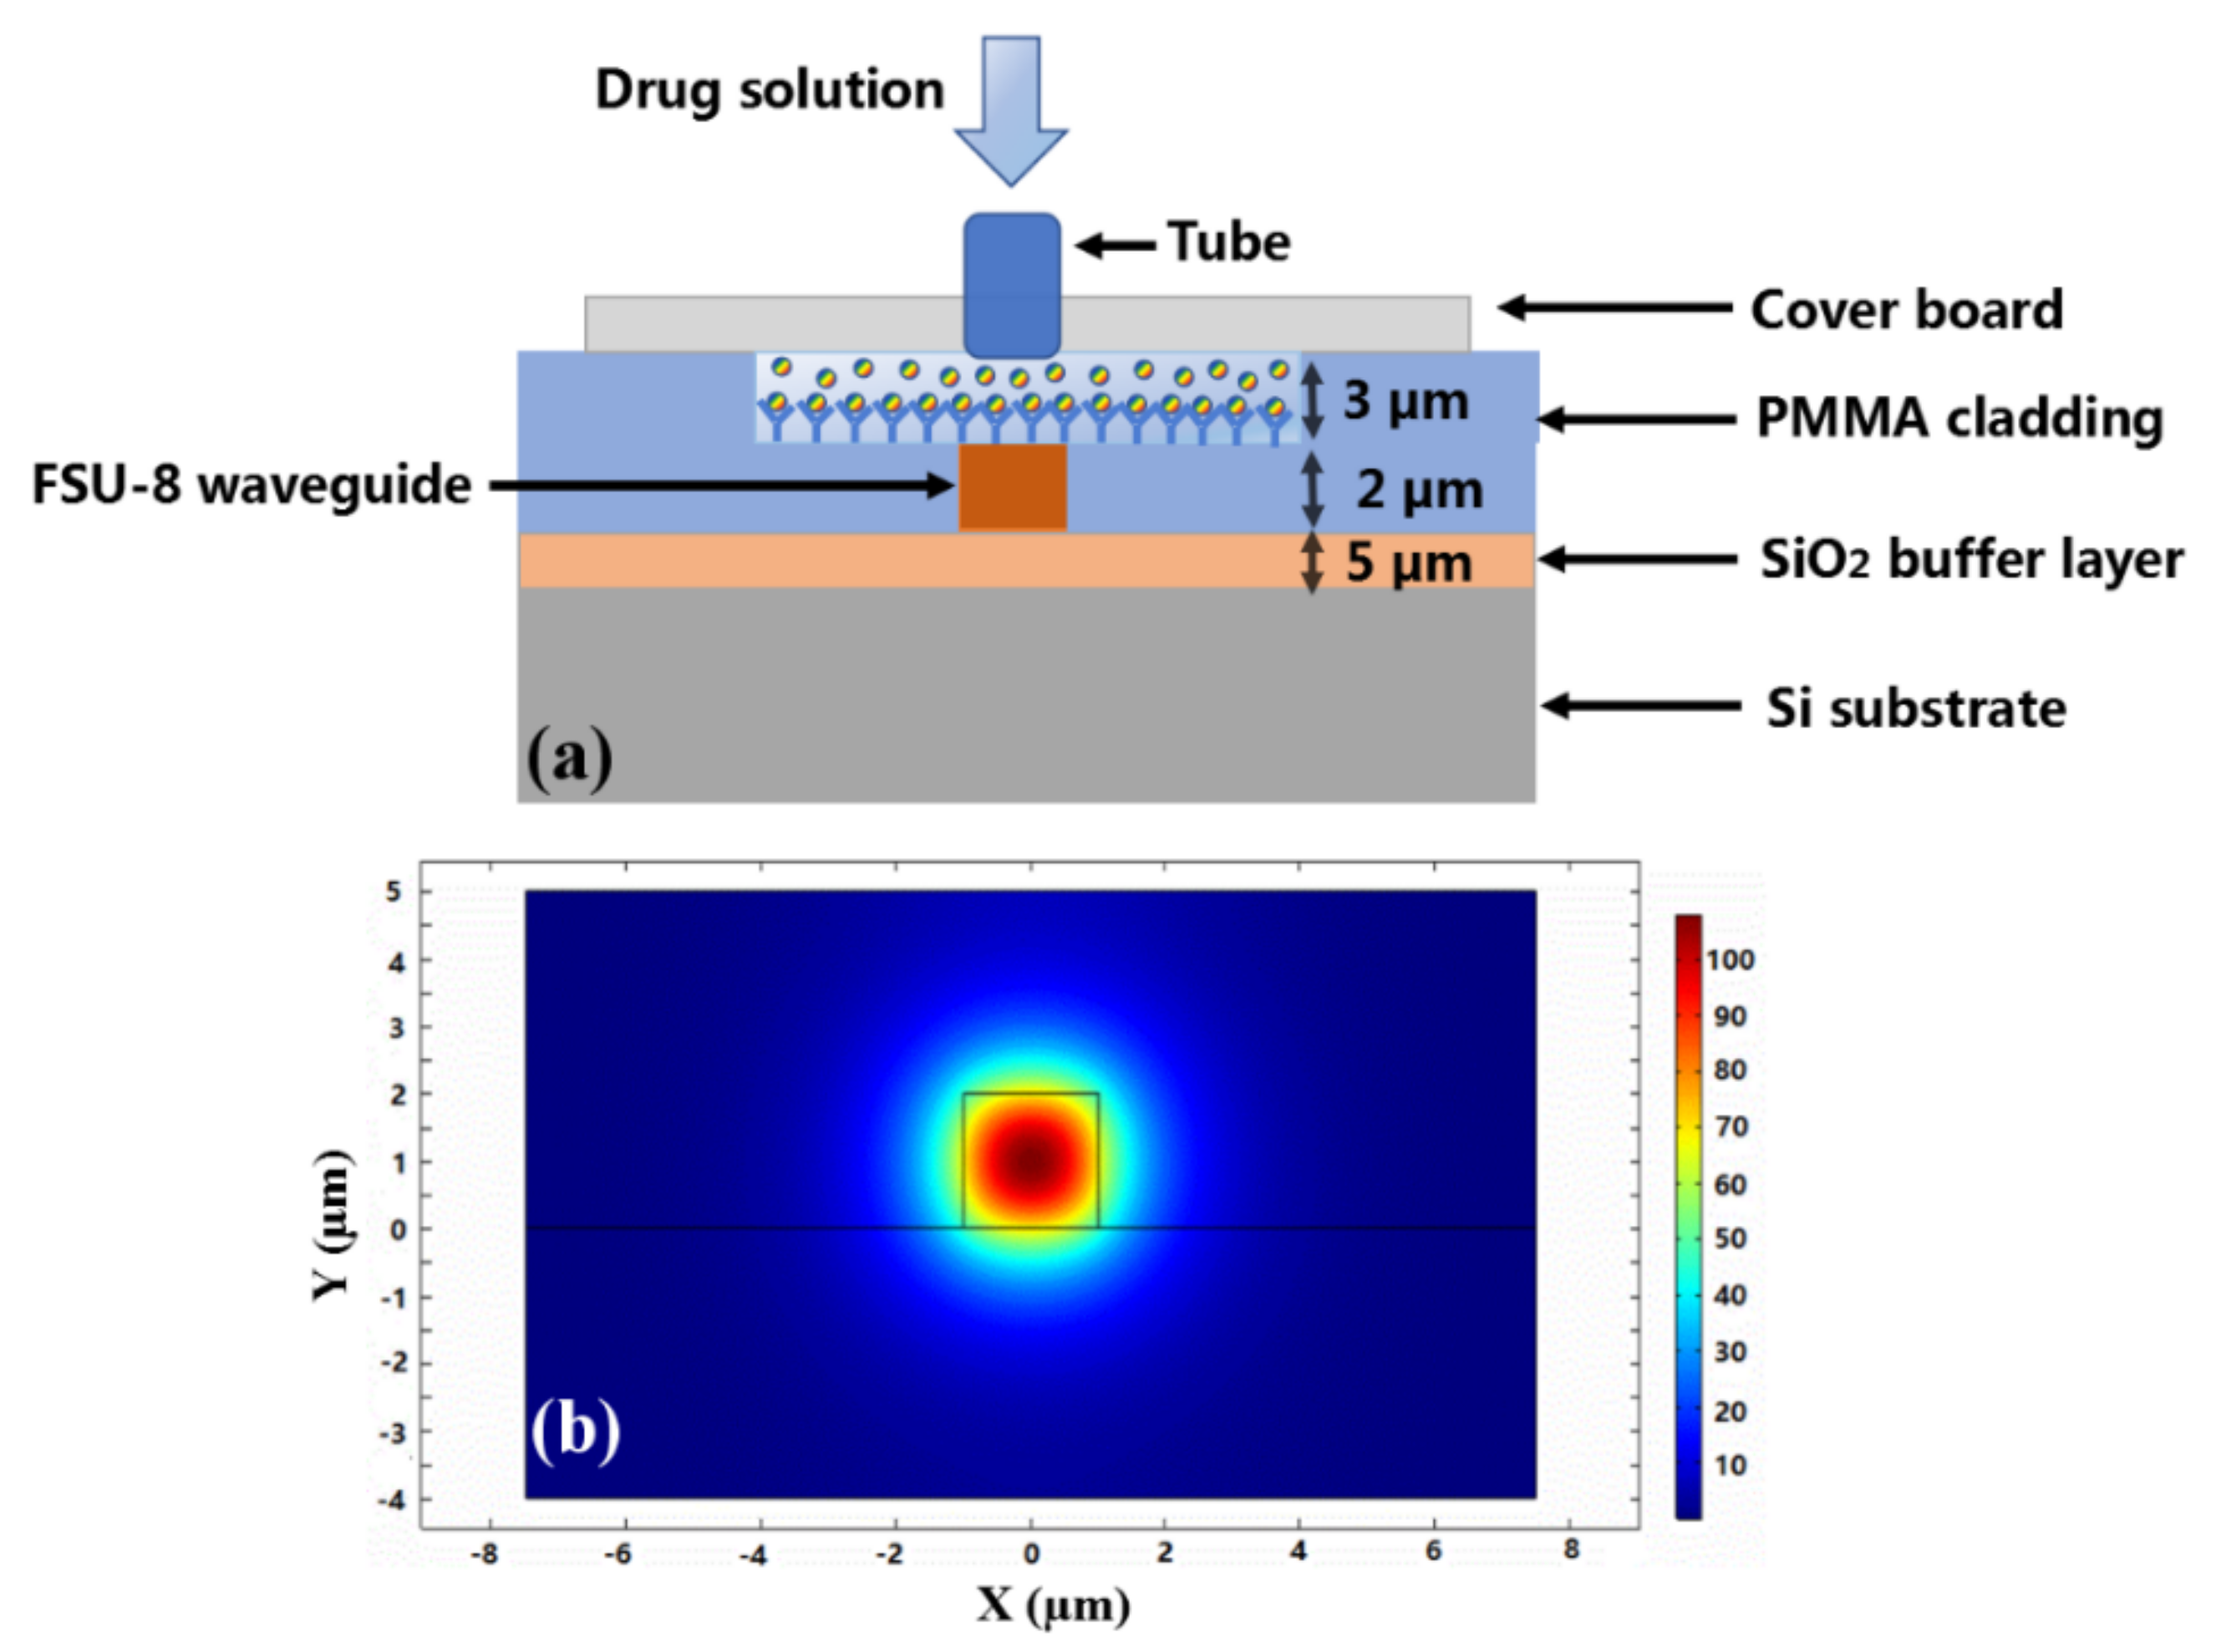
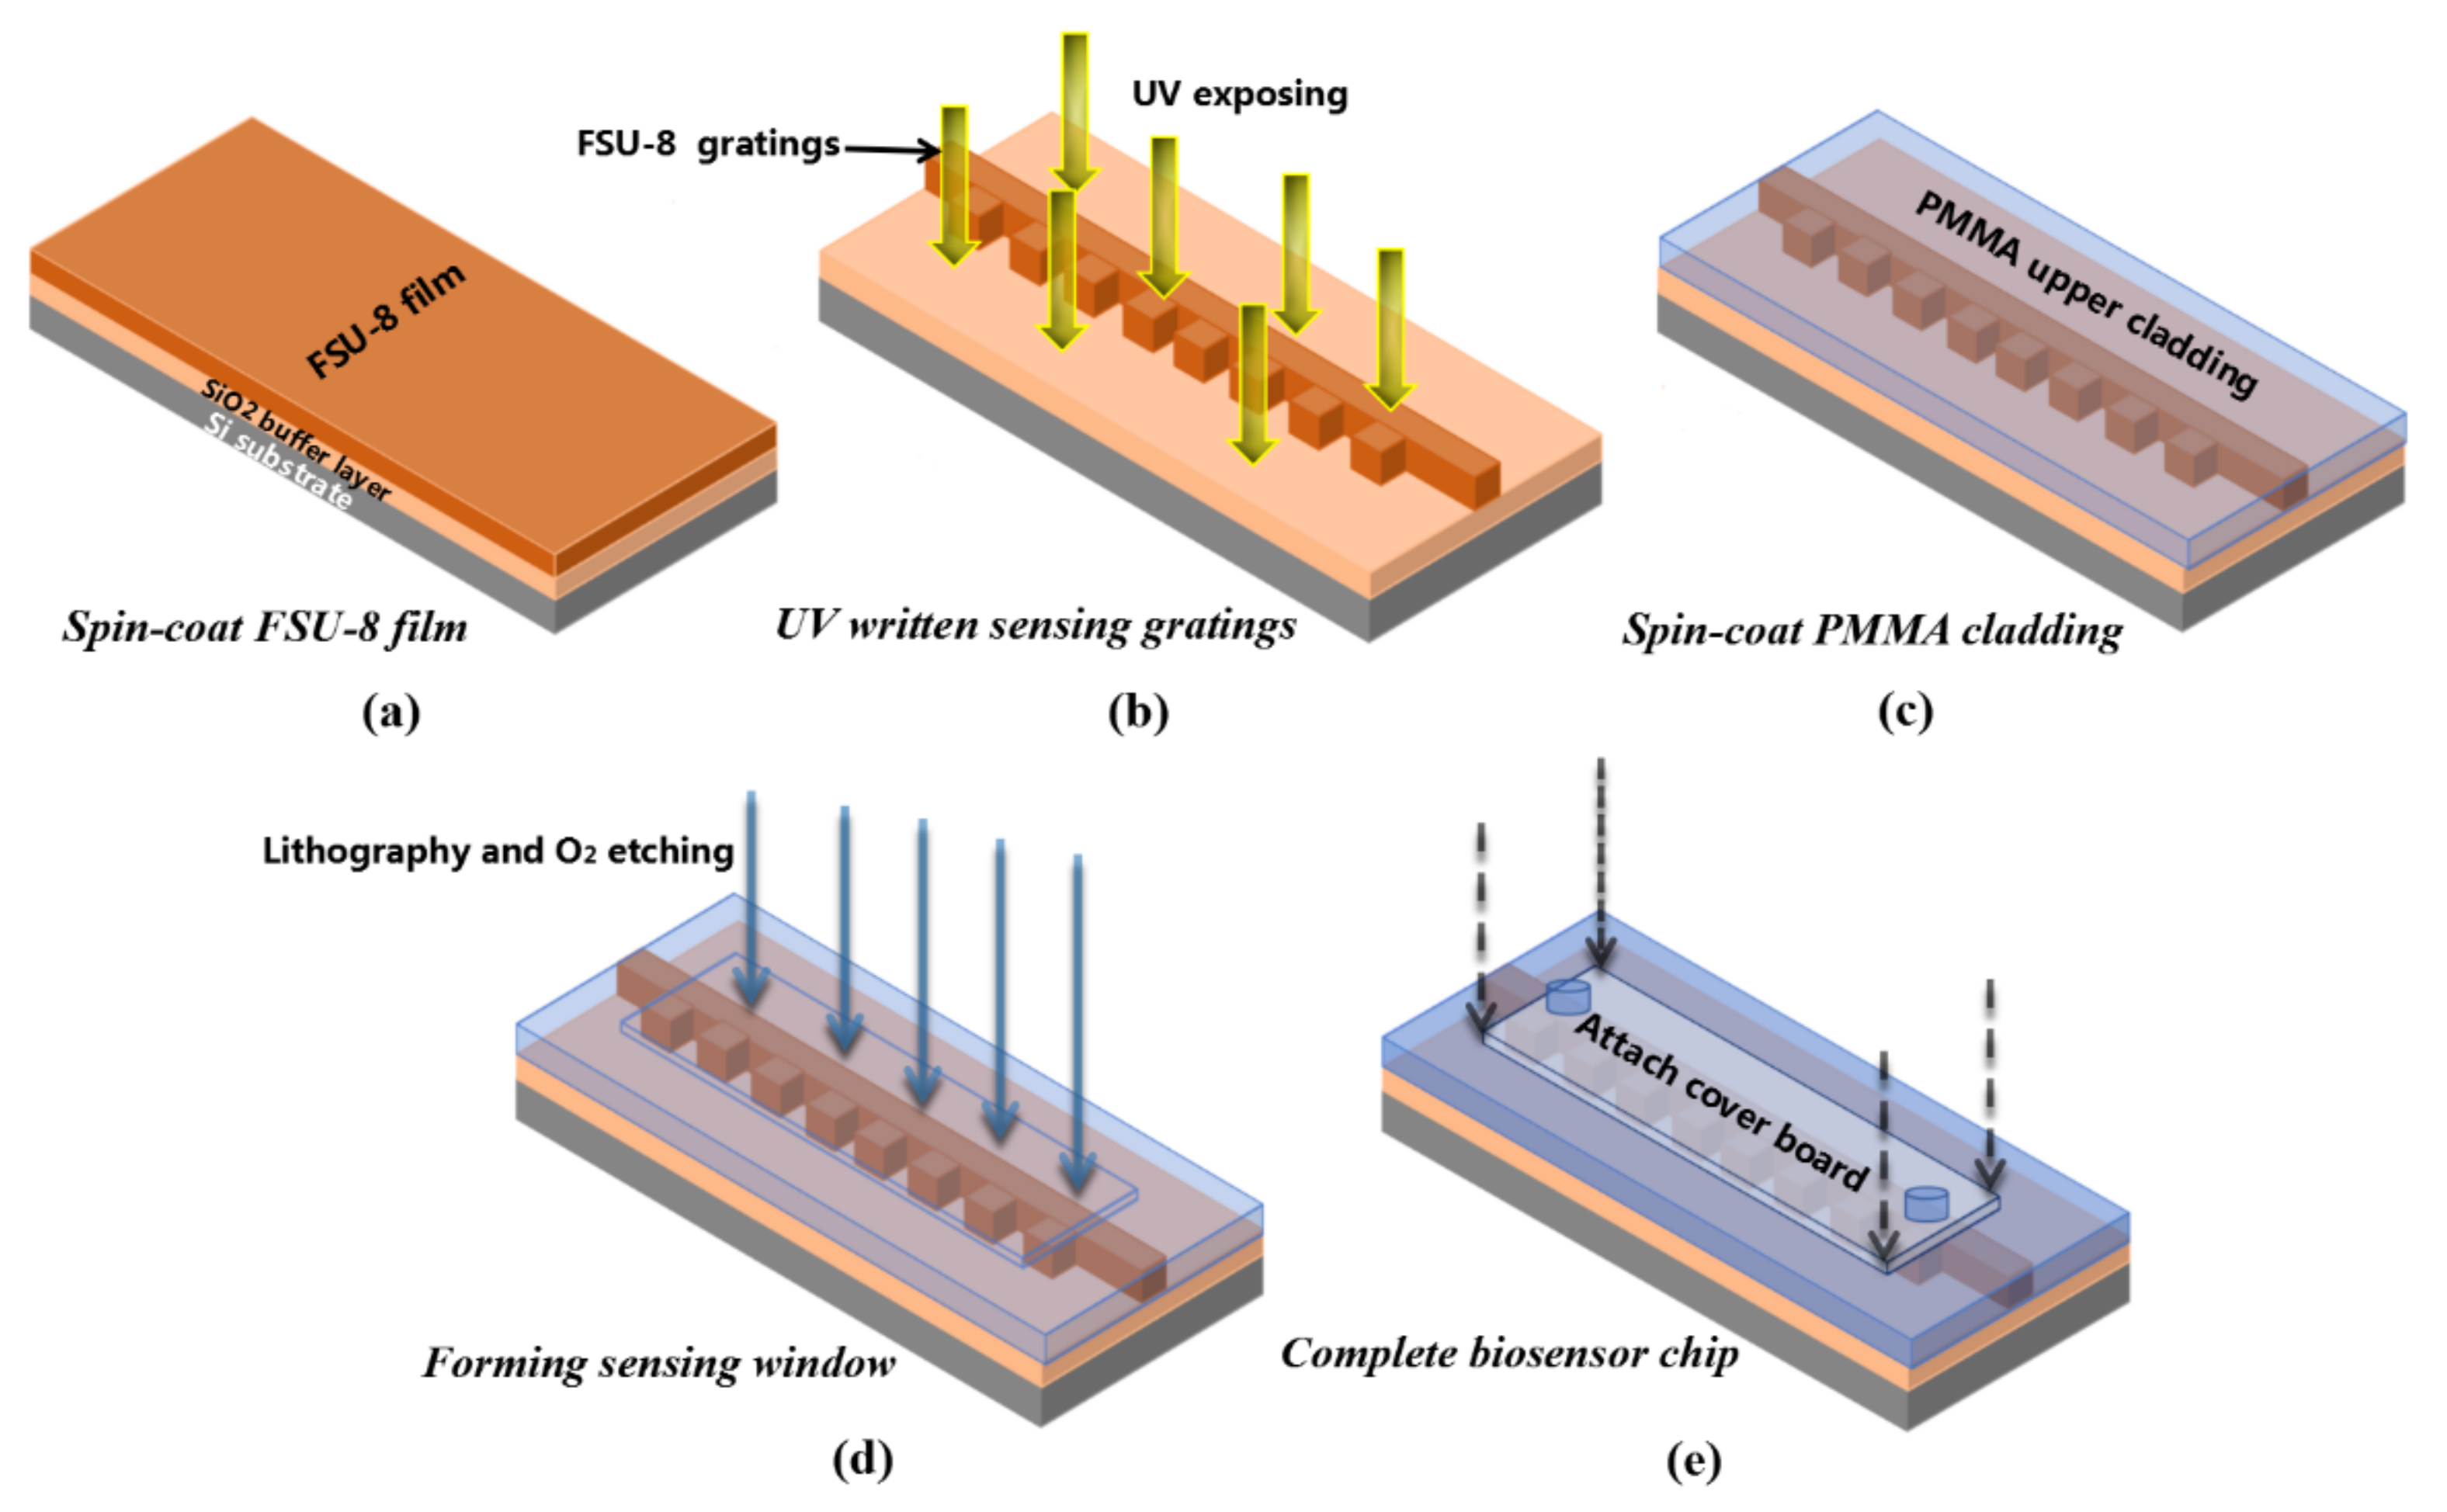
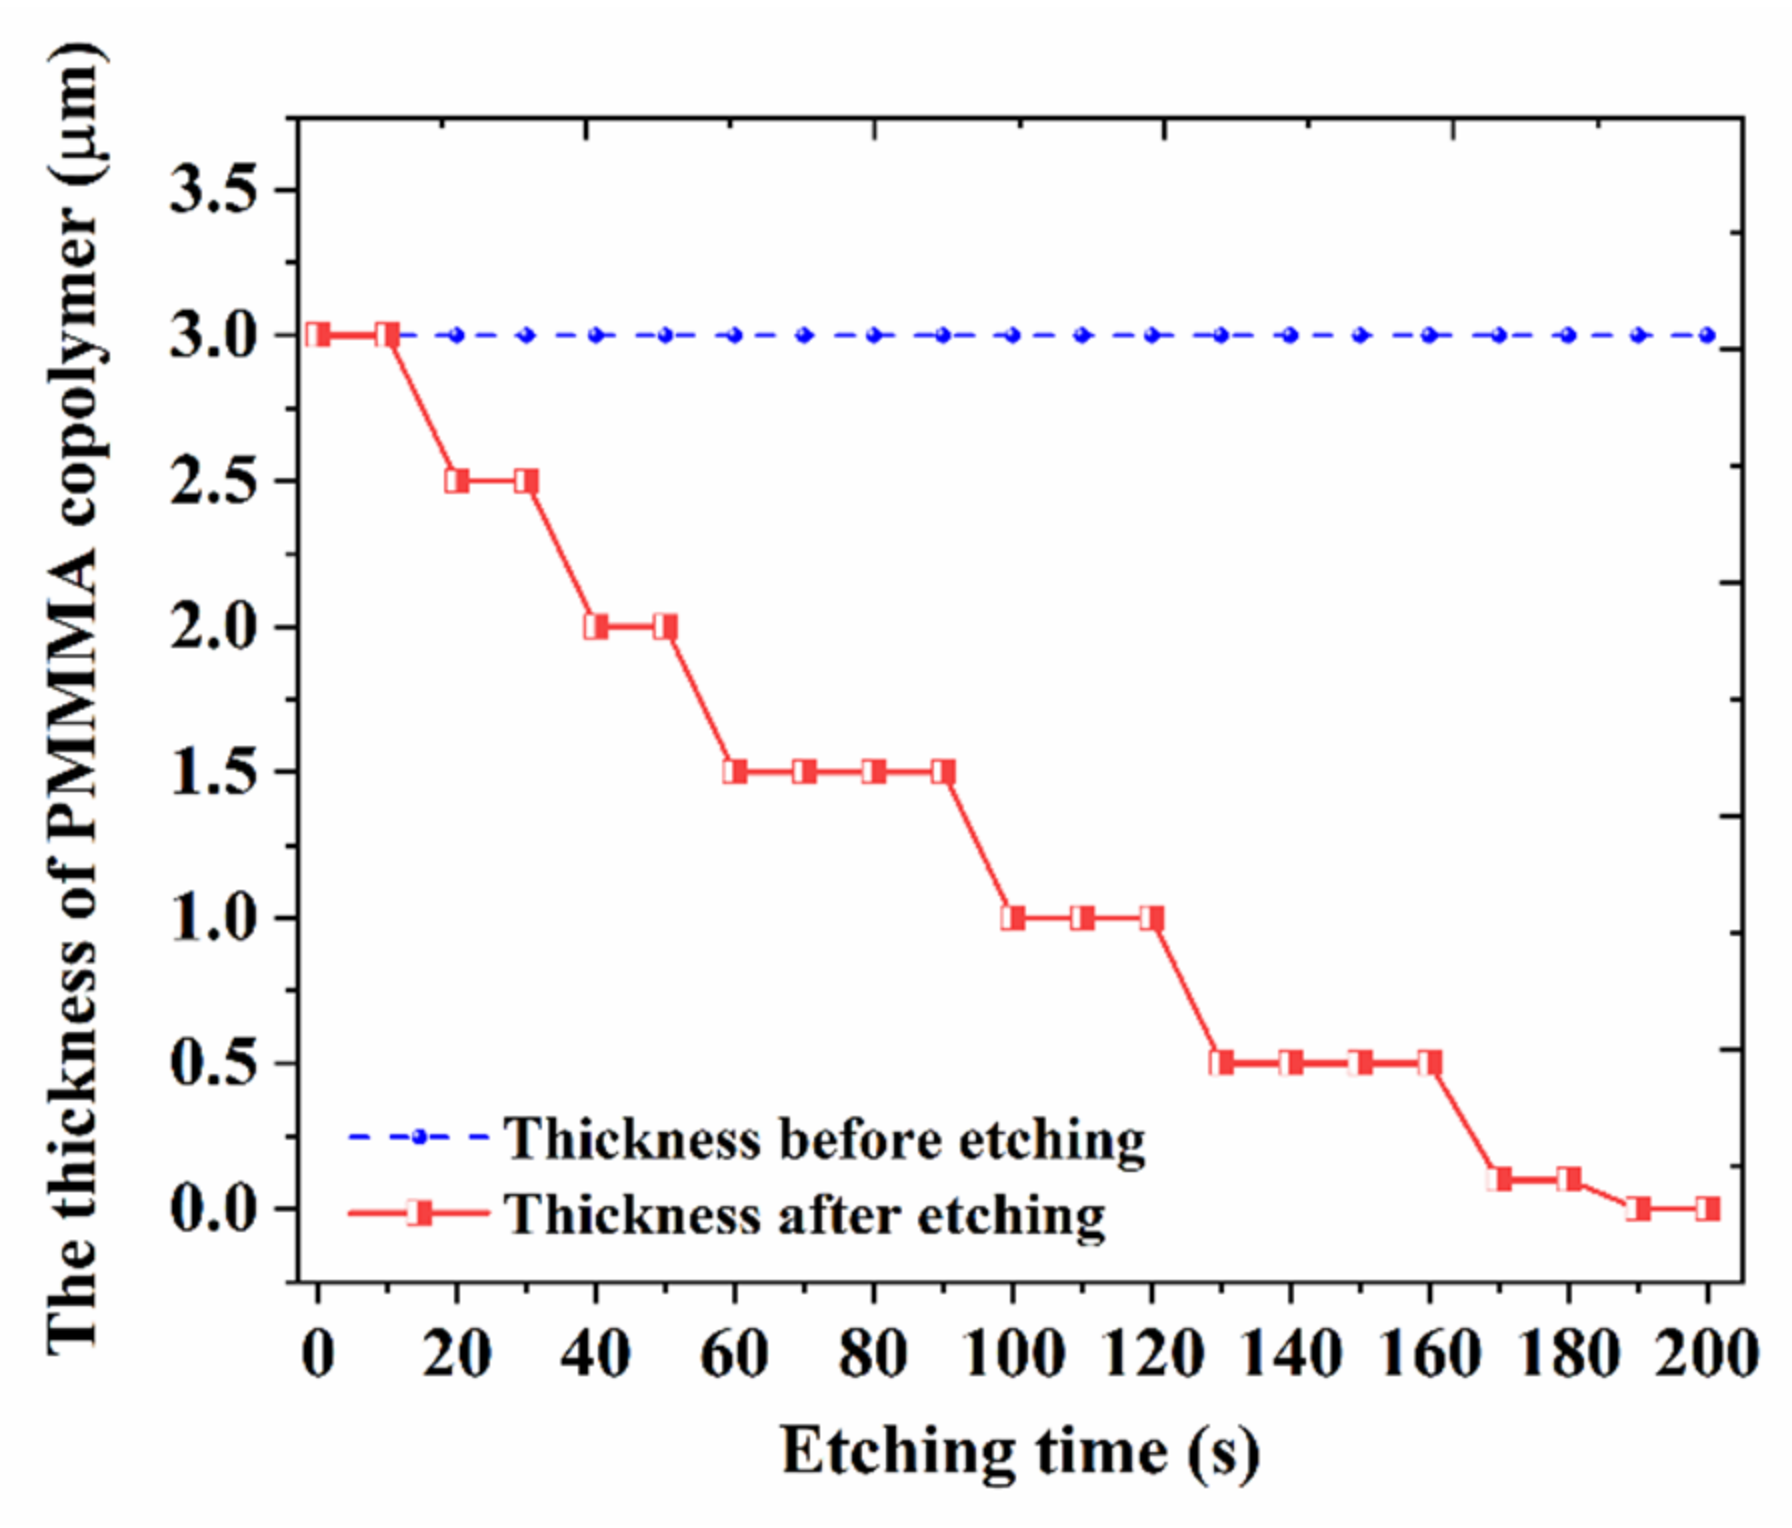
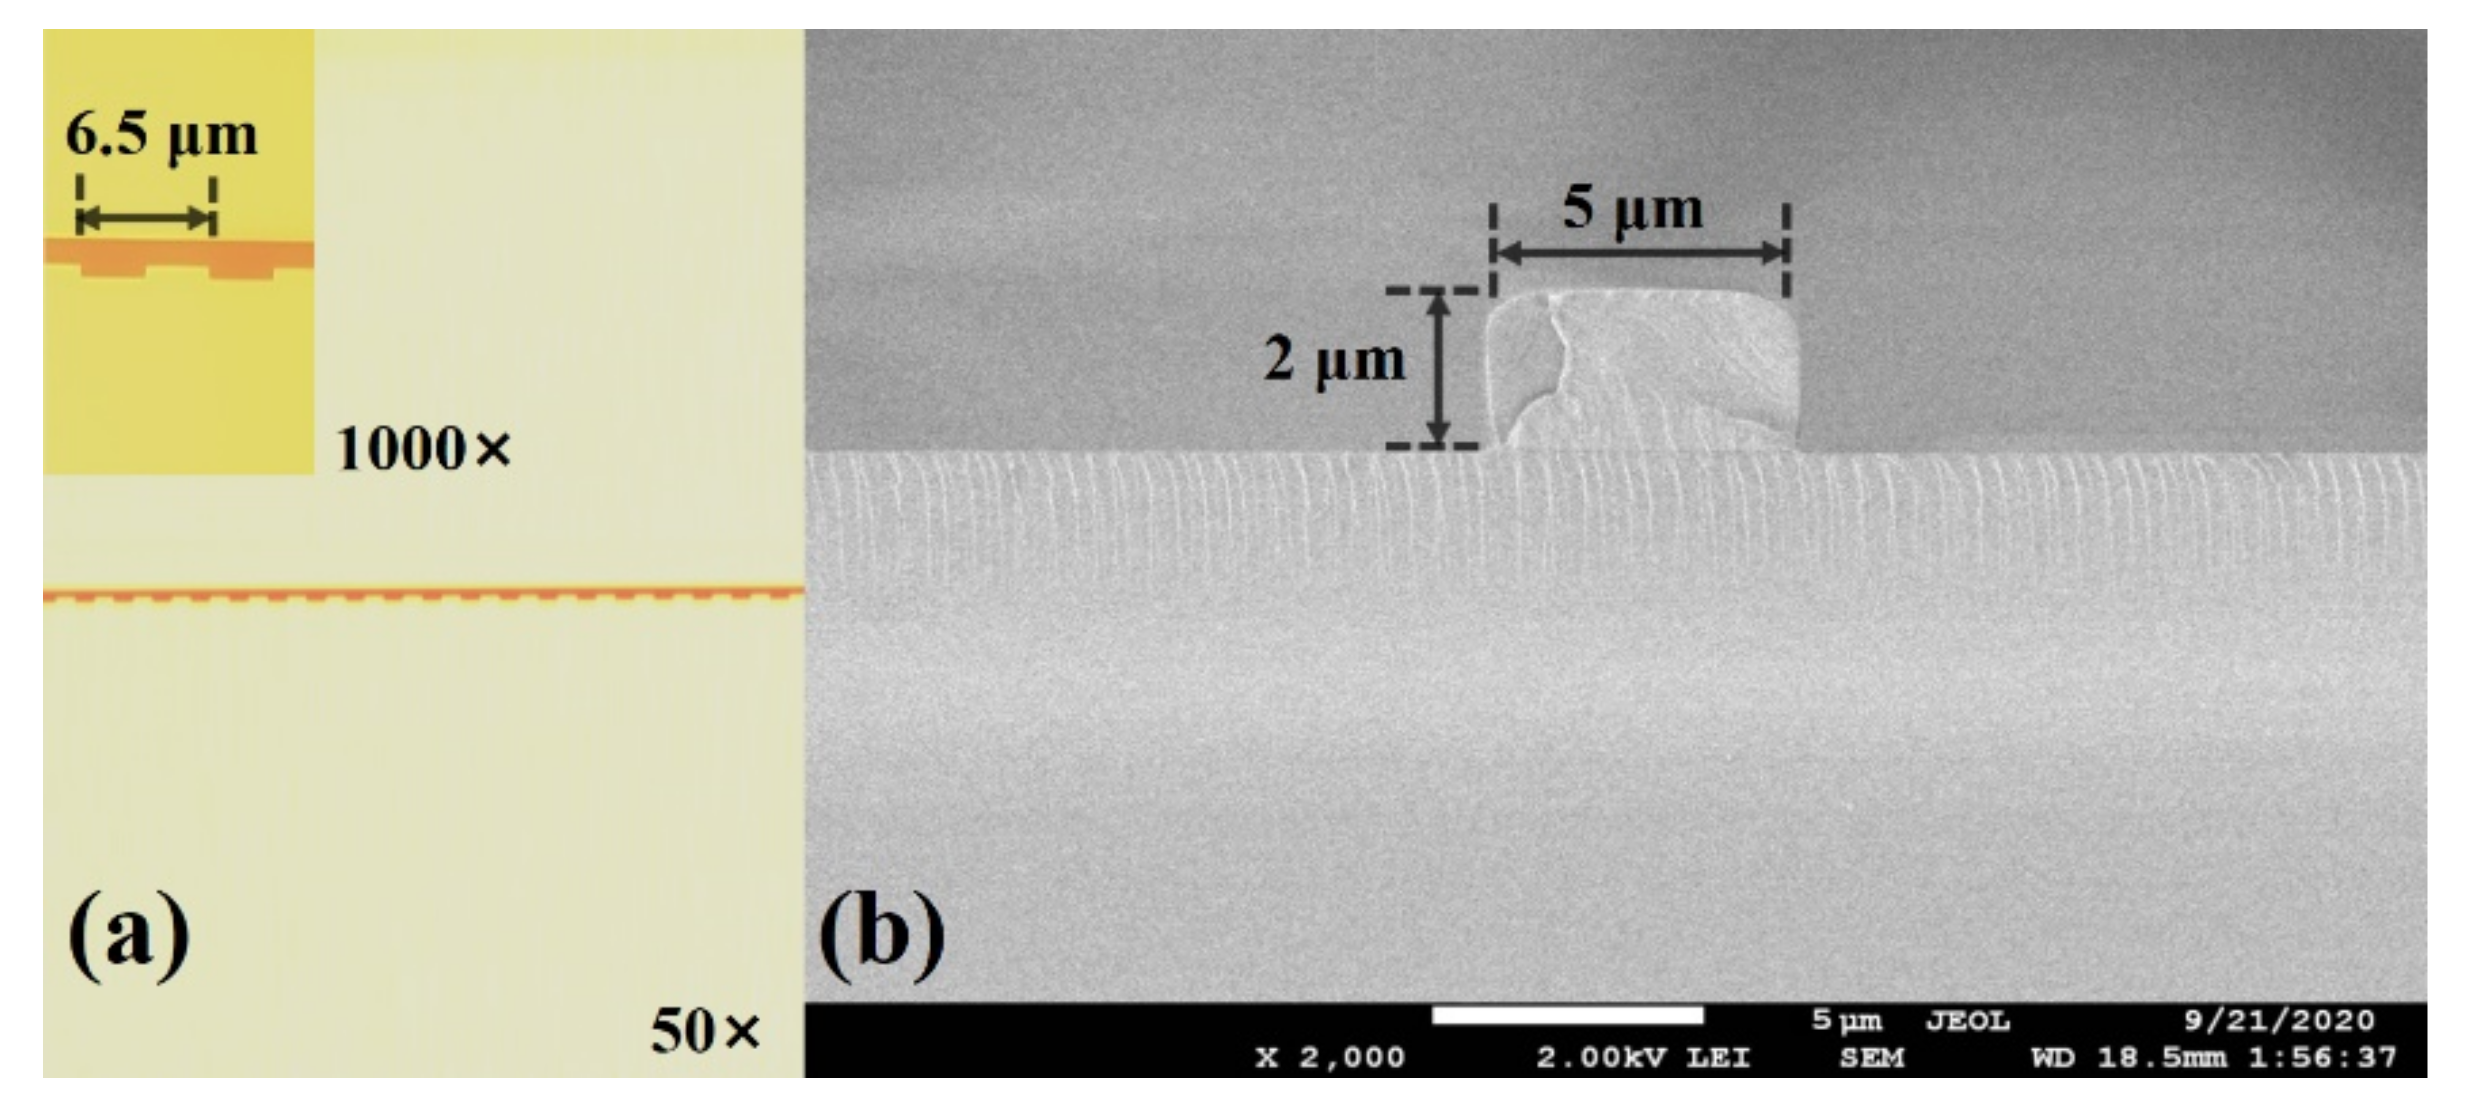
2.2. Biosensor Design and Fabrication
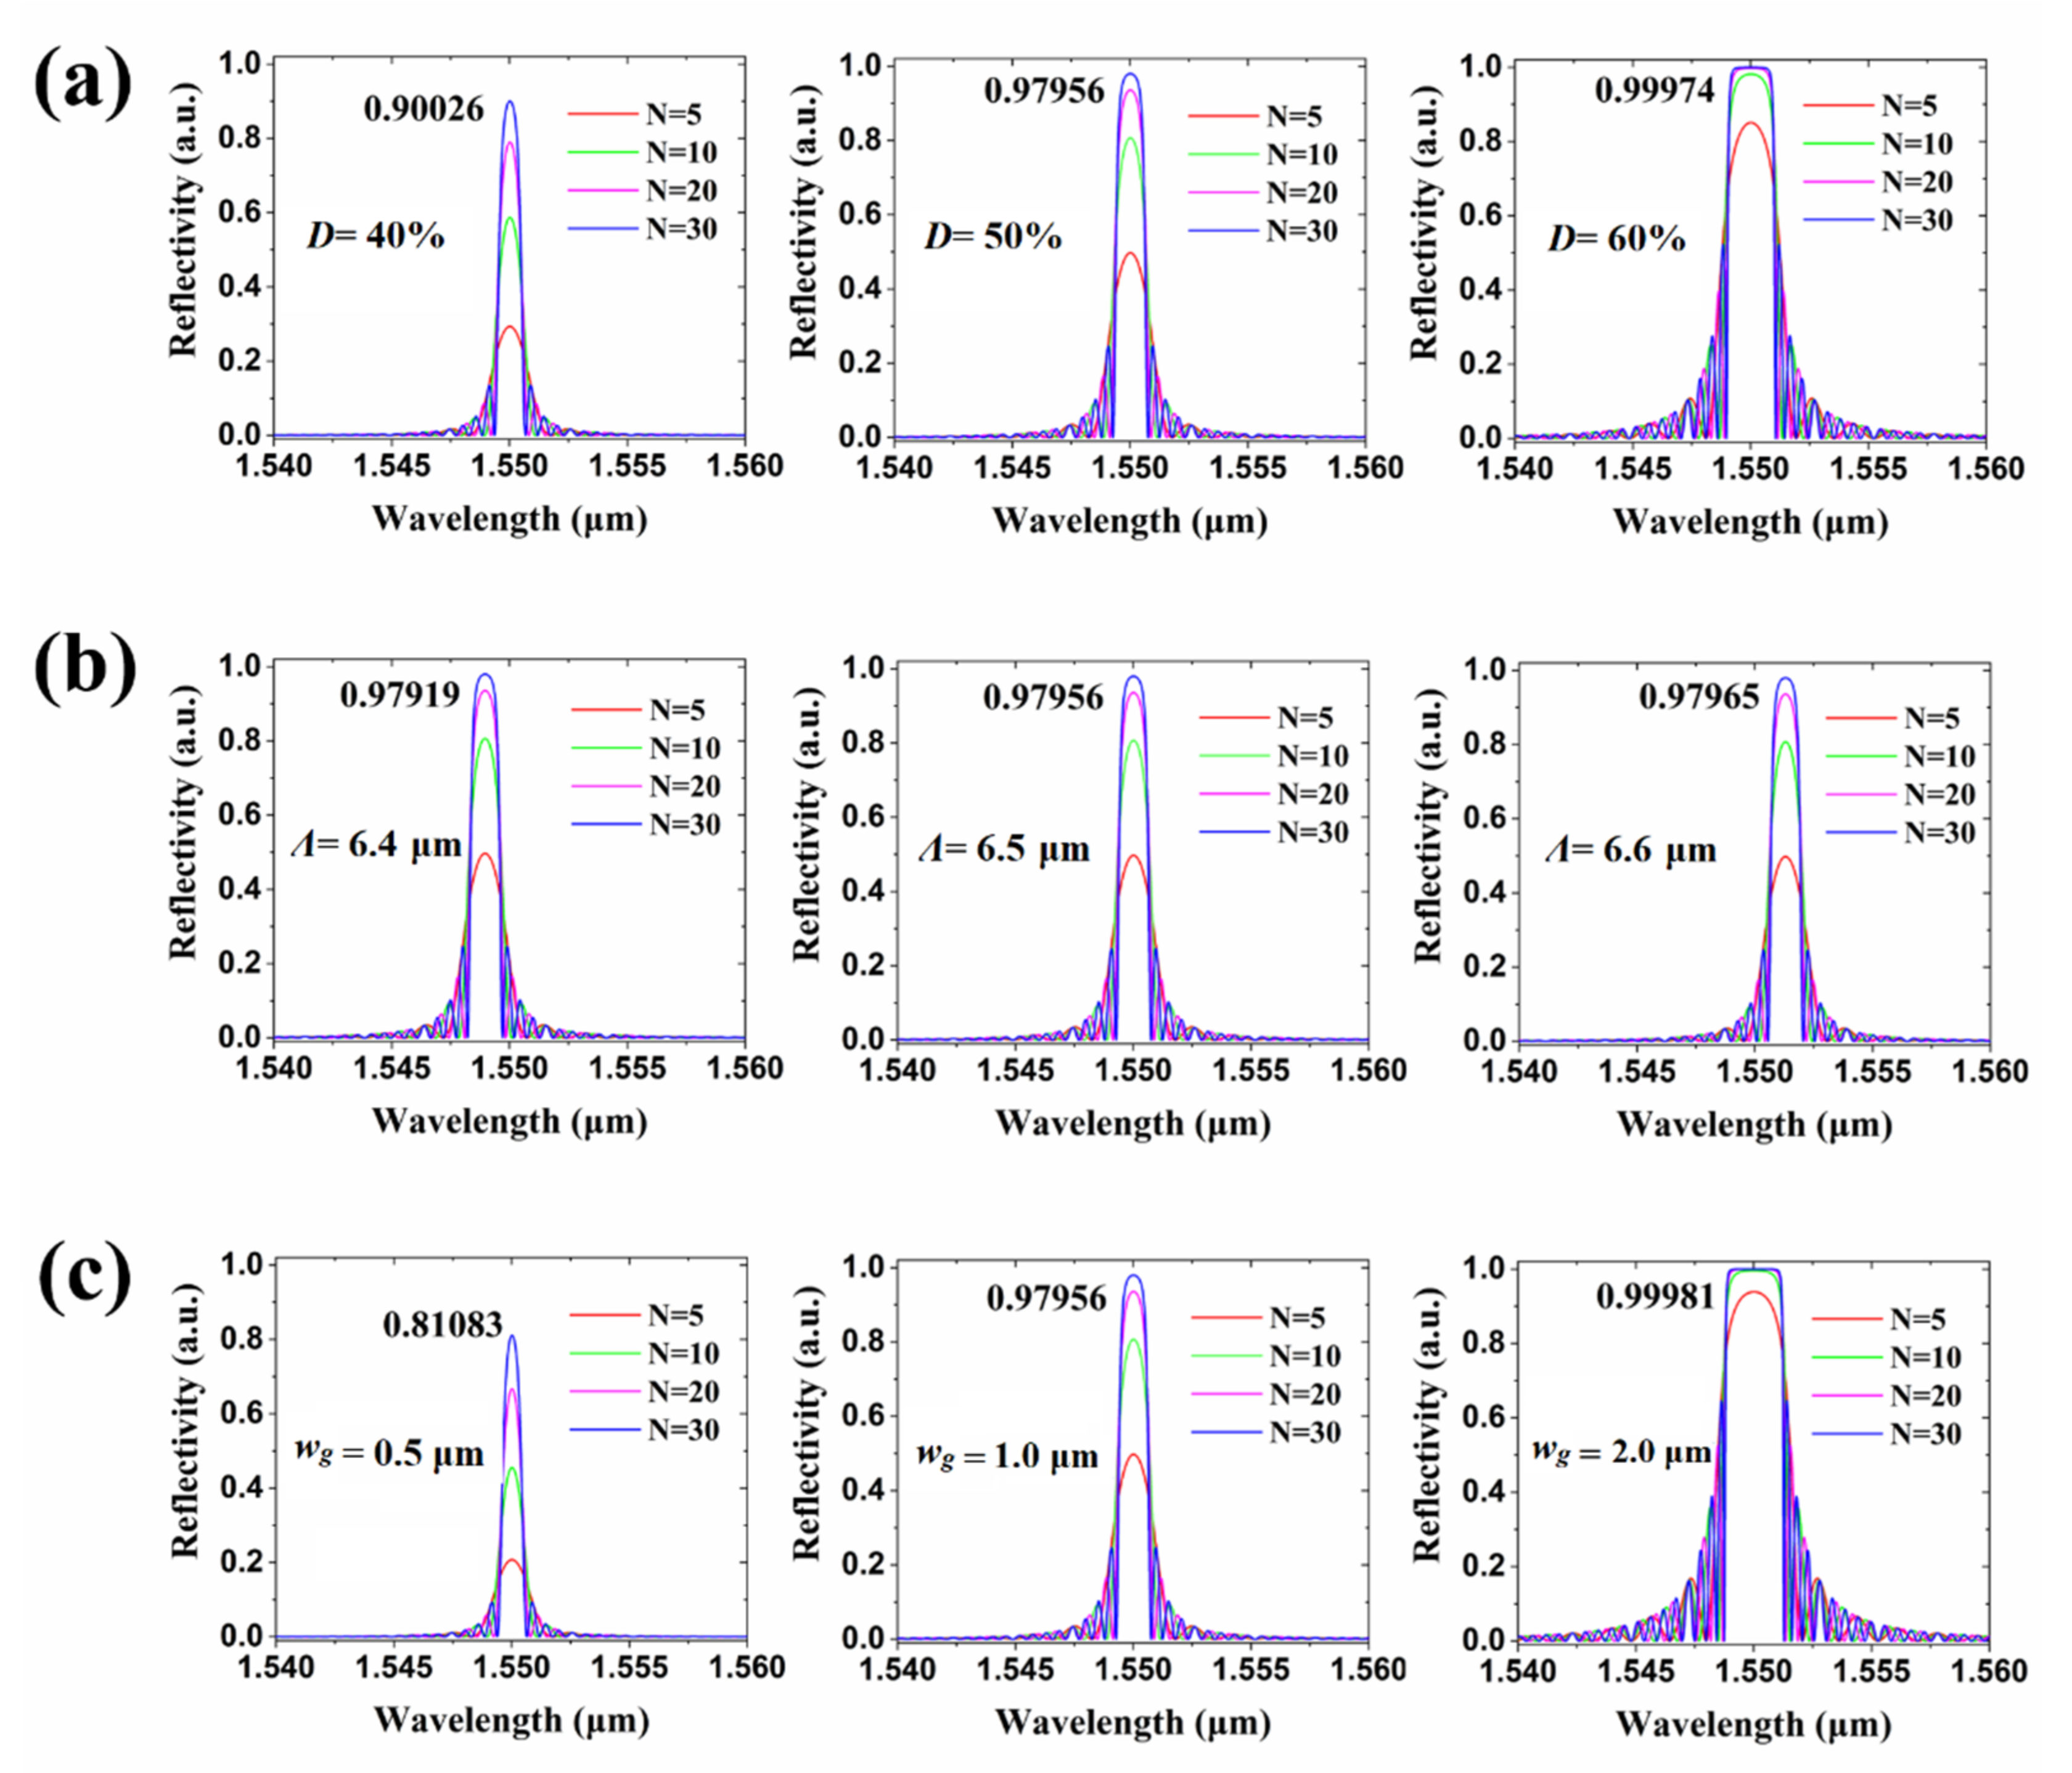
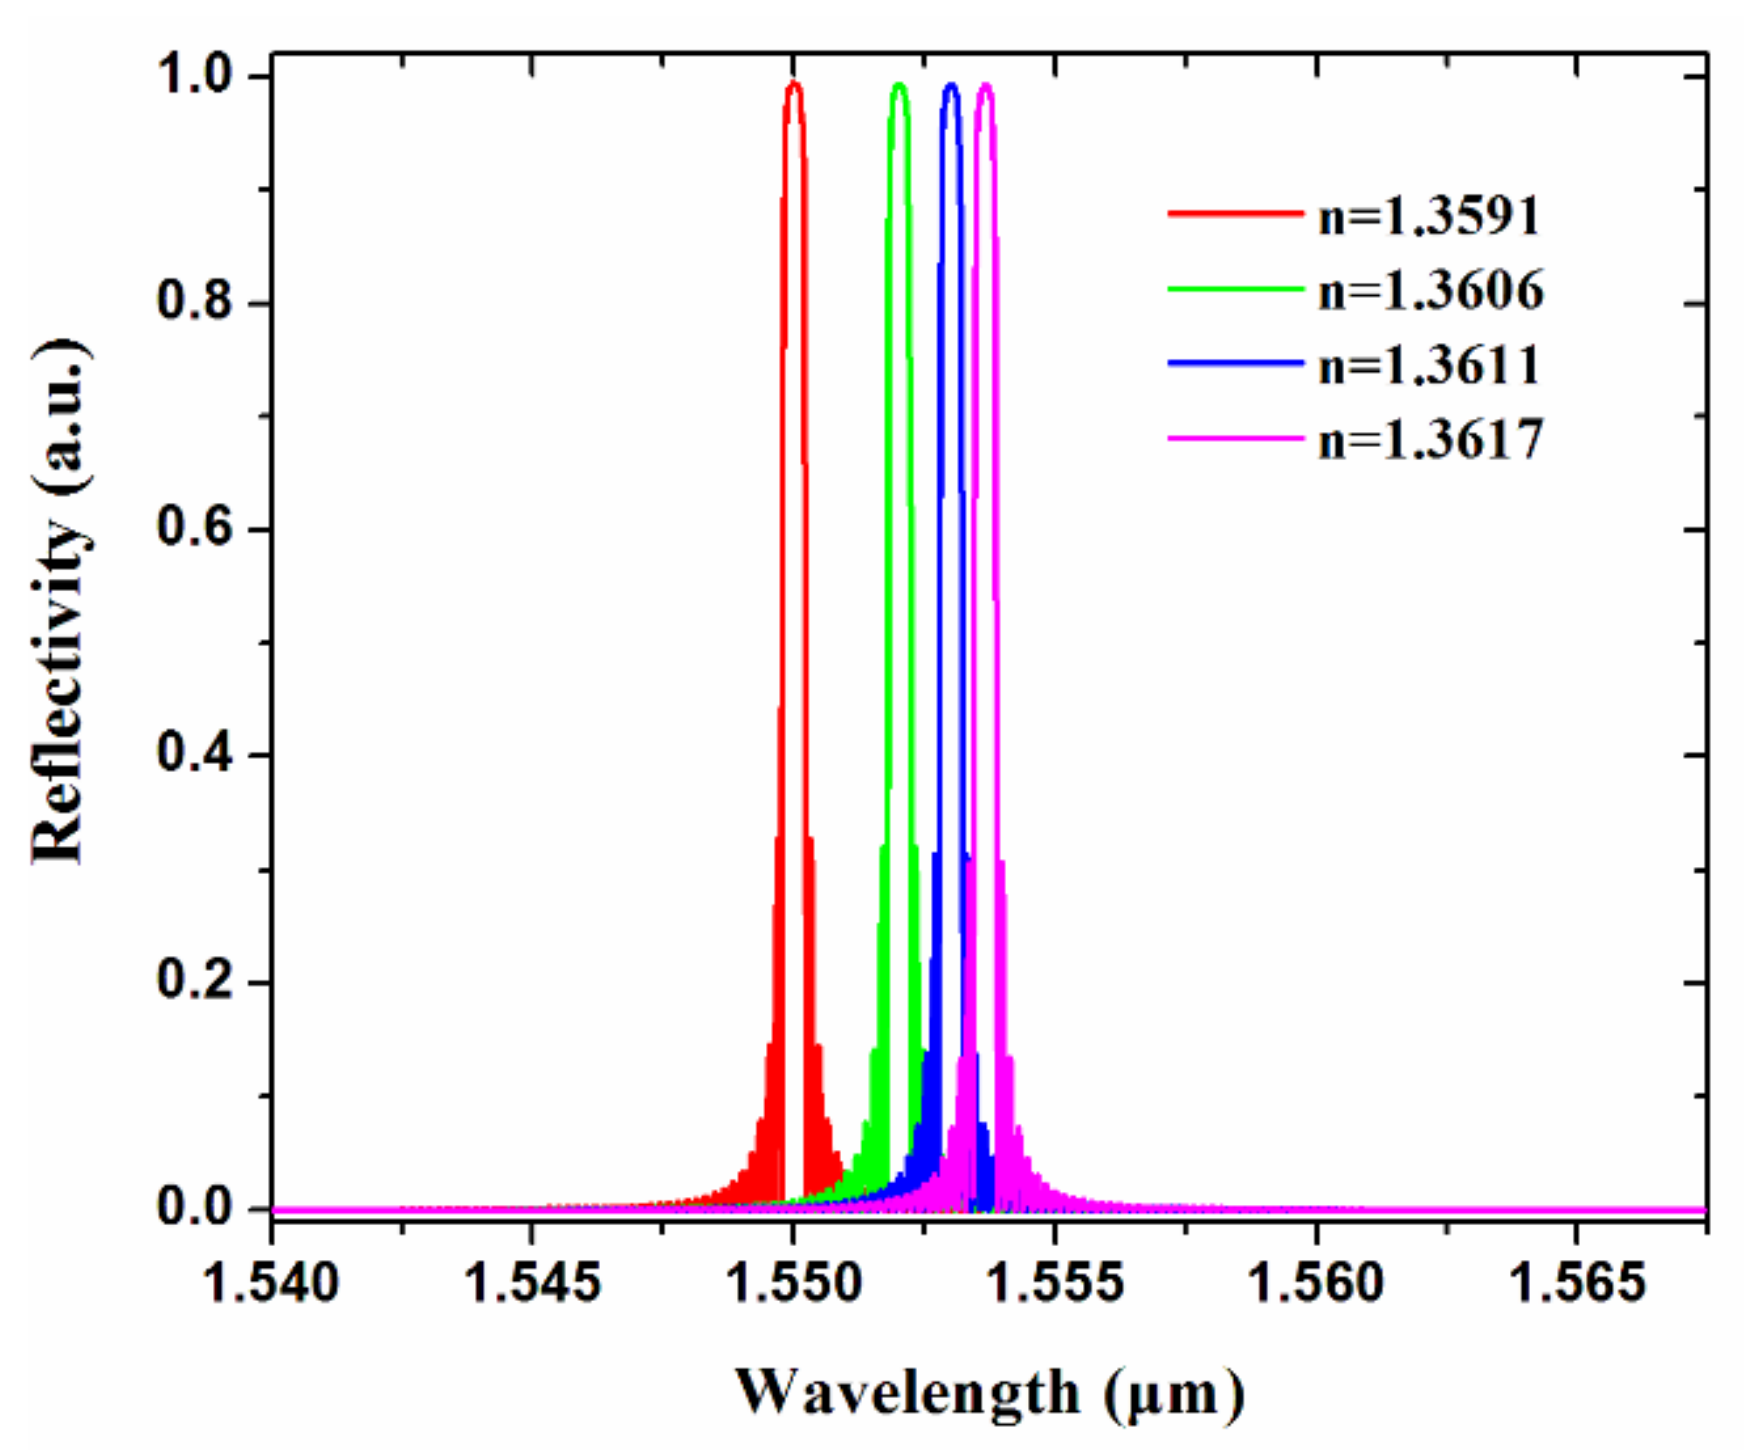
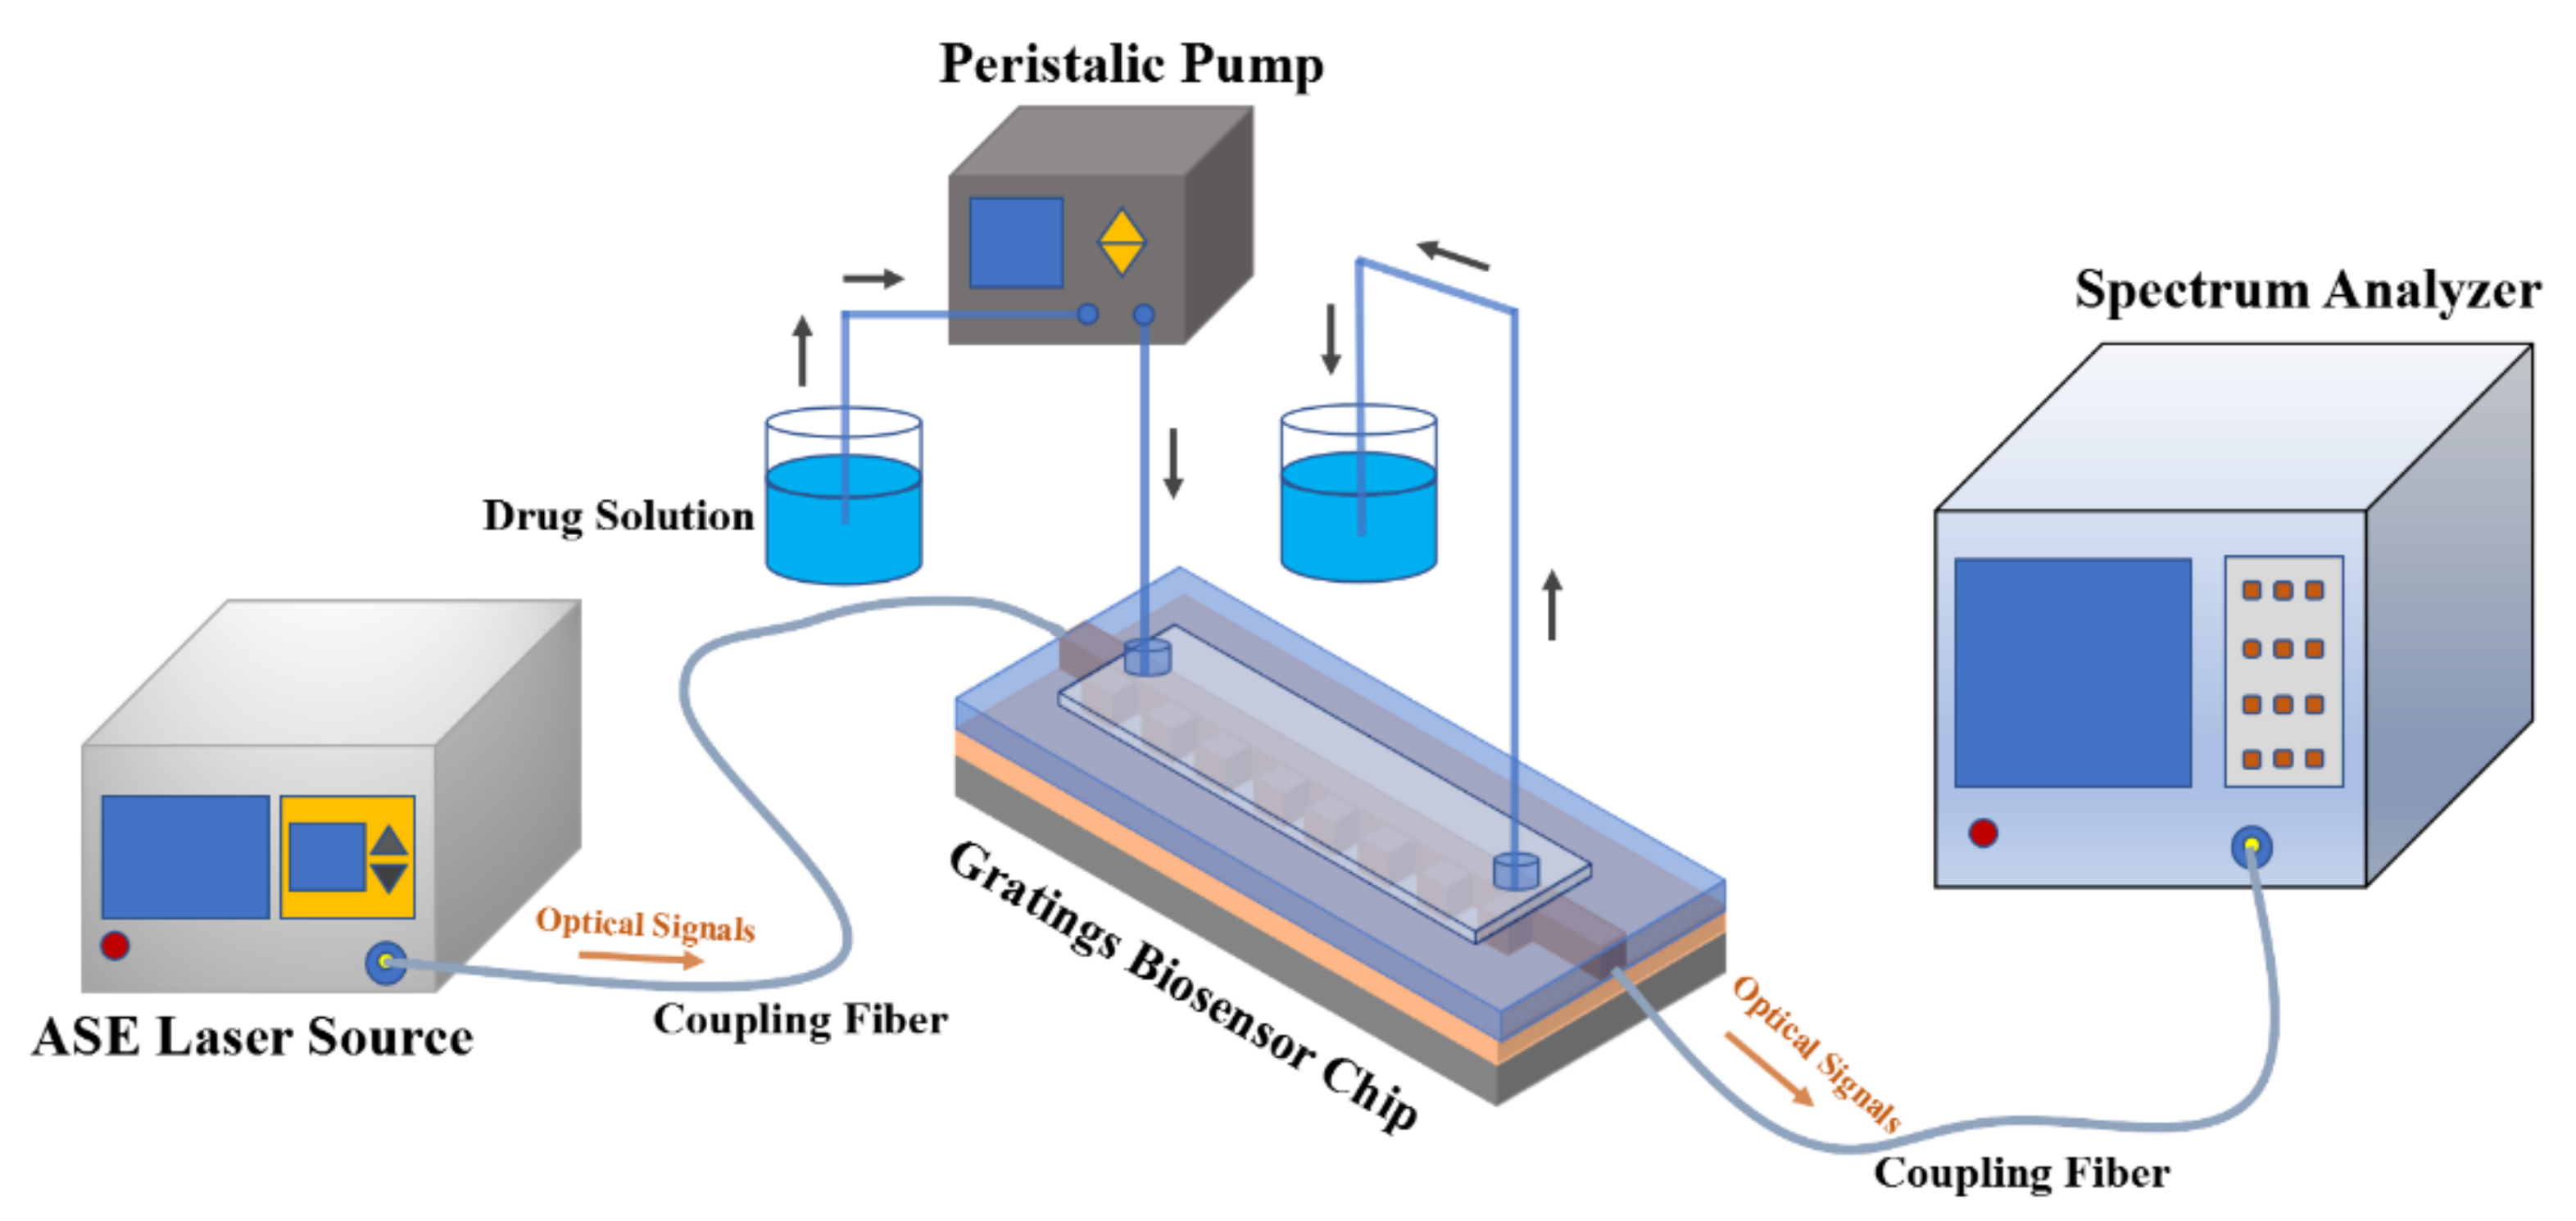
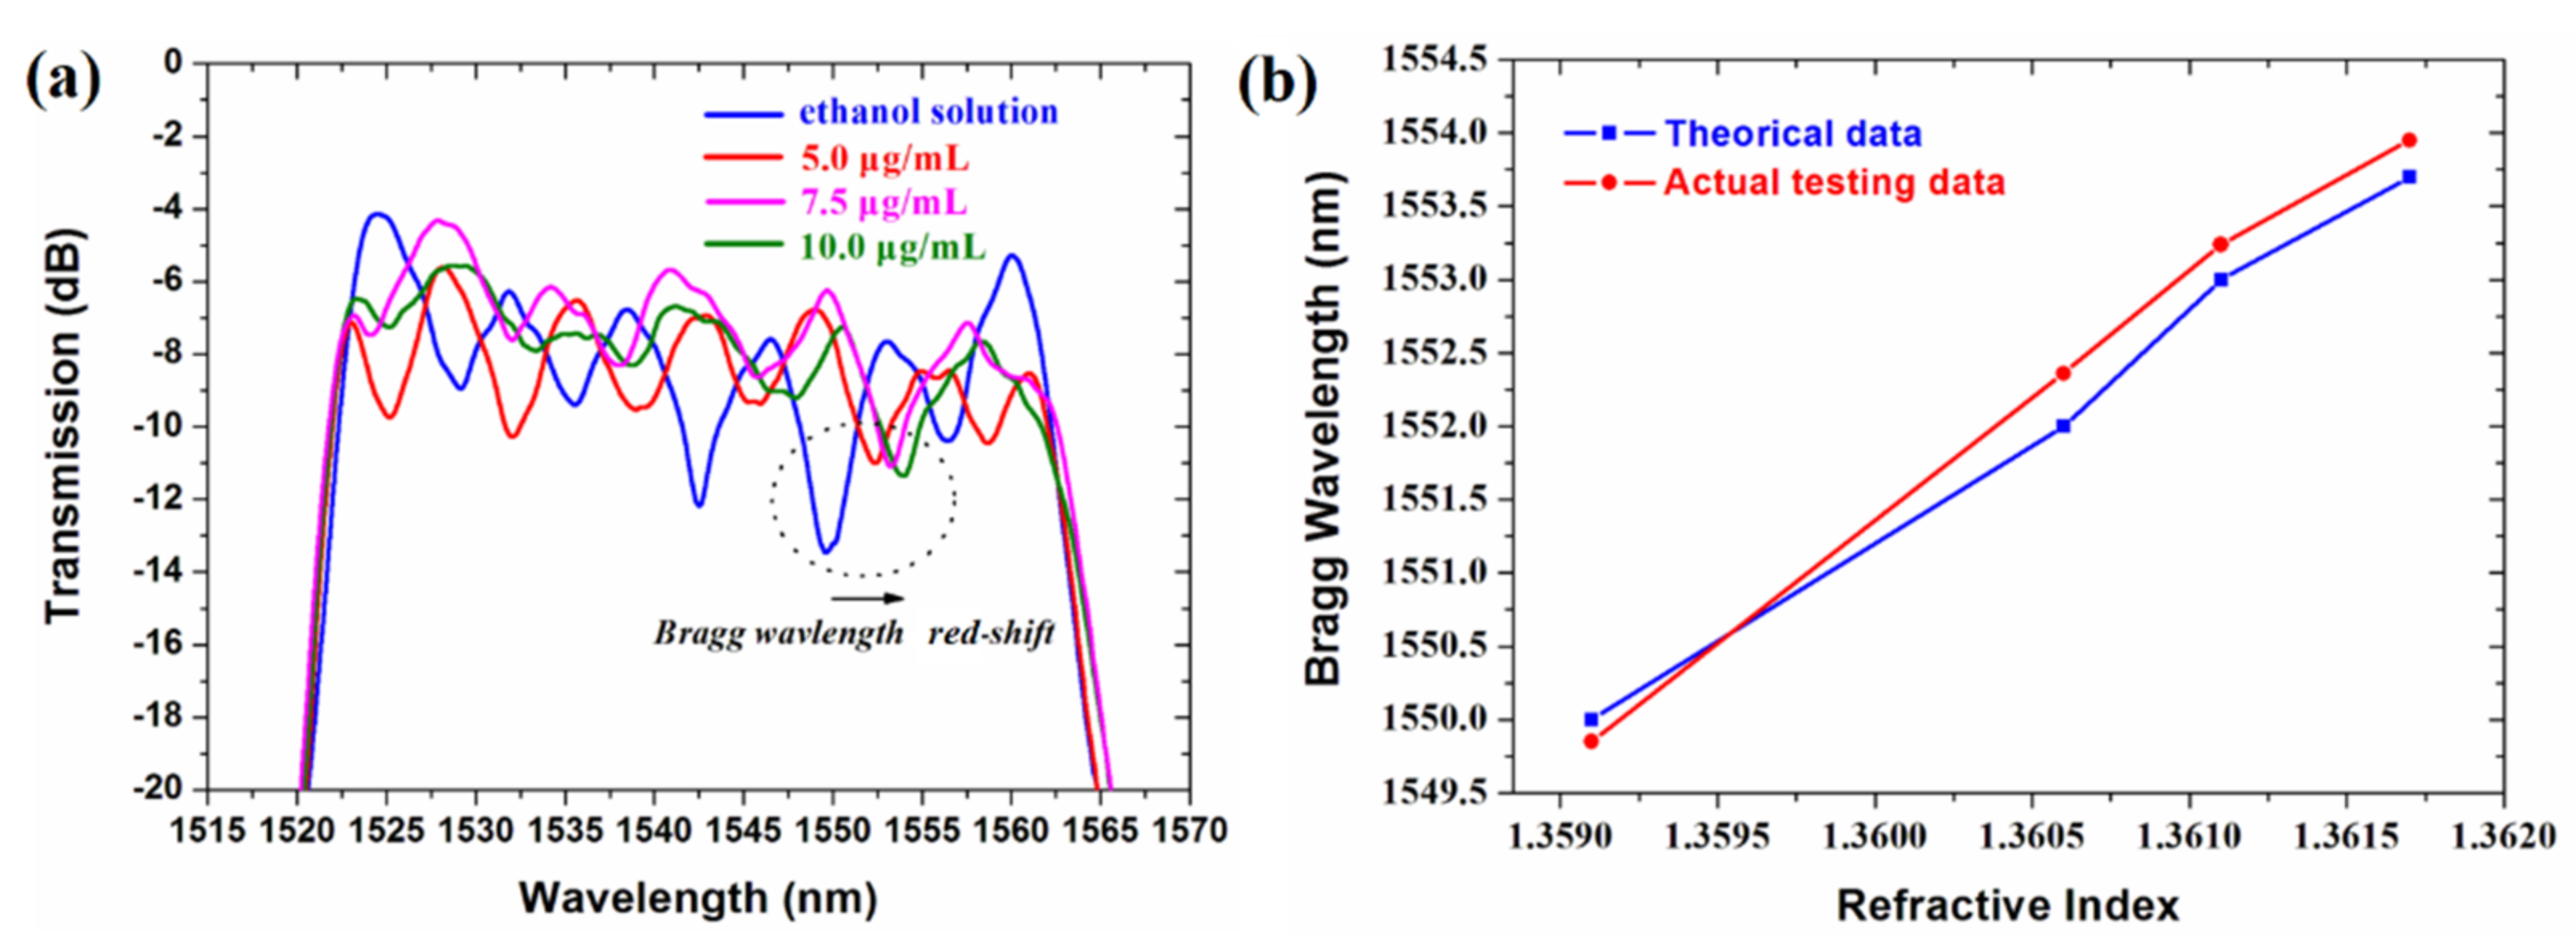
2.3. Biosensor Measurement and Discussion
3. Conclusions
Author Contributions
Funding
Institutional Review Board Statement
Informed Consent Statement
Data Availability Statement
Acknowledgments
Conflicts of Interest
References
- Van, T.A.; Montoro, P. Chemical analysis and quality control of Ginkgo biloba leaves, extracts, and phytopharmaceuticals. J. Chromatogr. A 2009, 216, 2002–2032. [Google Scholar]
- Braquet, P.; Hosford, D. Ethnopharmacology and the development of natural PAF antagonists as therapeutic agents. J. Ethnopharmacol. 1991, 32, 135–139. [Google Scholar] [CrossRef]
- Dong, H.; Xia, F.; Guo, X.; Hu, X.; Lv, S.; Zhang, L.; Bai, H.; Wu, S.; Fu, B.; Shen, H.; et al. A mechanism of Ginkgolide A protection from acute lung injury induced by LPS in mice. Chin. J. Vet. Sci. 2014, 34, 593–600. [Google Scholar]
- Li, N.; Zhang, H.; Luo, H.; Zhang, L.; Xiong, Y.; Jia, Z. Establishment of high performance liquid Chromatography-Tandem mass spectrometry for intracellular adenosines analysis and its applications. Prog. Biochem. Biophys. 2013, 40, 273–280. [Google Scholar] [CrossRef]
- Can, N.; Altiokka, G.; Aboul-Enein, H. Determination of cefuroxime axetil in tablets and biological fluids using liquid chromatography and flow injection analysis. Anal. Chim. Acta 2006, 576, 246–252. [Google Scholar] [CrossRef]
- Chiang, L.; Wang, C.; Lin, T.; Pappert, S.; Yu, P. Highly sensitive silicon photonic temperature sensor based on liquid crystal filled slot waveguide directional coupler. Opt. Express 2020, 28, 29345–29356. [Google Scholar] [CrossRef]
- Barshilia, D.; Chau, L.; Chang, G. Low-cost planar waveguide-based optofluidic sensor for real-time refractive index sensing. Opt. Express 2020, 28, 27337–27345. [Google Scholar] [CrossRef]
- Wang, G.; Wang, C.; Sun, S. An optical waveguide sensor based on mesoporous silica films with a comparison to surface plasmon resonance sensors. Sens. Actuators B Chem. 2018, 255, 3400–3408. [Google Scholar] [CrossRef]
- Yi, P.F.; Shen, P.; Zheng, Y.; Chen, C.; Liang, L.; Wang, J.; ShangGuan, L.; Zhang, D. Metal-printing directly defined polymer optical waveguide sensors for detecting effective anti-inflammatory concentrations of peimine as fritillaria alkaloid drugs. Opt. Mater. Express 2017, 7, 2230–2241. [Google Scholar] [CrossRef]
- Enemuo, A.; Chaudhuri, R.; Song, Y.; Seo, S. Thermo-Optic Sensor Based on Resonance Waveguide Grating for Infrared/Thermal Imaging. IEEE Sens. J. 2015, 15, 4213–4217. [Google Scholar] [CrossRef]
- Dullo, F.; Lindecrantz, S.; Jágerská, J.; Hansen, J.; Engqvist, M.; Solbø, S.; Hellesø, O. Sensitive on-chip methane detection with a cryptophane-A cladded Mach-Zehnder interferometer. Opt. Express 2015, 23, 31564–31573. [Google Scholar] [CrossRef]
- Flueckiger, J.; Schmidt, S.; Donzella, V.; Sherwali, A.; Ratner, D.; Chrostowski, L.; Cheung, K. Sub-wavelength grating for enhanced ring resonator biosensor. Opt. Express 2016, 24, 15672–15686. [Google Scholar] [CrossRef] [PubMed]
- Sulabh; Singh, L.; Jain, S.; Kumar, M. Optical Slot Waveguide with Grating-Loaded Cladding of Silicon and Titanium Dioxide for Label-Free Bio-Sensing. IEEE Sens. J. 2019, 19, 6126–6133. [Google Scholar] [CrossRef]
- Luan, E.; Han, Y.; Ma, M.; Ratner, D.; Cheun, K.; Chrostowski, L. Label-free biosensing with a multi-box sub-wavelength phase-shifted Bragg grating waveguide. Biomed. Opt. Express 2019, 10, 4825–4838. [Google Scholar] [CrossRef] [PubMed]
- Li, J.; Qu, H.; Wang, J. Photonic Bragg waveguide platform for multichannel resonant sensing applications in the THz range. Biomed. Opt. Express 2020, 11, 2476–2489. [Google Scholar] [CrossRef]
- Pia, M.; Zheng, C.; Bia, R.; Zhao, H.; Liang, L.; Zhang, Y.; Wang, Y.; Tittel, F. Design of a mid-infrared suspended chalcogenide/silica-on-silicon slot-waveguide spectroscopic gas sensor with enhanced light-gas interaction effect. Sens. Actuators B Chem. 2019, 297, 126732. [Google Scholar] [CrossRef]
- Wei, H.; Krishnaswamy, S. Direct laser writing of a phase-shifted Bragg grating waveguide for ultrasound detection. Opt. Lett. 2019, 44, 3817–3820. [Google Scholar] [CrossRef] [PubMed]
- Kefer, S.; Sauer, T.; Hessler, S.; Kaloudis, M.; Hellmann, R. Microstructure-Based Fiber-To-Chip Coupling of Polymer Planar Bragg Gratings for Harsh Environment Applications. Sensors 2020, 20, 5452. [Google Scholar] [CrossRef]
- Wang, P.; Geng, X.; Pi, G.; Shi, R.; Yuan, Z.; Wang, C. Preparative separation of four individual flavonoids in Scutellaria barbata D. Don based on high selectivity polymeric adsorbents with different polarities. J. Chromatogr. B Anal. Technol. Biomed. Life Sci. 2010, 878, 3375–3381. [Google Scholar] [CrossRef]
- Ba, J.; Zhang, N.; Yao, L.; Ma, N.; Wang, C. Separation of Rebaudiana A from Steviol glycoside using a polymeric adsorbent with multi-hydrogen bonding in a non-aqueous system. J. Chromatogr. B Anal. Technol. Biomed. Life Sci. 2014, 971, 141–149. [Google Scholar] [CrossRef]
- Chen, C.; Niu, X.; Han, C.; Shi, Z.; Wang, X.; Sun, X.; Wang, F.; Cui, Z.; Zhang, D. Reconfigurable optical interleaver modules with tunable wavelength transfer matrix function using polymer photonics lightwave circuits. Opt. Express 2014, 22, 19895–19911. [Google Scholar] [CrossRef] [PubMed]
- Chen, C.; Niu, X.; Han, C.; Shi, Z.; Wang, X.; Sun, X.; Wang, F.; Cui, Z.; Zhang, D. Monolithic multi-functional integration of ROADM modules based on polymer photonic lightwave circuit. Opt. Express 2014, 22, 10716–10727. [Google Scholar] [CrossRef]
- Greene, D.; King, N.; Coe, J. Diabetes and Humor: A Preliminary Investigation. Diabetes Spectr. 2020, 33, 175–181. [Google Scholar] [CrossRef]
- Huang, L.; Yan, H.; Xu, X.; Chakravarty, S.; Tang, N.; Tian, H.; Chen, R.T. Improving the detection limit for on-chip photonic sensors based on subwavelength grating racetrack resonators. Opt. Express 2017, 25, 10527–10535. [Google Scholar] [CrossRef] [PubMed] [Green Version]
- Zhang, L.; Dai, D. Silicon subwavelength-grating microdisks for optical sensing. IEEE Photonics Technol. Lett. 2019, 31, 1209–1212. [Google Scholar] [CrossRef]
- Tu, Z.; Gao, D.; Zhang, M.; Zhang, D. High-sensitivity complex refractive index sensing based on Fano resonance in the subwavelength grating waveguide micro-ring resonator. Opt. Express 2017, 25, 20911–20922. [Google Scholar] [CrossRef] [PubMed]


| Name | Sequence | Length |
|---|---|---|
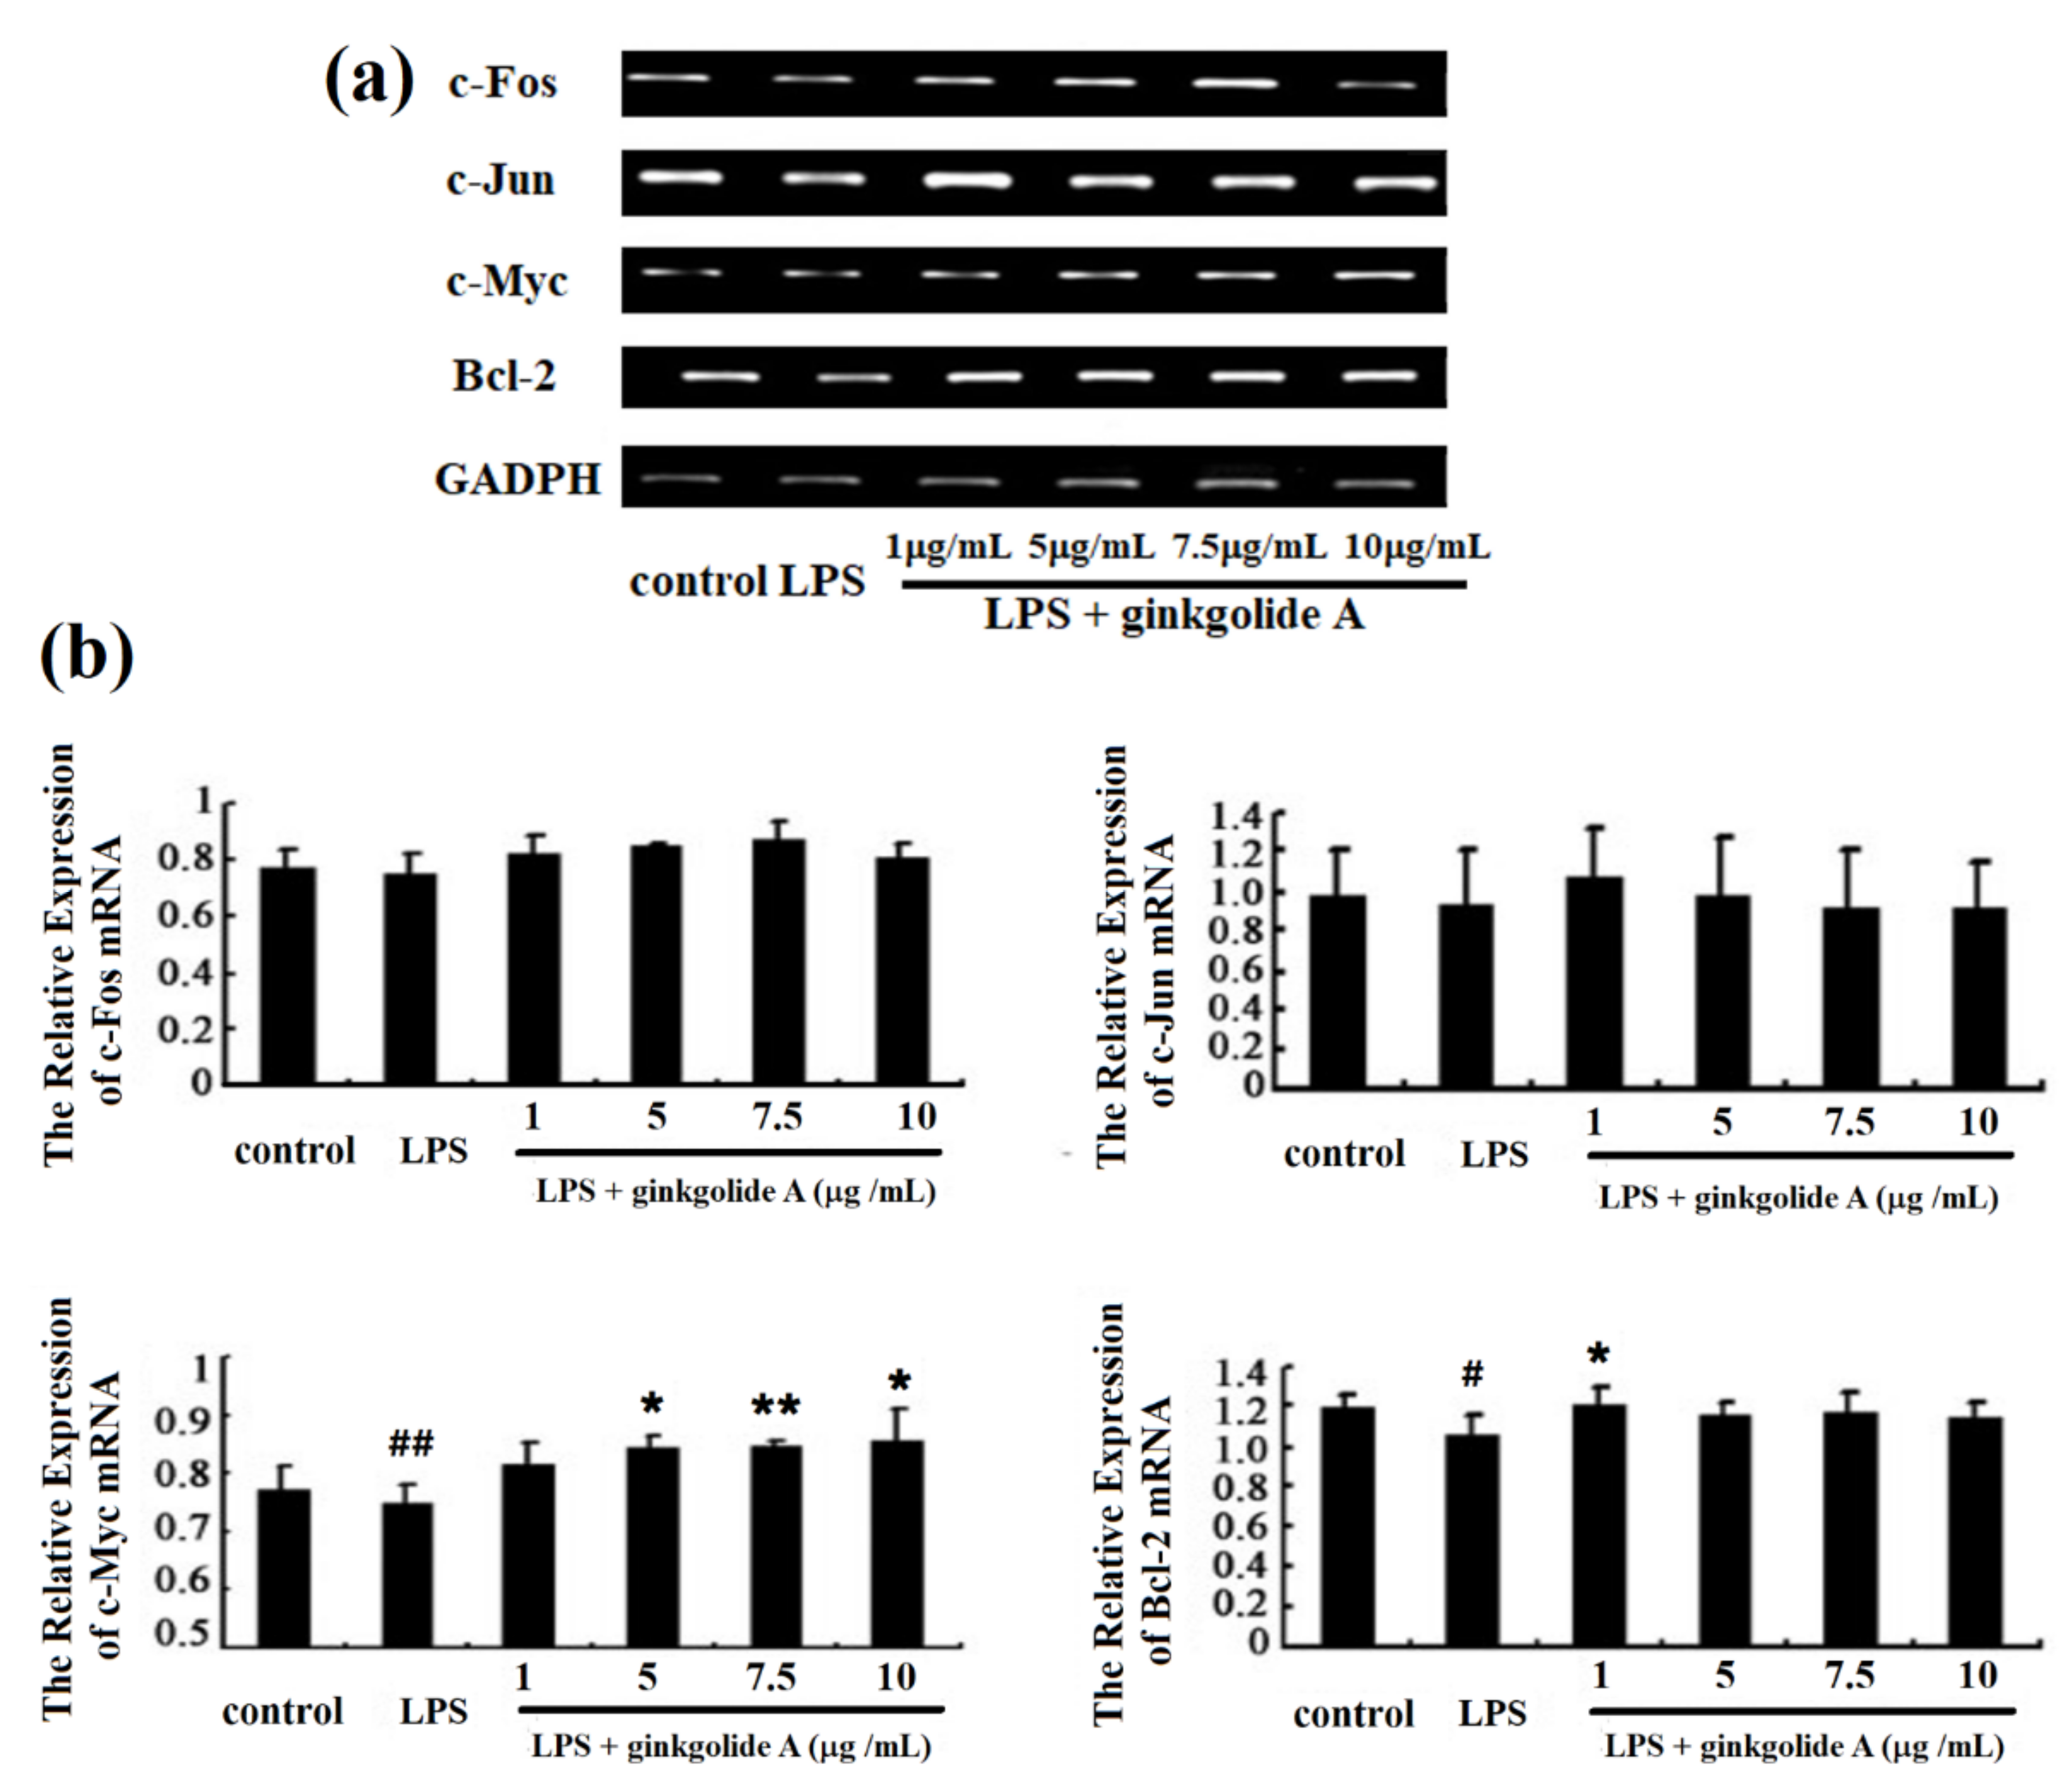
| c-Fos | forward 5′-CCCGTAGACCTAGGGAGGAC- 3′reverse 5′-CAATACACTCCATGCGGTTG- 3′ | 189 bp |
| c-Jun | forward 5′-ACGCCAACCTCAGCAACTT- 3′ | 192 bp |
| reverse 5′-TCTGCGGCTCTTCCTTCA- 3′ | ||
| c-Myc | forward 5′-ACAACCGCAAATGCTCCA- 3′ | 259 bp |
| reverse 5′-CGCCGTTTCCTCAGTAAGTC- 3′ | ||
| Bcl-2 | forward 5′-GGCATCTTCTCCTTCCAGC- 3′ | 476 bp |
| reverse 5′-TCCCAGCCTCCGTTATCC- 3′ | ||
| GAPDH | forward 5′-CACTGCCACTCAGAAGACT- 3′ | 177 bp |
| reverse 5′-ACATTGGGGGTAGGAACAC- 3′ |
| Ginkgolide A Ethanol Solution | ||||
|---|---|---|---|---|
| Ginkgolide A concentration (µg/mL) | 0 | 5.0 | 7.5 | 10.0 |
| Refractive index of drug solution | 1.3591 | 1.3606 | 1.3611 | 1.3617 |
| Type of Device | Analyte | Operating Area (μm2) | Sensitivity | Reference |
|---|---|---|---|---|
| Racetrack grating | Glycerol | 314 | 429 nm/RIU | [24] |
| Microdisk grating | NaCl | 114 | 390.4 nm/RIU | [25] |
| Microring grating | Glucose | 80 | 363 nm/RIU | [26] |
| Linear grating | Ginkgolide A | 260 | 1606.2 nm/RIU | This work |
Publisher’s Note: MDPI stays neutral with regard to jurisdictional claims in published maps and institutional affiliations. |
© 2021 by the authors. Licensee MDPI, Basel, Switzerland. This article is an open access article distributed under the terms and conditions of the Creative Commons Attribution (CC BY) license (https://creativecommons.org/licenses/by/4.0/).
Share and Cite
Wang, C.; Yi, P.; Li, J.; Dong, H.; Chen, C.; Zhang, D.; Shen, H.; Fu, B. Polymer Optical Waveguide Grating-Based Biosensor to Detect Effective Drug Concentrations of Ginkgolide A for Inhibition of PMVEC Apoptosis. Biosensors 2021, 11, 264. https://doi.org/10.3390/bios11080264
Wang C, Yi P, Li J, Dong H, Chen C, Zhang D, Shen H, Fu B. Polymer Optical Waveguide Grating-Based Biosensor to Detect Effective Drug Concentrations of Ginkgolide A for Inhibition of PMVEC Apoptosis. Biosensors. 2021; 11(8):264. https://doi.org/10.3390/bios11080264
Chicago/Turabian StyleWang, Chunxue, Pengfei Yi, Jiang Li, Haibing Dong, Changming Chen, Daming Zhang, Haiqing Shen, and Bendong Fu. 2021. "Polymer Optical Waveguide Grating-Based Biosensor to Detect Effective Drug Concentrations of Ginkgolide A for Inhibition of PMVEC Apoptosis" Biosensors 11, no. 8: 264. https://doi.org/10.3390/bios11080264