Impedimetric Sensing of Factor V Leiden Mutation by Zip Nucleic Acid Probe and Electrochemical Array


Abstract
:
1. Introduction
2. Materials and Methods
2.1. Instruments and Chemicals
2.2. Methodology
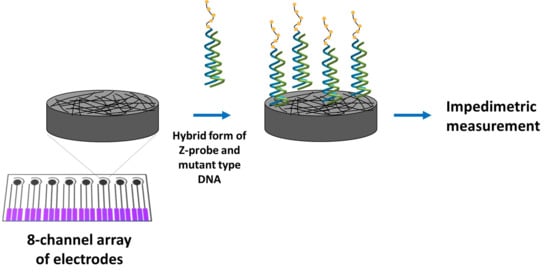
- (i).
- Hybridization of the Z-probe with mutant type DNA, or wild type DNA, or C-mutant type DNA, T-mutant type DNA, ODN-1, ODN-2, mutant type, and wild type PCR in the solution phase;
- (ii).
- Immobilization of the hybridization products on the working electrode area of the array electrode;
- (iii).
- Impedimetric measurements.
2.3. Electrochemical Impedance Spectroscopy Measurements
3. Results
4. Conclusions
Supplementary Materials
Author Contributions
Funding
Acknowledgments
Conflicts of Interest
References
- Song, S.; Xu, H.; Fan, C. Potential diagnostic applications of biosensors: Current and future directions. Int. J. Nanomed. 2006, 1, 433–440. [Google Scholar] [CrossRef] [Green Version]
- Sang, S.; Li, Y.; Guo, X.; Zhang, B.; Xue, X.; Zhuo, K.; Zhao, C.; Zhang, W.; Yuan, Z. A Portable Device for Rapid Detection of Human Serum Albumin using an immunoglobulin-coating-based Magnetoelastic Biosensors. Biosens. Bioelectron. 2019, 141, 111399. [Google Scholar] [CrossRef]
- Paleček, E.; Bartošík, M. Electrochemistry of Nucleic Acids. Chem. Rev. 2012, 112, 3427–3481. [Google Scholar] [CrossRef]
- Beaudet, A.L.; Belmont, J.W. Array-based DNA diagnostics: Let the revolution begin. Annu. Rev. Med. 2008, 59, 113–129. [Google Scholar] [CrossRef]
- Wakai, J.; Takagi, A.; Nakayama, M.; Miya, T.; Miyahara, T.; Iwanaga, T.; Takenaka, S.; Ikeda, Y.; Amano, M. A novel method of identifying genetic mutations using an electrochemical DNA array. Nucleic Acids Res. 2004, 32, e141. [Google Scholar] [CrossRef]
- Arduini, F.; Micheli, L.; Moscone, D.; Palleschi, G.; Piermarini, S.; Ricci, F.; Volpe, G. Electrochemical biosensors based on nanomodified screen-printed electrodes: Recent applications in clinical analysis. Trends Anal. Chem. 2016, 79, 114–126. [Google Scholar] [CrossRef] [Green Version]
- Mu, S.; Wang, X.; Li, Y.T.; Wang, Y.; Li, D.W.; Long, Y.T. A novel screen-printed electrode array for rapid high-throughput detection. Analyst 2012, 137, 3220–3223. [Google Scholar] [CrossRef]
- Apostolou, T.; Pascual, N.; Marco, M.P.; Moschos, A.; Petropoulos, A.; Kaltsas, G.; Kintzios, S. Extraction-less, rapid assay for the direct detection of 2,4,6-trichloroanisole (TCA) in cork samples. Talanta 2014, 125, 336–340. [Google Scholar] [CrossRef]
- Biscay, J.; Begoña, M.; García, G.; García, A.C. Electrochemical Biotin determination based on a screen printed carbon electrode array and magnetic beads. Sens. Actuators B 2014, 205, 426–432. [Google Scholar] [CrossRef]
- Erdem, A.; Congur, G.; Eksin, E. Multi channel screen printed array of electrodes for enzyme-linked voltammetric detection of MicroRNAs. Sens. Actuators B 2013, 188, 1089–1095. [Google Scholar] [CrossRef]
- Erdem, A.; Congur, G. Dendrimer modified 8-channel screen-printed electrochemical array system for impedimetric detection of activated protein C. Sens. Actuators B 2014, 196, 168–174. [Google Scholar] [CrossRef]
- Erdem, A.; Congur, G. Label-free voltammetric detection of MicroRNAs at multi-channel screen printed array of electrodes comparison to graphite sensors. Talanta 2014, 118, 7–13. [Google Scholar] [CrossRef] [PubMed]
- Erdem, A.; Eksin, E. Magnetic beads assay based on Zip nucleic acid for electrochemical detection of Factor V Leiden mutation. Int. J. Biol. Macromol. 2019, 125, 839–846. [Google Scholar] [CrossRef] [PubMed]
- Erdem, A.; Eksin, E. Zip nucleic acid based single-use biosensor for electrochemical detection of Factor V Leiden mutation. Sens. Actuators B 2019, 288, 634–640. [Google Scholar] [CrossRef]
- Erdem, A.; Eksin, E. ZNA probe immobilized single-use electrodes for impedimetric detection of nucleic acid hybridization related to single nucleotide mutation. Anal. Chim. Acta 2019, 1071, 78–85. [Google Scholar] [CrossRef] [PubMed]
- Bertina, R.M.; Koeleman, B.P.; Koster, T.; Rosendaal, F.R.; Dirven, R.J.; de Ronde, H.; van der Velden, P.A.; Reitsma, P.H. Mutation in blood coagulation factor V associated with resistance to activated protein C. Nature 1994, 369, 64–67. [Google Scholar] [CrossRef]
- Kujovich, J.L. Factor V Leiden thrombophilia. Genet. Med. 2011, 13, 1–16. [Google Scholar] [CrossRef] [Green Version]
- Ren, Y.; Rezania, S.; Kang, K.A. Biosensor for Diagnosing Factor V Leiden, A Single Amino Acid Mutated Abnormality of Factor V. In Advances in Experimental Medicine and Biology; Kyung, A.K., David, K.H., Duane, F.B., Eds.; Springer: Boston, MA, USA, 2008; pp. 245–252. [Google Scholar]
- Vlachou, M.A.; Glynou, K.M.; Ioannou, P.C.; Christopoulos, T.K.; Vartholomatos, G. Development of a three-biosensor panel for the visual detection of thrombophilia associated mutations. Biosens. Bioelectron. 2010, 26, 228–234. [Google Scholar] [CrossRef]
- Kang, K.A.; Ren, Y.; Sharma, V.R.; Peiper, S.C. Near real-time immuno-optical sensor for diagnosing single point mutation: A model system: Sensor for factor V Leiden diagnosis. Biosens. Bioelectron. 2009, 24, 2785–2790. [Google Scholar] [CrossRef] [Green Version]
- Noir, R.; Kotera, M.; Pons, B.; Remy, J.S.; Behr, J.P. Oligonucleotide- Oligospermine Conjugates (Zip Nucleic Acids): A Convenient Means of Finely Tuning Hybridization Temperatures. J. Am. Chem. Soc. 2008, 9, 13500–13505. [Google Scholar] [CrossRef] [Green Version]
- Moreau, V.; Voirin, E.; Paris, C.; Kotera, M.; Nothisen, M.; Rémy, J.S.; Behr, J.P.; Erbacher, P.; Lenne-Samuel, N. Zip nucleic acids (ZNAs): New high affinity oligonucleotides as potent primers for PCR and reverse transcription. Nucleic Acids Res. 2009, 37, e130. [Google Scholar] [CrossRef] [PubMed] [Green Version]
- Paris, C.; Moreau, V.; Deglane, G.; Voirin, E.; Erbacher, P.; Lenne-Samuel, N. Zip nucleic acids are potent hydrolysis probes for quantitative PCR. Nucleic Acids Res. 2010, 38, e95. [Google Scholar] [CrossRef] [PubMed]
- Alvandi, E.; Koohdani, F. Zip nucleic acid: A new reliable method to increase the melting temperature of real-time PCR probes. J. Diabetes Metab. Disord. 2014, 13, 26–29. [Google Scholar] [CrossRef] [PubMed] [Green Version]
- Nothisen, M.; Perche-Letuvee, P.; Behr, J.-P.; Remy, J.-S.; Kotera, M. Cationic Oligospermine-Oligonucleotide Conjugates Provide Carrier-free Splice Switching in Monolayer Cells and Spheroids. Cell 2018, 13, 483–492. [Google Scholar] [CrossRef] [Green Version]
- Kandemir, H.; Erdal, M.E.; Selek, S.; Ay, Ö.İ.; Karababa, İ.F.; Kandemir, S.B.; Ay, M.E.; Yılmaz, Ş.G.; Bayazıt, H.; Taşdelen, B. Evaluation of several micro RNA (miRNA) levels in children and adolescents with attention deficit hyperactivity disorder. Neurosci. Lett. 2014, 580, 158–162. [Google Scholar] [CrossRef]
- Begheldo, M.; Ditengou, F.A.; Cimoli, G.; Trevisan, S.; Quaggiotti, S.; Nois, A.; Palme, K.; Ruperti, B. Whole-mount in situ detection of microRNAs on Arabidopsis tissues using Zip Nucleic Acid probes. Anal. Biochem. 2013, 434, 60–66. [Google Scholar] [CrossRef]
- Erdem, A.; Eksin, E. Electrochemical Detection of Solution Phase Hybridization Related to Single Nucleotide Mutation by Carbon Nanofibers Enriched Electrodes. Materials 2019, 12, 3377. [Google Scholar] [CrossRef] [Green Version]
- Martín-Yerga, D.; Costa-García, A. Towards a blocking-free electrochemical immunosensing strategy for anti-transglutaminase antibodies using screen-printed electrodes. Bioelectrochemistry 2015, 105, 88–94. [Google Scholar] [CrossRef]
- Bartosik, M.; Durikova, H.; Vojtesek, B.; Anton, M.; Jandakova, E.; Hrstka, R. Electrochemical chip-based genomagnetic assay for detection of high-risk human papillomavirus DNA. Biosens. Bioelectron. 2016, 83, 300–305. [Google Scholar] [CrossRef]
- Erdem, A.; Eksin, E.; Congur, G. Indicator-free electrochemical biosensor for microRNA detection based on carbon nanofibers modified screen printed electrodes. J. Electroanal. Chem. 2015, 755, 167–173. [Google Scholar] [CrossRef]
- Perez-Rafols, C.; Serrano, N.; Díaz-Cruz, J.M.; Arino, C.; Esteban, M. New approaches to antimony film screen-printed electrodes using carbon-based nanomaterials substrates. Anal. Chim. Acta 2016, 916, 17–23. [Google Scholar] [CrossRef] [PubMed] [Green Version]
- Eissa, S.; Alshehri, N.; Rahman, A.M.A.; Dasouki, M.; Abu-Salah, K.M.; Zourob, M. Electrochemical immunosensors for the detection of survival motor neuron (SMN) protein using different carbon nanomaterials-modified electrodes. Biosens. Bioelectron. 2018, 101, 282–289. [Google Scholar] [CrossRef] [PubMed]
- Miller, J.N.; Miller, J.C. In Statistics and Chemometrics for Analytical Chemistry, 5th ed.; Pearson Education: Essex, UK, 2005; p. 121. [Google Scholar]
- Aoki, H.; Sukegawa, T.; Torimura, M.; Nakazato, T. Nonlabeling and Nonexternal Indicator DNA Sensing Based on Ferrocene-terminated Probes Immobilized on Gold Film Electrode Arrays with Plasma and Acid Treatments. Sens. Mater. 2020, 32, 1079–1090. [Google Scholar] [CrossRef]
- Bratov, A.; Rmon_Axcon, J.; Abramova, N.; Merlos, A.; Adrian, J.; Sancez-Baeza, F.; Marco, M.P.; Dominguez, C. Three-dimensional interdigitated electrode array as a transducer for label-free biosensors. Biosens. Bioelectron. 2008, 24, 729–735. [Google Scholar] [CrossRef]
- Du, Y.; Guo, S.; Dong, S.; Wang, E. An integrated sensing system for detection of DNA using new parallel-motif DNA triplex system and graphene mesoporous silica gold nanoparticle hybrids. Biomaterials 2011, 32, 8584–8592. [Google Scholar] [CrossRef] [PubMed]
- Harandizadeh, Z.; Ito, T. Block Copolymer-Derived Recessed Nanodisk-Array Electrodes as Platforms for Folding-Based Electrochemical DNA Sensors. ChemElectroChem 2019, 6, 5627–5632. [Google Scholar] [CrossRef]
- Jambrec, D.; Kayran, Y.U.; Schuhmann, W. Controlling DNA/Surface Interactions for Potential Pulse-Assisted Preparation of Multi-Probe DNA Microarrays. Electroanalysis 2019, 31, 1943–1951. [Google Scholar] [CrossRef]
- Lee, J.Y.; Won, B.Y.; Park, H.G. Label-Free Multiplex DNA Detection Utilizing Projected Capacitive Touchscreen. Biotechnol. J. 2018, 13, 1700362. [Google Scholar] [CrossRef]
- Lee, J.G.; Yun, K.; Lim, G.S.; Lee, S.E.; Kim, S.; Park, J.K. DNA biosensor based on the electrochemiluminescence of Ru (bpy) 3 2+ with DNA-binding intercalators. Bioelectrochemistry 2007, 70, 228–234. [Google Scholar] [CrossRef]
- Li, X.; Lee, J.S.; Kraatz, H.B. Electrochemical Detection of Single-Nucleotide Mismatches Using an Electrode Microarray. Anal. Chem. 2006, 78, 6096–6101. [Google Scholar] [CrossRef]
- Liu, G.; Lao, R.; Xu, Q.; Li, L.; Zhang, M.; Song, S.; Fan, C. Single-nucleotide polymorphism genotyping using a novel multiplexed electrochemical biosensor with nonfouling surface. Biosens. Bioelectron. 2013, 42, 516–521. [Google Scholar] [CrossRef] [PubMed]
- Magrina, I.; Toldra, A.; Campas, M.; Ortiz, M.; Simonova, A.; Katakis, I.; Hocek, M.; O’Sullivan, C.K. Electrochemical genosensor for the direct detection of tailed PCR amplicons incorporating ferrocene labelled dATP. Biosens. Bioelectron. 2019, 134, 76–82. [Google Scholar] [CrossRef] [PubMed]
- Takase, S.; Miyagawa, K.; Ikeda, H. Label-Free Detection of Zeptomol miRNA via Peptide Nucleic Acid Hybridization Using Novel Cyclic Voltammetry Method. Sensors 2020, 20, 836. [Google Scholar] [CrossRef] [PubMed] [Green Version]
- Zhang, D.; Peng, Y.; Qi, H.; Gao, Q.; Zhang, C. Label-free electrochemical DNA biosensor array for simultaneous detection of the HIV-1 and HIV-2 oligonucleotides incorporating different hairpin-DNA probes and redox indicator. Biosens. Bioelectron. 2010, 25, 1088–1094. [Google Scholar] [CrossRef] [PubMed]
- Zhu, X.; Ino, K.; Lin, Z.; Shiku, H.; Chen, G.; Matsue, T. Amperometric detection of DNA hybridization using a multi-point, addressable electrochemical device. Sens. Actuators B 2011, 160, 923–928. [Google Scholar] [CrossRef]


| Variable | Evaluated Conditions | Optimum Condition |
|---|---|---|
| Hybridization temperature, °C | 25, 50, 75 | 25 |
| Hybridization buffer, pH | ABS (pH, 4.8) PBS (pH, 7.4) CBS (pH, 9.5) | PBS (pH 7.4) |
| [Mg2+] in hybridization buffer, mM | NA *, 0.5, 1 | NA * |
| Hybridization time, minute | 5, 10, 15 | 10 |
| Rct (Ω) | HEff% | |
|---|---|---|
| Z-probe | 369.4 ± 59.9 | - |
| Z-probe and mutant type DNA target | 3219.0 ± 373.0 | 89.0 |
| Z-probe and wild type DNA target | 1083.0 ± 65.0 | 65.0 |
| DNA probe | 848.0 ± 209.0 | - |
| DNA probe and mutant type DNA Target | 2504.0 ± 629.3 | 66.0 |
| DNA probe and wild type DNA target | 2327.0 ± 89.1 | 63.0 |
| Rct (Ω) | HEff% | |
|---|---|---|
| Z-probe | 369.4 ± 59.9 | - |
| Z-probe and mutant type PCR | 2608.0 ± 361.3 | 86.0 |
| Z-probe and wild type PCR | 1923.3 ± 516.4 | 81.0 |
| DNA probe | 848.0 ± 209.0 | - |
| DNA probe and mutant type PCR | 1795.0 ± 481.2 | 53.0 |
| DNA probe and wild type PCR | 1848.5 ± 379.7 | 54.0 |
| Electrode | Modification | Analite | Technique | Assay Time | LOD | Reference |
|---|---|---|---|---|---|---|
| 8-channel array of electrodes | Carbon nanofiber | DNA (FV Leiden mutation) | DPV | 135 min | 1.6 µM | [13] |
| 8-channel array of electrodes | Carbon nanofiber | DNA (FV Leiden mutation) | DPV | 35 min | 0.4 µM | [14] |
| 8-channel array of electrodes | Carbon nanofiber | DNA (FV Leiden mutation) | EIS | 50 min | 133.0 nM | [15] |
| Gold film electrode array chip | - | DNA | SWV | NA | NA | [35] |
| Three-dimensional interdigitated electrode array | Silane | DNA | EIS | 24 h | NA | [36] |
| ITO electrode array | Graphene-mesoporous silica hybrid nanosheets | DNA | DPV | 70 min | 10.0 fM | [37] |
| nanodisk-array electrodes | polystyrene-block-poly(methylmethacrylate)-derived thin films | DNA | CV | 2 h | 0.4 nM–4.2 nM | [38] |
| 32 microelectrode Chips (gold) | - | DNA | CV | 30 min | [39] | |
| ITO electrode array on glass wafer | - | H1N1 influenza virus DNA | Capacitance | 3.5 h | 3.9 nM | [40] |
| 16 thru-hole array on printed circuit board | - | Hepatitis A-B-C virus DNA | ECL | 3.5 h | NA | [41] |
| Gold electrode microarray | - | DNA | EIS | 22 h | 1.0 pM | [42] |
| 16-gold electrode sensor arrays | - | DNA | CV, Amperometry | 3 h | NA | [43] |
| electrode array housed within the microfluidic cell | - | Karlodinium armiger DNA | SWV, Chronoamperometry | 17 h | 277.0 aM | [44] |
| 120-channel gold microelectrode array chip | - | miRNA | CV | 1 h | 140.0 zmol | [45] |
| multi-electrode array (6-gold electrode) | - | HIV-1, HIV-2 DNA | SWV | 7.5 h | 0.1 nM | [46] |
| 16 microwells- column electrode | - | DNA | Amperometry | 2 h | 30.0 nM | [47] |
| 8-channel array of electrodes | Carbon nanofiber | DNA (FV Leiden mutation) | EIS | 25 min | 266.0 nM | Present work |
© 2020 by the authors. Licensee MDPI, Basel, Switzerland. This article is an open access article distributed under the terms and conditions of the Creative Commons Attribution (CC BY) license (http://creativecommons.org/licenses/by/4.0/).
Share and Cite
Erdem, A.; Eksin, E. Impedimetric Sensing of Factor V Leiden Mutation by Zip Nucleic Acid Probe and Electrochemical Array. Biosensors 2020, 10, 116. https://doi.org/10.3390/bios10090116
Erdem A, Eksin E. Impedimetric Sensing of Factor V Leiden Mutation by Zip Nucleic Acid Probe and Electrochemical Array. Biosensors. 2020; 10(9):116. https://doi.org/10.3390/bios10090116
Chicago/Turabian StyleErdem, Arzum, and Ece Eksin. 2020. "Impedimetric Sensing of Factor V Leiden Mutation by Zip Nucleic Acid Probe and Electrochemical Array" Biosensors 10, no. 9: 116. https://doi.org/10.3390/bios10090116