Graphene Oxide Bulk-Modified Screen-Printed Electrodes Provide Beneficial Electroanalytical Sensing Capabilities


Abstract
:1. Introduction
2. Experimental Section
3. Results and Discussion
4. Conclusions
Supplementary Materials
Author Contributions
Funding
Conflicts of Interest
References
- Lee, J.; Kim, J.; Kim, S.; Min, D.-H. Biosensors based on graphene oxide and its biomedical application. Adv. Drug Deliv. Rev. 2016, 105 Pt B, 275–287. [Google Scholar] [CrossRef]
- Ferrari, A.G.-M.; Brownson, D.; Banks, C. Investigating the Integrity of Graphene towards the Electrochemical Oxygen Evolution Reaction. ChemElectroChem 2019, 6, 5446–5453. [Google Scholar]
- Rowley-Neale, S.J.; Randviir, E.P.; Dena, A.S.A. Banks, An overview of recent applications of reduced graphene oxide as a basis of electroanalytical sensing platforms. C.E. Appl. Mater. Today 2018, 10, 218–226. [Google Scholar] [CrossRef]
- Cho, E.S.; Ruminski, A.M.; Aloni, S.; Liu, Y.S.; Guo, S.; Urban, J.J. Graphene oxide/metal nanocrystal multilaminates as the atomic limit for safe and selective hydrogen storage. Nat. Commun. 2016, 7, 10804. [Google Scholar]
- Fan, T.; Zeng, W.; Niu, Q.; Tong, S.; Cai, K.; Liu, Y.; Huang, W.; Min, Y.; Epstein, A.J. Fabrication of high-quality graphene oxide nanoscrolls and application in supercapacitor. Nanoscale Res. Lett. 2015, 10, 192. [Google Scholar] [CrossRef] [PubMed] [Green Version]
- Liu, Y.; Yu, D.; Zeng, C.; Miao, Z.; Dai, L. Biocompatible Graphene Oxide-Based Glucose Biosensors. Langmuir 2010, 26, 6158–6160. [Google Scholar] [CrossRef]
- Mkhoyan, K.A.; Contryman, A.W.; Silcox, J.; Stewart, D.A.; Eda, G.; Mattevi, C.; Miller, S.; Chhowalla, M. Atomic and Electronic Structure of Graphene-Oxide. Nano Lett. 2009, 9, 1058–1063. [Google Scholar] [CrossRef] [Green Version]
- Pumera, M. Graphene in biosensing. Mater. Today 2011, 14, 308–315. [Google Scholar]
- Sharma, D.; Kanchi, S.; Sabela, M.I.; Bisetty, K. Insight into the biosensing of graphene oxide: Present and future prospects. Arab. J. Chem. 2016, 9, 238–261. [Google Scholar] [CrossRef] [Green Version]
- Zhu, Y.; Murali, S.; Cai, W.; Li, X.; Suk, J.W.; Potts, J.R.; Ruoff, R.S. Graphene and Graphene Oxide: Synthesis, Properties, and Applications. Adv. Mater. 2010, 22, 3906–3924. [Google Scholar] [CrossRef]
- Alonso-Cristobal, P.; Vilela, P.; El-Sagheer, A.; Lopez-Cabarcos, E.; Brown, T.; Muskens, O.L.; Rubio-Retama, J.; Kanaras, A.G. Highly Sensitive DNA Sensor Based on Upconversion Nanoparticles and Graphene Oxide. ACS Appl. Mater. Interfaces 2015, 7, 12422–12429. [Google Scholar] [CrossRef] [PubMed]
- Gao, L.; Lian, C.; Zhou, Y.; Yan, L.; Li, Q.; Zhang, C.; Chen, L.; Chen, K. Graphene oxide–DNA based sensors. Biosens. Bioelectron. 2014, 60, 22–29. [Google Scholar] [CrossRef]
- Zhang, Y.; Wu, C.; Guo, S.; Zhang, J. Interactions of graphene and graphene oxide with proteins and peptides. Nanotechnol. Rev. 2013, 2, 27. [Google Scholar] [CrossRef]
- Rao, D.; Zhang, X.; Sheng, Q.; Zheng, J. Highly improved sensing of dopamine by using glassy carbon electrode modified with MnO2, graphene oxide, carbon nanotubes and gold nanoparticles. Microchim. Acta 2016, 183, 2597–2604. [Google Scholar] [CrossRef]
- Bahrami, S.; Abbasi, A.R.; Roushani, M.; Derikvand, Z.; Azadbakht, A. An electrochemical dopamine aptasensor incorporating silver nanoparticle, functionalized carbon nanotubes and graphene oxide for signal amplification. Talanta 2016, 159, 307–316. [Google Scholar] [CrossRef] [PubMed]
- Brownson, D.A.C.; Lacombe, A.C.; Gomez-Mingot, M.; Banks, C.E. Graphene oxide gives rise to unique and intriguing voltammetry. RSC Adv. 2012, 2, 665–668. [Google Scholar] [CrossRef]
- Brownson, D.A.C.; Smith, G.C.; Banks, C.R. Graphene oxide electrochemistry: The electrochemistry of graphene oxide modified electrodes reveals coverage dependent beneficial electrocatalysis. Soc. Open Sci. 2017, 4, 171128. [Google Scholar] [CrossRef] [PubMed] [Green Version]
- Rowley-Neale, S.J.; Foster, C.W.; Smith, G.C.; Brownson, D.A.C.; Banks, C.E. Mass-producible 2D-MoSe2 bulk modified screen-printed electrodes provide significant electrocatalytic performances towards the hydrogen evolution reaction. Sustain. Energy Fuels 2017, 1, 74–83. [Google Scholar] [CrossRef] [Green Version]
- Randviir, E.P.; Brownson, D.A.C.; Metters, J.P.; Kadara, R.O.; Banks, C.E. The fabrication, characterisation and electrochemical investigation of screen-printed graphene electrodes. Phys. Chem. Chem. Phys. 2014, 16, 4598–4611. [Google Scholar] [CrossRef] [Green Version]
- Baccarin, M.; Rowley-Neale, S.J.; Cavalheiro, É.T.G.; Smith, G.C.; Banks, C.E. Nanodiamond based surface modified screen-printed electrodes for the simultaneous voltammetric determination of dopamine and uric acid. Microchim. Acta 2019, 186, 200. [Google Scholar] [CrossRef] [Green Version]
- Mei, L.-P.; Feng, J.-J.; Wu, L.; Chen, J.-R.; Shen, L.; Xie, Y.; Wang, A.-J. A glassy carbon electrode modified with porous Cu2O nanospheres on reduced graphene oxide support for simultaneous sensing of uric acid and dopamine with high selectivity over ascorbic acid. Microchim. Acta 2016, 183, 2039–2046. [Google Scholar] [CrossRef]
- Nurzulaikha, R.; Lim, H.N.; Harrison, I.; Lim, S.S.; Pandikumar, A.; Huang, N.M.; Lim, S.P.; Thien, G.S.H.; Yusoff, N.; Ibrahim, I. Graphene/SnO2 nanocomposite-modified electrode for electrochemical detection of dopamine. Sens. Bio-Sens. Res. 2015, 5, 42–49. [Google Scholar] [CrossRef] [Green Version]
- Gorle, D.B.; Kulandainathan, M.A. Electrochemical sensing of dopamine at the surface of a dopamine grafted graphene oxide/poly(methylene blue) composite modified electrode. RSC Adv. 2016, 6, 19982–19991. [Google Scholar] [CrossRef]
- Mao, Y.; Bao, Y.; Gan, S.; Li, F.; Niu, L. Electrochemical sensor for dopamine based on a novel graphene-molecular imprinted polymers composite recognition element. Biosens. Bioelectron. 2011, 28, 291–297. [Google Scholar] [CrossRef]
- Sheng, Z.-H.; Zheng, X.-Q.; Xu, J.-Y.; Bao, W.-J.; Wang, F.-B.; Xia, X.-H. Electrochemical sensor based on nitrogen doped graphene: Simultaneous determination of ascorbic acid, dopamine and uric acid. Biosens. Bioelectron. 2012, 34, 125–131. [Google Scholar] [CrossRef]
- Graphene Supermarket. Available online: https://graphene-supermarket.com/Single-Layer-Graphene-Oxide-small-flakes-1g.html (accessed on 31 February 2016).
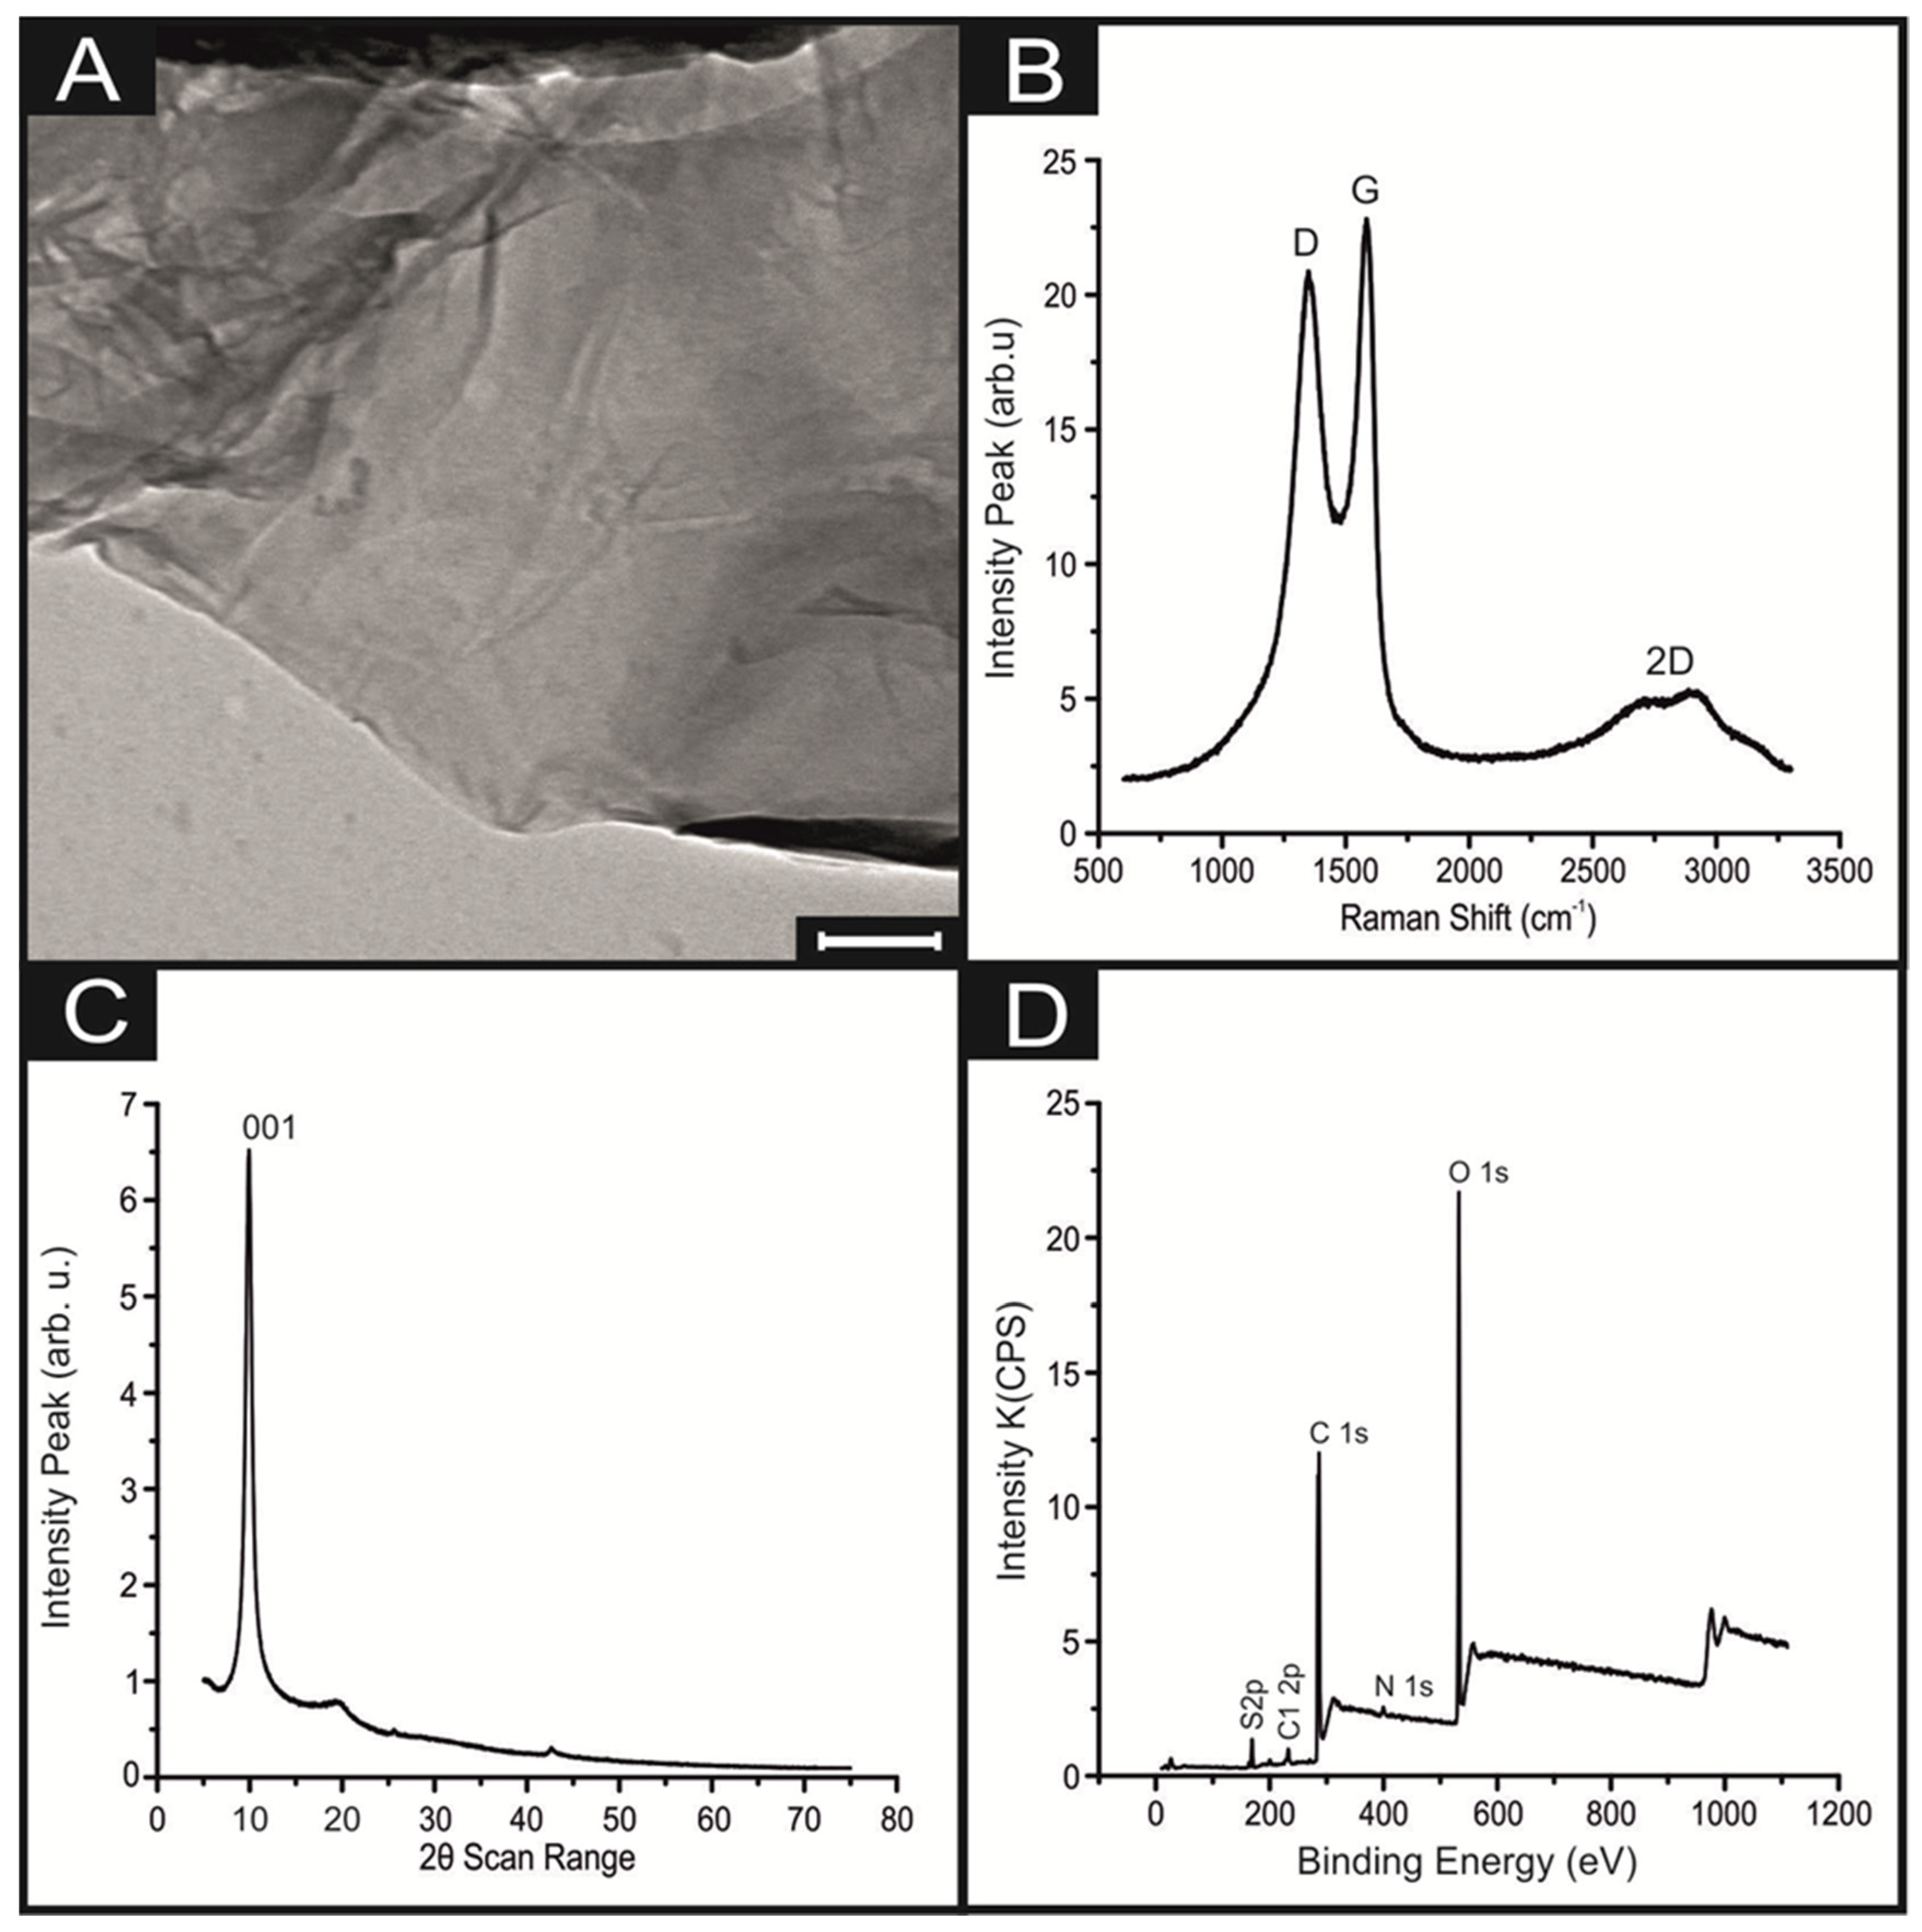
- King, A.A.K.; Davies, B.R.; Noorbehesht, N.; Newman, P.; Church, T.L.; Harris, A.T.; Razal, J.M.; Minett, A.I. A New Raman Metric for the Characterisation of Graphene oxide and its Derivatives. Sci. Rep. 2016, 6, 19491. [Google Scholar] [CrossRef] [Green Version]
- Kudin, K.N.; Ozbas, B.; Schniepp, H.C.; Prud’homme, R.K.; Aksay, I.A.; Car, R. Raman Spectra of Graphite Oxide and Functionalized Graphene Sheets. Nano Lett. 2008, 8, 36–41. [Google Scholar] [CrossRef]
- Chowdhuri, A.R.; Tripathy, S.; Chandra, S.; Roy, S.; Sahu, S.K. A ZnO decorated chitosan-graphene oxide nanocomposite shows significantly enhanced antimicrobial activity with ROS generation. RSC Adv. 2015, 5, 49420–49428. [Google Scholar] [CrossRef]
- Ji, X.; Banks, C.E.; Crossley, A.; Compton, R.G. Oxygenated Edge Plane Sites Slow the Electron Transfer of the Ferro-/Ferricyanide Redox Couple at Graphite Electrodes. ChemPhysChem 2006, 7, 1337–1344. [Google Scholar] [CrossRef]
- Brownson, D.A.C.; Munro, L.J.; Kampouris, D.K.; Banks, C.E. Electrochemistry of graphene: Not such a beneficial electrode material? RSC Adv. 2011, 1, 978–988. [Google Scholar] [CrossRef]
- Nichkova, M.; Wynveen, P.M.; Marc, D.T.; Huisman, H.; Kellermann, G.H.J. Validation of an ELISA for urinary dopamine: Applications in monitoring treatment of dopamine-related disorders. Neurochem 2013, 125, 724–735. [Google Scholar] [CrossRef]
- Silva, L.I.B.; Ferreira, F.D.P.; Freitas, A.C.; Rocha-Santos, T.A.P.; Duarte, A.C. Optical fiber biosensor coupled to chromatographic separation for screening of dopamine, norepinephrine and epinephrine in human urine and plasma. Talanta 2009, 80, 853–857. [Google Scholar] [CrossRef]
- Zhang, J.; Zhao, X.S.J. Conducting Polymers Directly Coated on Reduced Graphene Oxide Sheets as High-Performance Supercapacitor Electrodes. Phys. Chem. C 2012, 116, 5420–5426. [Google Scholar] [CrossRef]
- Goto, Y.; Otani, S.; Grace, A.A. The Yin and Yang of dopamine release: A new perspective. Neuropharmacology 2007, 53, 583–587. [Google Scholar] [CrossRef] [Green Version]


| Electrocatalyst | Electrode Material | Deposition Technique | Dopamine LOD (M) | Uric Acid LOD (M) | Electrochemical Method | Reference |
|---|---|---|---|---|---|---|
| GO-MWCNT/MnO2AuNP | GC | Drop Cast | 1.7 × 10⁻⁷ | – | CV | [14] |
| pCu2O NS-rGO | GC | Drop Cast | 1.5 × 10⁻⁸ | 1.1 × 10⁻⁷ | DPV | [21] |
| G-SnO2 | GC | Drop Cast | 1.0 × 10⁻⁶ | – | DPV | [22] |
| DA-ERG/PMB | GC | Drop Cast | 1.0 × 10⁻⁷ | – | DPV | [23] |
| GSCR-MIPs | GC | Drop Cast | 1.0 × 10⁻⁷ | – | LSV | [24] |
| NG | GC | Drop Cast | 2.5 × 10⁻⁷ | 4.5 × 10⁻⁸ | DPV | [25] |
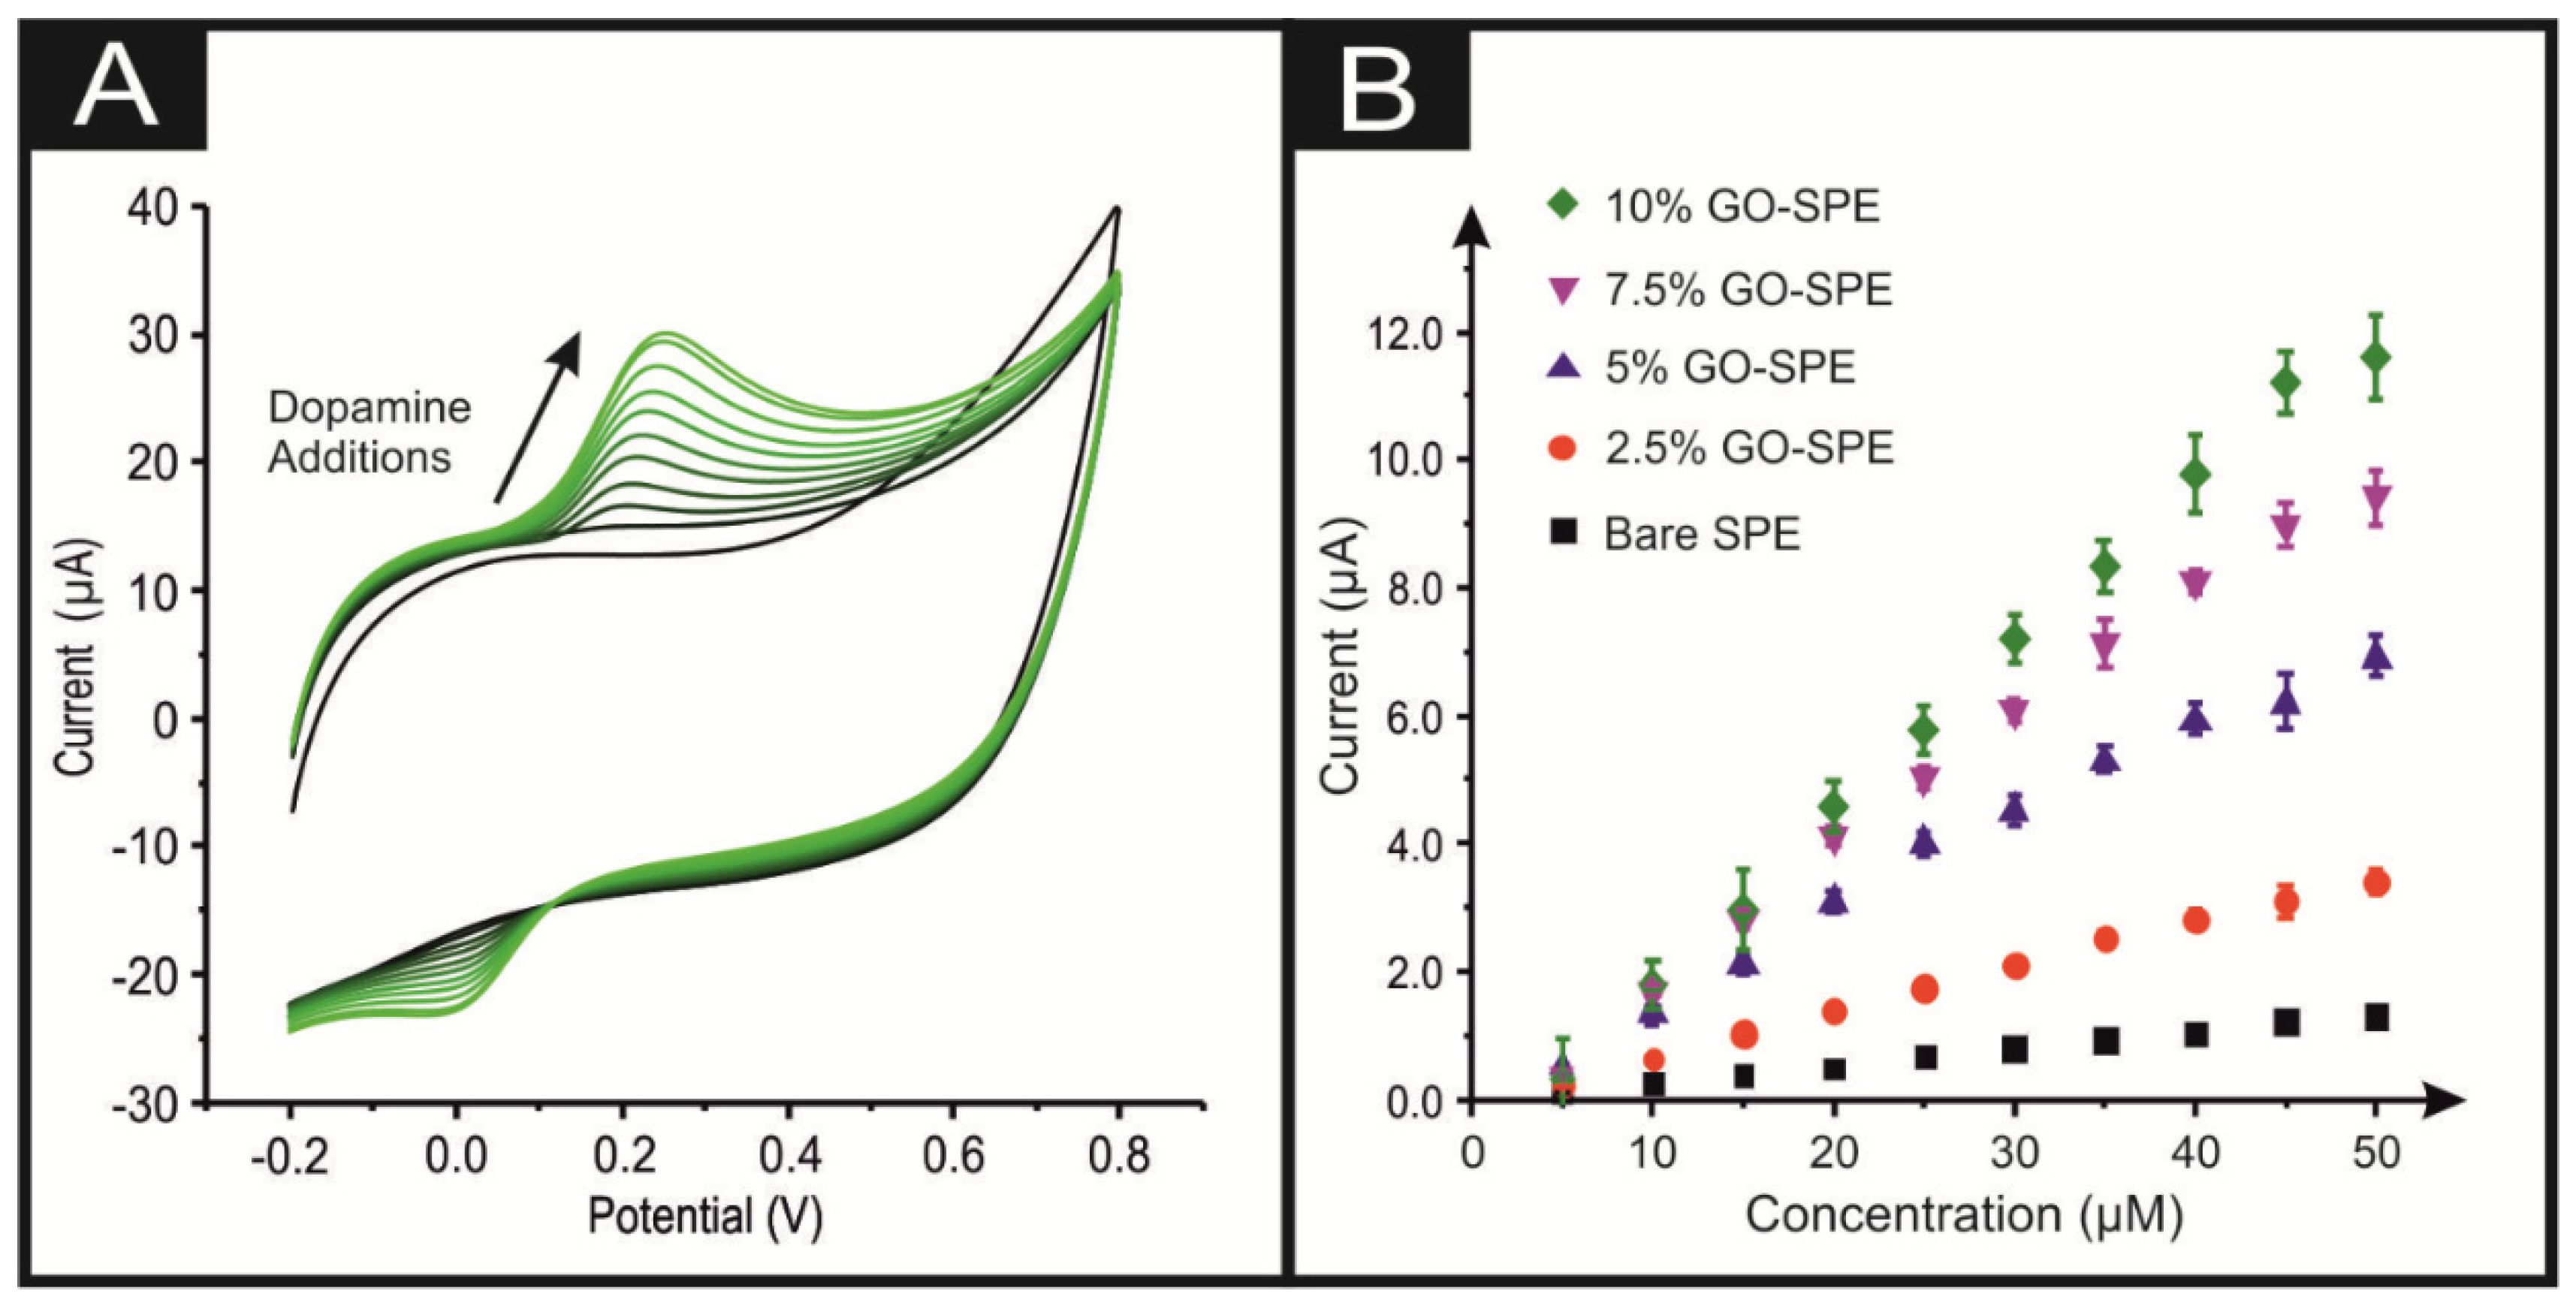
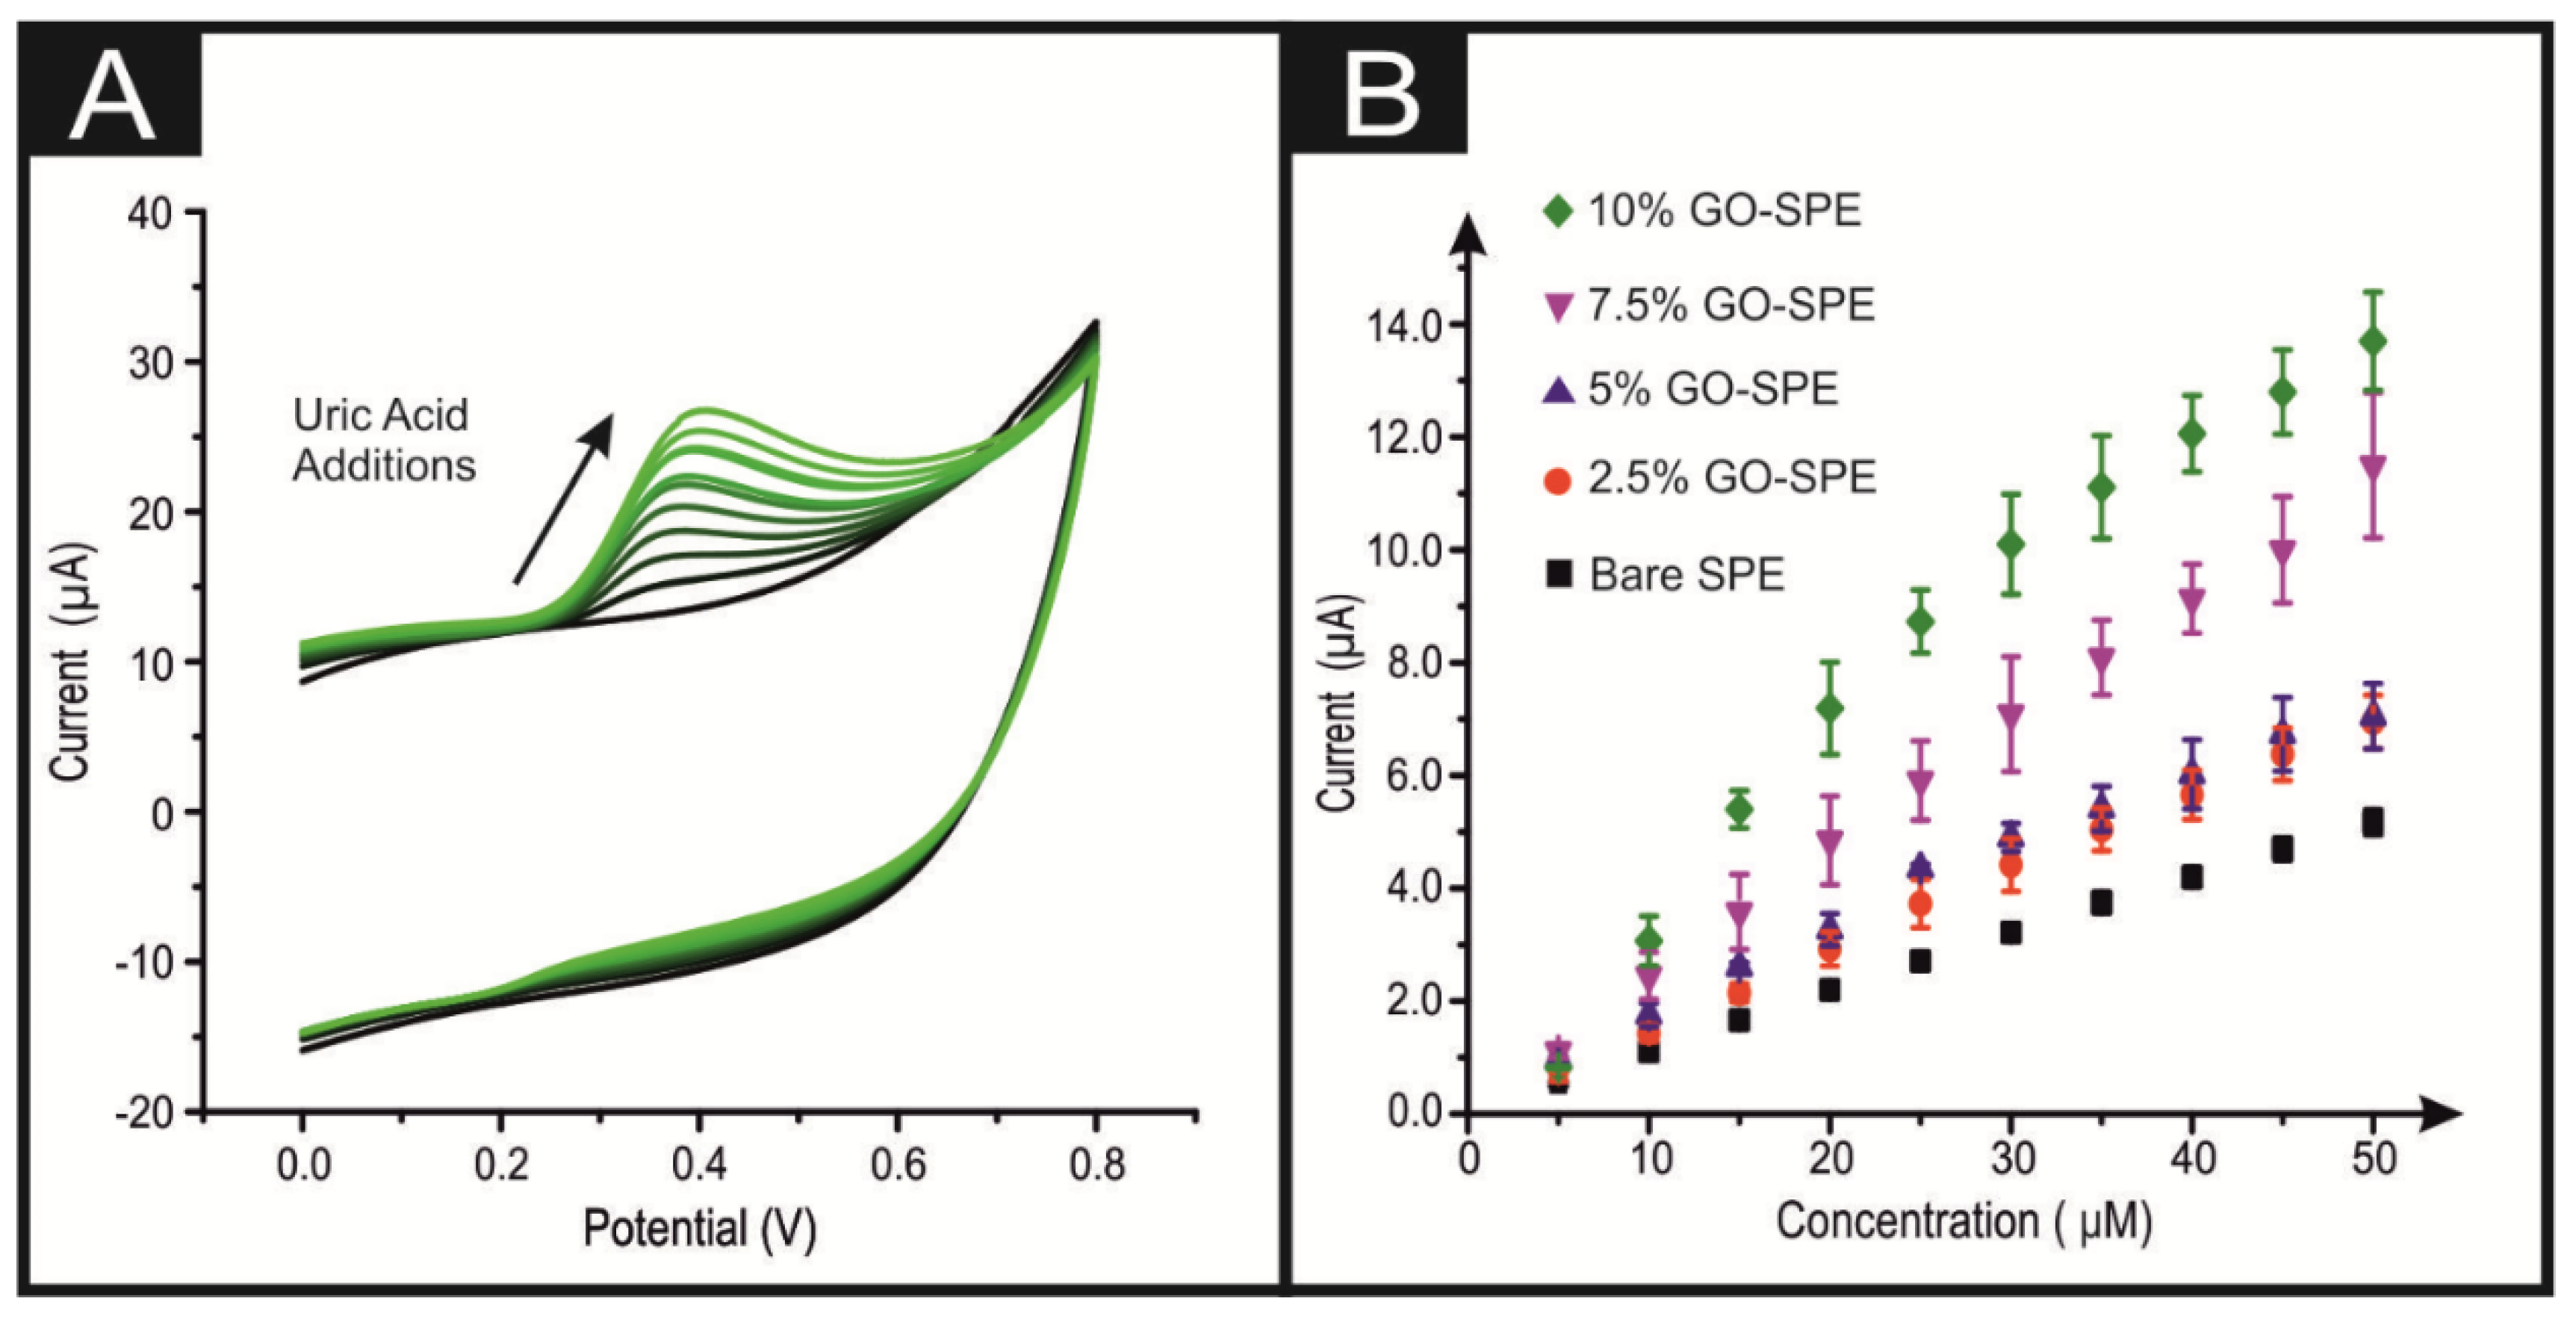
| Bare/unmodified | SPE | Screen Printed | 7.8 × 10⁻⁷ | 2.3 × 10⁻⁶ | CV | This Work |
| 2.5% GO-ink | SPE | Screen Printed | 2.9 × 10⁻⁷ | 1.6 × 10⁻⁶ | CV | This Work |
| 5% GO-ink | SPE | Screen Printed | 1.3 × 10⁻⁷ | 1.0 × 10⁻⁶ | CV | This Work |
| 7.5% GO-ink | SPE | Screen Printed | 1.0 × 10⁻⁷ | 9.6 × 10⁻⁷ | CV | This Work |
| 10% GO-ink | SPE | Screen Printed | 8.1 × 10⁻⁸ | 6.1 × 10⁻⁷ | CV | This Work |
© 2020 by the authors. Licensee MDPI, Basel, Switzerland. This article is an open access article distributed under the terms and conditions of the Creative Commons Attribution (CC BY) license (http://creativecommons.org/licenses/by/4.0/).
Share and Cite
Rowley-Neale, S.J.; Brownson, D.A.C.; Smith, G.; Banks, C.E. Graphene Oxide Bulk-Modified Screen-Printed Electrodes Provide Beneficial Electroanalytical Sensing Capabilities. Biosensors 2020, 10, 27. https://doi.org/10.3390/bios10030027
Rowley-Neale SJ, Brownson DAC, Smith G, Banks CE. Graphene Oxide Bulk-Modified Screen-Printed Electrodes Provide Beneficial Electroanalytical Sensing Capabilities. Biosensors. 2020; 10(3):27. https://doi.org/10.3390/bios10030027
Chicago/Turabian StyleRowley-Neale, Samuel J., Dale A. C. Brownson, Graham Smith, and Craig E. Banks. 2020. "Graphene Oxide Bulk-Modified Screen-Printed Electrodes Provide Beneficial Electroanalytical Sensing Capabilities" Biosensors 10, no. 3: 27. https://doi.org/10.3390/bios10030027