Waveguide-Based Fluorescent Immunosensor for the Simultaneous Detection of Carbofuran and 3-Hydroxy-Carbofuran

 ,
,
Abstract
:1. Introduction
2. Material and Methods
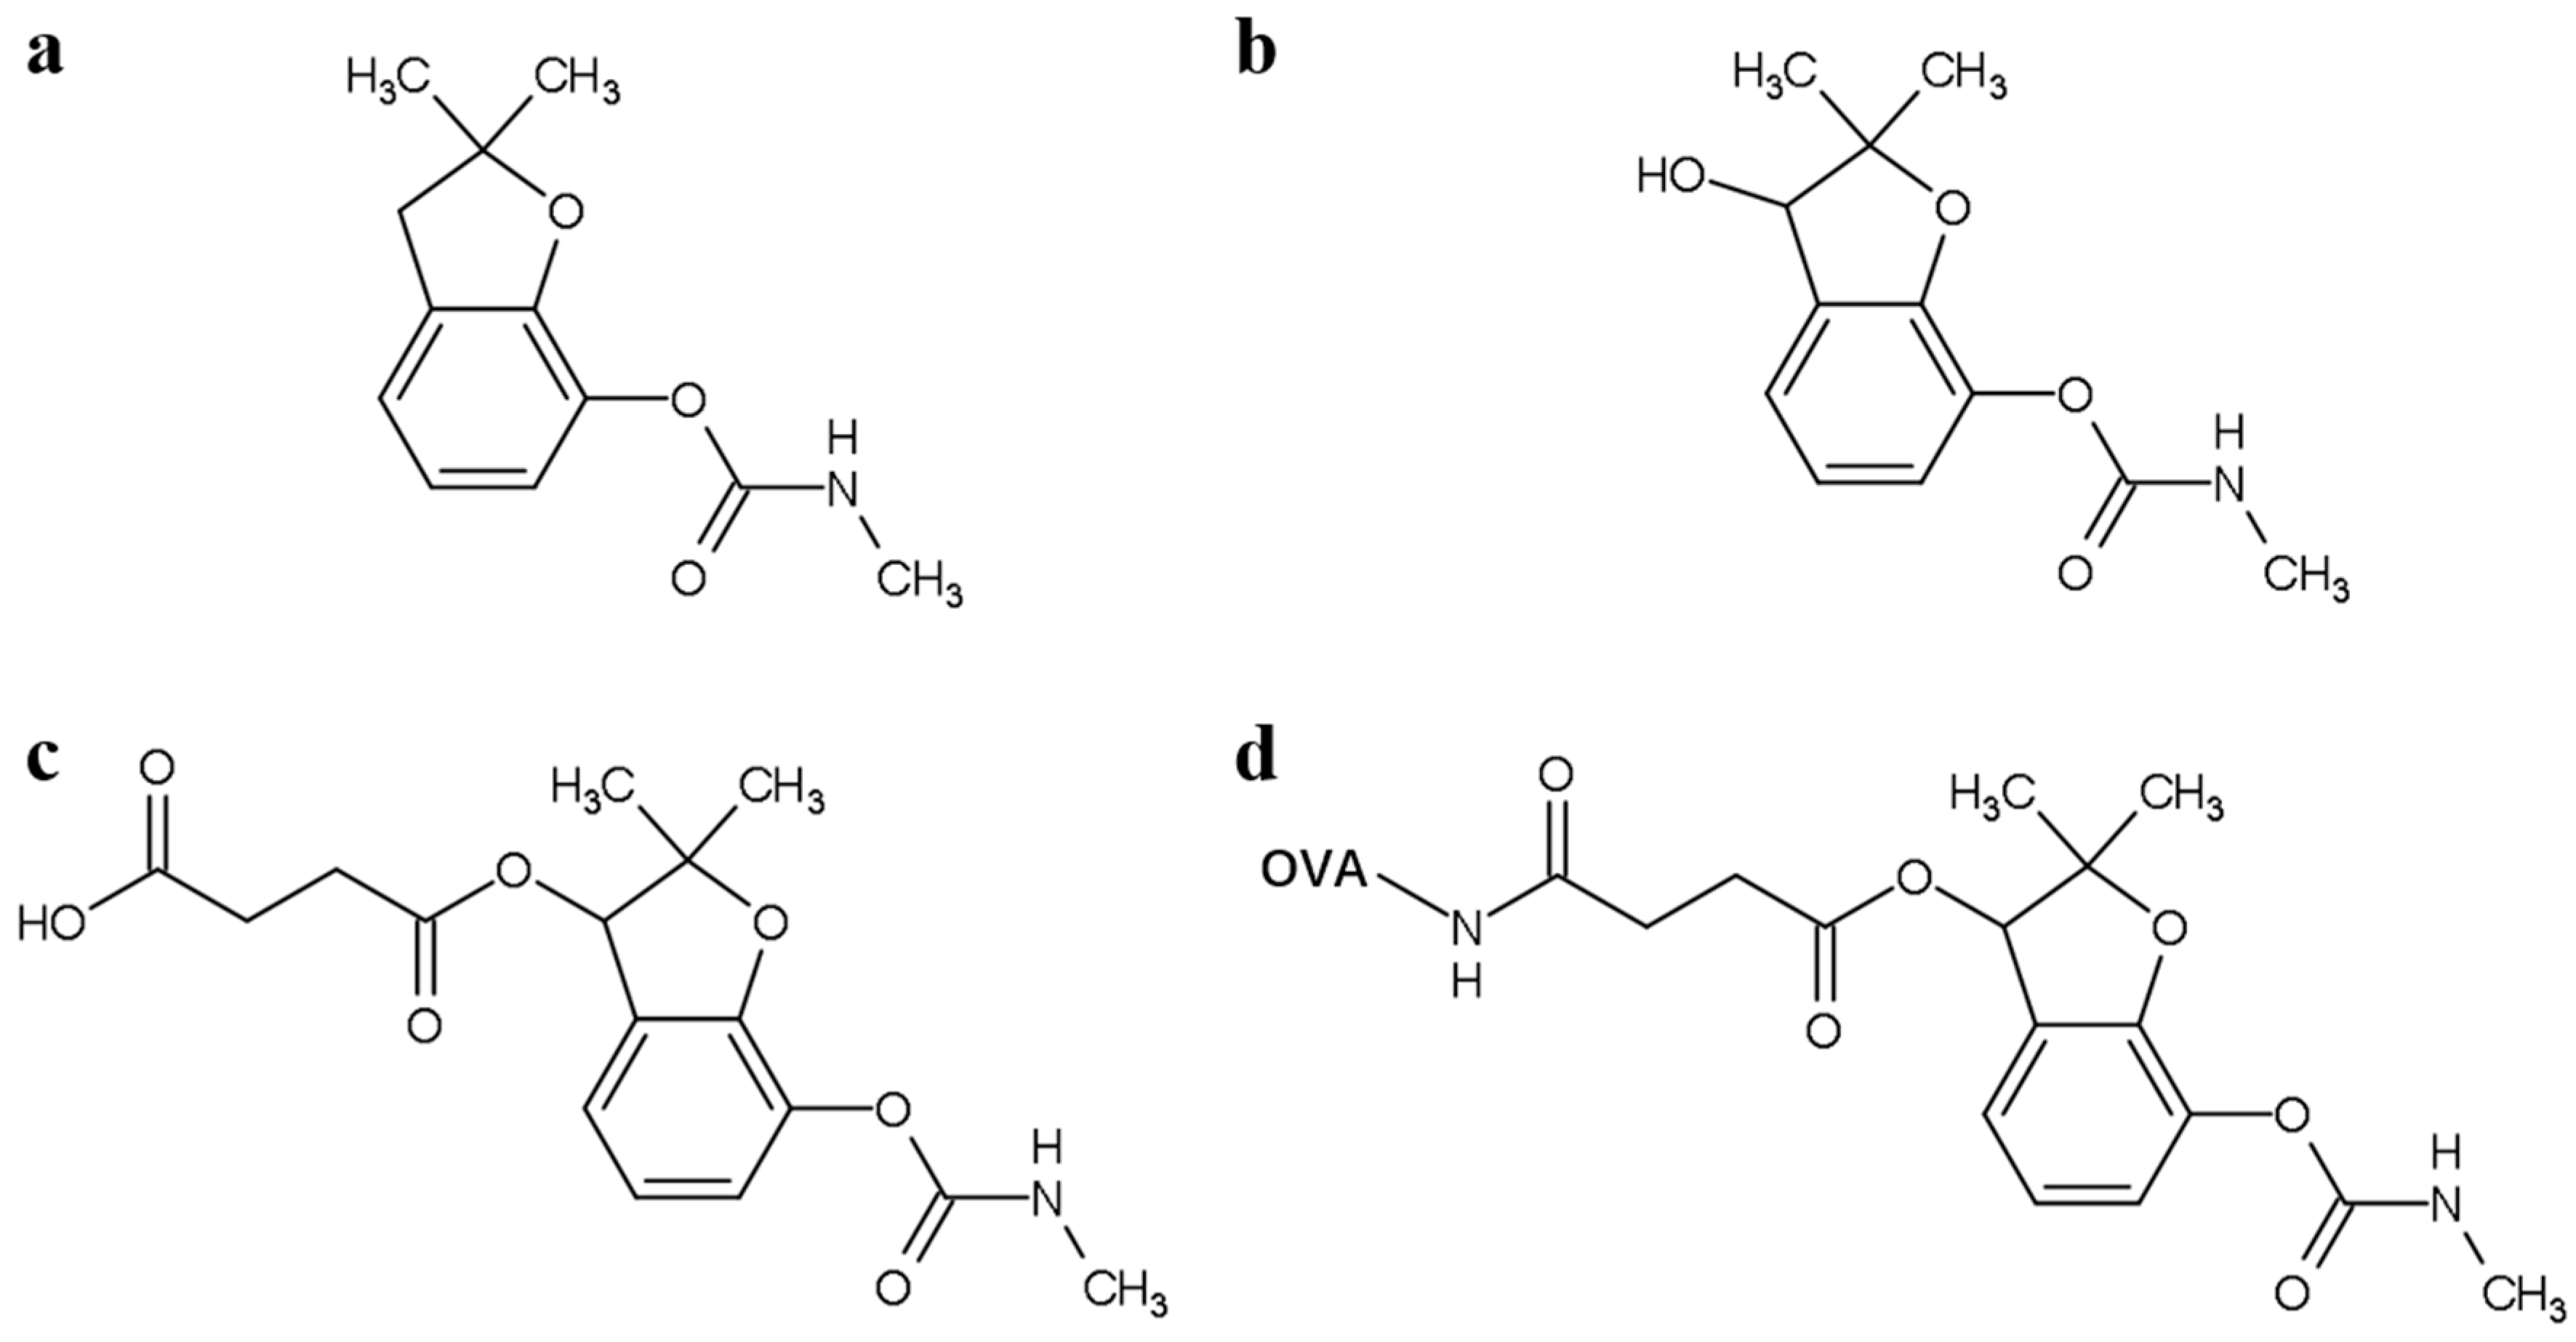
2.1. Reagents
2.2. Instrument
2.3. Sensitivity and Recovery
3. Results and Discussion
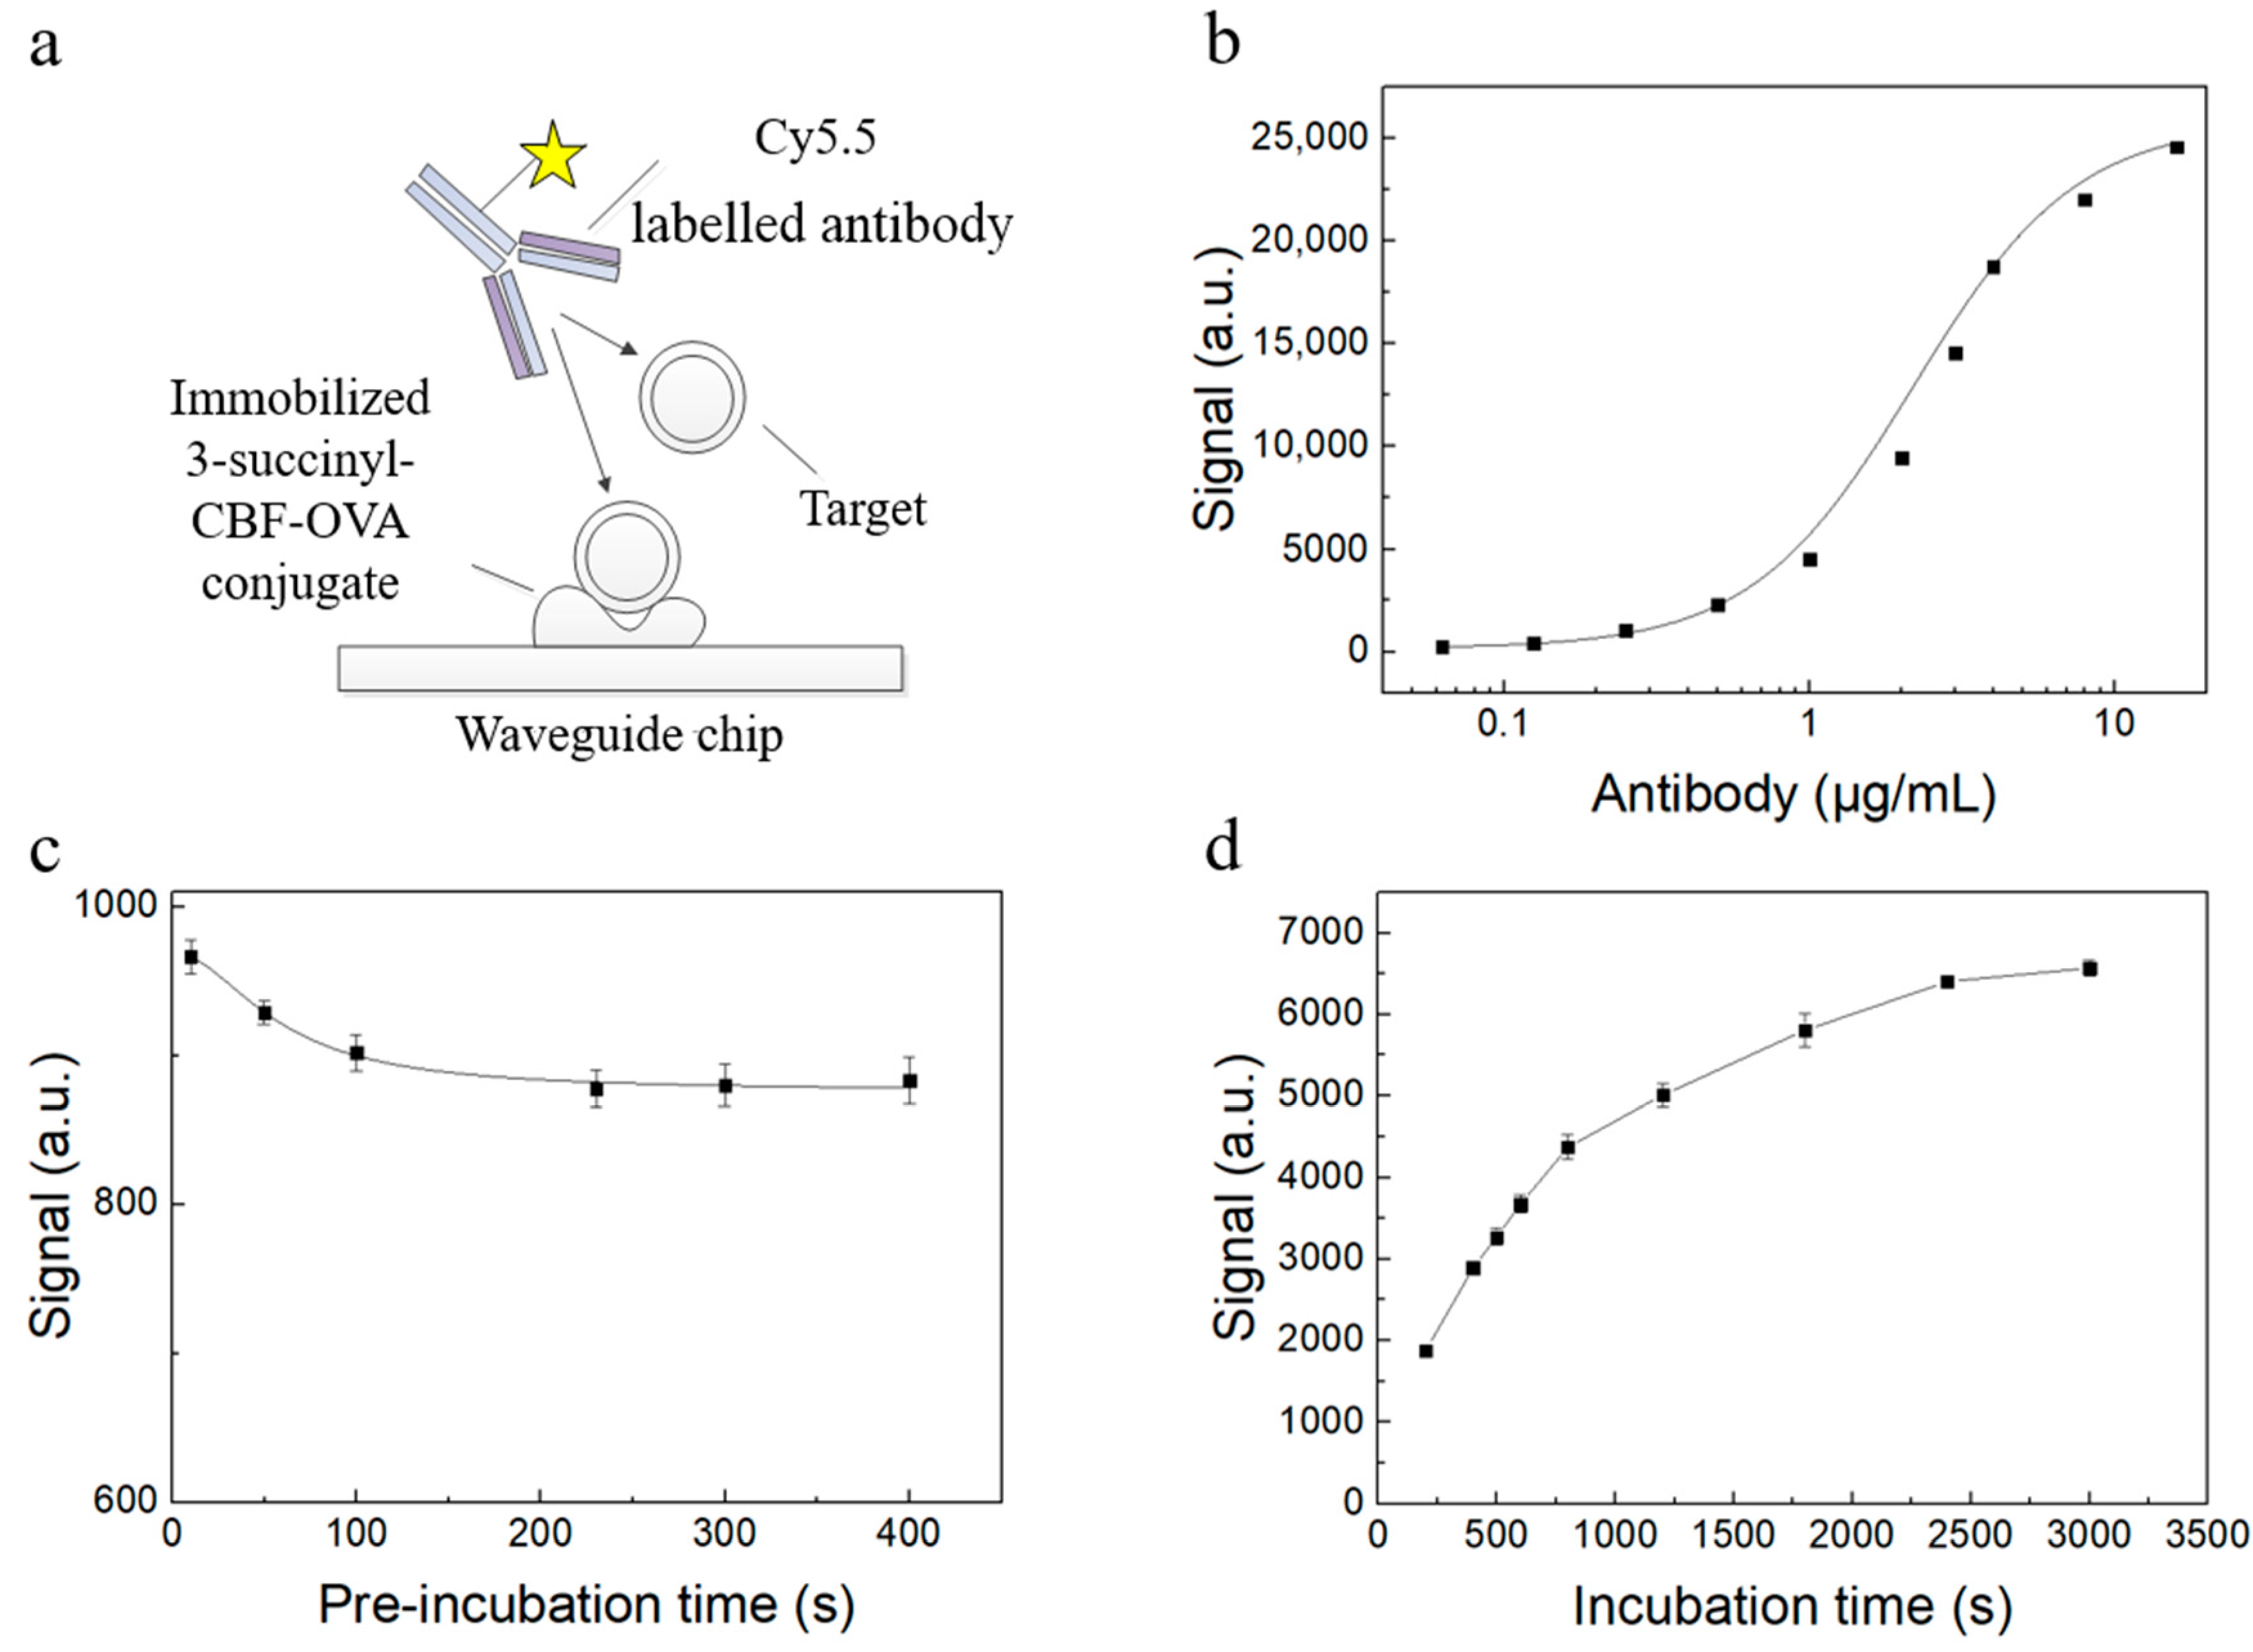
3.1. Sensing Mechanism
3.2. Optimization of the Experimental Conditions
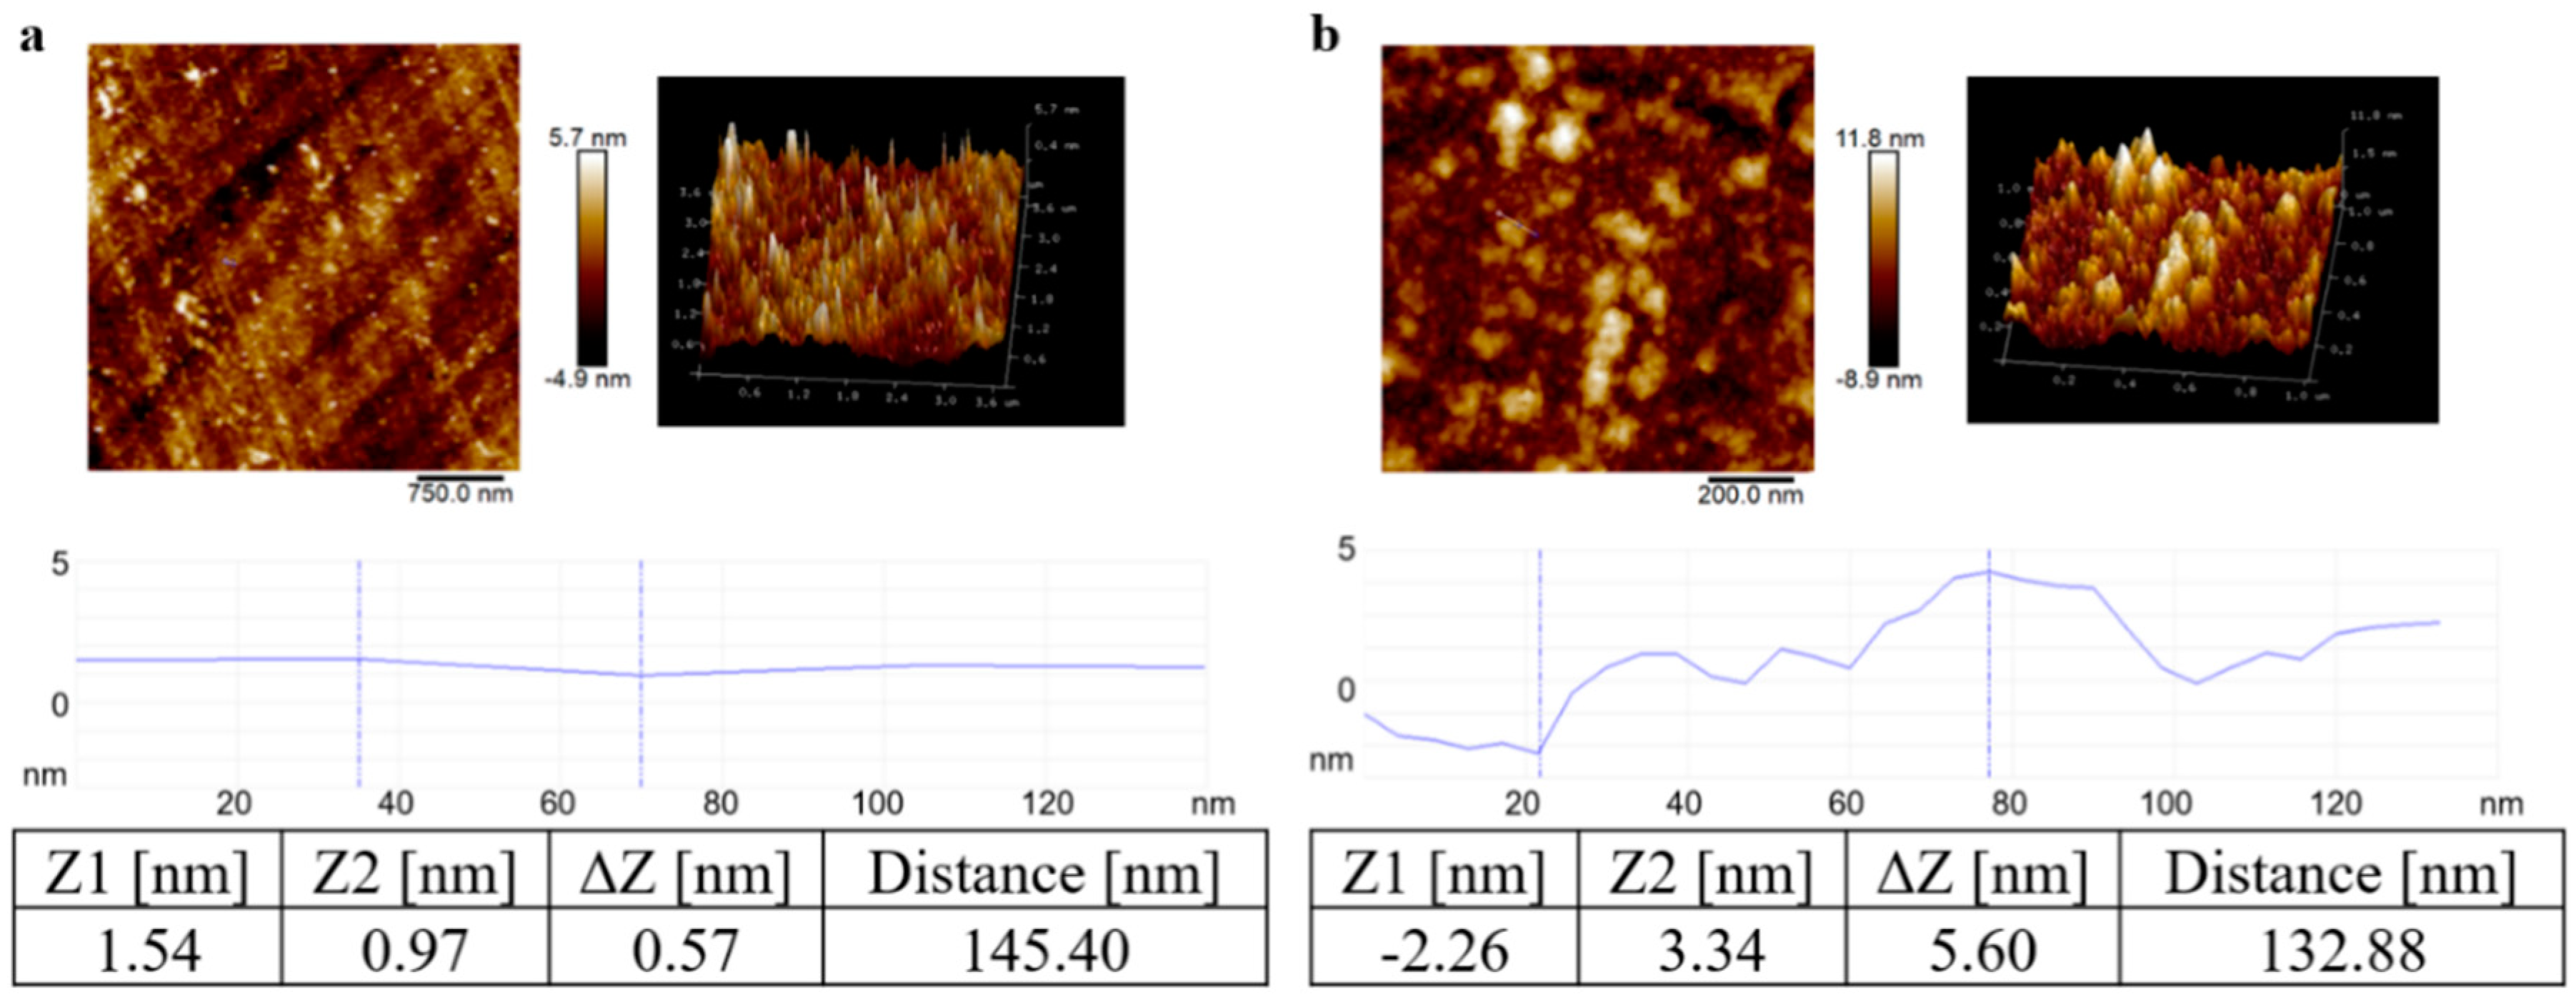
3.3. AFM Characterization of the Immunosensor Chip
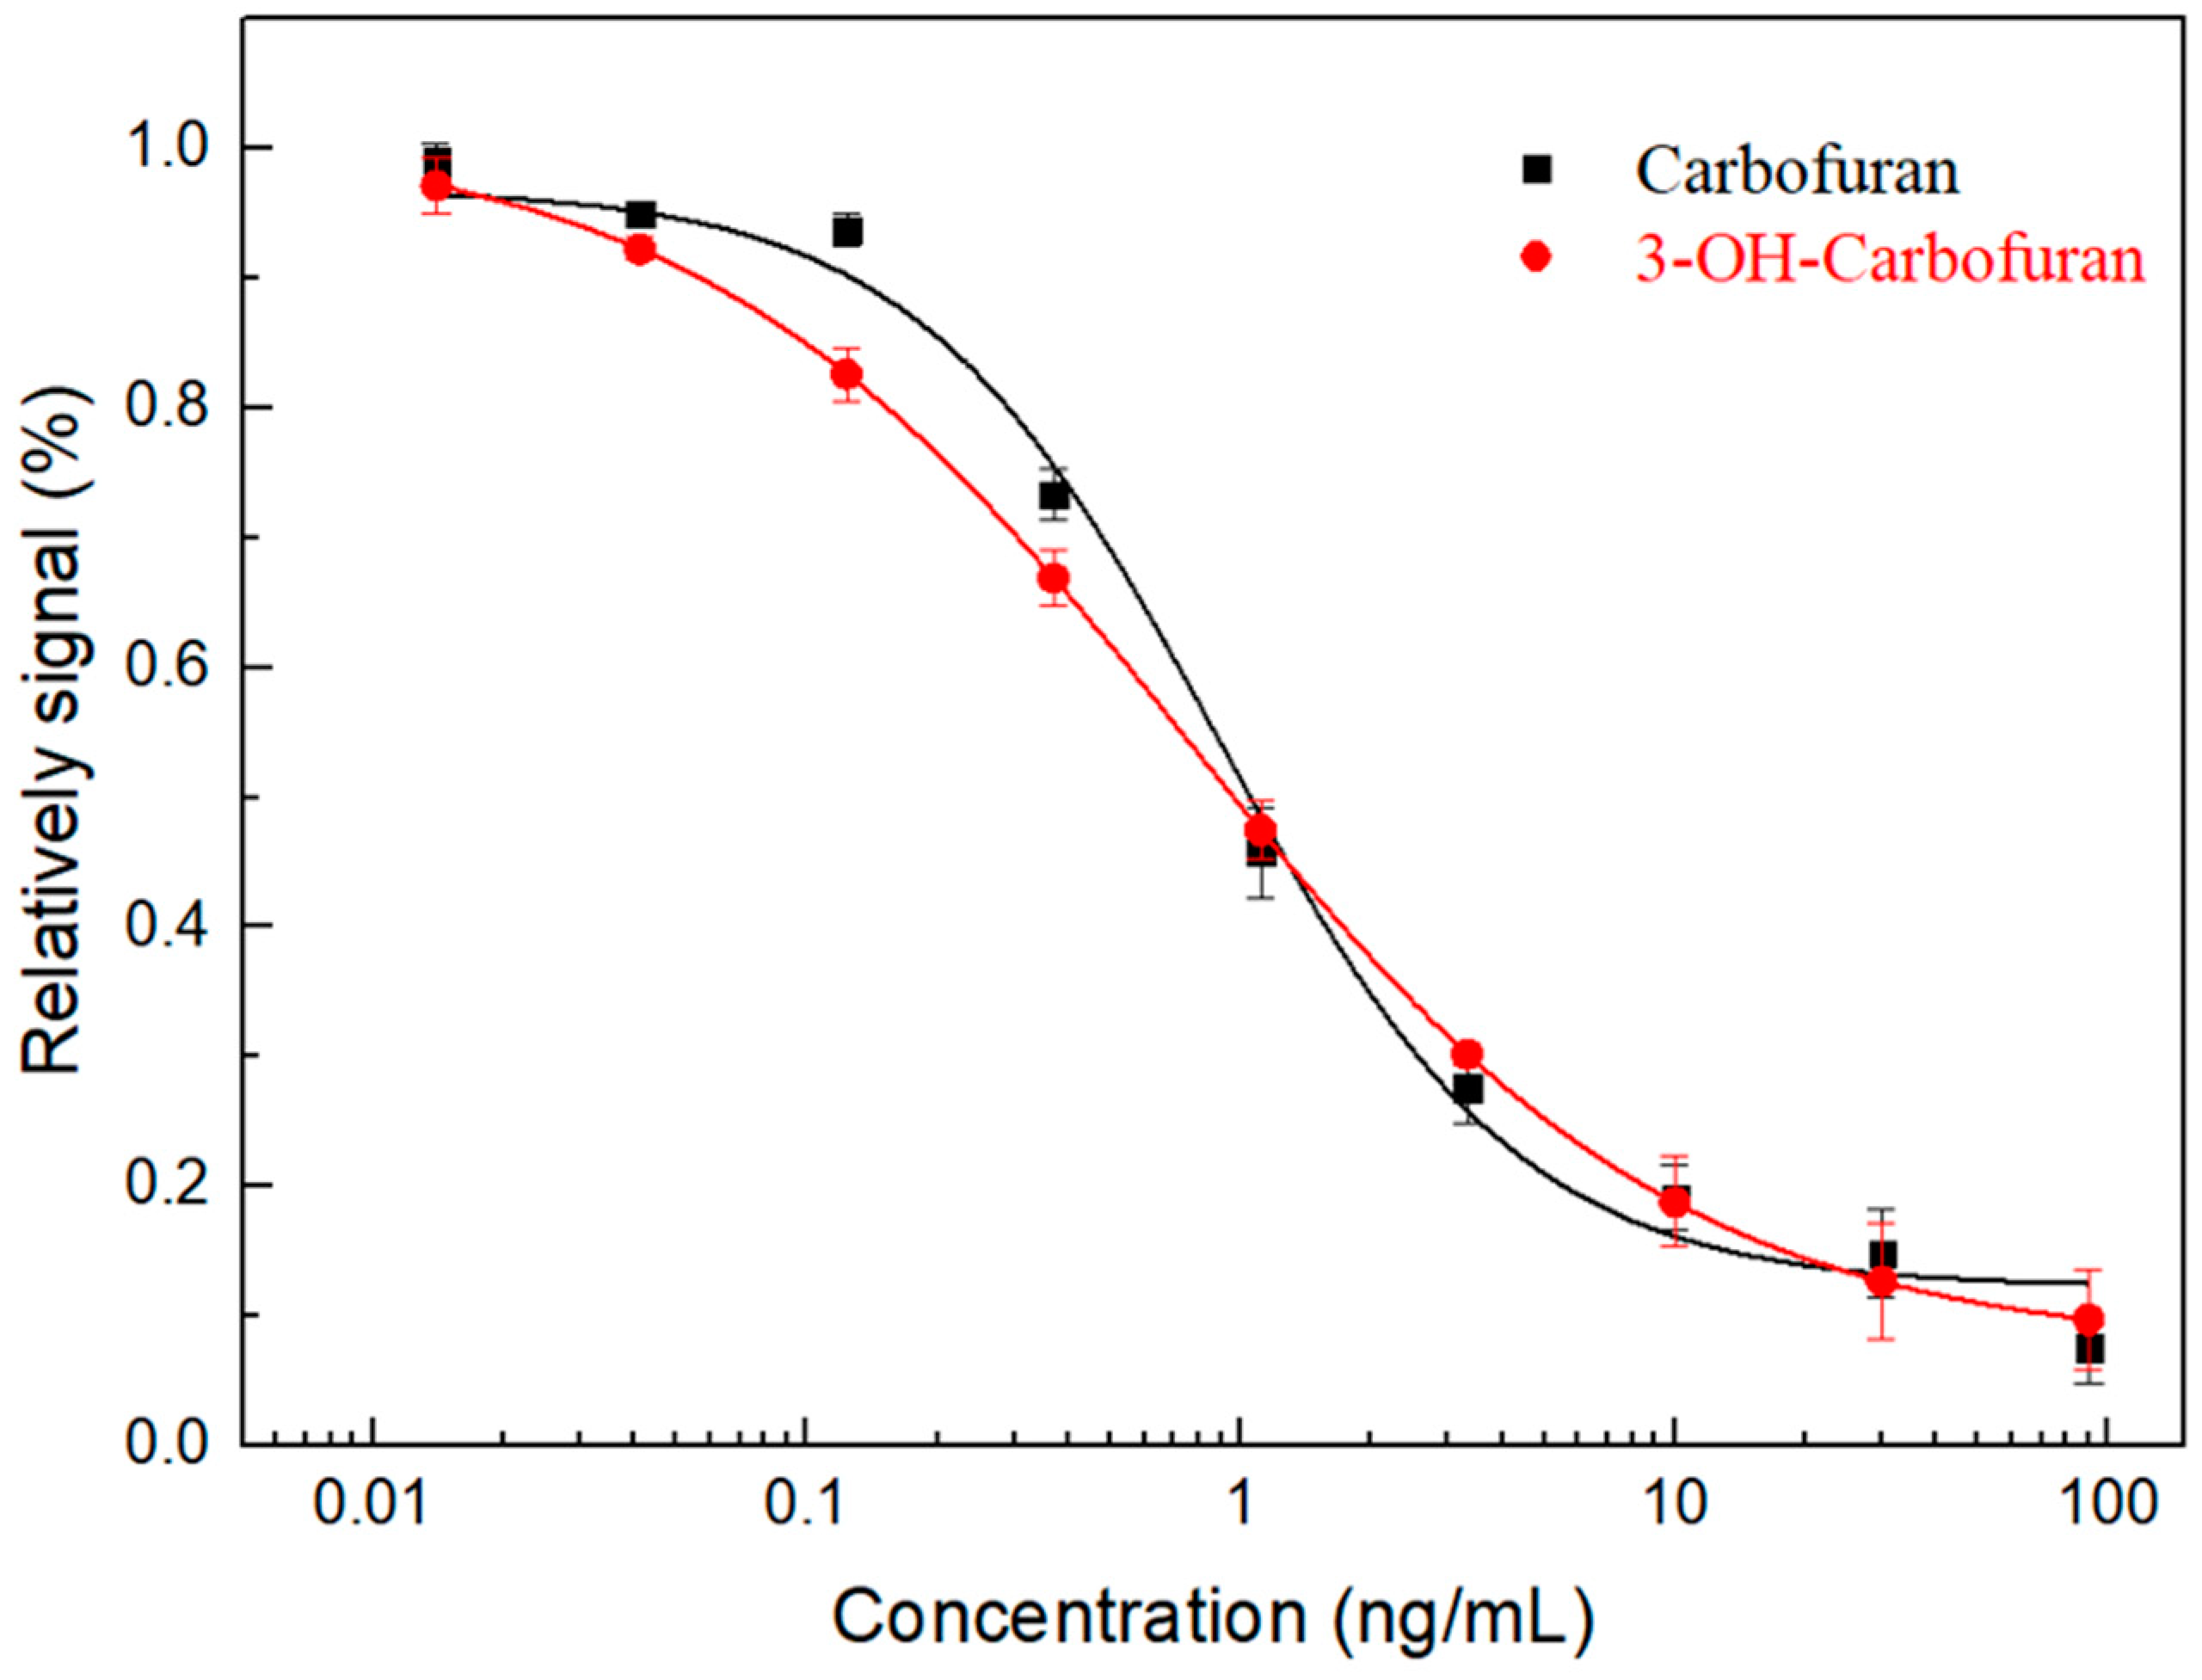
3.4. Sensitivity
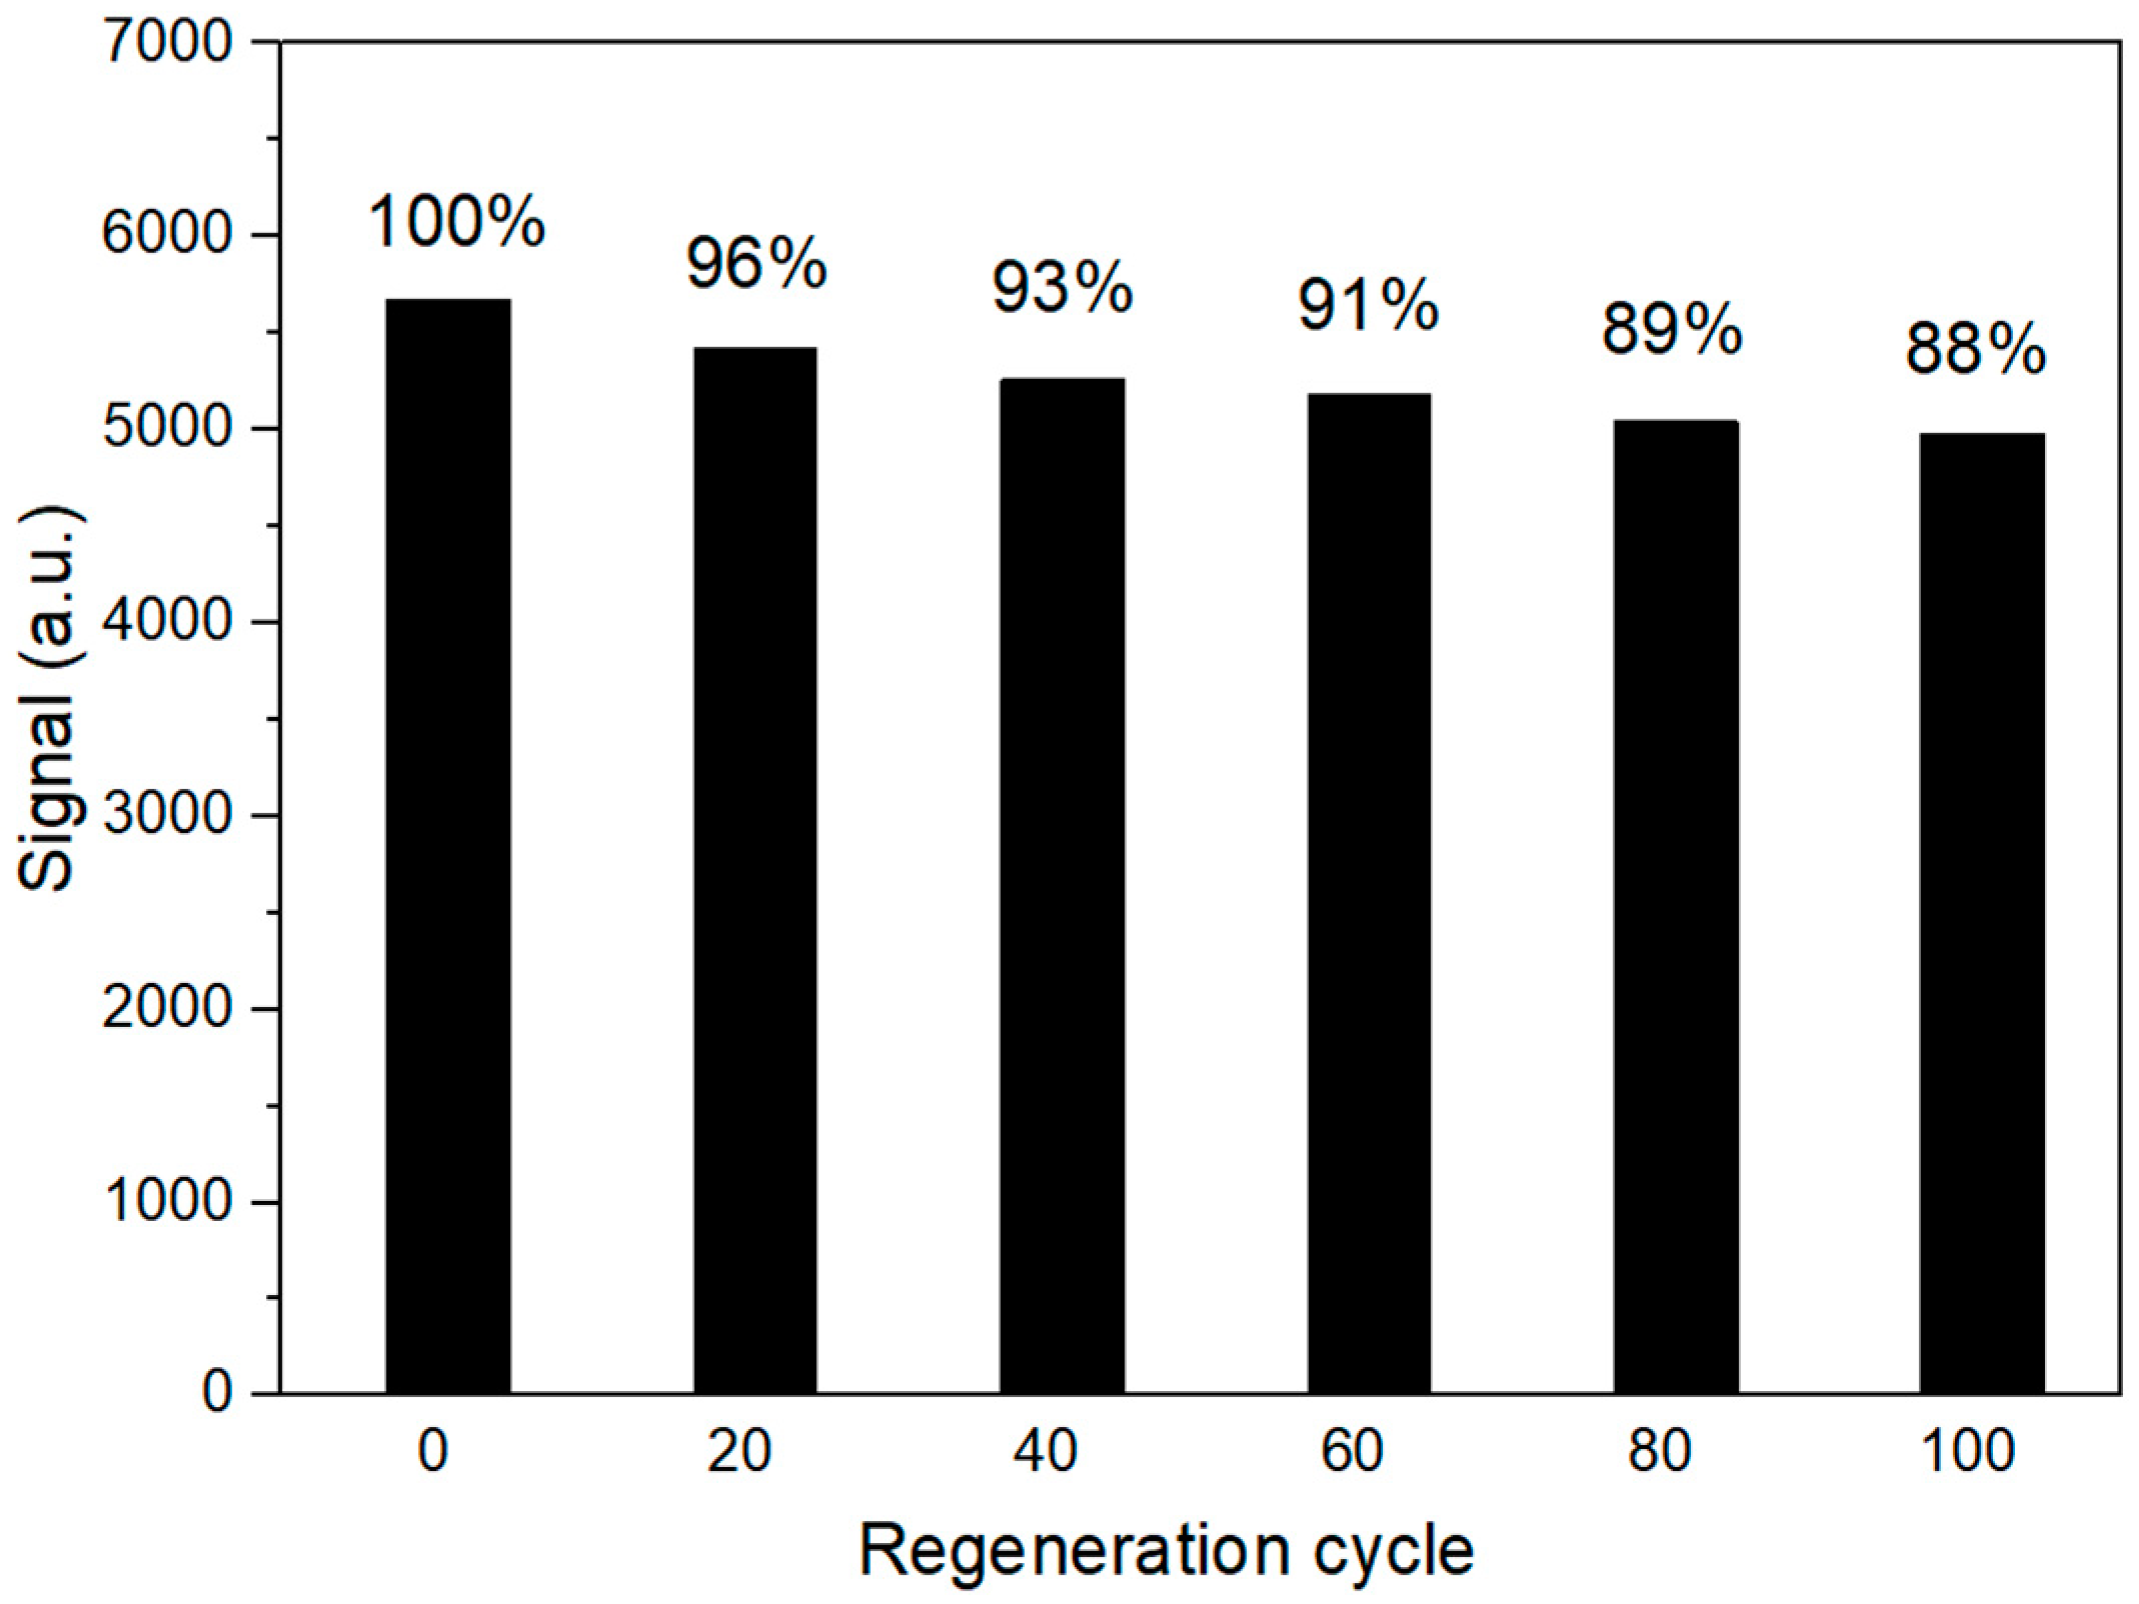
3.5. Reusability
3.6. Recovery Study
4. Conclusions
Supplementary Materials
Author Contributions
Funding
Acknowledgments
Conflicts of Interest
References
- Tennakoon, D.S.; Karunarathna, W.; Udugampala, U. Carbofuran concentrations in blood, bile and tissues in fatal cases of homicide and suicide. Forensic Sci. Int. 2013, 227, 106–110. [Google Scholar] [CrossRef] [PubMed]
- Bermúdez-Couso, A.; Fernández-Calviño, D.; Pateiro, M.; Nóvoa-Muñoz, J.C.; Simal-Gándara, J.; Arias-Estévez, M. Adsorption and desorption kinetics of carbofuran in acid soils. J. Hazard. Mater. 2011, 190, 159–167. [Google Scholar] [CrossRef] [PubMed]
- De Silva, P.M.C.; Pathiratne, A.; Van Gestel, C.A. Toxicity of chlorpyrifos, carbofuran, mancozeb and their formulations to the tropical earthworm Perionyx excavatus. Appl. Soil Ecol. 2010, 44, 56–60. [Google Scholar] [CrossRef]
- Lu, L.-A.; Ma, Y.-S.; Kumar, M.; Lin, J. Photochemical degradation of carbofuran and elucidation of removal mechanism. Chem. Eng. J. 2011, 166, 150–156. [Google Scholar] [CrossRef]
- Pessoa, P.; Luchmann, K.; Ribeiro, A.; Veras, M.; Correa, J.; Nogueira, A.; Bainy, A.C.; Carvalho, P.S.M. Cholinesterase inhibition and behavioral toxicity of carbofuran on Oreochromis niloticus early life stages. Aquat. Toxicol. 2011, 105, 312–320. [Google Scholar] [CrossRef]
- Chowdhury, M.A.Z.; Fakhruddin, A.; Islam, N.; Moniruzzaman, M.; Gan, S.H.; Alam, K. Detection of the residues of nineteen pesticides in fresh vegetable samples using gas chromatography–mass spectrometry. Food Control 2013, 34, 457–465. [Google Scholar] [CrossRef]
- Duan, Y.; Guan, N.; Li, P.; Li, J.; Luo, J. Monitoring and dietary exposure assessment of pesticide residues in cowpea (Vigna unguiculata L. Walp) in Hainan, China. Food Control 2016, 59, 250–255. [Google Scholar] [CrossRef]
- Skretteberg, L.G.; Lyrån, B.; Holen, B.; Jansson, A.; Fohgelberg, P.; Siivinen, K.; Andersen, J.H.; Jensen, B.H. Pesticide residues in food of plant origin from Southeast Asia—A Nordic project. Food Control 2015, 51, 225–235. [Google Scholar] [CrossRef]
- Otieno, P.O.; Lalah, J.O.; Virani, M.; Jondiko, I.O.; Schramm, K.-W. Carbofuran and its Toxic Metabolites Provide Forensic Evidence for Furadan Exposure in Vultures (Gyps africanus) in Kenya. Bull. Environ. Contam. Toxicol. 2010, 84, 536–544. [Google Scholar] [CrossRef]
- Leppert, B.C.; Markle, J.C.; Helt, R.C.; Fujie, G.H. Determination of carbosulfan and carbofuran residues in plants, soil, and water by gas chromatography. J. Agric. Food Chem. 1983, 31, 220–223. [Google Scholar] [CrossRef]
- Zhang, C.P.; He, H.M.; Yu, J.Z.; Hu, X.Q.; Zhu, Y.H.; Wang, Q. Residues of carbosulfan and its metabolites carbofuran and 3-hydroxy carbofuran in rice field ecosystem in China. J. Environ. Sci. Health. Part B 2016, 51, 1–7. [Google Scholar] [CrossRef] [PubMed]
- Petropoulou, S.-S.E.; Gikas, E.; Tsarbopoulos, A.; Siskos, P.A. Gas chromatographic–tandem mass spectrometric method for the quantitation of carbofuran, carbaryl and their main metabolites in applicators’ urine. J. Chromatogr. A 2006, 1108, 99–110. [Google Scholar] [CrossRef] [PubMed]
- Da Silva, M.C.; Oliveira, M.L.G.; Augusti, R.; Faria, A.F. Simultaneous Extraction of Pesticides and Polycyclic Aromatic Hydrocarbons in Brazilian Cachaça Using a Modified QuEChERS Method Followed by Gas Chromatography Coupled to Tandem Mass Spectrometry Quantification. J. Agric. Food Chem. 2018, 67, 399–405. [Google Scholar] [CrossRef] [PubMed]
- López-Blanco, M.C.; Cancho-Grande, B.; Simal-Gándara, J. Comparison of solid-phase extraction and solid-phase microextraction for carbofuran in water analyzed by high-performance liquid chromatography-photodiode-array detection. J. Chromatogr. A 2002, 963, 117–123. [Google Scholar] [CrossRef]
- Song, S.; Zhu, K.; Han, L.; Sapozhnikova, Y.; Zhang, Z.; Yao, W. Residue Analysis of 60 Pesticides in Red Swamp Crayfish Using QuEChERS with High-Performance Liquid Chromatography–Tandem Mass Spectrometry. J. Agric. Food Chem. 2018, 66, 5031–5038. [Google Scholar] [CrossRef] [PubMed]
- Yao, L.; Liu, L.; Song, S.; Kuang, H.; Xu, C. Development of indirect competitive enzyme-linked immunosorbent and immunochromatographic strip assays for carbofuran detection in fruits and vegetables. Food Agric. Immunol. 2017, 28, 639–651. [Google Scholar] [CrossRef] [Green Version]
- Zhou, P.; Lu, Y.; Zhu, J.; Hong, J.; Li, B.; Zhou, J.; Gong, D.; Montoya, A. Nanocolloidal Gold-Based Immunoassay for the Detection of theN-Methylcarbamate Pesticide Carbofuran. J. Agric. Food Chem. 2004, 52, 4355–4359. [Google Scholar] [CrossRef]
- Li, W.; Zhang, G.; Zhao, N.; Hu, X. Simultaneous synchronous fluorimetric determination of metolcarb, propoxur and carbofuran by chemometrics methods. Chin. J. Anal. Lab. 2010, 29, 59–62. (In Chinese) [Google Scholar]
- Sun, X.; Zhu, Y.; Wang, X. Amperometric immunosensor based on deposited gold nanocrystals/4,4′-thiobisbenzenethiol for determination of carbofuran. Food Control 2012, 28, 184–191. [Google Scholar] [CrossRef]
- Liu, L.; Xu, D.; Hu, Y.; Liu, S.; Wei, H.; Zheng, J.; Wang, G.; Hu, X.; Wang, C. Construction of an impedimetric immunosensor for label-free detecting carbofuran residual in agricultural and environmental samples. Food Control 2015, 53, 72–80. [Google Scholar] [CrossRef]
- Wang, M.; Huang, J.; Wang, M.; Zhang, D.; Chen, J. Electrochemical nonenzymatic sensor based on CoO decorated reduced graphene oxide for the simultaneous determination of carbofuran and carbaryl in fruits and vegetables. Food Chem. 2014, 151, 191–197. [Google Scholar] [CrossRef]
- Du, S.; Wang, X.; Sun, X.; Li, Q. Amperometric Immunosensor Based on L-Cysteine/Gold Colloidal Nanoparticles for Carbofuran Detection. Anal. Lett. 2012, 45, 1230–1241. [Google Scholar] [CrossRef]
- Dai, Y.; Wang, T.; Hu, X.; Liu, S.; Zhang, M.; Wang, C. Highly sensitive microcantilever-based immunosensor for the detection of carbofuran in soil and vegetable samples. Food Chem. 2017, 229, 432–438. [Google Scholar] [CrossRef] [PubMed]
- Lan, J.; Wang, M.; Ding, S.; Fan, Y.; Diao, X.; Li, Q.X.; Zhao, H. Simultaneous detection of carbofuran and 3-hydroxy-carbofuran in vegetables and fruits by broad-specific monoclonal antibody-based ELISA. Food Agric. Immunol. 2019, 30, 1085–1096. [Google Scholar] [CrossRef]
- Lan, J.; Sun, W.; Chen, L.; Zhou, H.; Fan, Y.; Diao, X.; Wang, B.; Zhao, H. Simultaneous and rapid detection of carbofuran and 3-hydroxy-carbofuran in water samples and pesticide preparations using lateral-flow immunochromatographic assay. Food Agric. Immunol. 2020, 31, 165–175. [Google Scholar] [CrossRef] [Green Version]
- Taitt, C.R.; Anderson, G.P.; Ligler, F.S. Evanescent wave fluorescence biosensors: Advances of the last decade. Biosens. Bioelectron. 2016, 76, 103–112. [Google Scholar] [CrossRef] [PubMed] [Green Version]
- Zhou, X.H.; Song, B.D.; Shi, H.C.; Liu, L.H.; Guo, H.L.; He, M. An evanescent wave multi-channel immunosensor system for the highly sensitive detection of small analytes in water samples. Sens. Actuators B-Chem. 2014, 198, 150–156. [Google Scholar]
- Liu, L.-H.; Wang, R.; Xu, W.-Q.; Song, B.-D.; Shi, H. Highly sensitive detection of sulfadimidine in water and dairy products by means of an evanescent wave optical biosensor. RSC Adv. 2014, 4, 60227–60233. [Google Scholar] [CrossRef]
- Liu, L.; Wang, R.; Wilkinson, J.S.; Hua, P.; Song, B.; Shi, H. Integrated optical waveguide-based fluorescent immunosensor for fast and sensitive detection of microcystin-LR in lakes: Optimization and Analysis. Sci. Rep. 2017, 7, 3655. [Google Scholar] [CrossRef] [Green Version]
- Liu, L.; Zhou, X.; Lu, M.; Zhang, M.; Yang, C.; Ma, R.; Memon, A.G.; Shi, H.; Qian, Y. An array fluorescent biosensor based on planar waveguide for multi-analyte determination in water samples. Sens. Actuators B Chem. 2017, 240, 107–113. [Google Scholar] [CrossRef]
- Wang, R.; Wang, R.; Zhu, X.; Yang, C.; Liu, L.; Shi, H. Isoelectric Bovine Serum Albumin: Robust Blocking Agent for Enhanced Performance in Optical-Fiber Based DNA Sensing. ACS Sens. 2017, 2, 257–262. [Google Scholar] [CrossRef]
- Baig, M.A.; Salahuddin, A. Occurrence and characterization of stable intermediate state(s) in the unfolding of ovomucoid by guanidine hydrochloride. Biochem. J. 1978, 171, 89–97. [Google Scholar] [CrossRef] [Green Version]


| Analytical Methods | Linear Range (ng/mL) | LOD (ng/mL) | References |
|---|---|---|---|
| GC | 1.0–200 | 1.0 | Petropoulou et al., 2006 |
| HPLC | / | 0.06 | Lopez-Blanco et al., 2002 |
| ELISA | 0.1–1.0 | / | Yao et al., 2017 |
| GICA | / | 7–10 | Lan et al., 2020 |
| Fluorimetry | 4.0–560 | 2.0 | Li et al., 2010 |
| Amperometric immunosensor | 0.1–1,000,000 | 0.06 | Sun et al., 2012 |
| Microcantilever-based immunosensor | 0.1–1000 | 0.1 | Dai et al., 2017 |
| Fluorescent sensors | 0.29–2.69 (CBF) | 0.13 | This work |
| 0.12–4.59 (3-OH-CBF) | 0.06 |
| Samples | Spiked Value (ng/g) | Recovery of CBF % | |||
| This Method | icELISA | ||||
| Recovery (%) | Coefficient Variation (CV) % | Recovery (%) | Coefficient Variation (CV) % | ||
| River water | 0 | ND a | ND | ||
| 5 | 104.3 | 2.0 | 89.1 | 8.3 | |
| 10 | 103.2 | 1.3 | 93.3 | 5.7 | |
| 20 | 99.9 | 2.2 | 97 | 9.6 | |
| Tap water | 0 | ND | ND | ||
| 5 | 105.6 | 0.7 | 101.2 | 3.6 | |
| 10 | 98.7 | 1.3 | 94.5 | 2.0 | |
| 20 | 98.8 | 0.5 | 103.8 | 5.2 | |
| Long bean | 0 | ND | ND | ||
| 5 | 109.6 | 1.7 | 104.3 | 2.7 | |
| 10 | 101.8 | 1.6 | 102.8 | 1.4 | |
| 20 | 99.3 | 2.7 | 97.3 | 6.2 | |
| Apple | 0 | ND | ND | ||
| 5 | 102.2 | 1.8 | 88.7 | 10.4 | |
| 10 | 103.8 | 2.1 | 95.4 | 7.4 | |
| 20 | 102.5 | 0.2 | 89.5 | 7.0 | |
| Samples | Spiked Value (ng/g) | Recovery of 3-OH-CBF % | |||
| This Method | icELISA | ||||
| Recovery (%) | Coefficient Variation (CV) % | Recovery (%) | Coefficient Variation (CV) % | ||
| River water | 0 | ND | ND | ||
| 5 | 98.7 | 1.9 | 93.4 | 6.3 | |
| 10 | 98.8 | 3.5 | 99.7 | 6.3 | |
| 20 | 104.2 | 3.4 | 98.1 | 6.8 | |
| Tap water | 0 | ND | ND | ||
| 5 | 96.6 | 2.8 | 99.8 | 3.1 | |
| 10 | 101.8 | 2.4 | 96.1 | 2.8 | |
| 20 | 103.3 | 1.9 | 102.3 | 2.8 | |
| Long bean | 0 | ND | ND | ||
| 5 | 94.3 | 1.8 | 103.3 | 8.0 | |
| 10 | 97.8 | 3.6 | 102 | 2.3 | |
| 20 | 99.2 | 1.7 | 99 | 7.8 | |
| Apple | 0 | ND | ND | ||
| 5 | 104.9 | 1.0 | 91.3 | 9.0 | |
| 10 | 94.9 | 0.3 | 94.9 | 9.0 | |
| 20 | 96.4 | 1.5 | 92.6 | 4.5 | |
Publisher’s Note: MDPI stays neutral with regard to jurisdictional claims in published maps and institutional affiliations. |
© 2020 by the authors. Licensee MDPI, Basel, Switzerland. This article is an open access article distributed under the terms and conditions of the Creative Commons Attribution (CC BY) license (http://creativecommons.org/licenses/by/4.0/).
Share and Cite
Sun, W.; Liu, L.; Memon, A.G.; Zhou, X.; Zhao, H. Waveguide-Based Fluorescent Immunosensor for the Simultaneous Detection of Carbofuran and 3-Hydroxy-Carbofuran. Biosensors 2020, 10, 191. https://doi.org/10.3390/bios10120191
Sun W, Liu L, Memon AG, Zhou X, Zhao H. Waveguide-Based Fluorescent Immunosensor for the Simultaneous Detection of Carbofuran and 3-Hydroxy-Carbofuran. Biosensors. 2020; 10(12):191. https://doi.org/10.3390/bios10120191
Chicago/Turabian StyleSun, Weiming, Lanhua Liu, Abdul Ghaffar Memon, Xiaohong Zhou, and Hongwei Zhao. 2020. "Waveguide-Based Fluorescent Immunosensor for the Simultaneous Detection of Carbofuran and 3-Hydroxy-Carbofuran" Biosensors 10, no. 12: 191. https://doi.org/10.3390/bios10120191