Article

Development of a Novel ssDNA Sequence for a Glycated Human Serum Albumin and Construction of a Simple Aptasensor System Based on Reduced Graphene Oxide (rGO)

1
Department of Chemistry and Research Institute of Natural Sciences, Hanyang University, Seoul 04763, Korea
2
Sungsan Eng Co.ltd., Gumi 39377, Korea
*
Author to whom correspondence should be addressed.
These authors contributed equally to this work.
Biosensors 2020, 10(10), 141; https://doi.org/10.3390/bios10100141
Submission received: 21 September 2020 / Revised: 10 October 2020 / Accepted: 12 October 2020 / Published: 14 October 2020

Abstract

:
Diabetes is one of the top 10 global causes of death. About one in 11 global adults have diabetes. As the disease progresses, the mortality rate increases, and complications can develop. Thus, early detection and effective management of diabetes are especially important. Herein, we present a novel glycated human serum albumin (GHSA) aptamer, i.e., GABAS-01, which has high affinity and specificity. The aptamer was selected by reduced graphene oxide-based systematic evolution of ligands by exponential enrichement (rGO-based SELEX) against GHSA. After five rounds of selection through gradually harsher conditions, GABAS-01 with high affinity and specificity for the target was obtained. GABAS-01 was labeled by FAM at the 5′-end and characterized by measuring the recovery of a fluorescence signal that is the result of fluorescence quenching effect of rGO. As a result, GABAS-01 had low-nanomolar Kd values of 1.748 ± 0.227 nM and showed a low limit of detection of 16.40 μg/mL against GHSA. This result shows the potential application of GABAS-01 as an effective on-site detection probe of GHSA. In addition, these properties of GABAS-01 are expected to contribute to detection of GHSA in diagnostic fields.

1. Introduction

Diabetes is a group of metabolic diseases in which high blood sugar level persists for a long time. Diabetes is caused by dysfunction of insulin production, leading to hyperglycemia, and typically includes type 1 diabetes and type 2 diabetes [1]. Type 1 diabetes occurs when the immune system in the body attacks and destroys the pancreatic cells that produce insulin [2]. Thus, insulin secretion is blocked, and insulin action is hindered when sugar builds up in the bloodstream. Type 1 diabetes is called ‘insulin-dependent diabetes mellitus’, and type 2 diabetes is called ‘non-insulin-dependent diabetes mellitus’. Type 2 diabetes is the more common type of diabetes and is caused by lifestyle and genetics [3,4]. In this type, cells develop a resistance to the action of insulin to result in impaired insulin secretion. As the pancreas does make not enough insulin to overcome this resistance, insulin actions are relatively reduced, and the blood sugar level is increased [4,5,6].
Diabetes mellitus was one of the top 10 global causes of death in 2016 [7]. According to the International Diabetes Federation’s diabetes atlas, 285 million people (between the ages of 20 and 79 years) suffered from diabetes in 2010. In 2019, the number of patients increased to 463 million with a 4.2% mortality rate. This trend is increasing continuously, and it is expected that 578 million people will have diabetes in 2030 [8]. Diabetes can lead to severe long-term complications. The major complications are related to nerves (neuropathy), kidneys (nephropathy), eyes (retinopathy), and blood vessels in the heart [9,10]. These complications lead to increased mortality risk, which is especially high in young-onset type 2 diabetes [10,11]. Hence, early detection and effective management of diabetes are crucial.
The American Diabetes Association (ADA) has recommended screening guidelines for diabetes since 2009, and the World Health Organization (WHO) supports these guidelines [12,13]. According to their reports, a fasting plasma glucose (FPG) test and an oral glucose tolerance test (OGTT) can be used to measure the blood sugar level. The FPG test is faster and easier than other tests. However, it requires overnight fasting and measures the blood sugar level at the time of blood sampling. The OGTT is more sensitive than the FPG test, but it is less convenient to manage. It requires fasting for more than eight hours and measures blood glucose immediately before and two hours after a person drinks a liquid containing 75 g of glucose dissolved in water [12]. The criterion for diabetes diagnosis is an FPG level ≥ 126 mg/dL (7.0 mmol/L) or a 2 h plasma glucose level ≥ 200 mg/dL (11.1 mmol/L) during an OGTT. The other test that the ADA recommended is the glycated hemoglobin (HbA1c) test. This test does not require fasting and provides a reliable measure to monitor and manage chronic glycemia because it detects the average blood sugar level for the past 2–3 months [14]. However, it has several limitations. First, it is not suitable for detecting short-term changes in blood sugar. Additionally, for pregnant women and patients with disorders like hemolytic anemia or thalassemia, it is unreliable. Additionally, because the HbA1c test cannot distinguish between fasting blood glucose and postprandial blood sugar levels, it is difficult to determine if additional adjustment is required [15]. However, these drawbacks can be overcome by using glycated human serum albumin (GHSA) [16,17].
Albumin is the most abundant protein in both human blood and major organs. Glycated albumin refers to albumin that is bonded by non-enzymatic glycation. It measures the average blood sugar level over the past 2–3 weeks, which is a shorter period of time than the HbA1c test [18]. GHSA allows for a more accurate diagnosis and treatment; therefore, it can be used as a more accurate marker for diabetes mellitus.
Aptamers are short single-stranded oligonucleotides (ssDNA or RNA). As the aptamers are folded into a specific three-dimensional structure, they have high affinity and selectivity against the target molecules. They are developed via systematic evolution of ligands by exponential enrichment (SELEX), which was first reported in 1990 [19,20]. The target range of SELEX is wide, including small molecules, proteins, immunogens, organisms, and even whole cells [21,22,23,24,25,26,27,28]. Compared with antibodies, aptamers have several benefits, such as lower cost, smaller size, lower immunogenicity, and easier synthesis and chemical modifications [29,30]. Additionally, aptamers are stable in harsh conditions. Hence, aptamers have been used in biotechnology, biosensing, and biomedicine [31,32,33].
To obtain specific aptamers, SELEX technology has been developed. The traditional SELEX methods need a target immobilizing step [34,35]. However, some cases of immobilizing methods are very complex and time-consuming processes. Moreover, these methods may change the conformations of the targets and occupy a binding site of the targets. To solve this problem, we performed SELEX using reduced graphene oxide (rGO) system. Generally, graphene oxide (GO) can adsorb single-stranded oligonucleotides through π-π stacking interactions and it requires simple detachment methods to separate the adsorbed single-stranded oligonucleotides from graphene oxide [36,37]. The detachment methods need addition of complementary sequences or other molecules such as proteins that lead to conformational changes, because the interactions between the single-stranded oligonucleotides and GO are the result of the exposed phosphate backbone [36,37,38,39].
In this work, graphene was also used as a substrate for nonspecific adsorption of fluorescent dye-labeled aptamers in SELEX process. Graphene has a linear band dispersion around the corners of its Brillouin zone (BZ) and a nearly constant optical absorption; thus, optically excited species can be quenched by resonance energy transfer via excitation of electron-hole pairs in the graphene [40,41,42,43,44]. Besides, using this principle, rGO system was used to characterize binding affinity and specificity of aptamers against the target as well.
In this research, we propose a novel sequence of DNA aptamers with high binding affinity for GHSA and suggest that the screening method is important for constructing the sensor system.

2. Materials and Methods

2.1. Materials

The single-stranded DNA library and primers were synthesized by Bioneer (Daejeon, Korea). pfu DNA polymerase was purchased from Biofact (Daejeon, Korea). Restriction enzymes and DNA ligases were purchased from Takara Bio (Shiga, Japan). Reduced graphene oxide was purchased from Graphene Supermarket (Calverton, NY, USA). Other chemicals were obtained from commercial sources with high quality.

2.2. Construction of the ssDNA Library and Primers

The methodology of constructing ssDNA library and primers is similar to previous research [45]. To develop a specific aptamer that binds to GHSA, the ssDNA library was synthesized with 30 central random bases flanked by two sets of 15 conserved bases. The library, which consisted of 60 bases (5′-ATGCGGATCCCGCGC-(N)30-GCGCGAAGCTTGCGC-3′), was used for the template in the first round of SELEX. Primer sites were contained at the BamH I site for the forward primer (5′-ATGCGGATCCCGCGC-3′) and at the Hind III site for the reverse primer. To amplify the template DNA library, 100 μM of forward primer and 10 μM of reverse primer were used for the asymmetric polymerase chain reaction (PCR). The PCR product was electrophoresed on 2.5% agarose gel for confirmation. Next, the crush and soak method was performed to extract the ssDNA library. Additionally, the PCR product was electrophoresed on 12% native gel and stained by ethidium bromide (EtBr) to isolate ssDNA from double-stranded DNA (dsDNA). The ssDNA band was cut out, pulverized, and extracted with crush and soak buffer (500 mM NH4OAc, 0.1% SDS, 0.1 mM ethylenediaminetetraacetic acid (EDTA)).

2.3. Aptamer Screening with Reduced Graphene Oxide

The methodology of screening used here is similar to one described previously [45]. In vitro SELEX against GHSA was performed with a reduced graphene oxide (2 mg/mL in dH2O) system. We performed five rounds of screening, and human serum albumin (HSA) was used as a counter target in each round to obtain aptamer sequences that bind to GHSA specifically.
First, 200 pmol of the ssDNA library pool, 50 μL of the rGO solution (2 mg/mL), 500 μg of the counter target diluted in distilled water, and 40 μL of 5X PBS were mixed and incubated at room temperature for 60 min to immobilize the ssDNA library onto the rGO and eliminate candidates that can bind to HSA. The total reaction volume was 200 μL and pH of mixture is 7.4. The mixture was centrifuged at 14,000 rpm for 20 min, and the supernatant was removed. Next, the rGO-bound ssDNA library was washed three times with 200 μL of 1X PBS in pH 7.4 to remove unbound and weakly bound sequences, followed by another round of centrifugation. After that, for positive selection, 500 μg of GHSA diluted in 200 μL of 1X PBS in pH 7.4 was added and incubated at R.T. for 60 min to elute the target binding aptamers from rGO. When the aptamer was eluted by the target, the binding time and buffer condition for reaction were regulated to select more specific aptamers.

2.4. Sequence Analysis

After five rounds of selection, cloning was performed to analyze the selected aptamers. The aptamers were amplified to dsDNA by PCR. The amplified dsDNA product was cut using restriction enzymes (Hind III and Bam HI) and ligated into the pET28a (+) expression vector with T4 DNA ligase. Ligation was carried out at 16 °C overnight and transformed into Escherichia coli. The recombinant E. coli was cultured overnight at 37 °C in LB medium. Then, the DNA was extracted using a plasmid mini extraction kit (Bioneer, Daejeon, Korea) and sequenced by Macrogen Inc. (Seoul, Korea).

2.5. Characterization of the Aptamer with rGO

The obtained aptamer was labeled by FAM (6-carboxyfluorescein) at the 5′-end and characterized using the fluorescence recovery signal. Each experiment was repeated three times.
In the binding affinity test, each concentration of aptamer was incubated with 12.5 μg of GHSA diluted in 100 μL of 1 × PBS for 30 min to induce aptamer-protein binding. We added 100 μL of rGO diluted in 1 × PBS in pH 7.4 (0.5 mg/mL) to eliminate unbound aptamer residues. We performed centrifugation at 14,000 rpm for 20 min to separate supernatants. Each of the reaction samples was transferred to a 96-well opaque plate, and the fluorescence signal was measured.
The specificity test for other serum albumins was performed using 125 nM of aptamer. The processes and the conditions of reactions were the same as those used for the binding affinity test. Human serum albumin (HSA) and bovine serum albumin (BSA) were used for the specificity test. The experiments of these two controls were undertaken at the same molarity as the GHSA.
The detection limit of the aptamer was measured using various amounts of the target. The concentration of aptamer was 125 nM, and the concentrations of target were 0, 1.95, 3.91, 7.81, 15.625, 31.25, 62.5 and 125 μg/mL. The reaction volume was 100 μL. The processes and reaction conditions were the same as those stated above. The limit of detection (LOD) value was calculated by the official formula established by the International Union of Pure and Applied Chemistry (IUPAC):
LOD = 3 × SD/slope
Here, SD represents the standard deviation at a minimum point, and the slope is obtained from the fitted graph.

2.6. Target Detection in Human Serum Solution

Detection of GHSA in human serum solution which is diluted 1/1000 in PBS was achieved through the fluorescence aptasensor system with rGO. The concentrations of GHSA for the tests were 15.625, 31.25, 62.5 and 125 μg/mL.
The analysis process was performed in the same way as the LOD determination.

3. Results

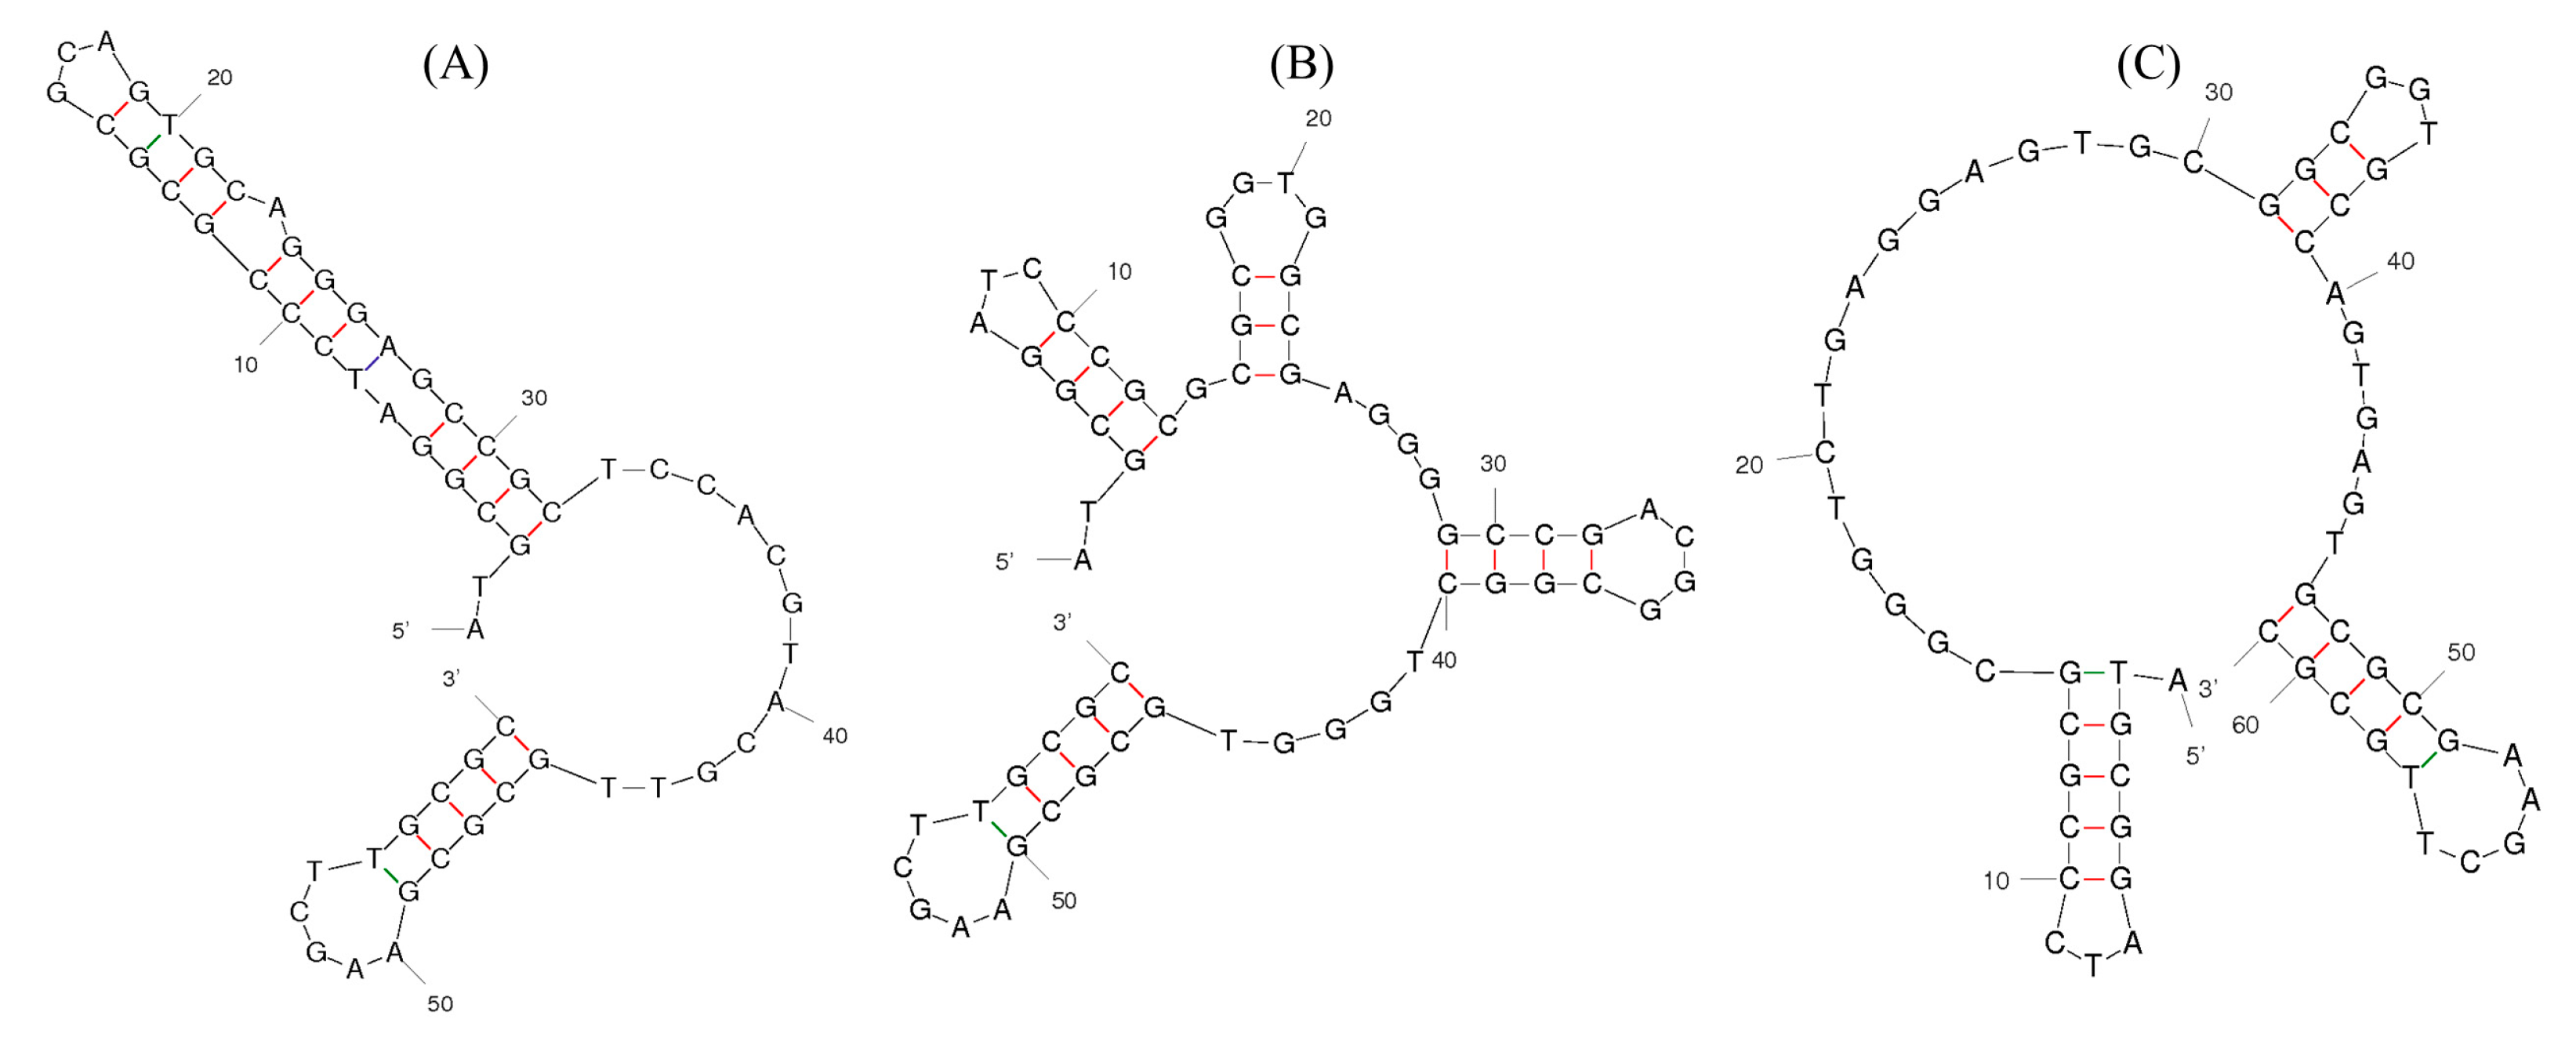
3.1. Development of Aptamers against GHSA via rGO-SELEX

To isolate the specific aptamers against GHSA, we performed rGO-based SELEX. The ssDNA library was incubated with rGO. The DNA bases were bound to the polycyclic aromatic rings of the graphene surface via π-π stacking interactions [36,37]. The non-bound sequences on rGO and the bound sequences with the counter target were separated by centrifugation and removed. Next, the sequences adsorbed on the rGO surface were eluted by introducing the target compound, amplified by PCR, and used for the next round of selection. Each round of selection proceeded in gradually harsher buffer conditions and shorter elution times to obtain more specific aptamers for the target compound. In Table 1, binding means aptamer-graphene interaction and elution means aptamer–target interaction. The binding buffer is PBS.
The amplified aptamer sequences were inserted into the pET-28a vector and inoculated. After E. coli was cultured overnight at 37 °C Development of Aptamers against GHSA via rGO-Selex in the LB medium, three sequences were selected based on frequency and labeled (Table 2). The secondary structures of all selected aptamers were predicted by the M-fold program and exhibited different structure patterns (Figure 1).

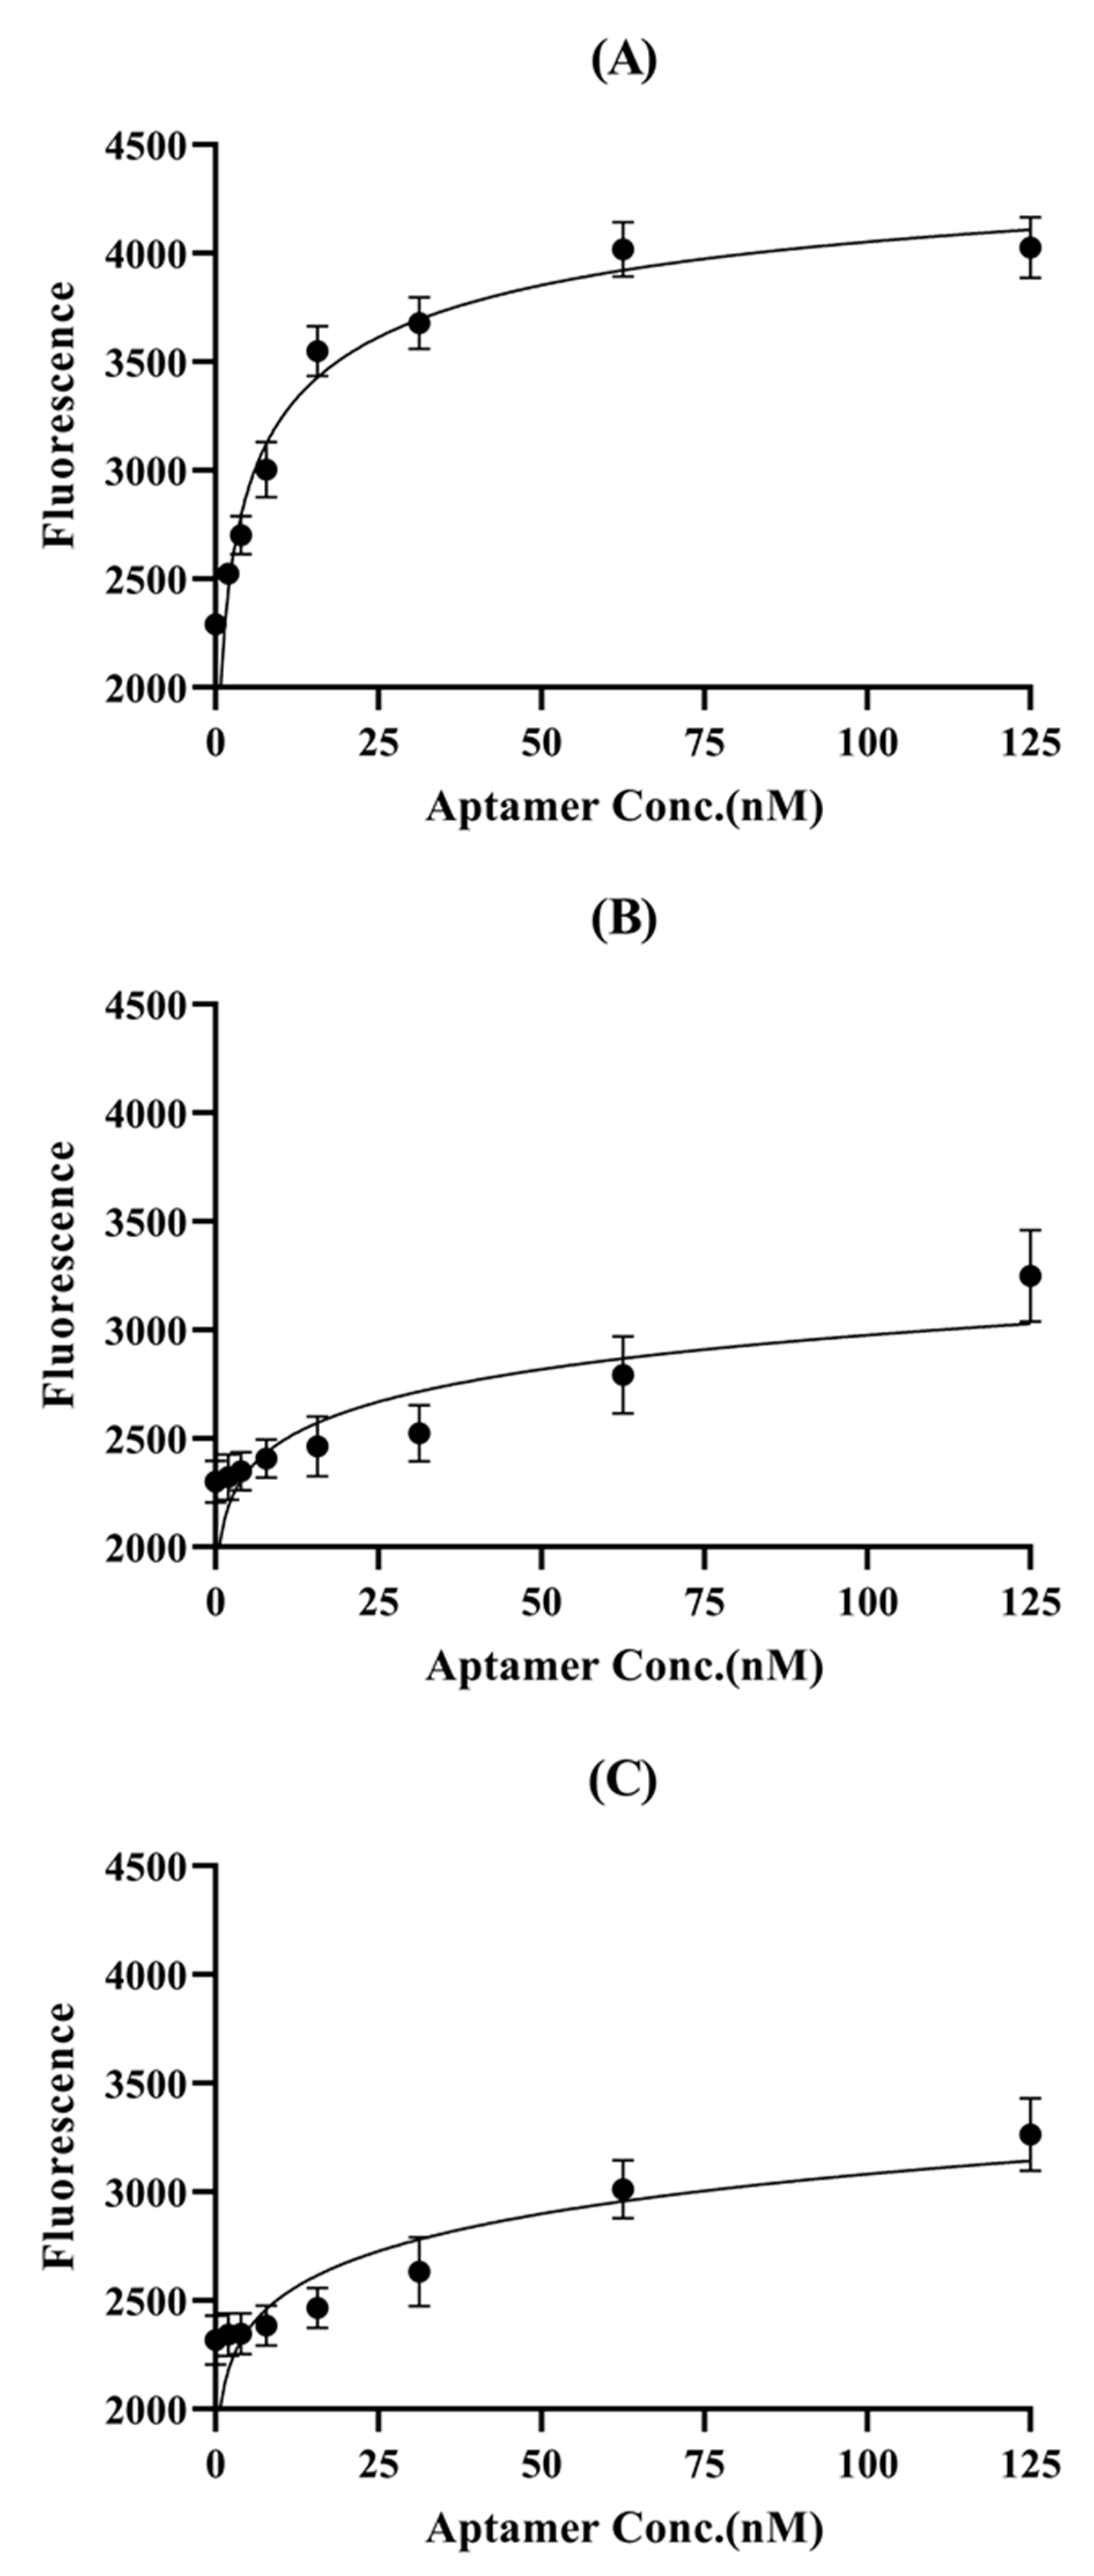
3.2. Binding Affinity of the Selected Aptamer

The fluorescein amidite (FAM)-labeled glycated human serum albumin binding aptamers (GABASs) were characterized based on the fluorescence recovery signal. First, the aptamer was reacted with the target protein, and rGO was added to eliminate aptamer residue. When the aptamer was bound to the surface of rGO, the fluorescence signal was decreased. As shown in Figure 2, the fluorescence signal of GABAS-01 was saturated at near 31.25 nM, while the signals of GABAS-02 and GABAS-03 were not saturated in the same concentration. This experimental process was repeated three times, and the Kd (dissociation constant) value of GABAS-01 was determined to be 1.748 ± 0.227 nM and the Kd values for the other two aptamers, GABAS-02 and GABAS-03, were not determined exactly in this experiment.

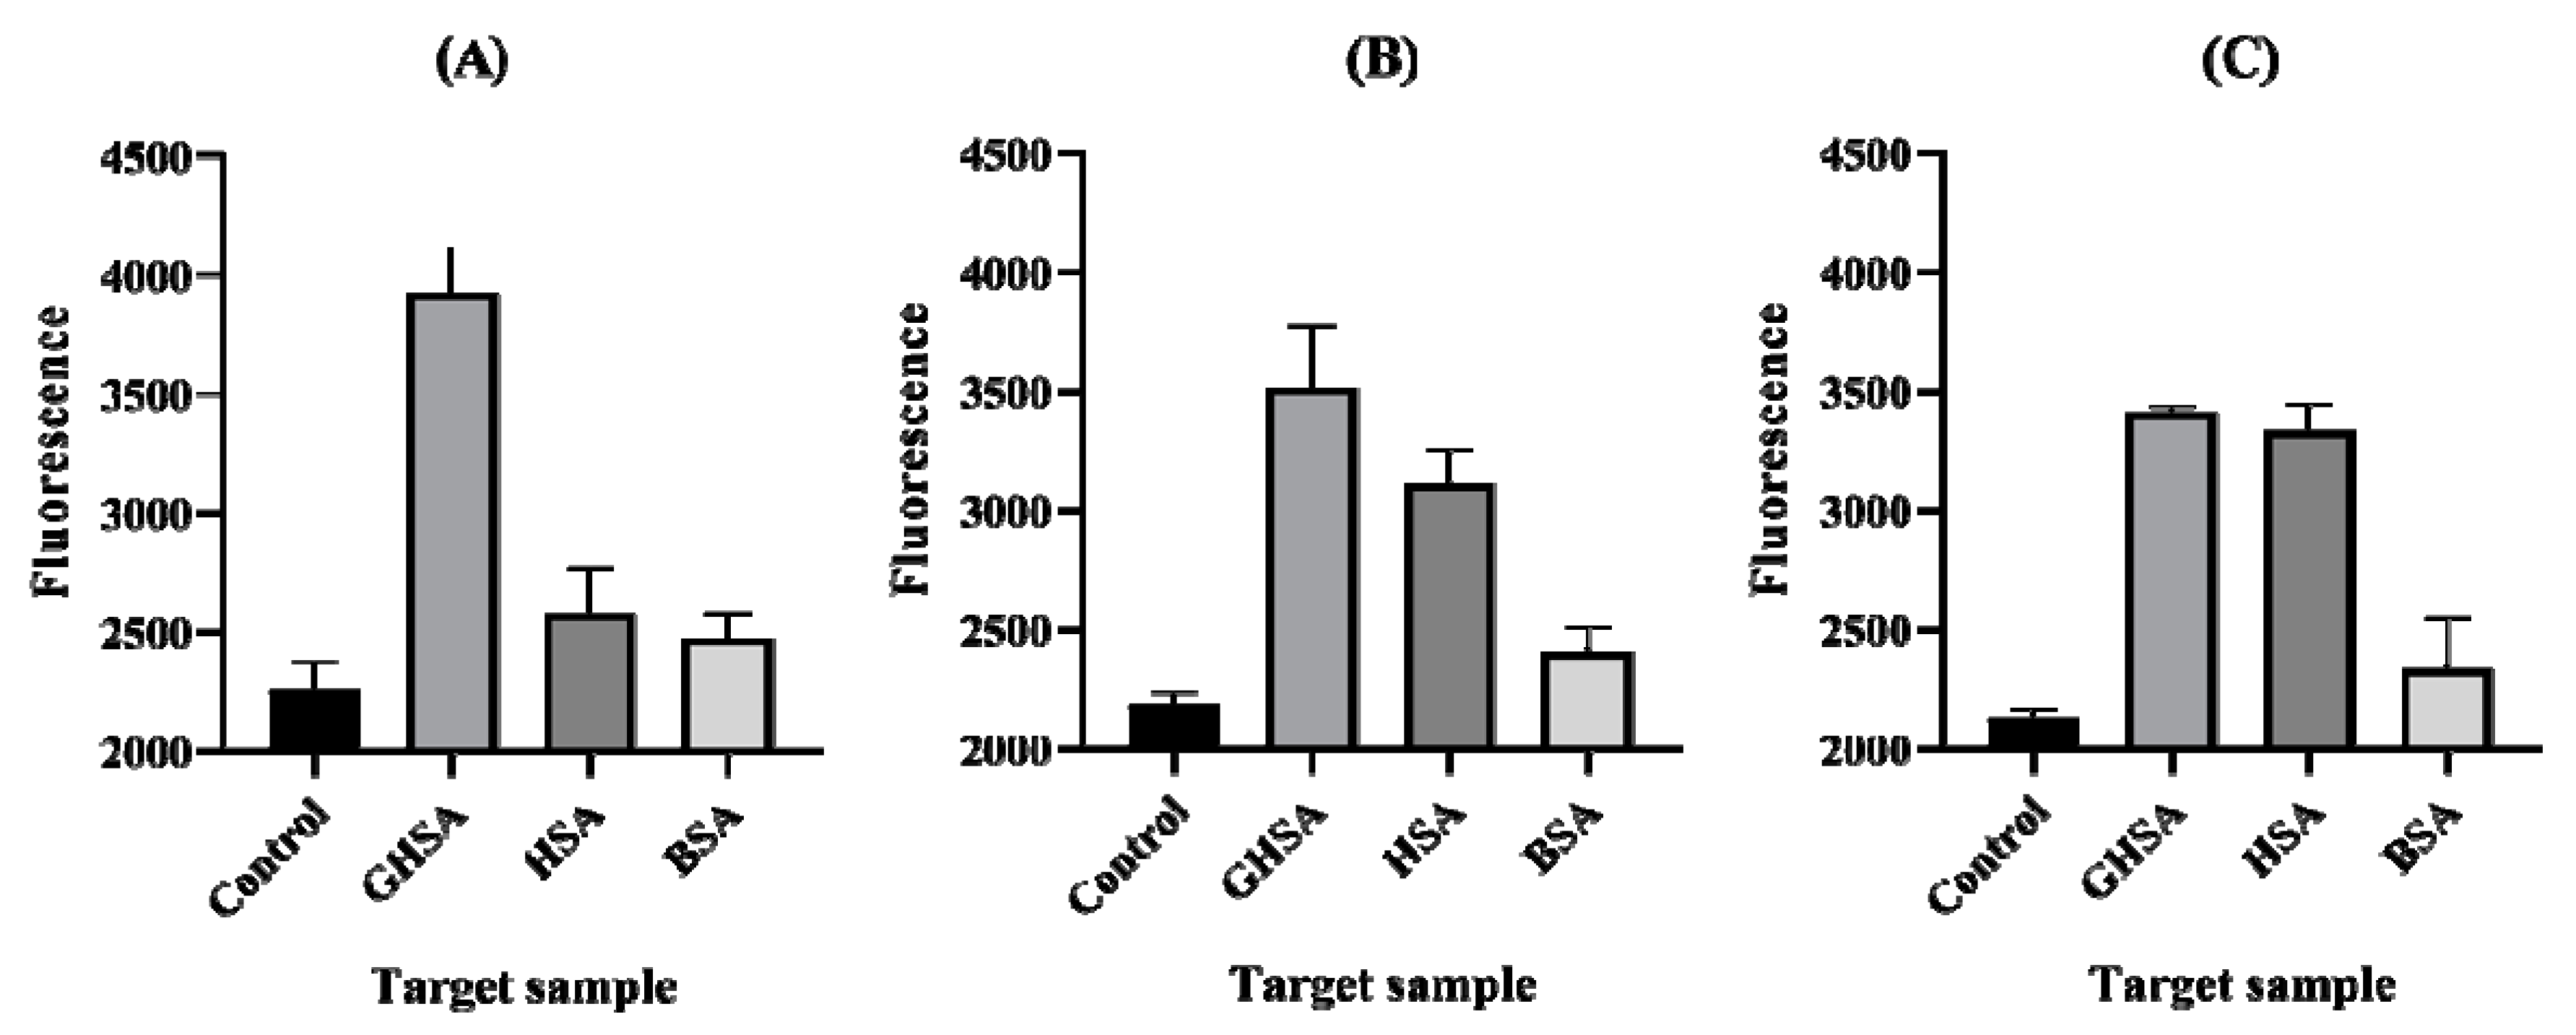
3.3. Specificity Test

Specificity test was performed using human serum albumin (HSA) and bovine serum albumin (BSA) to confirm the specificity of the aptamer in the rGO-based aptasensor. HSA and BSA were treated with the same molarity of GHSA as used in the fluorescence sensing step. The results showed lower fluorescence intensities than GHSA (Figure 3).

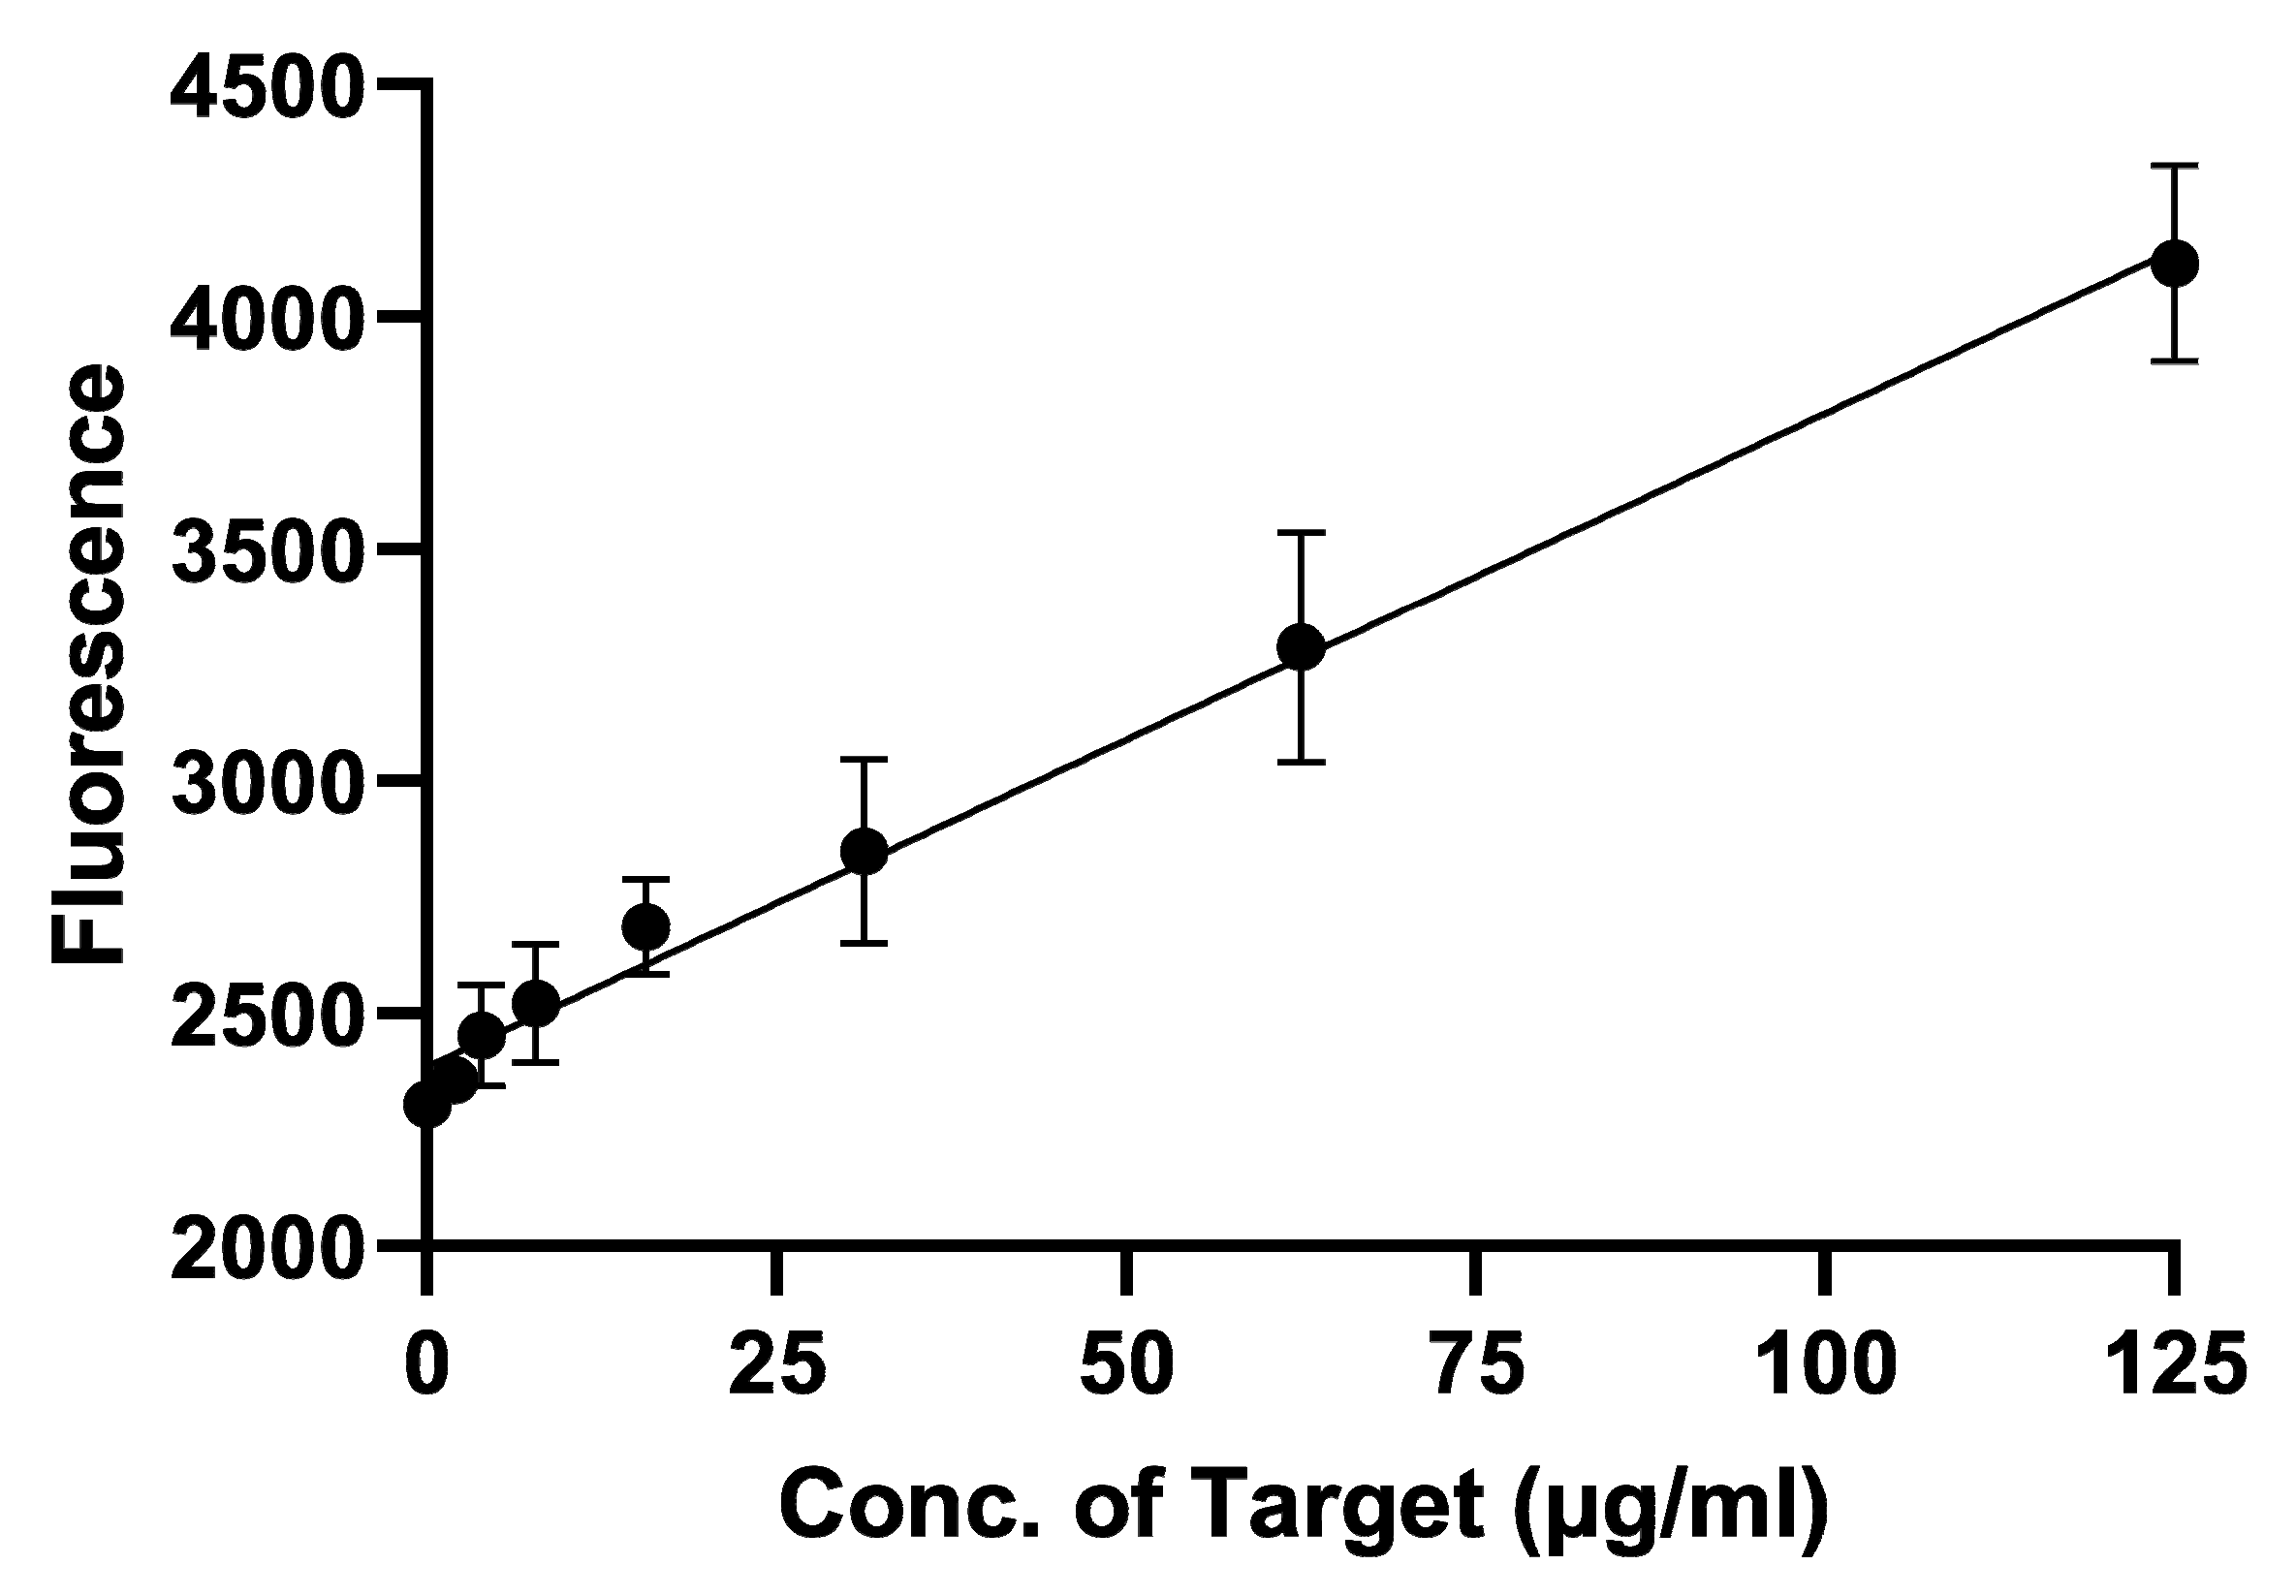
3.4. LOD Determination of GABAS-01

From the result of binding affinity and specificity test, we selected GABAS-01 for the aptasensor based on graphene-fluorescence system. The LOD value was determined using nearly the same process as described above. The fluorescence signal was measured to calculate the LOD; this depended on the concentration of GABAS-01. As the concentration of GABAS-01 increased, the fluorescence signal increased (Figure 4). A linear graph was obtained, and the LOD was determined to be 16.40 μg/mL, according to the recovery signal in the range of 0–125 μg/mL GHSA. The R-squared value was calculated to be 0.9901, indicating a quite accurate result.

3.5. GHSA Detection from Human Serum Solution

We confirmed from Figure 3 that GABAS-01 can bind with specificity. However, this result just shows when only one protein is in buffer but does not indicate when GHSA is mixed with other proteins. Therefore, we did a spike test in human serum solution diluted in 1x PBS in pH 7.4 (Table 3). The concentrations of the spiked solution were 15.625, 31.25, 62.5 and 125 μg/mL. The recovery rate was almost the same with binding buffer, and the maximum value of the relative standard deviation was approximately 2.7%, although the sample was a detergent solution (Table 3). Thus, detection of GHSA was achievable in samples using GABAS-01. This approach could provide the basis of a fluorescence based detection system.

4. Discussion

According to previous articles, after binding to the target, aptamer conformation is changed, which weakens the π-π stacking interactions between aptamers and rGO [45,46,47,48,49]. Our group confirmed this by analyzing the high fluorescence signal intensity of the aptamer (Figure 2, Figure 3 and Figure 4).
The Kd value of GABAS-01 indicates that GABAS-01 has a high binding affinity for GHSA. This value is much lower than those of the other aptamers for glycated human serum albumin, which displayed affinities in the micromolar range [38].
According to the results from the specificity test, we confirmed that GABAS-01 specifically bound to GHSA, but the others did not demonstrate specificity to the GHSA. The result of specificity test for GABAS-01 also showed the higher signal of GHSA than HSA, though the difference of each protein structure was very slight. Albumin converts into glycated albumin by glycation, which is a non-enzymatic spontaneous reaction where a reducing sugar is added to a free amino group (typically lysine or arginine) present within the proteins. This is also called the Maillard reaction [16,50,51,52]. The possible sites for the reaction are Lys-199, Lys-276, Lys-281, Lys-378, Lys-439, Lys-525, and Lys-545 in human serum albumin, and Lys-525 has higher participation than other lysine residues in the overall glycation processes [53,54,55]. BSA, with 583 amino acids, has high sequence homology to human serum albumin, with a 76% amino acid similarity [55,56]. However, the 24% difference creates a subtle structural difference. Based on previous research and our results, we estimate that GABAS-01 can distinguish the structural difference, and the main binding site of this aptamer would be near the site of the lysine residue.
GHSA is a diagnostic marker for diabetes mellitus. It is used to assess the changes of blood glucose levels over the last 1–2 weeks. It is able to confirm blood glucose changes over a more recent period than the glycated hemoglobin test. The ratio of GHSA is currently confirmed by an enzymatic method based on the colorimetric system. This system can be analyzed with the naked eye and shows better efficiency with the help of a photometer. However, this method usually has relatively low sensitivities (Table 4). Aptasensor systems based on fluorescence have also been developed [38]; this graphene methodology is almost the same as our system and the LOD of this aptamer system is 50 μg/mL. Our system’s LOD is 16.40 μg/mL and it is more sensitive. This discrepancy in LOD value is likely caused by differences in screening strategy. As mentioned above, target immobilizing methods may change the conformations of the targets and occupy a binding site of the targets. The platform to immobilize the target which like beads, plates, or etc., shield immobilized the site of the target from aptamer. This makes the blind site of target able to interact stronger with aptamer candidates or aptamer candidates which can only recognize the immobilized target. Therefore, sometimes, we can find aptamer candidates that can bind to target with high affinity and specificity in immobilized condition but cannot bind in other conditions. Therefore, the screening method of the aptamers are important. Our results show that GABAS-01 may be used as a novel, integral part of an aptasensor with a signal transduction system; this could lead to a simple, cost-effective, and time-saving system.

5. Conclusions

This article identifies a novel GHSA binding aptamer through library screening that can be used for detection of GHSA among similar proteins. In this paper, we show that differences in screening methods can affect the characters of the aptamers. An aptamer (i.e., GABAS-01) that has great selectivity against GHSA was discovered through five cycles of modified rGO-SELEX. The Kd value of GABAS-01 was 1.748 ± 0.227 nM, and the LOD was 16.40 μg/mL. Although the aptamers specific for GHSA have been reported, GABAS-01 has higher sensitivity than previously reported aptamers [38]. This result suggests the potential applications of GABAS-01 as an effective on-site detection probe of GHSA. These properties of GABAS-01 could lead to its use for detection of GHSA in diagnostic fields.

Author Contributions

Data curation, A.-R.K., Y.C. and S.-H.K.; Formal analysis, A.-R.K., Y.C. and S.-H.K.; Investigation, A.-R.K., Y.C., H.-S.M. and J.-H.K.; Methodology, A.-R.K. and Y.C.; Project administration, M.-Y.Y.; Supervision, M.-Y.Y.; Writing—original draft, A.-R.K. and Y.C. All authors have read and agreed to the published version of the manuscript.

Funding

This research was supported by the Basic Science Research Program of the National Research Foundation of Korea, which is funded by the Ministry of Science, ICT and Future Planning (2018R1A2A2A15023219).

Conflicts of Interest

The authors declare no conflict of interest.

References

  1. World Health Organization. Global Report on Diabetes; No. 9789241565257; World Health Organization: Geneva, Switzerland, 2016. [Google Scholar]
  2. Atkinson, M.A.; Eisenbarth, G.S.; Michels, A.W. Type 1 diabetes. Lancet 2014, 383, 69–82. [Google Scholar] [CrossRef] [Green Version]
  3. Abdullah, A.; Peeters, A.; De Courten, M.; Stoelwinder, J. The magnitude of association between overweight and obesity and the risk of diabetes: A meta-analysis of prospective cohort studies. Diabetes Res. Clin. Pract. 2010, 89, 309–319. [Google Scholar] [CrossRef]
  4. Kohei, K.A.K.U. Pathophysiology of type 2 diabetes and its treatment policy. Jpn. Med. Assoc. J. 2010, 53, 41–46. [Google Scholar]
  5. Brännmark, C.; Nyman, E.; Fagerholm, S.; Bergenholm, L.; Ekstrand, E.M.; Cedersund, G.; Strålfors, P. Insulin signaling in type 2 diabetes experimental and modeling analyses reveal mechanisms of insulin resistance in human adipocytes. J. Biol. Chem. 2013, 288, 9867–9880. [Google Scholar] [CrossRef] [Green Version]
  6. The Walter and Eliza Hall Institute of Medical Research. Insulin Receptor and Type 2 Diabetes. Available online: https://www.wehi.edu.au/wehi-tv/insulin-receptor-and-type-2-diabetes (accessed on 2 February 2015).
  7. World Health Organization. The Top 10 Causes of Death. Available online: https://www.who.int/en/news-room/fact-sheets/detail/the-top-10-causes-of-death (accessed on 24 May 2018).
  8. International Diabetes Federation. Global diabetes Data Report 2010–2045. Available online: https://diabetesatlas.org/data/en/world/ (accessed on 25 November 2019).
  9. Papatheodorou, K.; Banach, M.; Edmonds, M.; Papanas, N.; Papazoglou, D. Complications of diabetes. J. Diabetes Res. 2015, 2015. [Google Scholar] [CrossRef] [Green Version]
  10. Papatheodorou, K.; Banach, M.; Bekiari, E.; Rizzo, M.; Edmonds, M. Complications of diabetes 2017. J. Diabetes Res. 2018, 2018. [Google Scholar] [CrossRef] [PubMed]
  11. Constantino, M.I.; Molyneaux, L.; Limacher-Gisler, F.; Al-Saeed, A.; Luo, C.; Wu, T.; Twigg, S.M.; Yue, D.K.; Wong, J. Long-term complications and mortality in young-onset diabetes: Type 2 diabetes is more hazardous and lethal than type 1 diabetes. Diabetes Care 2013, 36, 3863–3869. [Google Scholar] [CrossRef] [PubMed] [Green Version]
  12. World Health Organization. Definition and Diagnosis of Diabetes Mellitus and Intermediate Hyperglycaemia: Report of a WHO/IDF Consultation. World Health Org. 2006. Available online: https://apps.who.int/iris/bitstream/handle/10665/43588/9241594934_eng.pdf (accessed on 15 May 2020).
  13. American Diabetes Association. Diagnosis and classification of diabetes mellitus. Diabetes Care 2006, 30, S42–S47. [Google Scholar]
  14. Sherwani, S.I.; Khan, H.A.; Ekhzaimy, A.; Masood, A.; Sakharkar, M.K. Significance of HbA1c test in diagnosis and prognosis of diabetic patients. Biomark. Insights 2016, 11, 95–104. [Google Scholar] [CrossRef]
  15. Punthakee, Z.; Goldenberg, R.; Katz, P. Definition, classification and diagnosis of diabetes, prediabetes and metabolic syndrome. Can. J. Diabetes 2018, 42, S10–S15. [Google Scholar] [CrossRef] [PubMed] [Green Version]
  16. Freitas, P.A.C.; Ehlert, L.R.; Camargo, J.L. Glycated albumin: A potential biomarker in diabetes. Arch. Endocrinol. Metab. 2017, 61, 296–304. [Google Scholar] [CrossRef] [PubMed] [Green Version]
  17. Inaba, M.; Okuno, S.; Kumeda, Y.; Yamada, S.; Imanishi, Y.; Tabata, T.; Okamura, M.; Okada, S.; Yamakawa, T.; Nishizawa, Y.; et al. Glycated albumin is a better glycemic indicator than glycated hemoglobin values in hemodialysis patients with diabetes: Effect of anemia and erythropoietin injection. J. Am. Soc. Nephrol. 2007, 18, 896–903. [Google Scholar] [CrossRef] [PubMed] [Green Version]
  18. Kim, W.J.; Park, C.Y. Review of the potential glycemic markers glycated albumin and 1, 5-anhydroglucitol. J. Korean Diabetes 2012, 13, 1–6. [Google Scholar] [CrossRef] [Green Version]
  19. Tuerk, C.; Gold, L. Systematic evolution of ligands by exponential enrichment: RNA ligands to bacteriophage T4 DNA polymerase. Science 1990, 249, 505–510. [Google Scholar] [CrossRef]
  20. Ellington, A.D.; Szostak, J.W. In vitro selection of RNA molecules that bind specific ligands. Nature 1990, 346, 818–822. [Google Scholar] [CrossRef]
  21. Huizenga, D.E.; Szostak, J.W. A DNA aptamer that binds adenosine and ATP. Biochemistry 1995, 34, 656–665. [Google Scholar] [CrossRef]
  22. Spiga, F.M.; Maietta, P.; Guiducci, C. More DNA–aptamers for small drugs: A capture–SELEX coupled with surface plasmon resonance and high-throughput sequencing. ACS Comb. Sci. 2015, 17, 326–333. [Google Scholar] [CrossRef] [Green Version]
  23. Bock, L.C.; Griffin, L.C.; Latham, J.A.; Vermaas, E.H.; Toole, J.J. Selection of single-stranded DNA molecules that bind and inhibit human thrombin. Nature 1992, 355, 564–566. [Google Scholar] [CrossRef]
  24. Mendonsa, S.D.; Bowser, M.T. In Vitro selection of high-affinity DNA ligands for human IgE using capillary electrophoresis. Anal. Chem. 2004, 76, 5387–5392. [Google Scholar] [CrossRef]
  25. Hicke, B.J.; Marion, C.; Chang, Y.F.; Gould, T.; Lynott, C.K.; Parma, D.; Schmidt, P.G.; Warren, S. Tenascin-C aptamers are generated using tumor cells and purified protein. J. Biol. Chem. 2001, 276, 48644–48654. [Google Scholar] [CrossRef] [Green Version]
  26. Kumar, P.K.R.; Machida, K.; Urvil, P.T.; Kakiuchi, N.; Vishnuvardhan, D.; Shimotohno, K.; Taira, K.; Nishikawa, S. Isolation of RNA aptamers specific to the NS3 protein of hepatitis C virus from a pool of completely random RNA. Virology 1997, 237, 270–282. [Google Scholar] [CrossRef] [Green Version]
  27. Hamula, C.L.; Zhang, H.; Guan, L.L.; Li, X.F.; Le, X.C. Selection of aptamers against live bacterial cells. Anal. Chem. 2008, 80, 7812–7819. [Google Scholar] [CrossRef]
  28. Saito, S.; Hirose, K.; Tsuchida, M.; Wakui, K.; Yoshimoto, K.; Nishiyama, Y.; Shibukawa, M. Rapid acquisition of high-affinity DNA aptamer motifs recognizing microbial cell surfaces using polymer-enhanced capillary transient isotachophoresis. ChemComm 2016, 52, 461–464. [Google Scholar] [CrossRef] [PubMed] [Green Version]
  29. Jayasena, S.D. Aptamers: An emerging class of molecules that rival antibodies in diagnostics. Clin. Chem. 1999, 45, 1628–1650. [Google Scholar] [CrossRef] [PubMed] [Green Version]
  30. Chen, A.; Yang, S. Replacing antibodies with aptamers in lateral flow immunoassay. Biosens. Bioelectron. 2015, 71, 230–242. [Google Scholar] [CrossRef] [PubMed]
  31. Zhou, W.; Huang, P.J.J.; Ding, J.; Liu, J. Aptamer-based biosensors for biomedical diagnostics. Analyst 2014, 139, 2627–2640. [Google Scholar] [CrossRef] [Green Version]
  32. Zhang, Y.; Lai, B.S.; Juhas, M. Recent advances in aptamer discovery and applications. Molecules 2019, 24, 941. [Google Scholar] [CrossRef] [PubMed] [Green Version]
  33. McConnell, E.M.; Nguyen, J.; Li, Y. Aptamer-Based Biosensors for Environmental Monitoring. Front. Chem. 2020, 8, 434. [Google Scholar] [CrossRef]
  34. Drolet, D.W.; Jenison, R.D.; Smith, D.E.; Pratt, D.; Hicke, B.J. A high throughput platform for systematic evolution of ligands by exponential enrichment (SELEX). Comb. Chem. High. Throughput Screen. 1999, 2, 271–278. [Google Scholar]
  35. Stoltenburg, R.; Reinemann, C.; Strehlitz, B. FluMag-SELEX as an advantageous method for DNA aptamer selection. Anal. Bioanal. Chem. 2005, 383, 83–91. [Google Scholar] [CrossRef]
  36. Park, J.W.; Tatavarty, R.; Kim, D.W.; Jung, H.T.; Gu, M.B. Immobilization-free screening of aptamers assisted by graphene oxide. ChemComm 2012, 48, 2071–2073. [Google Scholar] [CrossRef]
  37. Wu, M.; Kempaiah, R.; Huang, P.J.J.; Maheshwari, V.; Liu, J. Adsorption and desorption of DNA on graphene oxide studied by fluorescently labeled oligonucleotides. Langmuir 2011, 27, 2731–2738. [Google Scholar] [CrossRef] [Green Version]
  38. Apiwat, C.; Luksirikul, P.; Kankla, P.; Pongprayoon, P.; Treerattrakoon, K.; Paiboonsukwong, K.; Fucharoen, S.; Dharakul, T.; Japrung, D. Graphene based aptasensor for glycated albumin in diabetes mellitus diagnosis and monitoring. Bosens. Bioelectron. 2016, 82, 140–145. [Google Scholar] [CrossRef] [PubMed]
  39. Lu, C.H.; Li, J.; Lin, M.H.; Wang, Y.W.; Yang, H.H.; Chen, X.; Chen, G.N. Amplified aptamer-based assay through catalytic recycling of the analyte. Angew. Chem. Int. Ed. 2010, 122, 8632–8635. [Google Scholar] [CrossRef]
  40. He, S.; Song, B.; Li, D.; Zhu, C.; Qi, W.; Wen, Y.; Wang, L.; Song, S.; Fang, H.; Fan, C. A graphene nanoprobe for rapid, sensitive, and multicolor fluorescent DNA analysis. Adv. Funct. Mater. 2010, 20, 453–459. [Google Scholar] [CrossRef]
  41. Castro Neto, A.H.; Guinea, F.; Peres, N.M.R.; Novoselov, K.S.; Geim, A.K. The electronic properties of graphene. Rev. Mod. Phys. 2009, 81, 109–162. [Google Scholar] [CrossRef] [Green Version]
  42. Datta, D.; Sarkar, K.; Mukherjee, S.; Meshik, X.; Stroscio, M.A.; Dutta, M. Graphene oxide and DNA aptamer based sub-nanomolar potassium detecting optical nanosensor. Nanotechnology 2017, 28, 325502. [Google Scholar] [CrossRef]
  43. Darbandi, A.; Datta, D.; Patel, K.; Lin, G.; Stroscio, M.A.; Dutta, M. Molecular beacon anchored onto a graphene oxide substrate. Nanotechnology 2017, 28, 375501. [Google Scholar] [CrossRef]
  44. Swathi, R.S.; Sebastian, K.L. Resonance energy transfer from a dye molecule to graphene. J. Chem. Phys. 2008, 129, 054703. [Google Scholar] [CrossRef]
  45. Kim, A.R.; Ha, N.R.; Jung, I.P.; Kim, S.H.; Yoon, M.Y. Development of a ssDNA aptamer system with reduced graphene oxide (rGO) to detect nonylphenol ethoxylate in domestic detergent. J. Mol. Recognit. 2019, 32, e2746. [Google Scholar] [CrossRef] [PubMed]
  46. Liu, Z.; Liu, B.; Ding, J.; Liu, J. Fluorescent sensors using DNA-functionalized graphene oxide. Anal. Bioanal. Chem. 2014, 406, 6885–6902. [Google Scholar] [CrossRef] [PubMed]
  47. Chang, H.; Tang, L.; Wang, Y.; Jiang, J.; Scott, H.; Li, J. Graphene fluorescence resonance energy transfer aptasensor for the thrombin detection. Anal. Chem. 2010, 82, 2341–2346. [Google Scholar] [CrossRef] [PubMed]
  48. Li, M.; Zhou, X.; Guo, S.; Wu, N. Detection of lead (II) with a “turn-on” fluorescent biosensor based on energy transfer from CdSe/ZnS quantum dots to graphene oxide. Biosens. Bioelectron. 2013, 43, 69–74. [Google Scholar] [CrossRef] [PubMed]
  49. Raston, N.A.H.; Gu, M.B. Highly amplified detection of visceral adipose tissue-derived serpin (vaspin) using a cognate aptamer duo. Biosens. Bioelectron. 2015, 70, 261–267. [Google Scholar] [CrossRef] [Green Version]
  50. Anguizola, J.; Matsuda, R.; Barnaby, O.S.; Hoy, K.S.; Wa, C.; De Bolt, E. Glycation of human serum albumin. Clin. Chim. Acta 2013, 425, 64–76. [Google Scholar] [CrossRef] [Green Version]
  51. Danese, E.; Montagnana, M.; Nouvenne, A.; Lippi, G. Advantages and pitfalls of fructosamine and glycated albumin in the diagnosis and treatment of diabetes. J. Diabetes Sci. Technol. 2015, 9, 169–176. [Google Scholar] [CrossRef] [Green Version]
  52. Ueda, Y.; Matsumoto, H. Recent topics in chemical and clinical research on glycated albumin. J. Diabetes Sci. Technol. 2015, 9, 177–182. [Google Scholar] [CrossRef] [Green Version]
  53. Lapolla, A.; Fedele, D.; Reitano, R.; Aricò, N.C.; Seraglia, R.; Traldi, P.; Marotta, E. Enzymatic digestion and mass spectrometry in the study of advanced glycation end products/peptides. J. Am. Soc. Mass Spectrom. 2004, 15, 496–509. [Google Scholar] [CrossRef] [Green Version]
  54. Wa, C.; Cerny, R.L.; Clarke, W.A.; Hage, D.S. Characterization of glycation adducts on human serum albumin by matrix-assisted laser desorption/ionization time-of-flight mass spectrometry. Clin. Chim. Acta 2007, 385, 48–60. [Google Scholar] [CrossRef] [Green Version]
  55. Arasteh, A.; Farahi, S.; Habibi-Rezaei, M.; Moosavi-Movahedi, A.A. Glycated albumin: An overview of the In Vitro models of an In Vivo potential disease marker. J. Diabetes Metab. Disord. 2014, 13, 49. [Google Scholar] [CrossRef] [PubMed] [Green Version]
  56. Gelamo, E.; Tabak, M. Spectroscopic studies on the interaction of bovine (BSA) and human (HSA) serum albumins with ionic surfactants. Spectrochim. Acta Mol. Biomol. Spectrosc. 2000, 56, 2255–2271. [Google Scholar] [CrossRef]
  57. Kohzuma, T.; Yamamoto, T.; Uematsu, Y.; Shihabi, Z.K.; Freedman, B. Basic performance of an enzymatic method for glycated albumin and reference range determination. J. Diabetes Sci. Technol. 2011, 5, 1455–1462. [Google Scholar] [CrossRef] [PubMed] [Green Version]
  58. Testa, R.; Guerra, E.; Bonfigli, A.R.; Di Gaetano, N.; Santini, G.; Ceriotti, F. Analytical performances of an enzymatic assay for the measurement of glycated albumin. J. Appl. Lab. Med. AACC Publ. 2016, 1, 162–171. [Google Scholar] [CrossRef]
Publisher′s Note: MDPI stays neutral with regard to jurisdictional claims in published maps and institutional affiliations.
Figure 1. The secondary structures of candidate aptamers: (A) GABAS-01, (B) GABAS-02, and (C) GABAS-03.
Biosensors 10 00141 g001
Figure 2. Binding affinity test of aptamer candidates with fluorescence signals. The Kd value of (A) GABAS-01 is 1.748 ± 0.227 nM, (B) GABAS-02 and (C) GABAS-03 were not determined.
Biosensors 10 00141 g002
Figure 3. Specificity test of aptamer candidates with fluorescence signal. Albumins GHSA, HSA, and BSA were used to compare the signals: (A) GABAS-01, (B) GABAS-02, and (C) GABAS-03.
Biosensors 10 00141 g003
Figure 4. The detection limit of the rGO-GABAS-01 aptanano sensor system. A linear fluorescence response was observed in the range of 0–125 μg/mL GHSA. The limit of detection (LOD) was determined to be 16.40 μg/mL using the official formula from the IUPAC (LOD = 3 × SD/slope).
Biosensors 10 00141 g004
Table 1. Aptamer screening condition of each rounds with rGO-SELEX.
RoundssDNA (pmole)Binding ConditionBinding Time
(min)
Elution ConditionTarget Amount (μg)Elution Time
(min)
12001 × Binding buffer with
100 μg of rGO and
500 μg of albumin
601 × PBS50060
245
31.5 × PBS
430
52 × PBS
Table 2. Aptamer sequences after screening with rGO-SELEX.
NameSequenceFrequency
GABAS-01ATGCGGATCCCGCGCGCAGTGCAGGGAGCCGCTCCACGTACGTTGCGCGAAGCTTGCGC14
GABAS-02ATGCGGATCCCGCGCGCGGTGGCGAGGGGCCGACGGCGGCTGGGTGCGCGAAGCTTGCGC9
GABAS-03ATGCGGATCCCGCGCGGGTCTGAGGAGTGCGGCGGTGCCAGTGAGTGCGCGAAGCTTGCGC5
GABAS-04ATGCGGATCCCGCGCCGTGTTAGGCTAGATGTAGAGTTGGTCTGGTGCGCGAAGCTTGCGC4
GABAS-05ATGCGGATCCCGCGCGACCAACGGAAGCGCGGCACCACAACGGTGGCGCGAAGCTTGCGC4
GABAS-06ATGCGGATCCCGCGCCGAGTCAGTGCGAGGCGCTCCCCTGTCGGTGCGCGAAGCTTGCGC3
GABAS-07ATGCGGATCCCGCGCGACTGGACAGGTAATACGGCAGCGGCCGAGGCGCGAAGCTTGCGC2
GABAS-08ATGCGGATCCCGCGCGCAATAGGTAAGAATCAGGAGACTGCGTGGGCGCGAAGCTTGCGC2
GABAS-09ATGCGGATCCCGCGCTTCTCAAACGCCGGAATGGTTGTTAGTGTGGCGCGAAGCTTGCGC2
GABAS-10ATGCGGATCCCGCGCACCTGAAAGCCGCAATGCCAGTGGTCCGTGGCGCGAAGCTTGCGC1
GABAS-11ATGCGGATCCCGCGCCGACTACCTTATTTATCCGGGGGAATCCTTGCGCGAAGCTTGCGC1
GABAS-12ATGCGGATCCCGCGCGAACATGGAGATGATCACCTTGTGGACTATGCGCGAAGCTTGCGC1
GABAS-13ATGCGGATCCCGCGCGAGGTAGGTCCAGGATGAATACGTGGTCTGGCGCGAAGCTTGCGC1
GABAS-14ATGCGGATCCCGCGCGCACGATAATTTCCCTTCTCCTGCTGGTCAGCGCGAAGCTTGCGC1
Table 3. Detection of GHSA from buffer and human serum solution.
Detection MethodSpiked
(µg/mL)
Measured
(µg/mL)
Recovery
(%)
RSD
(%)
1 × PBS15.62515.811101.202.52
31.2531.535100.911.91
62.562.689100.301.64
125125.15100.121.14
Human serum solution
diluted by 1 × PBS
15.62516.879108.031.03
31.2533.502107.212.70
62.562.937100.701.33
125127.34101.871.90
Table 4. Detection methods for GHSA used in previous studies.
Detection MethodLODReference
Enzymatic assay-based colorimetric sensor0.47 mg/mL[57]
Enzymatic assay-based sensor0.36 mg/mL[58]
Graphene-based optical aptasensor50 μg/mL[38]
Graphene-based optical aptasensor16.40 μg/mLThis study

