N-Doped Modified Graphene/Fe2O3 Nanocomposites as High-Performance Anode Material for Sodium Ion Storage

Abstract
:
1. Introduction
2. Experimental Section
2.1. Synthesis of the Material
2.2. Structural Characterization of the Material
2.3. Electrochemical Measurements
3. Results and Discussion
4. Conclusions
Author Contributions
Funding
Conflicts of Interest
References
- Wang, L.; Wei, Z.; Mao, M.; Wang, H.; Li, Y.; Ma, J. Metal oxide/graphene composite anode materials for sodium-ion batteries. Energy Storage Mater. 2019, 16, 434–454. [Google Scholar] [CrossRef]
- Zhao, X.; Wang, H.E.; Yang, Y.; Neale, Z.G.; Massé, R.C.; Cao, J.; Cai, W.; Sui, J.; Cao, G. Reversible and fast Na-ion storage in MoO2/MoSe2 heterostructures for high energy-high power Na-ion capacitors. Energy Storage Mater. 2018, 12, 241–251. [Google Scholar] [CrossRef]
- Cheng, T.; Xu, J.; Tan, Z.; Ye, J.; Tao, Z.; Du, Z.; Wu, Y.; Wu, S.; Ji, H.; Yu, Y.; et al. A spray-freezing approach to reduced graphene oxide/MoS2 hybrids for superior energy storage. Energy Storage Mater. 2018, 10, 282–290. [Google Scholar] [CrossRef]
- Hong, S.Y.; Kim, Y.; Park, Y.; Choi, A.; Choi, N.S.; Lee, K.T. Charge carriers in rechargeable batteries: Na ions vs. Li ions. Energy Environ. Sci. 2013, 6, 2067–2081. [Google Scholar] [CrossRef]
- Kong, D.; Cheng, C.; Wang, Y.; Liu, B.; Huang, Z.; Yang, H.Y. Seed-assisted growth of α-Fe2O3 nanorod arrays on reduced graphene oxide: a superior anode for high-performance Li-ion and Na-ion batteries. J. Mater. Chem. A 2016, 4, 11800–11811. [Google Scholar] [CrossRef]
- Yang, H.; Xu, R.; Yao, Y.; Ye, S.; Zhou, X.; Yu, Y. Multicore–Shell Bi@N-doped Carbon Nanospheres for High Power Density and Long Cycle Life Sodium- and Potassium-Ion Anodes. Adv. Funct. Mater. 2019, 29, 1809195. [Google Scholar] [CrossRef]
- Meng, S.; Zhao, D.L.; Wu, L.L.; Ding, Z.W.; Cheng, X.W.; Hu, T. Fe2O3/nitrogen-doped graphene nanosheet nanocomposites as anode materials for sodium-ion batteries with enhanced electrochemical performance. J. Alloys Compd. 2018, 737, 130–135. [Google Scholar] [CrossRef]
- Yang, Q.; Bi, R.; Yung, K.; Pecht, M. Electrochemically reduced graphene oxides/nanostructured iron oxides as binder-free electrodes for supercapacitors. Electrochim. Acta 2017, 231, 125–134. [Google Scholar] [CrossRef]
- Wang, K.X.; Li, X.H.; Chen, J.S. Surface and interface engineering of electrode materials for lithium-ion batteries. Adv. Mater. 2015, 27, 527–545. [Google Scholar] [CrossRef]
- Valvo, M.; Lindgren, F.; Lafont, U.; Björefors, F.; Edström, K. Towards more sustainable negative electrodes in Na-ion batteries via nanostructured iron oxide. J. Power Sources 2014, 245, 967–978. [Google Scholar] [CrossRef]
- Cherian, C.T.; Sundaramurthy, J.; Kalaivani, M.; Ragupathy, P.; Kumar, P.S.; Thavasi, V.; Reddy, M.V.; Sow, C.H.; Mhaisalkar, S.G.; Ramakrishna, S.; et al. Electrospun α-Fe2O3 nanorods as a stable, high capacity anode material for Li-ion batteries. J. Mater. Chem. 2012, 22, 12198–12204. [Google Scholar] [CrossRef]
- Zhang, G.; Shi, Y.; Wang, H.; Jiang, L.; Yu, X.; Jing, S.; Xing, S.; Tsiakaras, P. A facile route to achieve ultrafine Fe2O3 nanorods anchored on graphene oxide for application in lithium-ion battery. J. Power Sources 2019, 416, 118–124. [Google Scholar] [CrossRef]
- Li, Y.; Huang, Y.; Zheng, Y.; Huang, R.; Yao, J. Facile and efficient synthesis of α-Fe2O3 nanocrystals by glucose-assisted thermal decomposition method and its application in lithium ion batteries. J. Power Sources 2019, 416, 62–71. [Google Scholar] [CrossRef]
- Sharifi, T.; Gracia-Espino, E.; Barzegar, H.R.; Jia, X.; Nitze, F.; Hu, G.; Nordblad, P.; Tai, C.W.; Wagberg, T. Formation of nitrogen-doped graphene nanoscrolls by adsorption of magnetic gamma-Fe2O3 nanoparticles. Nat. Commun. 2013, 4, 1–9. [Google Scholar] [CrossRef]
- Li, T.; Qin, A.; Yang, L.; Chen, J.; Wang, Q.F.; Zhang, D.H.; Yang, H.X. In-situ grown Fe2O3 single crystallites on reduced graphene oxide nanosheets as high performance conversion anode for sodium-ion batteries. ACS Appl. Mater. Interfaces 2017, 9, 19900–19907. [Google Scholar] [CrossRef]
- Zhang, N.; Han, X.; Liu, Y.; Hu, X.; Zhao, Q.; Chen, J. 3D Porous γ-Fe2O3@C Nanocomposite as High-Performance Anode Material of Na-Ion Batteries. Adv. Energy Mater. 2015, 5, 1401123. [Google Scholar] [CrossRef]
- Jian, Z.; Zhao, B.; Liu, P.; Li, F.; Zheng, M.; Chen, M.; Shi, Y.; Zhou, H. Fe2O3 nanocrystals anchored onto graphene nanosheets as the anode material for low-cost sodium-ion batteries. Chem. Commun. 2014, 50, 1215–1217. [Google Scholar] [CrossRef]
- Li, D.; Zhou, J.; Chen, X.; Song, H. Amorphous Fe2O3/Graphene Composite Nanosheets with Enhanced Electrochemical Performance for Sodium-Ion Battery. ACS Appl. Mater. Interfaces 2016, 8, 30899–30907. [Google Scholar] [CrossRef]
- Li, H.; Xu, L.; Sitinamaluwa, H.; Wasalathilake, K.; Yan, C. Coating Fe2O3 with graphene oxide for high-performance sodium-ion battery anode. Compos. Commun. 2016, 1, 48–53. [Google Scholar] [CrossRef] [Green Version]
- Liu, X.; Chen, T.; Chu, H.; Niu, L.; Sun, Z.; Pan, L.; Sun, C.Q. Fe2O3-reduced graphene oxide composites synthesized via microwave-assisted method for sodium ion batteries. Electrochim. Acta 2015, 166, 12–16. [Google Scholar] [CrossRef]
- Meng, J.; Suo, Y.; Li, J.; Zheng, G.; Liu, Y.; Zhang, J.; Zheng, X. Nitrogen-doped graphene aerogels as anode materials for lithium-ion battery: Assembly and electrochemical properties. Mater. Lett. 2015, 160, 392–396. [Google Scholar] [CrossRef]
- Shi, L.; Li, Y.; Zeng, F.; Ran, S.; Dong, C.; Leu, S.Y.; Boles, S.T.; Lam, K.H. In situ growth of amorphous Fe2O3 on 3D interconnected nitrogen-doped carbon nanofibers as high-performance anode materials for sodium-ion batteries. Chem. Eng. J. 2019, 356, 107–116. [Google Scholar] [CrossRef]
- Chen, Y.; Yuan, X.; Yang, C.; Lian, Y.; Razzaq, A.A.; Shah, R.; Guo, J.; Zhao, X.; Peng, Y.; Deng, Z. γ-Fe2O3 nanoparticles embedded in porous carbon fibers as binder-free anodes for high-performance lithium and sodium ion batteries. J. Alloys Compd. 2019, 777, 127–134. [Google Scholar] [CrossRef]
- Xu, D.; Chen, W.; Zheng, M.; Huang, X.; Fang, Y.; Yu, X. Nanoflakes assembled hydrangea-like Fe2O3@C@MoS2@C nanocomposite as high performance anode materials for lithium/sodium ion batteries. Electrochim. Acta 2018, 265, 419–429. [Google Scholar] [CrossRef]
- Guo, T.; Liao, H.; Ge, P.; Zhang, Y.; Tian, Y.; Hong, W.; Shi, Z.; Shao, C.; Hou, H.; Ji, X. Fe2O3 embedded in the nitrogen-doped carbon matrix with strong C–O–Fe oxygen-bridge bonds for enhanced sodium storages. Mater. Chem. Phys. 2018, 216, 58–63. [Google Scholar] [CrossRef]
- Wu, X.; Chen, W.; Key, J.; Wu, W. One-pot solvothermal synthesis of fern leaf-like α-Fe2O3@C/graphene from ferrocene with enhanced lithium and sodium storage properties. Powder Technol. 2018, 323, 424–432. [Google Scholar] [CrossRef]
- Lv, R.; Cui, T.; Jun, M.S.; Zhang, Q.; Cao, A.; Su, D.S.; Zhang, Z.; Yoon, S.H.; Miyawaki, J.; Mochida, I.; et al. Open-Ended, N-Doped Carbon Nanotube-Graphene Hybrid Nanostructures as High-Performance Catalyst Support. Adv. Funct. Mater. 2011, 21, 999–1006. [Google Scholar] [CrossRef]
- Zhang, J.; Zhao, H.; Li, J.; Jin, H.; Yu, X.; Lei, Y.; Wang, S. In Situ Encapsulation of Iron Complex Nanoparticles into Biomass-Derived Heteroatom-Enriched Carbon Nanotubes for High-Performance Supercapacitors. Adv. Energy Mater. 2019, 9, 1803221. [Google Scholar] [CrossRef]
- Meng, X.; Xu, Y.; Sun, X.; Xiong, L.; Wang, Q. Nitrogen-doped graphene assists Fe2O3 in enhancing electrochemical performance. J. Power Sources 2016, 326, 389–396. [Google Scholar] [CrossRef]
- Hao, D.; Xuefen, C.; Liangdong, Q.; Xiaohui, Z. Fabrication, Characterization and Properties of Superparamagnetic Reduced Graphene Oxide/Fe3O4 Hollow Sphere Nanocomposites. Rare Metal Mat. Eng. 2016, 45, 1669–1673. [Google Scholar] [CrossRef] [Green Version]
- Li, J.; Qin, W.; Xie, J.; Lin, R.; Wang, Z.; Pan, L.; Mai, W. Rational design of MoS2-reduced graphene oxide sponges as free-standing anodes for sodium-ion batteries. Chem. Eng. J. 2018, 332, 260–266. [Google Scholar] [CrossRef]
- Zhang, F.; Alhajji, E.; Lei, Y.; Kurra, N.; Alshareef, H.N. Highly Doped 3D Graphene Na-Ion Battery Anode by Laser Scribing Polyimide Films in Nitrogen Ambient. Adv. Energy Mater. 2018, 8, 1800353. [Google Scholar] [CrossRef]
- Zheng, C.; Yoshio, M.; Qi, L.; Wang, H. A 4 V-electrochemical capacitor using electrode and electrolyte materials free of metals. J. Power Sources 2014, 260, 19–26. [Google Scholar] [CrossRef]
- Wu, Z.S.; Ren, W.; Xu, L.; Li, F.; Cheng, H.M. Doped Graphene Sheets As Anode Materials with Superhigh Rate and Large Capacity for Lithium Ion Batteries. ACS Nano 2011, 5, 5463–5471. [Google Scholar] [CrossRef]
- Yu, Z.; Li, H.; Lu, J.; Zhang, X.; Liu, N.; Zhang, X. Hydrothermal synthesis of Fe2O3/graphene nanocomposite for selective determination of ascorbic acid in the presence of uric acid. Electrochim. Acta 2015, 158, 264–270. [Google Scholar] [CrossRef]
- Liu, Z.; Zhang, H.; Yang, Q.; Chen, Y. Graphene/V2O5 hybrid electrode for an asymmetric supercapacitor with high energy density in an organic electrolyte. Electrochim. Acta 2018, 287, 149–157. [Google Scholar] [CrossRef]
- Nair, A.K.; Elizabeth, I.; Gopukumar, S.; Thomas, S.; Kala, M.S.; Kalarikkal, N. Nitrogen doped graphene—Silver nanowire hybrids: An excellent anode material for lithium ion batteries. Appl. Surf. Sci. 2018, 428, 1119–1129. [Google Scholar] [CrossRef]
- Li, X.; Geng, D.; Zhang, Y.; Meng, X.; Li, R.; Sun, X. Superior cycle stability of nitrogen-doped graphene nanosheets as anodes for lithium ion batteries. Electrochem. Commun. 2011, 13, 822–825. [Google Scholar] [CrossRef]
- Li, Z.; Wu, G.; Deng, S.; Wang, S.; Wang, Y.; Zhou, J.; Liu, S.; Wu, W.; Wu, M. Combination of uniform SnO2 nanocrystals with nitrogen doped graphene for high-performance lithium-ion batteries anode. Chem. Eng. J. 2016, 283, 1435–1442. [Google Scholar] [CrossRef]
- Zhang, J.; Wang, D.W.; Lv, W.; Zhang, S.; Liang, Q.; Zheng, D.; Kang, F.; Yang, Q.H. Achieving superb sodium storage performance on carbon anodes through an ether-derived solid electrolyte interphase. Energy Environ. Sci. 2017, 10, 370–376. [Google Scholar] [CrossRef]
- Wang, S.; Li, L.; Shao, Y.; Zhang, L.; Li, Y.; Wu, Y.; Hao, X. Transition-Metal Oxynitride: A Facile Strategy for Improving Electrochemical Capacitor Storage. Adv. Mater. 2019, 31, 1806088. [Google Scholar] [CrossRef] [PubMed]
- Ren, H.; Yu, R.; Qi, J.; Zhang, L.; Jin, Q.; Wang, D. Hollow Multishelled Heterostructured Anatase/TiO2 (B) with Superior Rate Capability and Cycling Performance. Adv. Mater. 2019, 31, 1805754. [Google Scholar] [CrossRef] [PubMed]
- Sun, H.; Mei, L.; Liang, J.; Zhao, Z.; Lee, C.; Fei, H.; Ding, M.; Lau, J.; Li, M.; Wang, C.; et al. Three-dimensional holey-graphene/niobia composite architectures for ultrahigh-rate energy storage. Science 2017, 356, 599–604. [Google Scholar] [CrossRef] [PubMed] [Green Version]


| Electrode Materials | Synthesis Method | Voltage Range (vs. Na/Na+) | Electrolyte | Cycling Data | Rate Capability | Ref. |
|---|---|---|---|---|---|---|
| Fe2O3@GNS | nanocasting technology | 0.05–3 | 1M NaPF6 in EC:DEC=1:1 | 250/200th/0.5 A g−1 | 110/2 A g−1 | [17] |
| Fe2O3/r-GONRAs | hydrothermal | 0.01–3 | 1M NaPF6 in EC:DEC=1:1 with 5% FEC | ~332/300th/0.2 A g−1 | 92/1.6 C | [5] |
| Fe2O3@GNS | ice bath | 0.01–2.5 | 1M NaSO3CF3 in diglyme | 110/500th/2 A g−1 | 194 /2 A g−1 | [18] |
| Fe2O3/GO | freezing-dry | 0.01–2.5 | 1M NaClO4 in EC:DMC=1:1 | 420/100th/0.1 C | 90/10 C | [19] |
| Fe2O3-RGO | microwave assisted | 0.005–3 | 1M NaClO4 in EC:PC=1:1 | 289/50th/0.05 A g−1 | 32.8/2 A g−1 | [20] |
| Fe2O3/N-GNS | hydrothermal | 0.01–3 | 1M NaClO4 in EC:DEC=1:1 | 306/50th/0.05 A g−1 | 132/1 A g−1 | [7] |
| Fe2O3/rGO | solvothermal | 0.01–3 | 1M LiPF6 in EC:DEC=1:1 with 5.0% FEC | ~500/100th/0.05 A g−1 | 216/2 A g−1 | [15] |
| 3Dporousγ-Fe2O3@C | aerosol spray pyrolysis technique | 0.04–3 | 1M NaClO4 in EC:DEC=1:1 | 358/1400th/2 A g−1 | 317/8 A g−1 | [16] |
| a-Fe2O3/rGO | microwave hydrothermal | 0.05–3 | 1M NaClO4 or LiPF6 in EC:DEC=1:1 | 310/150th/0.1 A g−1 | 77/2 A g−1 | [21] |
| a-Fe2O3/pBC-N | in situ growth | 0.01–3 | 1 M NaPF6 in EC:PC=1:1 | 408/350/0.1 A g−1 | 183/3 A g−1 | [22] |
| γ-Fe2O3/PCF | - | 0.01–3 | 1M NaSO3CF3 in tetraglyme | 290/50th/0.1 C | 230/2 C | [23] |
| Fe2O3@C@MoS2@C | hydrothermal | 0.1–3 | 1M NaClO4 in EC:DEC=1:1 | 498/200/0.1 A g−1 | 150/2 A g−1 | [24] |
| Fe2O3@NC | - | 0.01–3 | 1mol/L NaClO4 in PC with 5% FEC | 155.3/200th/4 A g−1 | 167.8/4 A g−1 | [25] |
| α-Fe2O3@C/rGO | solvothermal | 0.01–3 | 1mol/L NaClO4 in PC with 2% FEC | - | - | [26] |
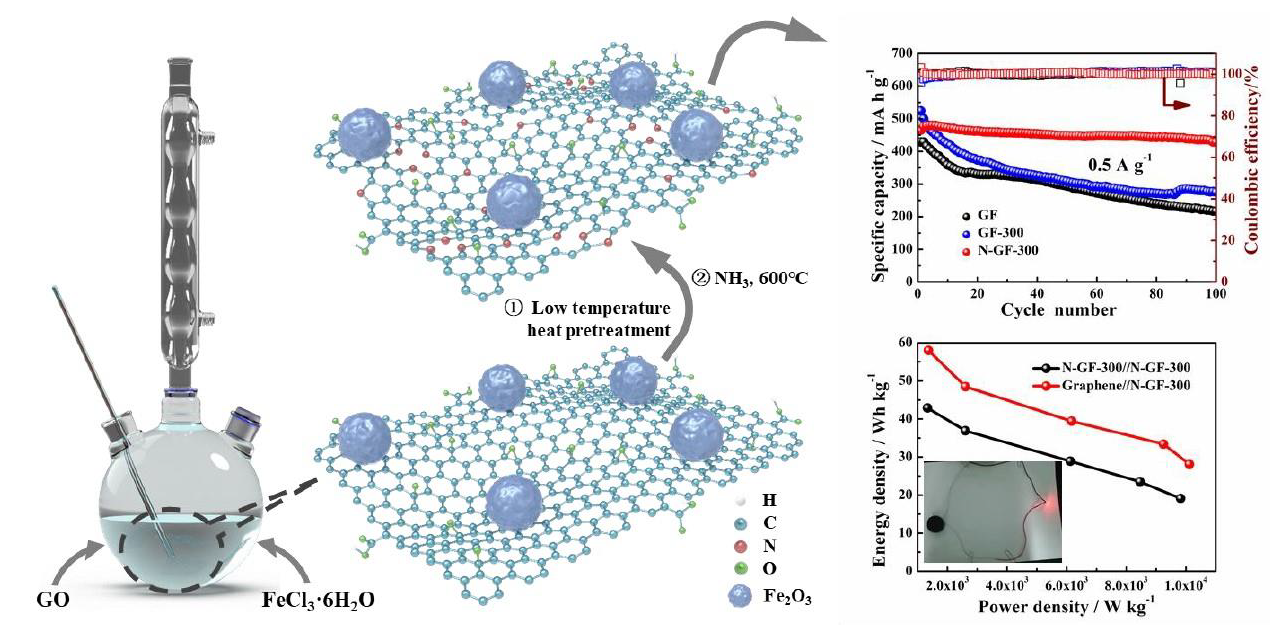
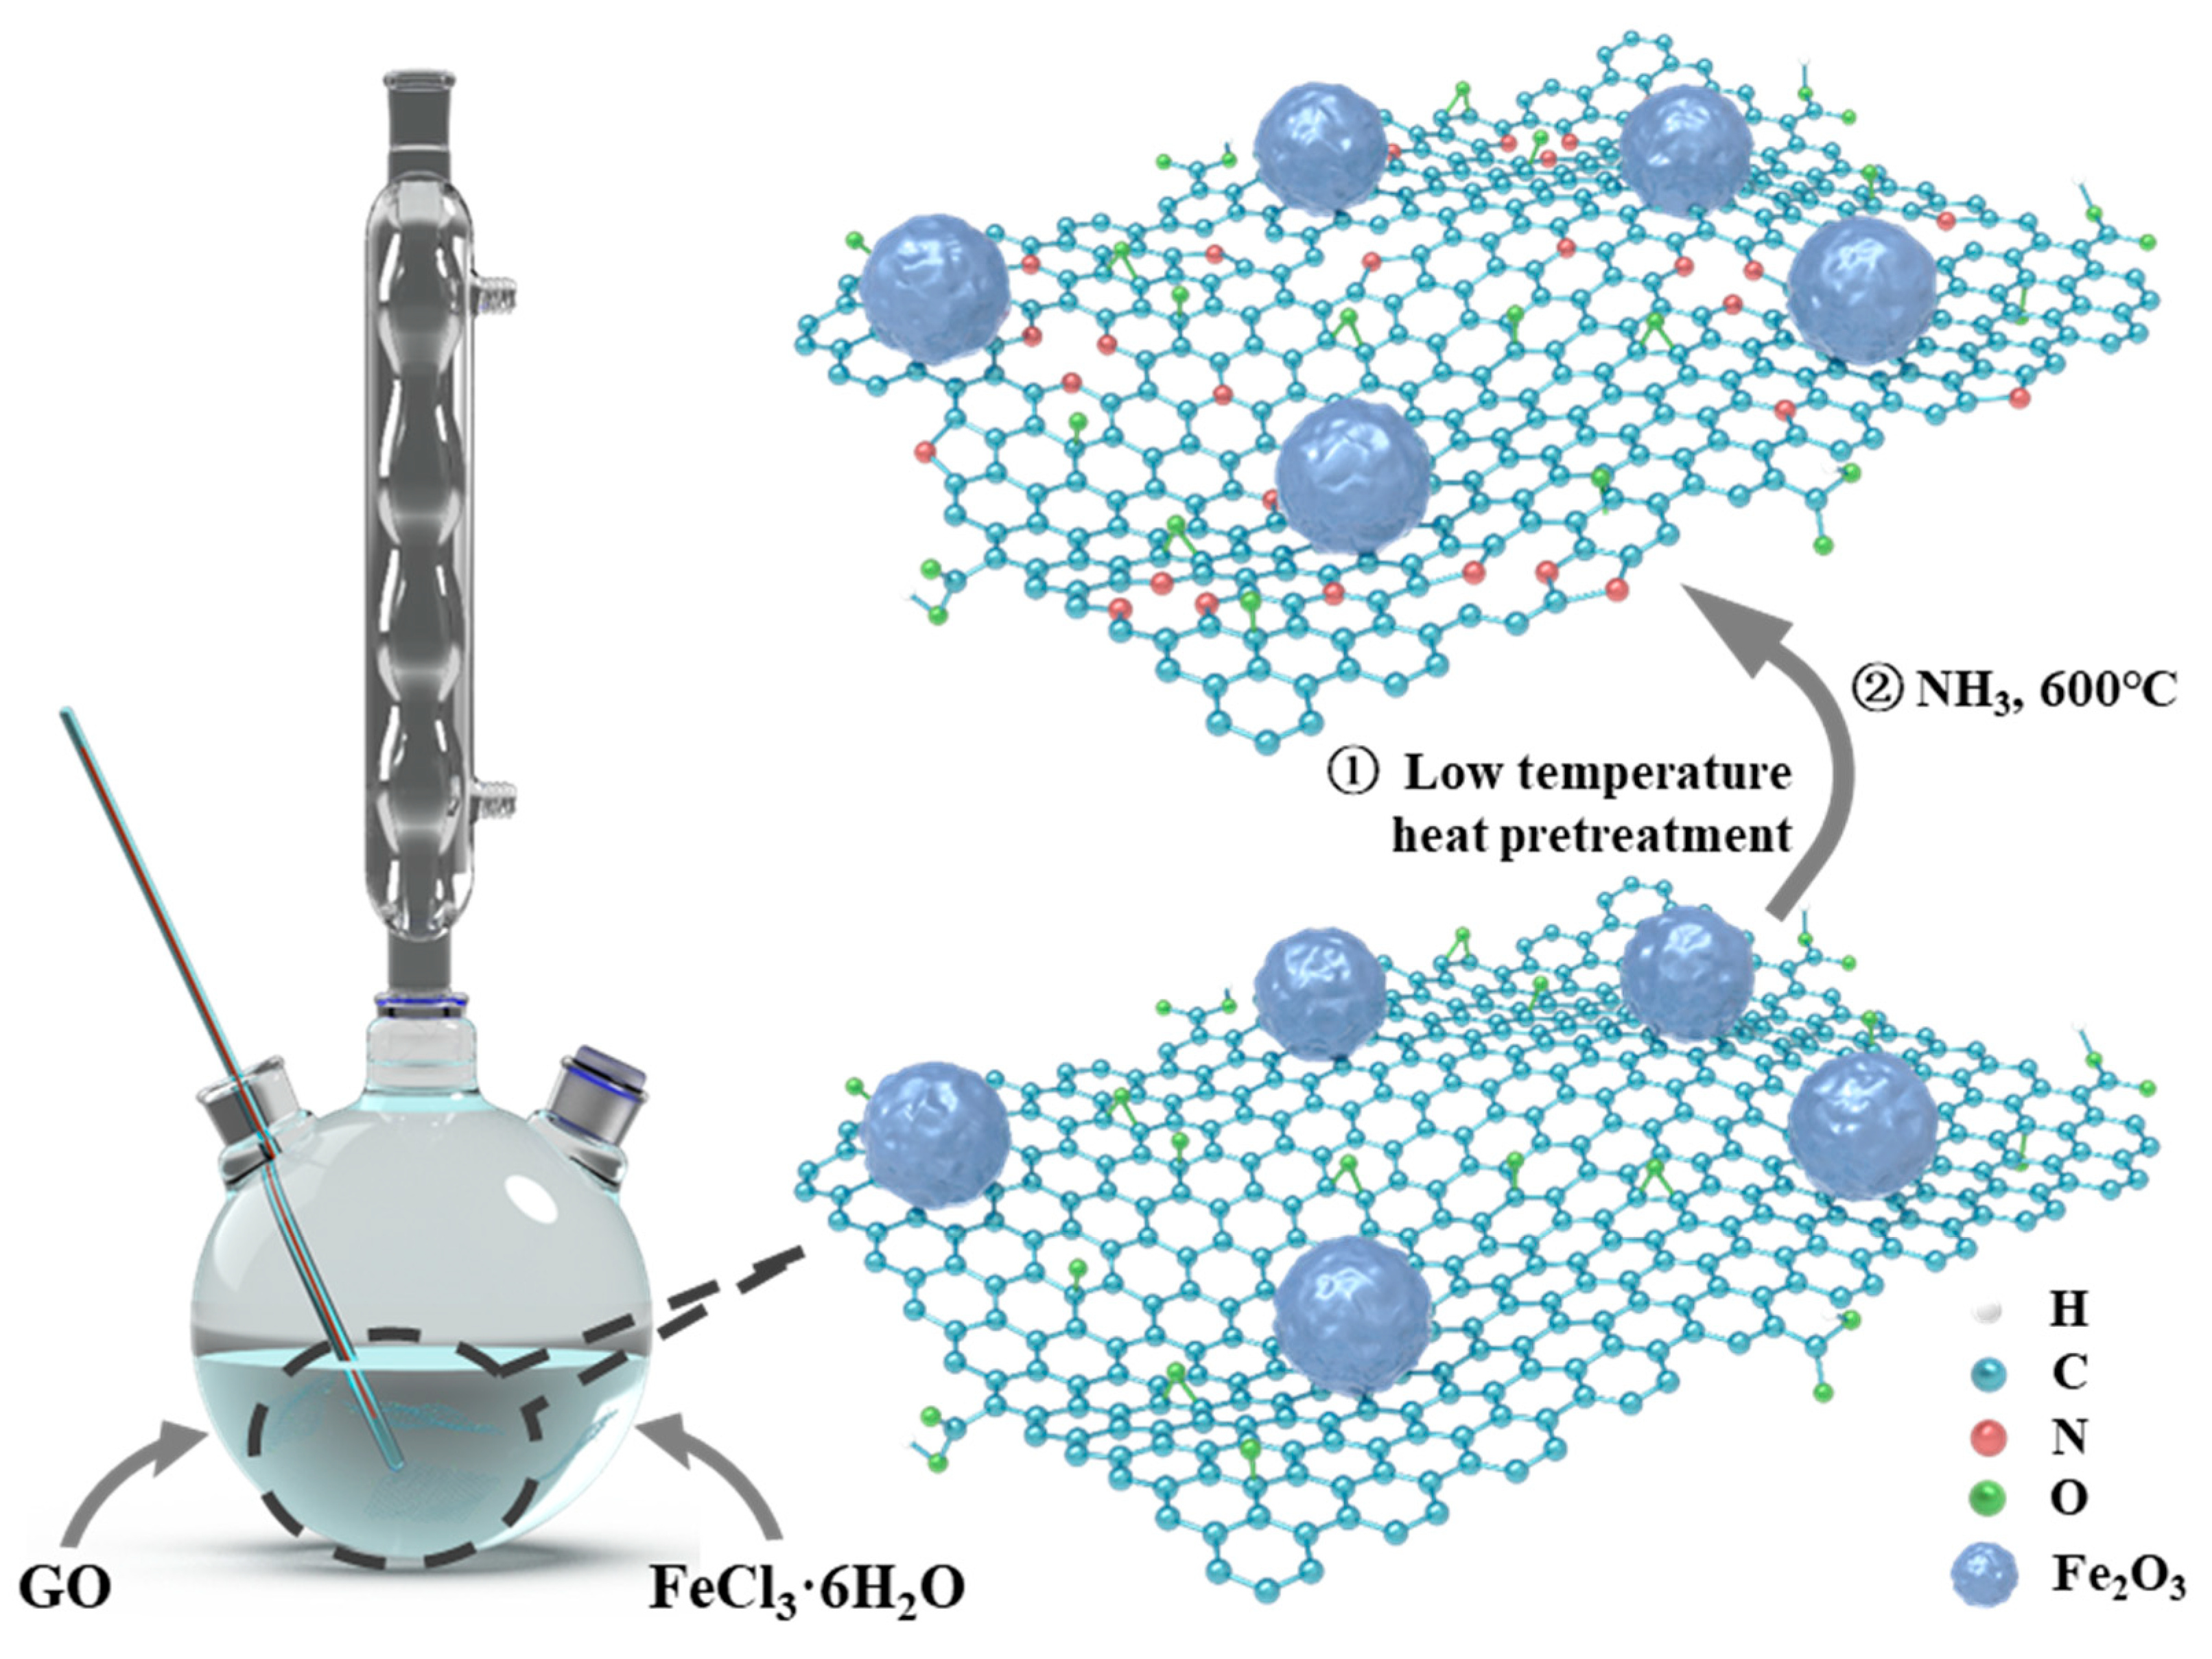
| N-GF-300 | water bath | 0.005–3 | 1M NaSO3CF3 in diglyme | 428.3/100th/0.5 A g−1 | 300/2 A g−1 | this work |
| Re/Ω | Rct/Ω | CPE1-T/Ω | CPE1-P/Ω | W1-R/Ω | W1-T/Ω | W1-P/Ω | |
|---|---|---|---|---|---|---|---|
| N-GF-300 | 12.71 | 18.24 | 0.0003998 | 0.6355 | 0.6355 | 0.3124 | 0.4290 |
| GF-300 | 12.22 | 40.17 | 0.001024 | 0.4620 | 9.437 | 0.2949 | 0.4201 |
| GF | 10.25 | 52.31 | 0.0009205 | 0.4283 | 12.83 | 0.4646 | 0.4391 |
| Impedance Parameter | Re (Ω) | Rct (Ω) | Zw (Y0) | C1 (F) | n | C (F, n = 1) |
|---|---|---|---|---|---|---|
| Graphene//N-GF-300 | 4.358 | 7.541 | 0.03987 | 0.04718 | 0.7537 | 0.000118 |
| N-GF-300//NGF-300 | 4.142 | 14.09 | 0.027 | 0.0123 | 0.7348 | 0.0001265 |
© 2019 by the authors. Licensee MDPI, Basel, Switzerland. This article is an open access article distributed under the terms and conditions of the Creative Commons Attribution (CC BY) license (http://creativecommons.org/licenses/by/4.0/).
Share and Cite
Chen, Y.; Guo, Z.; Jian, B.; Zheng, C.; Zhang, H. N-Doped Modified Graphene/Fe2O3 Nanocomposites as High-Performance Anode Material for Sodium Ion Storage. Nanomaterials 2019, 9, 1770. https://doi.org/10.3390/nano9121770
Chen Y, Guo Z, Jian B, Zheng C, Zhang H. N-Doped Modified Graphene/Fe2O3 Nanocomposites as High-Performance Anode Material for Sodium Ion Storage. Nanomaterials. 2019; 9(12):1770. https://doi.org/10.3390/nano9121770
Chicago/Turabian StyleChen, Yaowu, Zhu Guo, Bangquan Jian, Cheng Zheng, and Haiyan Zhang. 2019. "N-Doped Modified Graphene/Fe2O3 Nanocomposites as High-Performance Anode Material for Sodium Ion Storage" Nanomaterials 9, no. 12: 1770. https://doi.org/10.3390/nano9121770