

Enhanced Piezoelectricity and Thermal Stability of Electrostrain Performance in BiFeO3-Based Lead-Free Ceramics
 , ,
, ,
Abstract
:1. Introduction
2. Materials and Methods
3. Results and Discussion
4. Conclusions
Author Contributions
Funding
Data Availability Statement
Conflicts of Interest
References
- Jo, W.; Dittmer, R.; Acosta, M.; Zang, J.; Groh, C.; Sapper, E.; Wang, K.; Rödel, J. Giant electric–field–induced strains in lead–free ceramics for actuator applications–status and perspective. J. Electroceram. 2012, 29, 71–93. [Google Scholar] [CrossRef]
- Saito, Y.; Takao, H.; Tani, T.; Nonoyama, T.; Takatori, K.; Homma, T.; Nagaya, T.; Nakamura, M. Lead–free piezoceramics. Nature 2004, 432, 84–87. [Google Scholar] [CrossRef]
- Hao, J.G.; Li, W.; Zhai, J.W.; Chen, H. Progress in high–strain perovskite piezoelectric ceramics. Mater. Sci. Eng. R 2019, 135, 1–57. [Google Scholar] [CrossRef]
- Chen, C.; Wang, Y.; Li, Z.Y.; Liu, C.; Gong, W.; Tan, Q.; Han, B.; Yao, F.Z.; Wang, K. Evolution of electromechanical properties in Fe–doped (Pb, Sr)(Zr, Ti)O3 piezoceramics. J. Adv. Ceram. 2021, 10, 587–595. [Google Scholar] [CrossRef]
- Li, Z.; Thong, H.C.; Zhang, Y.F.; Xu, Z.; Zhou, Z.; Liu, Y.X.; Cheng, Y.Y.S.; Wang, S.H.; Zhao, C.L.; Chen, F.; et al. Defect engineering in lead zirconate titanate ferroelectric ceramic for enhanced electromechanical transducer efficiency. Adv. Funct. Mater. 2021, 31, 2005012. [Google Scholar] [CrossRef]
- Yin, J.; Liu, G.; Zhao, C.L.; Huang, Y.L.; Li, Z.; Zhang, X.M.; Wang, K.; Wu, J.G. Perovskite Na0.5Bi0.5TiO3: A potential family of peculiar lead–free electrostrictors. J. Mater. Chem. A 2019, 7, 13658. [Google Scholar] [CrossRef]
- Zhou, X.F.; Xue, G.L.; Luo, H.; Bowen, C.R.; Zhang, D. Phase structure and properties of sodium bismuth titanate lead–free piezoelectric ceramics. Prog. Mater. Sci. 2021, 122, 100836. [Google Scholar] [CrossRef]
- Sun, M.Z.; Li, P.; Du, J.; Han, W.F.; Hao, J.G.; Zhao, K.Y.; Zeng, H.R.; Li, W. Electric field–induced photoluminescence quenching in Pr–doped BNT ceramics across the MPB region. J. Mater. 2022, 8, 288–294. [Google Scholar] [CrossRef]
- Tang, Y.C.; Yin, Y.; Song, A.Z.; Liu, H.; Zhang, R.; Zhong, S.J.; Li, H.Z.; Zhang, B.P. Boosting the high performance of BiFeO3–BaTiO3 lead–free piezoelectric ceramics: One–step preparation and reaction mechanisms. ACS Appl. Mater. Interfaces 2022, 14, 30991–30999. [Google Scholar] [CrossRef]
- Peng, X.Y.; Tang, Y.C.; Zhang, B.P.; Zhu, L.F.; Xun, B.W.; Yu, J.R. High Curie temperature BiFeO3–BaTiO3 lead–free piezoelectric ceramics: Ga3+ doping and enhanced insulation properties. J. Appl. Phys. 2021, 130, 144104. [Google Scholar] [CrossRef]
- Ryu, G.H.; Hussain, A.; Lee, M.H.; Malik, R.A.; Song, T.K.; Kim, W.J.; Kim, M.H. Lead–free high performance Bi(Zn0.5Ti0.5)O3–modified BiFeO3–BaTiO3 piezoceramics. J. Eur. Ceram. Soc. 2018, 38, 4414–4421. [Google Scholar] [CrossRef]
- Li, J.F.; Wang, K.; Zhu, F.Y.; Cheng, L.Q.; Yao, F.Z. (K, Na)NbO3–based lead–free piezoceramics: Fundamental aspects, processing technologies, and remaining challenges. J. Am. Ceram. Soc. 2013, 96, 3677–3696. [Google Scholar] [CrossRef]
- Xu, K.; Li, J.; Lv, X.; Wu, J.G.; Zhang, X.X.; Xiao, D.Q.; Zhu, J.G. Superior piezoelectric properties in potassium–sodium niobate lead–free ceramics. Adv. Mater. 2016, 28, 8519–8523. [Google Scholar] [CrossRef] [PubMed]
- Liu, X.M.; Tan, X.L. Giant strains in non–textured (Bi1/2Na1/2)TiO3–based lead–free ceramics. Adv. Mater. 2016, 28, 574–578. [Google Scholar] [CrossRef] [Green Version]
- Zheng, T.; Yu, Y.G.; Lei, H.B.; Li, F.; Zhang, S.J.; Zhu, J.G.; Wu, J.G. Compositionally graded KNN–based multilayer composite with excellent piezoelectric temperature stability. Adv. Mater. 2022, 34, 2109175. [Google Scholar] [CrossRef] [PubMed]
- Song, A.Z.; Liu, Y.X.; Feng, T.Y.; Li, H.T.; Zhang, Y.Y.; Wang, X.P.; Liu, L.S.; Zhang, B.P.; Li, J.F. Simultaneous enhancement of piezoelectricity and temperature stability in KNN–based lead–free ceramics via layered distribution of dopants. Adv. Funct. Mater. 2022, 34, 2204385. [Google Scholar] [CrossRef]
- Liu, X.; Zhai, J.W.; Shen, B. Novel bismuth ferrite–based lead–free incipient piezoceramics with high electromechanical response. J. Mater. Chem. C 2019, 7, 5122–5130. [Google Scholar] [CrossRef]
- Lebeugle, D.; Colson, D.; Forget, A.; Viret, M.; Bonville, P.; Marucco, J.F.; Fusil, S. Room–temperature coexistence of large electric polarization and magnetic order in BiFeO3 single crystals. Phys. Rev. B 2007, 76, 024116. [Google Scholar] [CrossRef] [Green Version]
- Neaton, J.B.; Ederer, C.; Waghmare, U.V.; Spaldin, N.A.; Rabe, K.M. First–principles study of spontaneous polarization in multiferroic BiFeO3. Phys. Rev. B 2015, 71, 014113. [Google Scholar] [CrossRef] [Green Version]
- Xun, B.W.; Song, A.Z.; Yu, J.R.; Yin, Y.; Li, J.F.; Zhang, B.P. Lead–free BiFeO3–BaTiO3 ceramics with high curie temperature: Fine compositional tuning across the phase boundary for high piezoelectric charge and strain coefficients. ACS Appl. Mater. Interfaces 2021, 13, 4192–4202. [Google Scholar] [CrossRef]
- Zhao, H.Y.; Hou, Y.D.; Yu, X.L.; Zheng, M.P.; Zhu, M.K. Construction of high Tc BiScO3–BiFeO3–PbTiO3 and its enhanced piezoelectric properties by sintering in oxygen atmosphere. J. Appl. Phys. 2018, 124, 194103. [Google Scholar] [CrossRef]
- Zheng, T.; Zhao, C.L.; Wu, J.G.; Wang, K.; Li, J.F. Large strain of lead–free bismuth ferrite ternary ceramics at elevated temperature. Scr. Mater. 2018, 155, 11–15. [Google Scholar] [CrossRef]
- Habib, M.; Akram, F.; Ahmad, P.; Kebaili, I.; Rahman, A.; Din, I.U.; Iqbal, M.J.; Zeb, A.; Khandaker, M.U.; Karoui, A.; et al. Ultrahigh piezoelectric strain in lead–free BiFeO3–BaTiO3 ceramics at elevated temperature. J. Alloys Compd. 2022, 919, 165744. [Google Scholar] [CrossRef]
- Li, F.; Jin, L.; Xu, Z.; Zhang, S.J. Electrostrictive effect in ferroelectrics: An alternative approach to improve piezoelectricity. Appl. Phys. Rev. 2014, 1, 011103. [Google Scholar] [CrossRef] [Green Version]
- Wang, L.; Liang, R.H.; Zhou, Z.Y.; Dong, X.L. Thermally stable electrostrain in BiFeO3–BaTiO3–based high temperature lead-free piezoceramics. Appl. Phys. Lett. 2019, 115, 082902. [Google Scholar] [CrossRef]
- Li, F.; Wu, S.H.; Li, T.Y.; Wang, C.C.; Zhai, J.W. Normal–relaxor ferroelectric phase transition induced morphotropic phase boundary accompanied by enhanced piezoelectric and electrostrain properties in strontium modulated Bi0.5K0.5TiO3 lead–free ceramics. J. Eur. Ceram. Soc. 2020, 40, 3918–3927. [Google Scholar] [CrossRef]
- Shi, H.W.; Li, F.; Liu, W.; Liang, C.; Ji, X.L.; Long, M.S.; Gong, W.P.; Wang, C.C.; Shan, L. Composition dependent phase structure, dielectric and electrostrain properties in (Sr0.7Bi0.2□0.1)TiO3–PbTiO3–Bi(Mg0.5Ti0.5)O3 systems. J. Phys. D Appl. Phys. 2022, 55, 185301. [Google Scholar] [CrossRef]
- Komine, S.; Iguchi, E. Phase transitions and the weak relaxor ferroelectric phase in Ba7/8(La0.5Na0.5)1/8TiO3. J. Phys. Condens. Matter 2002, 14, 8445. [Google Scholar] [CrossRef]
- Wu, Y.; Bian, J.J.; Zhao, C.; Luo, S.J. Improvement of dielectric loss of Ba0.75Sr0.25TiO3 tunable material by La0.5Na0.5TiO3 addition. J. Mater. Sci. Mater. Electron. 2015, 26, 90–97. [Google Scholar] [CrossRef]
- Murakami, S.K.; Wang, D.W.; Mostaed, A.; Khesro, A.; Feteira, A.; Sinclair, D.C.; Fan, Z.M.; Tan, X.L.; Reaney, I.M. High strain 0.4%Bi(Mg2/3Nb1/3)O3–BaTiO3–BiFeO3 lead–free piezoelectric ceramics and multilayers. J. Am. Ceram. Soc. 2018, 101, 5428–5442. [Google Scholar] [CrossRef]
- Wang, D.W.; Fan, Z.M.; Li, W.B.; Zhou, D.; Feteira, A.; Wang, G.; Murakami, S.; Sun, S.; Zhao, Q.L.; Tan, X.L.; et al. High energy storage density and large strain in Bi(Zn2/3Nb1/3)O3–doped BiFeO3–BaTiO3 ceramics. ACS Appl. Energ. Mater. 2018, 1, 4403–4412. [Google Scholar] [CrossRef]
- Shannon, R.D. Revised effective ionic radii and systematic studies of interatomic distances in halides and chalcogenides. Acta Crystallogr. 1976, 32, 751–767. [Google Scholar]
- Guo, J.J.; Zhu, M.K.; Li, L.; Qing, T.H.; Wang, C.; Liu, L.Y.; Zheng, M.P.; Hou, Y.D. Normal–relaxor ferroelectric modulation of A–site complex perovskite ferroelectric (K1/2Bi1/2)TiO3 by post–annealing. J. Appl. Phys. 2017, 121, 014101. [Google Scholar]
- Aksel, E.; Forrester, J.S.; Kowalski, B.; Deluca, M.; Damjanovic, D.; Jones, J.L. Structure and properties of Fe–modified Na0.5Bi0.5TiO3 at ambient and elevated temperature. Phys. Rev. B 2012, 85, 024121. [Google Scholar] [CrossRef] [Green Version]
- Li, F.; Zhai, J.W.; Shen, B.; Liu, X.; Yang, K.; Zhang, Y.; Li, P.; Liu, B.H.; Zeng, H.R. Influence of structural evolution on energy storage properties in Bi0.5Na0.5TiO3–SrTiO3–NaNbO3 lead–free ferroelectric ceramics. J. Appl. Phys. 2017, 121, 054103. [Google Scholar] [CrossRef]
- Wang, L.; Liang, R.H.; Zhou, Z.Y.; Dong, X.L. High electrostrain with high Curie temperature in BiFeO3–BaTiO3–based ceramics. Scr. Mater. 2019, 164, 62–65. [Google Scholar] [CrossRef]
- Wang, C.C.; Lei, C.M.; Wang, G.J.; Sun, X.H.; Li, T.; Huang, S.G.; Wang, H.; Li, Y.D. Oxygen–vacancy–related dielectric relaxations in SrTiO3 at high temperatures. J. Appl. Phys. 2013, 113, 094103. [Google Scholar] [CrossRef]
- Liu, W.; Li, F.; Long, M.S.; Zhai, J.W.; Wang, C.C.; Shan, L. Defect engineering boosts ferroelectricity in Pb0.9Ba0.1ZrO3 ceramic. J. Eur. Ceram. Soc. 2022, 42, 6295–6300. [Google Scholar] [CrossRef]
- Viehland, D.; Jang, S.J.; Cross, L.E.; Wuttig, M. Freezing of the polarization fluctuations in lead magnesium niobate relaxors. J. Appl. Phys. 1990, 68, 2916–2921. [Google Scholar] [CrossRef]
- Cross, L.E. Relaxor ferroelectrics: An overview. Ferroelectrics 1994, 151, 305–320. [Google Scholar] [CrossRef]
- Chen, W.; Yao, X.; Wei, X.Y. Tunability and ferroelectric relaxor properties of bismuth strontium titanate ceramics. Appl. Phys. Lett. 2007, 90, 182902. [Google Scholar] [CrossRef] [Green Version]
- Uchino, K.; Nomura, S. Critical exponents of the dielectric constants in diffused–phase–transition crystals. Ferroelectrics 1982, 44, 55–61. [Google Scholar] [CrossRef]
- Yu, Z.Z.; Wang, Z.G.; Shu, S.W.; Tian, T.F.; Huang, W.B.; Li, C.C.; Ke, S.M.; Shu, L.L. Local structural heterogeneity induced large flexoelectricity in Sm–doped PMN–PT ceramics. J. Appl. Phys. 2021, 129, 174103. [Google Scholar] [CrossRef]
- Li, F.; Zhou, M.X.; Zhai, J.W.; Shen, B.; Zeng, H.R. Novel barium titanate based ferroelectric relaxor ceramics with superior charge–discharge performance. J. Eur. Ceram. Soc. 2018, 14, 4646–4652. [Google Scholar] [CrossRef]
- Chen, P.Y.; Chou, C.C.; Tseng, T.Y.; Chen, H. Correlation of microstructures and conductivities of ferroelectric ceramics using complex impedance spectroscopy. Jpn. J. Appl. Phys. 2010, 49, 061505. [Google Scholar] [CrossRef] [Green Version]
- Tong, B.B.; Lin, J.Y.; Lin, C.H.; Chen, J.G.; Zou, X.L.; Cheng, J.R. Enhanced transduction coefficient and thermal stability of 0.75BiFeO3–0.25BaTiO3 ceramics for high temperature piezoelectric energy harvesters applications. Ceram. Int. 2022, 48, 16885–16891. [Google Scholar] [CrossRef]
- Li, Y.; Zheng, T.; Li, B.; Wu, J.G. Relaxation degree and defect dipoles-controlled resistivity and leakage current in BF–BT-based ceramics. J. Am. Ceram. Soc. 2023, 106, 2393–2406. [Google Scholar] [CrossRef]
- Li, G.H.; Shi, C.; Zhu, K.; Ge, G.L.; Yan, F.; Lin, J.F.; Shi, Y.J.; Shen, B.; Zhai, J.W. Achieving synergistic electromechanical and electrocaloric responses by local structural evolution in lead–free BNT–based relaxor ferroelectrics. Chem. Eng. J. 2022, 431, 133386. [Google Scholar] [CrossRef]
- Yoon, S.; Liu, H.L.; Schollerer, G.; Cooper, S.L.; Han, P.D.; Payne, D.A.; Cheong, S.W.; Fisk, Z. Raman and optical spectroscopic studies of small–to–large polaron crossover in the perovskite manganese oxides. Phys. Rev. B 1998, 58, 5. [Google Scholar] [CrossRef]
- Ji, X.L.; Li, F.; Long, M.S.; Wang, C.C.; Shan, L. Excellent temperature stability of energy storage performance by weak dipolar interaction strategy. Appl. Phys. Lett. 2022, 121, 023902. [Google Scholar] [CrossRef]
- Zhu, L.F.; Liu, Q.; Zhang, B.P.; Cen, Z.Y.; Wang, K.; Li, J.J.; Bai, Y.; Wang, X.H.; Li, J.F. Temperature independence of piezoelectric properties for high–performance BiFeO3–BaTiO3 lead–free piezoelectric ceramics up to 300 °C. RSC Adv. 2018, 8, 35794. [Google Scholar] [CrossRef] [PubMed] [Green Version]
- Wei, J.X.; Fu, D.Y.; Cheng, J.R.; Chen, J.G. Temperature dependence of the dielectric and piezoelectric properties of xBiFeO3–(1–x)BaTiO3 ceramics near the morphotropic phase boundary. J. Mater. Sci. 2017, 52, 10726–10737. [Google Scholar] [CrossRef]
- Wang, D.W.; Khesro, A.; Murakami, S.; Feteira, A.; Zhao, Q.L.; Reaney, I.M. Temperature dependent, large electromechanical strain in Nd–doped BiFeO3–BaTiO3 lead–free ceramics. J. Eur. Ceram. Soc. 2017, 37, 1857–1860. [Google Scholar] [CrossRef] [Green Version]
- Zhang, S.T.; Kounga, A.B.; Aulbach, E.; Jo, W.; Granzow, T.; Ehrenberg, H.; Rödel, J. Lead–free piezoceramics with giant strain in the system Bi0.5Na0.5TiO3–BaTiO3–K0.5Na0.5NbO3. II. Temperature dependent properties. J. Appl. Phys. 2008, 103, 034108. [Google Scholar] [CrossRef] [Green Version]
- Wang, R.P.; Wang, K.; Yao, F.Z.; Li, J.F.; Schader, F.H.; Webber, K.G.; Jo, W.; Rödel, J. Temperature stability of lead–free niobate piezoceramics with engineered morphotropic phase boundary. J. Am. Ceram. Soc. 2015, 98, 2177–2182. [Google Scholar] [CrossRef]
- Jiang, X.J.; Dietz, C.; Liu, N.; Rojas, V.; Stark, R.W. Ferroelectric domain evolution in a Ba(Zr0.2Ti0.8)O3–0.5(Ba0.7Ca0.3)TiO3 piezoceramic studied using piezoresponse force microscopy. Appl. Phys. Lett. 2021, 118, 262902. [Google Scholar] [CrossRef]
- Zeng, F.F.; Zhou, C.; Zhang, C.; Jiang, L.; Zhang, J.J.; Guo, H.T.; Chen, Y.X.; Lv, W.Z.; Cai, W.; Zhang, G.Z.; et al. Effects of Hf4+ substitute on the enhanced electrostrain properties of 0.7BiFeO3–0.3BaTiO3–based lead–free piezoelectric ceramics. Ceram. Int. 2022, 48, 10539–10546. [Google Scholar] [CrossRef]


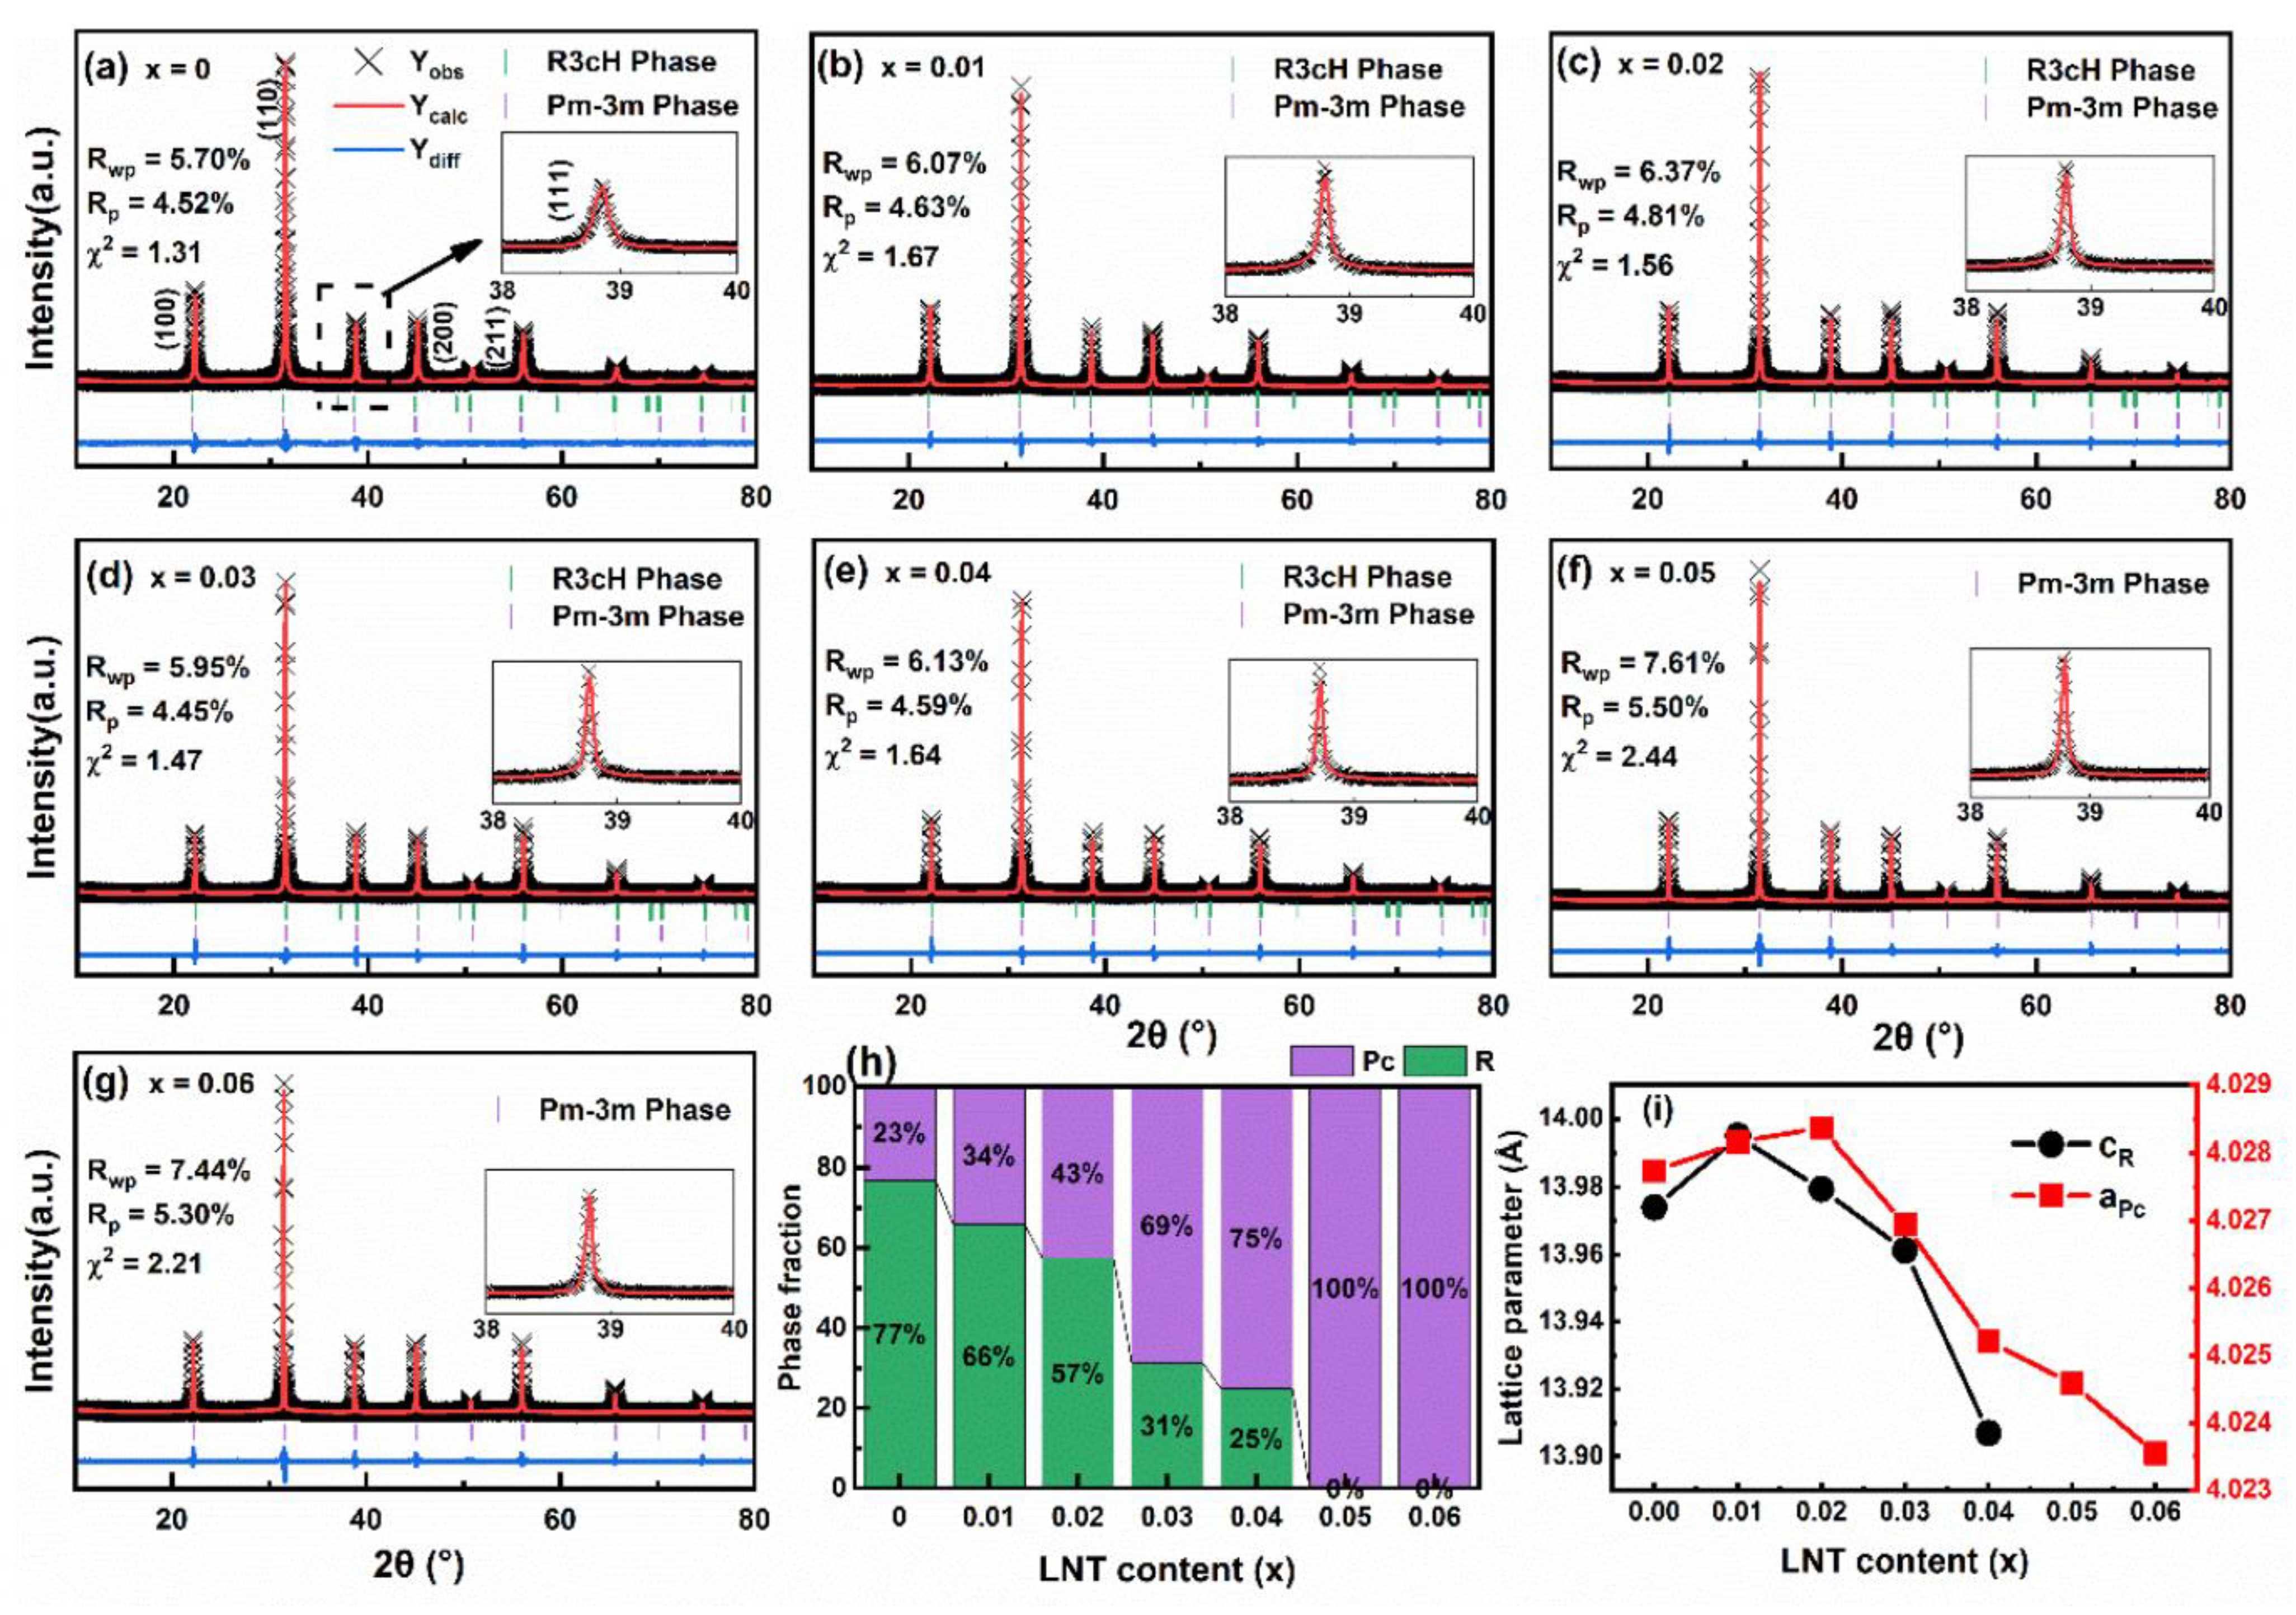
| x | Space Group | Lattice Parameters | Rwp (%) | Rp (%) | χ2 |
|---|---|---|---|---|---|
| 0 | R3cH Pmm | a = b = 5.69552 Å, c = 13.97396 Å, α = β = 90°, γ = 120° a = b = c = 4.02774 Å, α = β = γ = 90° | 5.70 | 4.52 | 1.31 |
| 0.01 | R3cH Pmm | a = b = 5.68390 Å, c = 13.99490 Å, α = β = 90°, γ = 120° a = b = c = 4.02816 Å, α = β = γ = 90° | 6.07 | 4.63 | 1.67 |
| 0.02 | R3cH Pmm | a = b = 5.69602 Å, c = 13.97944 Å, α = β = 90°, γ = 120° a = b = c = 4.02837 Å, α = β = γ = 90° | 6.37 | 4.81 | 1.56 |
| 0.03 | R3cH Pmm | a = b = 5.68895 Å, c = 13.96117 Å, α = β = 90°, γ = 120° a = b = c = 4.02695 Å, α = β = γ = 90° | 5.95 | 4.45 | 1.47 |
| 0.04 | R3cH Pmm | a = b = 5.69720 Å, c = 13.90696 Å, α = β = 90°, γ = 120° a = b = c = 4.02521 Å, α = β = γ = 90° | 6.13 | 4.59 | 1.64 |
| 0.05 | Pmm | a = b = c = 4.02458 Å, α = β = γ = 90° | 7.61 | 5.50 | 2.44 |
| 0.06 | Pmm | a = b = c = 4.02355 Å, α = β = γ = 90° | 7.44 | 5.30 | 2.21 |
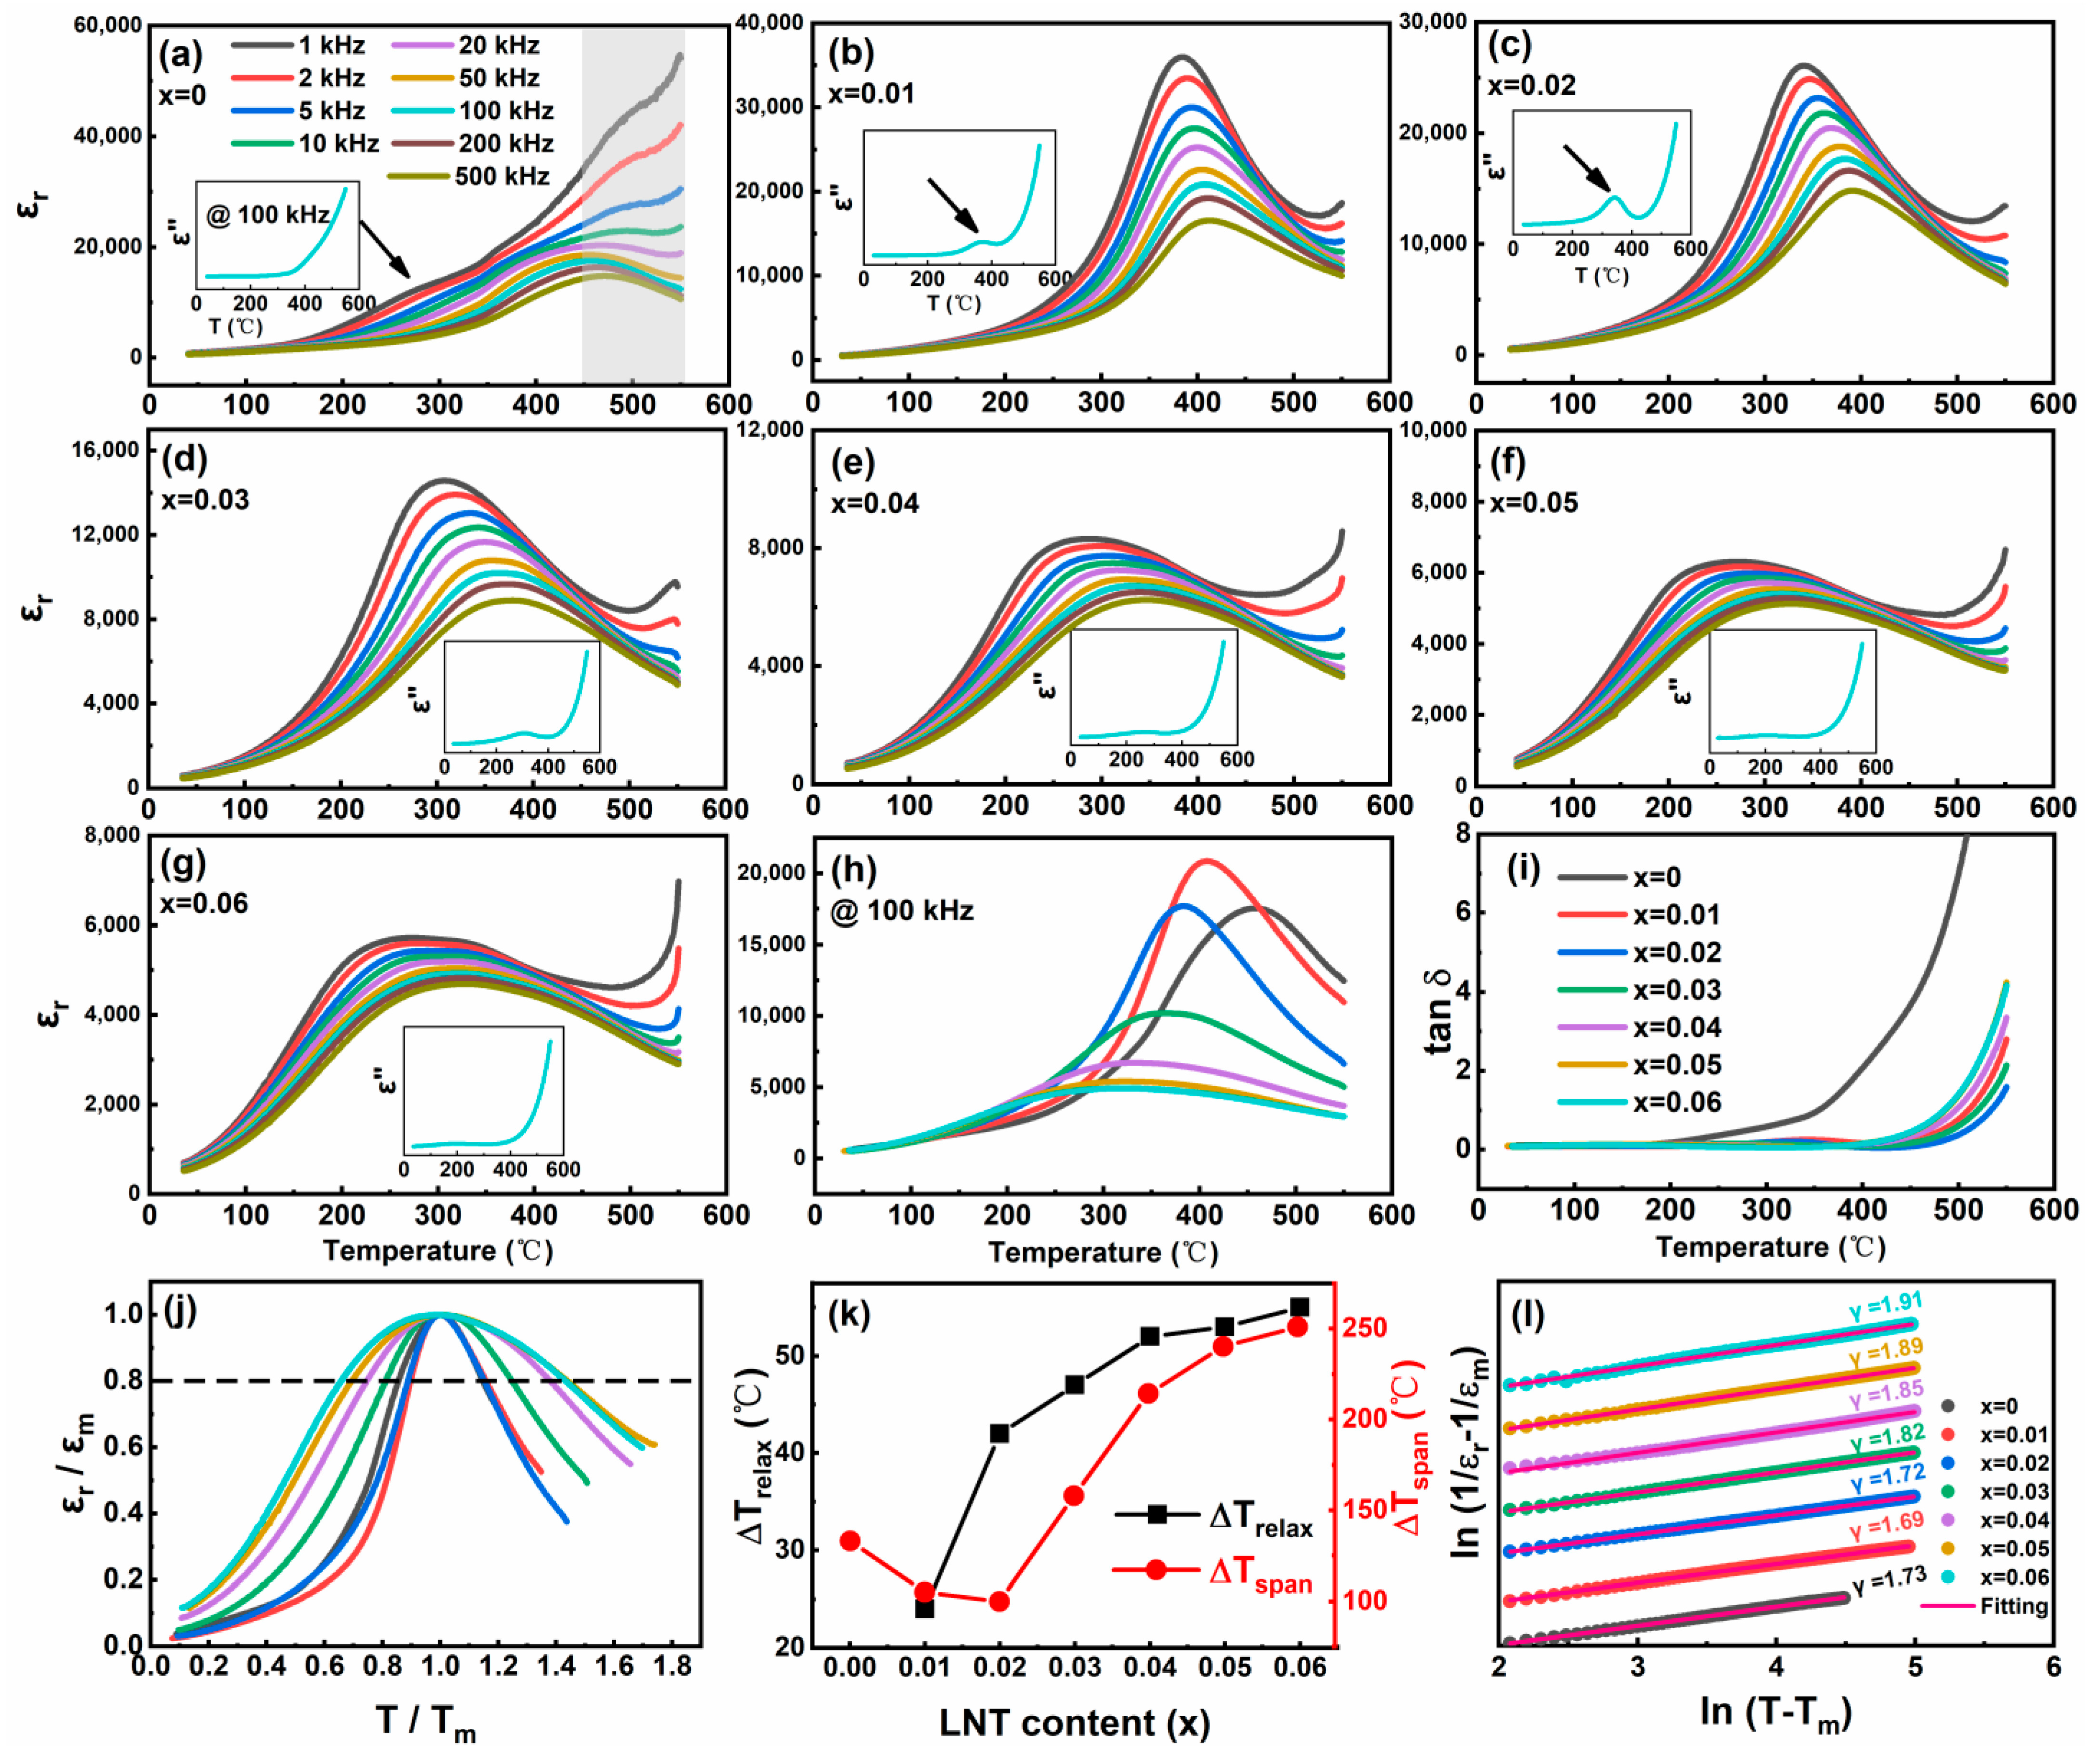
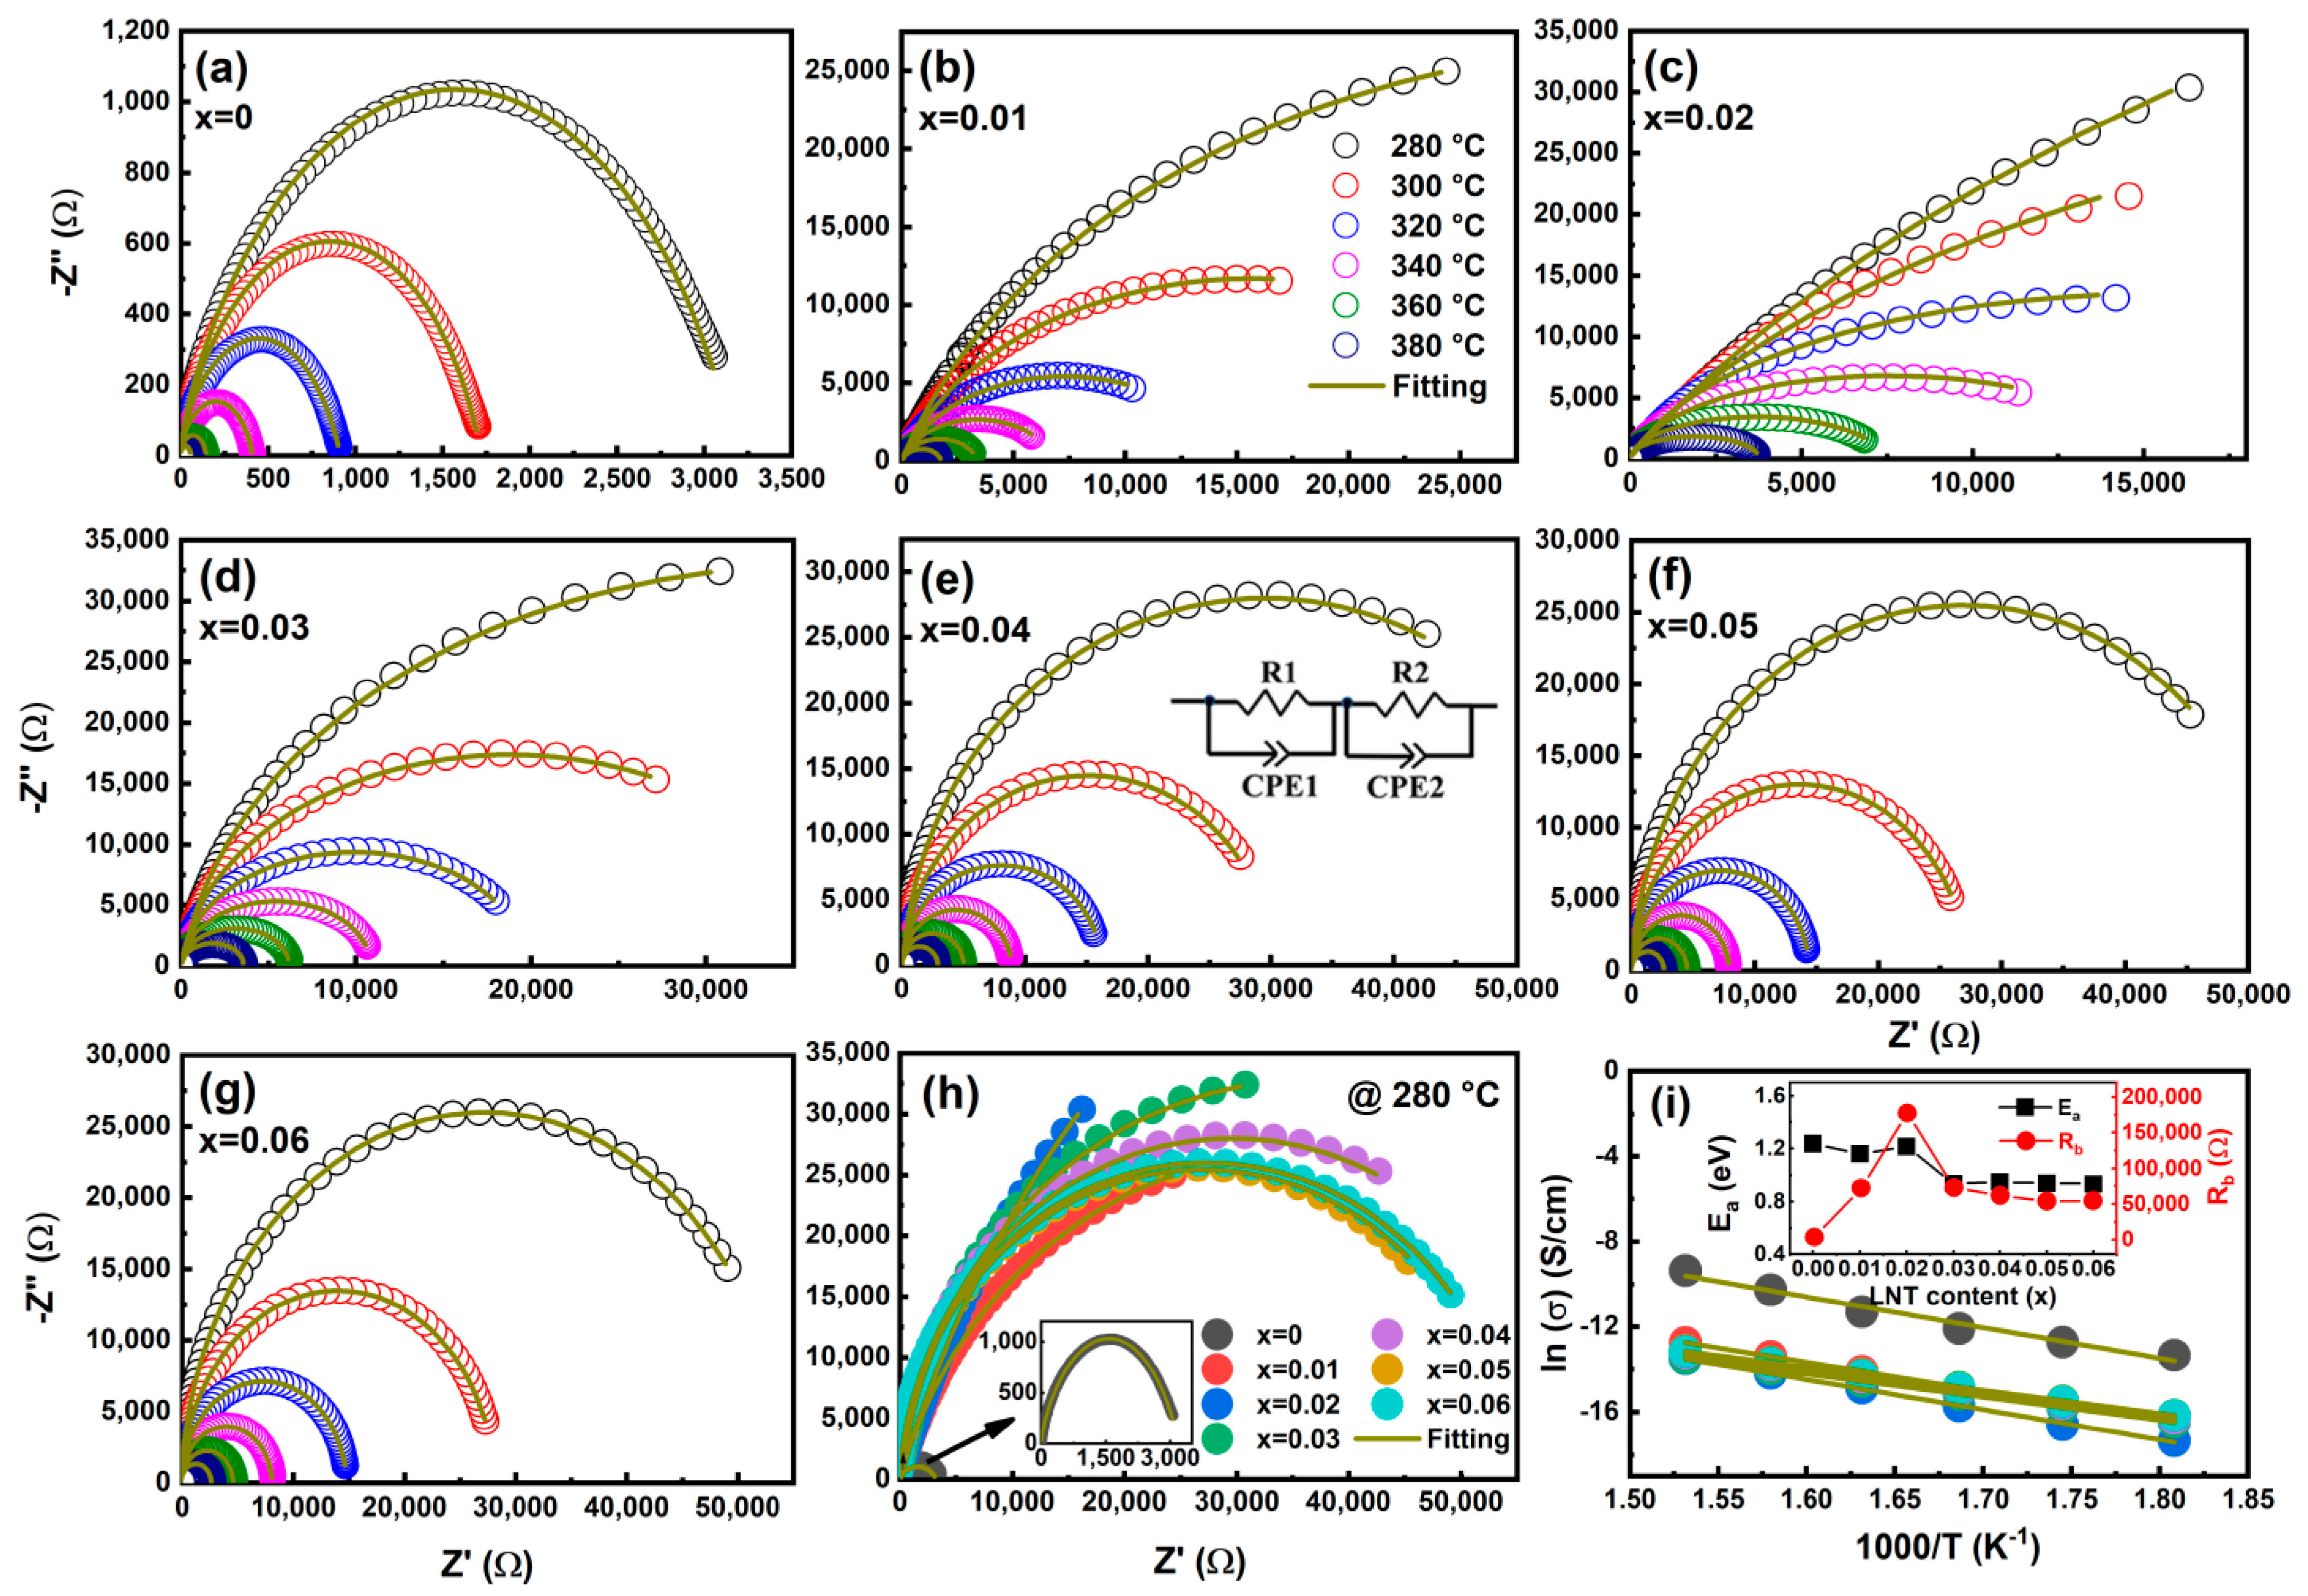
| x/T | 280 °C | 300 °C | 320 °C | 340 °C | 360 °C | 380 °C |
|---|---|---|---|---|---|---|
| 0 | 3230 | 1721 | 915 | 414 | 149 | 61 |
| 0.01 | 72,374 | 31,546 | 14,720 | 6758 | 3391 | 1753 |
| 0.02 | 177,480 | 84,263 | 34,951 | 15,035 | 7447 | 3804 |
| 0.03 | 72,973 | 37,544 | 19,766 | 10,816 | 6113 | 3675 |
| 0.04 | 61,701 | 30,854 | 16,371 | 8958 | 5072 | 2934 |
| 0.05 | 53,899 | 27,061 | 14,361 | 7946 | 4521 | 2632 |
| 0.06 | 54,680 | 28,263 | 14,881 | 8208 | 4689 | 2739 |
Disclaimer/Publisher’s Note: The statements, opinions and data contained in all publications are solely those of the individual author(s) and contributor(s) and not of MDPI and/or the editor(s). MDPI and/or the editor(s) disclaim responsibility for any injury to people or property resulting from any ideas, methods, instructions or products referred to in the content. |
© 2023 by the authors. Licensee MDPI, Basel, Switzerland. This article is an open access article distributed under the terms and conditions of the Creative Commons Attribution (CC BY) license (https://creativecommons.org/licenses/by/4.0/).
Share and Cite
Shi, H.; Li, K.; Li, F.; Ma, J.; Tu, Y.; Long, M.; Lu, Y.; Gong, W.; Wang, C.; Shan, L. Enhanced Piezoelectricity and Thermal Stability of Electrostrain Performance in BiFeO3-Based Lead-Free Ceramics. Nanomaterials 2023, 13, 942. https://doi.org/10.3390/nano13050942
Shi H, Li K, Li F, Ma J, Tu Y, Long M, Lu Y, Gong W, Wang C, Shan L. Enhanced Piezoelectricity and Thermal Stability of Electrostrain Performance in BiFeO3-Based Lead-Free Ceramics. Nanomaterials. 2023; 13(5):942. https://doi.org/10.3390/nano13050942
Chicago/Turabian StyleShi, Hongwei, Kai Li, Feng Li, Jianxing Ma, Yubing Tu, Mingsheng Long, Yilin Lu, Weiping Gong, Chunchang Wang, and Lei Shan. 2023. "Enhanced Piezoelectricity and Thermal Stability of Electrostrain Performance in BiFeO3-Based Lead-Free Ceramics" Nanomaterials 13, no. 5: 942. https://doi.org/10.3390/nano13050942