
Amorphous As2S3 Doped with Transition Metals: An Ab Initio Study of Electronic Structure and Magnetic Properties
 , , ,
, , ,
Abstract
:1. Introduction
2. Simulation Details
3. Results and Discussion
4. Conclusions
Author Contributions
Funding
Data Availability Statement
Acknowledgments
Conflicts of Interest
Abbreviations
| DFT | Density Functional Theory |
| AIMD | Ab initio molecular dynamics |
| GGA | Generalized Gradient Approximation |
| PW91 | Perdew-Wang |
| PBE | Perdew-Burke-Ernzerhof |
| vdW | van der Waals |
| TS | Tkatchenko and Scheffler |
| PAW | Projected Augmented Wave |
| VASP | Vienna Ab initio Simulation Package |
| CASTEP | CAmbridge Serial Total Energy Package |
| USP | Ultrasoft pseudopotentials |
| BFGS | Broyden-Fletcher-Goldfarb-Shanno |
| BZ | Brillouin zone |
| Ch | Chalcogen |
| TM | Transition metal |
| DOS | Density of States |
| PDOS | Partial Density of States |
| LDOS | Local Density of States |
| SCF | Self-Consistent Field |
| ISD | Integrated Spin Density |
| IMSD | Integrated Modulus Spin Density |
| mq | Melt-quenched |
| GOpt | Geometry Optimization |
| CB | Covalent bond |
| LP | Lone pair |
| CDD | Charge Density Difference |
Appendix A. Atomic and Bond Populations

| Species | Spin | s | p | d | Total | Charge (e) | Spin (ℏ/2) |
|---|---|---|---|---|---|---|---|
| Mo1 | up | 1.261 | 3.332 | 2.840 | 7.433 | −0.150 | 0.715 |
| down | 1.240 | 3.304 | 2.174 | 6.717 | |||
| Mo2 | up | 1.258 | 3.313 | 2.541 | 7.112 | −0.206 | 0.017 |
| down | 1.257 | 3.313 | 2.524 | 7.095 | |||
| Mo3 | up | 1.268 | 3.308 | 2.843 | 7.420 | −0.004 | 0.836 |
| down | 1.235 | 3.256 | 2.093 | 6.584 | |||
| Mo4 | up | 1.248 | 3.325 | 2.456 | 7.029 | −0.056 | 0.001 |
| down | 1.248 | 3.325 | 2.454 | 7.027 | |||
| Mo5 | up | 1.238 | 3.240 | 2.537 | 7.014 | −0.019 | 0.010 |
| down | 1.240 | 3.245 | 2.519 | 7.004 |
| Species | Spin | s | p | d | Total | Charge (e) | Spin (ℏ/2) |
|---|---|---|---|---|---|---|---|
| Mo1 | up | 1.248 | 3.302 | 2.811 | 7.362 | −0.084 | 0.640 |
| down | 1.230 | 3.275 | 2.216 | 6.722 | |||
| Mo2 | up | 1.242 | 3.301 | 2.540 | 7.083 | −0.158 | 0.009 |
| down | 1.242 | 3.301 | 2.532 | 7.074 | |||
| Mo3 | up | 1.272 | 3.278 | 2.856 | 7.405 | 0.062 | 0.873 |
| down | 1.234 | 3.225 | 2.073 | 6.533 | |||
| Mo4 | up | 1.237 | 3.297 | 2.459 | 6.993 | 0.014 | 0.001 |
| down | 1.237 | 3.297 | 2.458 | 6.993 | |||
| Mo5 | up | 1.246 | 3.226 | 2.540 | 7.012 | 0.014 | 0.039 |
| down | 1.247 | 3.230 | 2.497 | 6.974 |
| Species | Spin | s | p | d | Total | Charge (e) | Spin (ℏ/2) |
|---|---|---|---|---|---|---|---|
| V1 | up | 1.234 | 3.351 | 1.893 | 6.478 | 0.051 | 0.007 |
| down | 1.234 | 3.351 | 1.886 | 6.471 | |||
| V2 | up | 1.242 | 3.358 | 2.223 | 6.824 | 0.007 | 0.654 |
| down | 1.224 | 3.332 | 1.614 | 6.170 | |||
| V3 | up | 1.244 | 3.340 | 2.167 | 6.751 | 0.176 | 0.678 |
| down | 1.224 | 3.306 | 1.542 | 6.073 | |||
| V4 | up | 1.229 | 3.345 | 1.927 | 6.501 | 0.136 | 0.139 |
| down | 1.226 | 3.341 | 1.796 | 6.363 | |||
| V5 | up | 1.229 | 3.317 | 2.294 | 6.840 | 0.154 | 0.834 |
| down | 1.206 | 3.287 | 1.513 | 6.006 |
| Species | Spin | s | p | d | Total | Charge (e) | Spin (ℏ/2) |
|---|---|---|---|---|---|---|---|
| V1 | up | 1.214 | 3.315 | 1.909 | 6.439 | 0.115 | −0.008 |
| down | 1.214 | 3.316 | 1.917 | 6.447 | |||
| V2 | up | 1.210 | 3.329 | 1.951 | 6.490 | 0.041 | 0.022 |
| down | 1.210 | 3.328 | 1.930 | 6.469 | |||
| V3 | up | 1.231 | 3.305 | 2.164 | 6.700 | 0.214 | 0.614 |
| down | 1.214 | 3.282 | 1.590 | 6.086 | |||
| V4 | up | 1.212 | 3.317 | 1.879 | 6.408 | 0.182 | −0.001 |
| down | 1.212 | 3.317 | 1.880 | 6.410 | |||
| V5 | up | 1.220 | 3.290 | 2.226 | 6.735 | 0.184 | 0.654 |
| down | 1.203 | 3.269 | 1.609 | 6.081 |
| Species | Spin | s | p | d | Total | Charge (e) | Spin (ℏ/2) |
|---|---|---|---|---|---|---|---|
| W1 | up | 1.327 | 3.375 | 2.227 | 6.930 | −0.160 | −0.301 |
| down | 1.337 | 3.391 | 2.503 | 7.230 | |||
| W2 | up | 1.340 | 3.385 | 2.372 | 7.097 | −0.200 | −0.007 |
| down | 1.340 | 3.385 | 2.378 | 7.104 | |||
| W3 | up | 1.338 | 3.367 | 2.487 | 7.192 | 0.008 | 0.393 |
| down | 1.320 | 3.333 | 2.147 | 6.800 | |||
| W4 | up | 1.333 | 3.383 | 2.291 | 7.007 | −0.015 | 0.000 |
| down | 1.334 | 3.383 | 2.291 | 7.008 | |||
| W5 | up | 1.315 | 3.310 | 2.393 | 7.018 | −0.004 | 0.031 |
| down | 1.314 | 3.309 | 2.363 | 6.987 |
| Species | Spin | s | p | d | Total | Charge (e) | Spin (ℏ/2) |
|---|---|---|---|---|---|---|---|
| W1 | up | 1.321 | 3.362 | 2.366 | 7.049 | −0.098 | 0.000 |
| down | 1.321 | 3.362 | 2.366 | 7.049 | |||
| W2 | up | 1.329 | 3.377 | 2.373 | 7.079 | −0.158 | 0.000 |
| down | 1.329 | 3.377 | 2.373 | 7.079 | |||
| W3 | up | 1.330 | 3.327 | 2.312 | 6.969 | 0.062 | 0.000 |
| down | 1.330 | 3.327 | 2.313 | 6.969 | |||
| W4 | up | 1.325 | 3.361 | 2.290 | 6.976 | 0.047 | 0.000 |
| down | 1.325 | 3.361 | 2.290 | 6.976 | |||
| W5 | up | 1.321 | 3.305 | 2.361 | 6.987 | 0.026 | 0.000 |
| down | 1.321 | 3.305 | 2.361 | 6.987 |
| Bond | Population | Length (Å) |
|---|---|---|
| S 62 – Mo 1 | 0.42 | 2.35153 |
| S 97 – Mo 1 | 0.70 | 2.36834 |
| S 43 – Mo 1 | 0.55 | 2.45819 |
| S 96 – Mo 1 | 0.50 | 2.55119 |
| As 2 – Mo 1 | 0.10 | 2.62421 |
| S 117 – Mo 1 | 0.19 | 2.66196 |
| S 37 – Mo 2 | 0.51 | 2.39509 |
| S 71 – Mo 2 | 0.55 | 2.44170 |
| S 104 – Mo 2 | 0.34 | 2.51202 |
| S 51 – Mo 2 | 0.25 | 2.51837 |
| S 48 – Mo 2 | 0.29 | 2.54396 |
| S 50 – Mo 3 | 0.65 | 2.28939 |
| S 136 – Mo 3 | 0.39 | 2.40071 |
| S 18 – Mo 3 | 0.45 | 2.41271 |
| S 103 – Mo 3 | 0.42 | 2.47104 |
| S 66 – Mo 3 | 0.37 | 2.48602 |
| S 100 – Mo 3 | 0.47 | 2.54992 |
| S 21 – Mo 4 | 0.83 | 2.27300 |
| S 5 – Mo 4 | 0.57 | 2.35213 |
| S 65 – Mo 4 | 0.69 | 2.36482 |
| S 132 – Mo 4 | 0.52 | 2.40702 |
| S 138 – Mo 4 | 0.57 | 2.44573 |
| S 102 – Mo 4 | 0.26 | 2.67791 |
| S 61 – Mo 5 | 0.55 | 2.31356 |
| S 98 – Mo 5 | 0.31 | 2.38004 |
| S 103 – Mo 5 | 0.53 | 2.44358 |
| S 136 – Mo 5 | 0.33 | 2.47183 |
| S 139 – Mo 5 | 0.14 | 2.51564 |
| S 66 – Mo 5 | 0.38 | 2.59185 |
| Bond | Population | Length (Å) |
|---|---|---|
| S 97 – Mo 1 | 0.69 | 2.34497 |
| S 62 – Mo 1 | 0.40 | 2.38299 |
| S 43 – Mo 1 | 0.52 | 2.44055 |
| S 96 – Mo 1 | 0.56 | 2.44842 |
| S 117 – Mo 1 | 0.17 | 2.60819 |
| As 2 – Mo 1 | 0.03 | 2.67550 |
| S 37 – Mo 2 | 0.49 | 2.36059 |
| S 71 – Mo 2 | 0.53 | 2.42611 |
| S 104 – Mo 2 | 0.37 | 2.49311 |
| S 51 – Mo 2 | 0.27 | 2.49964 |
| S 48 – Mo 2 | 0.22 | 2.58459 |
| As 69 – Mo 2 | 0.05 | 2.65684 |
| S 50 – Mo 3 | 0.61 | 2.34939 |
| S 136 – Mo 3 | 0.41 | 2.41678 |
| S 18 – Mo 3 | 0.48 | 2.42998 |
| S 103 – Mo 3 | 0.42 | 2.43346 |
| S 66 – Mo 3 | 0.35 | 2.45545 |
| S 100 – Mo 3 | 0.50 | 2.49639 |
| S 21 – Mo 4 | 0.81 | 2.24730 |
| S 5 – Mo 4 | 0.55 | 2.34310 |
| S 65 – Mo 4 | 0.64 | 2.36593 |
| S 138 – Mo 4 | 0.57 | 2.41099 |
| S 132 – Mo 4 | 0.46 | 2.50006 |
| S 102 – Mo 4 | 0.27 | 2.60575 |
| S 98 – Mo 5 | 0.31 | 2.36449 |
| S 103 – Mo 5 | 0.45 | 2.43617 |
| S 136 – Mo 5 | 0.33 | 2.44773 |
| S 61 – Mo 5 | 0.50 | 2.47537 |
| S 139 – Mo 5 | 0.20 | 2.49435 |
| S 66 – Mo 5 | 0.38 | 2.55565 |
| As 18 – Mo 5 | 0.14 | 2.62478 |
| Bond | Population | Length (Å) |
|---|---|---|
| S 62 – V 1 | 0.44 | 2.35153 |
| S 97 – V 1 | 0.64 | 2.36834 |
| S 43 – V 1 | 0.51 | 2.45819 |
| S 96 – V 1 | 0.48 | 2.55119 |
| V 1 – As 2 | 0.20 | 2.62421 |
| S 117 – V 1 | 0.21 | 2.66196 |
| S 37 – V 2 | 0.49 | 2.39509 |
| S 71 – V 2 | 0.52 | 2.44170 |
| S 104 – V 2 | 0.32 | 2.51202 |
| S 51 – V 2 | 0.27 | 2.51837 |
| S 48 – V 2 | 0.29 | 2.54396 |
| V 2 – As 69 | 0.02 | 2.69034 |
| S 50 – V 3 | 0.63 | 2.28939 |
| S 136 – V 3 | 0.41 | 2.40071 |
| S 18 – V 3 | 0.43 | 2.41271 |
| S 103 – V 3 | 0.44 | 2.47104 |
| S 66 – V 3 | 0.37 | 2.48602 |
| S 100 – V 3 | 0.46 | 2.54992 |
| S 21 – V 4 | 0.73 | 2.27300 |
| S 5 – V 4 | 0.51 | 2.35213 |
| S 65 – V 4 | 0.63 | 2.36482 |
| S 132 – V 4 | 0.46 | 2.40702 |
| S 138 – V 4 | 0.52 | 2.44573 |
| S 102 – V 4 | 0.25 | 2.67791 |
| S 61 – V 5 | 0.57 | 2.31356 |
| S 98 – V 5 | 0.33 | 2.38004 |
| S 103 – V 5 | 0.46 | 2.44358 |
| S 136 – V 5 | 0.32 | 2.47183 |
| S 139 – V 5 | 0.19 | 2.51564 |
| S 66 – V 5 | 0.37 | 2.59185 |
| Bond | Population | Length (Å) |
|---|---|---|
| S 97 – V 1 | 0.65 | 2.29484 |
| S 96 – V 1 | 0.57 | 2.32880 |
| S 62 – V 1 | 0.38 | 2.35927 |
| S 43 – V 1 | 0.49 | 2.37497 |
| S 117 – V 1 | 0.18 | 2.60801 |
| V 1 – As 2 | 0.10 | 2.65447 |
| S 37 – V 2 | 0.51 | 2.28793 |
| S 104 – V 2 | 0.49 | 2.32588 |
| S 71 – V 2 | 0.44 | 2.42616 |
| S 51 – V 2 | 0.27 | 2.48525 |
| S 48 – V 2 | 0.25 | 2.55042 |
| V 2 – As 69 | 0.05 | 2.87340 |
| S 50 – V 3 | 0.63 | 2.25890 |
| S 136 – V 3 | 0.41 | 2.34574 |
| S 103 – V 3 | 0.43 | 2.35365 |
| S 18 – V 3 | 0.46 | 2.36615 |
| S 66 – V 3 | 0.35 | 2.42930 |
| S 100 – V 3 | 0.42 | 2.51927 |
| S 21 – V 4 | 0.73 | 2.19812 |
| S 5 – V 4 | 0.49 | 2.30330 |
| S 65 – V 4 | 0.60 | 2.32754 |
| S 138 – V 4 | 0.53 | 2.37150 |
| S 132 – V 4 | 0.41 | 2.49042 |
| S 102 – V 4 | 0.23 | 2.64811 |
| S 98 – V 5 | 0.34 | 2.29003 |
| S 139 – V 5 | 0.23 | 2.38030 |
| S 61 – V 5 | 0.54 | 2.38320 |
| S 103 – V 5 | 0.39 | 2.42524 |
| S 136 – V 5 | 0.29 | 2.48977 |
| S 66 – V 5 | 0.39 | 2.52080 |
| V 5 – As 18 | 0.08 | 2.66532 |
| Bond | Population | Length (Å) |
|---|---|---|
| S 97 – W 1 | 0.76 | 2.36834 |
| S 43 – W 1 | 0.61 | 2.45819 |
| S 96 – W 1 | 0.53 | 2.55119 |
| As 2 – W 1 | 0.29 | 2.62421 |
| S 117 – W 1 | 0.24 | 2.66196 |
| S 37 – W 2 | 0.58 | 2.39509 |
| S 71 – W 2 | 0.60 | 2.44170 |
| S 104 – W 2 | 0.41 | 2.51202 |
| S 51 – W 2 | 0.31 | 2.51837 |
| S 48 – W 2 | 0.34 | 2.54396 |
| As 69 – W 2 | 0.10 | 2.69034 |
| S 50 – W 3 | 0.74 | 2.28939 |
| S 136 – W 3 | 0.44 | 2.40071 |
| S 18 – W 3 | 0.53 | 2.41271 |
| S 103 – W 3 | 0.50 | 2.47104 |
| S 66 – W 3 | 0.42 | 2.48602 |
| S 100 – W 3 | 0.55 | 2.54992 |
| S 21 – W 4 | 0.92 | 2.27300 |
| S 5 – W 4 | 0.65 | 2.35213 |
| S 65 – W 4 | 0.75 | 2.36482 |
| S 132 – W 4 | 0.58 | 2.40702 |
| S 138 – W 4 | 0.63 | 2.44573 |
| S 102 – W 4 | 0.31 | 2.67791 |
| S 61 – W 5 | 0.65 | 2.31372 |
| S 98 – W 5 | 0.38 | 2.37996 |
| S 103 – W 5 | 0.55 | 2.44368 |
| S 136 – W 5 | 0.37 | 2.47186 |
| S 139 – W 5 | 0.21 | 2.51564 |
| S 66 – W 5 | 0.39 | 2.59173 |
| As 18 – W 5 | 0.14 | 2.65071 |
| Bond | Population | Length (Å) |
|---|---|---|
| S 62 – W 1 | 0.55 | 2.34022 |
| S 97 – W 1 | 0.74 | 2.34139 |
| S 43 – W 1 | 0.62 | 2.41789 |
| S 96 – W 1 | 0.58 | 2.46070 |
| S 117 – W 1 | 0.24 | 2.58213 |
| As 2 – W 1 | 0.17 | 2.68840 |
| S 37 – W 2 | 0.58 | 2.35692 |
| S 71 – W 2 | 0.58 | 2.43016 |
| S 104 – W 2 | 0.46 | 2.47766 |
| S 51 – W 2 | 0.35 | 2.48555 |
| S 48 – W 2 | 0.28 | 2.56779 |
| As 69 – W 2 | 0.20 | 2.67965 |
| S 50 – W 3 | 0.69 | 2.35406 |
| S 103 – W 3 | 0.53 | 2.40099 |
| S 18 – W 3 | 0.57 | 2.41828 |
| S 100 – W 3 | 0.60 | 2.43290 |
| S 136 – W 3 | 0.43 | 2.43514 |
| S 66 – W 3 | 0.39 | 2.46608 |
| S 21 – W 4 | 0.93 | 2.24250 |
| S 5 – W 4 | 0.61 | 2.35681 |
| S 65 – W 4 | 0.71 | 2.36997 |
| S 138 – W 4 | 0.63 | 2.40442 |
| S 132 – W 4 | 0.54 | 2.47843 |
| S 102 – W 4 | 0.32 | 2.60427 |
| S 98 – W 5 | 0.40 | 2.38134 |
| S 103 – W 5 | 0.50 | 2.43729 |
| S 61 – W 5 | 0.59 | 2.45037 |
| S 136 – W 5 | 0.37 | 2.46057 |
| S 139 – W 5 | 0.26 | 2.49339 |
| S 66 – W 5 | 0.41 | 2.54839 |
| As 18 – W 5 | 0.31 | 2.60879 |
References
- Goryunova, N.; Kolomiets, B. Electrical properties and structure in system of Selenide of Tl, Sb, and As. Zhurnal Tekhnicheskoi Fiz. 1955, 25, 2669. [Google Scholar]
- Kastner, M. Bonding Bands, Lone-Pair Bands and Impurity States in Chalcogenide Semiconductors. Phys. Rev. Lett. 1972, 28, 355–357. [Google Scholar] [CrossRef]
- Kolobov, A.V. Photo-Induced Metastability in Amorphous Semiconductors; Wiley VCH: Weinheim, Germany, 2003; p. 436. [Google Scholar]
- Tanaka, K.; Shimakawa, K. Amorphous Chalcogenide Semiconductors and Related Materials; Springer: New York, NY, USA, 2011. [Google Scholar] [CrossRef]
- Kolobov, A.V.; Oyanagi, H.; Tanaka, K.; Tanaka, K. Structural study of amorphous selenium by in situ EXAFS: Observation of photoinduced bond alternation. Phys. Rev. B 1997, 55, 726–734. [Google Scholar] [CrossRef]
- Kolobov, A.V.; Tominaga, J. Two-Dimensional Transition-Metal Dichalcogenides; Springer International Publishing: Cham, Switzerland, 2016. [Google Scholar] [CrossRef]
- Goudsmit, S.A.; Richards, P.I. The Order of Electron Shells in Ionized Atoms. Proc. Natl. Acad. Sci. USA 1964, 51, 664–671, Erratum in Proc. Natl. Acad. Sci. USA 1964, 51, 906. [Google Scholar] [CrossRef] [PubMed] [Green Version]
- Pyykkö, P. Is the Periodic Table all right (“PT OK”)? EPJ Web Conf. 2016, 131, 01001. [Google Scholar] [CrossRef] [Green Version]
- Klechkovskii, V. On the First Appearance of Atomic Electrons With l, n, nr and n + l Given. J. Exp. Theor. Phys. 1956, 3, 125. [Google Scholar]
- Klechkovskii, V. Justification of the Rule for Successive Filling of (n + l) Groups. J. Exp. Theor. Phys. 1962, 14, 334. [Google Scholar]
- Wilson, J.A.; Salvo, F.J.D.; Mahajan, S. Charge-Density Waves in Metallic, Layered, Transition-Metal Dichalcogenides. Phys. Rev. Lett. 1974, 32, 882–885. [Google Scholar] [CrossRef]
- Wilson, J.; Salvo, F.D.; Mahajan, S. Charge-density waves and superlattices in the metallic layered transition metal dichalcogenides. Adv. Phys. 1975, 24, 117–201. [Google Scholar] [CrossRef]
- McMillan, W.L. Landau theory of charge-density waves in transition-metal dichalcogenides. Phys. Rev. B 1975, 12, 1187–1196. [Google Scholar] [CrossRef]
- Gor’kov, L.P. Strong electron-lattice coupling as the mechanism behind charge density wave transformations in transition-metal dichalcogenides. Phys. Rev. B 2012, 85, 165142. [Google Scholar] [CrossRef] [Green Version]
- Shen, D.W.; Xie, B.P.; Zhao, J.F.; Yang, L.X.; Fang, L.; Shi, J.; He, R.H.; Lu, D.H.; Wen, H.H.; Feng, D.L. Novel Mechanism of a Charge Density Wave in a Transition Metal Dichalcogenide. Phys. Rev. Lett. 2007, 99, 216404. [Google Scholar] [CrossRef] [PubMed] [Green Version]
- Dai, J.; Calleja, E.; Alldredge, J.; Zhu, X.; Li, L.; Lu, W.; Sun, Y.; Wolf, T.; Berger, H.; McElroy, K. Microscopic evidence for strong periodic lattice distortion in two-dimensional charge-density wave systems. Phys. Rev. B 2014, 89, 165140. [Google Scholar] [CrossRef] [Green Version]
- Neto, A.H.C. Charge Density Wave, Superconductivity and Anomalous Metallic Behavior in 2D Transition Metal Dichalcogenides. Phys. Rev. Lett. 2001, 86, 4382–4385. [Google Scholar] [CrossRef] [Green Version]
- Hellmann, S.; Rohwer, T.; Kalläne, M.; Hanff, K.; Sohrt, C.; Stange, A.; Carr, A.; Murnane, M.; Kapteyn, H.; Kipp, L.; et al. Time-domain classification of charge-density-wave insulators. Nat. Commun. 2012, 3, 1069. [Google Scholar] [CrossRef] [Green Version]
- Rossnagel, K. On the origin of charge-density waves in select layered transition-metal dichalcogenides. J. Phys. Condens. Matter 2011, 23, 213001. [Google Scholar] [CrossRef]
- Hooper, H.O.; de Graaf, A.M. (Eds.) Amorphous Magnetism; Springer: New York, NY, USA, 1973. [Google Scholar] [CrossRef]
- Levy, R.A.; Hasegawa, R. (Eds.) Amorphous Magnetism II; Springer: New York, NY, USA, 1977. [Google Scholar] [CrossRef]
- Kaneyoshi, T. Amorphous Magnetism; CRC Press: Boca Raton, FL, USA, 1984; p. 190. [Google Scholar]
- Fairman, R.; Ushkov, B. (Eds.) Semiconducting Chalcogenide Glass II; Academic Press: Cambridge, MA, USA, 2004; Volume 79, p. 307. [Google Scholar]
- Konstantinou, K.; Mavračić, J.; Mocanu, F.C.; Elliott, S.R. Simulation of Phase-Change-Memory and Thermoelectric Materials using Machine-Learned Interatomic Potentials: Sb2Te3. Phys. Status Solidi (b) 2020, 258, 2000416. [Google Scholar] [CrossRef]
- Mocanu, F.C.; Konstantinou, K.; Mavračić, J.; Elliott, S.R. On the Chemical Bonding of Amorphous Sb2Te3. Phys. Status Solidi Rapid Res. Lett. 2020, 15, 2000485. [Google Scholar] [CrossRef]
- Mullen, D.J.E.; Nowacki, W. Refinement of the crystal structures of realgar, AsS and orpiment, As2S3. Z. Krist. 1972, 136, 48–65. [Google Scholar] [CrossRef] [Green Version]
- Caravati, S.; Bernasconi, M.; Kühne, T.D.; Krack, M.; Parrinello, M. Coexistence of tetrahedral- and octahedral-like sites in amorphous phase change materials. Appl. Phys. Lett. 2007, 91, 171906. [Google Scholar] [CrossRef]
- Perdew, J.P.; Burke, K.; Ernzerhof, M. Generalized Gradient Approximation Made Simple. Phys. Rev. Lett. 1996, 77, 3865–3868. [Google Scholar] [CrossRef] [PubMed] [Green Version]
- Blöchl, P.E. Projector augmented-wave method. Phys. Rev. B 1994, 50, 17953–17979. [Google Scholar] [CrossRef] [PubMed] [Green Version]
- Kresse, G.; Joubert, D. From ultrasoft pseudopotentials to the projector augmented-wave method. Phys. Rev. B 1999, 59, 1758–1775. [Google Scholar] [CrossRef]
- Kresse, G.; Hafner, J. Ab initio molecular dynamics for liquid metals. Phys. Rev. B 1993, 47, 558–561. [Google Scholar] [CrossRef]
- Kresse, G.; Furthmüller, J. Efficiency of ab-initio total energy calculations for metals and semiconductors using a plane-wave basis set. Comput. Mater. Sci. 1996, 6, 15–50. [Google Scholar] [CrossRef]
- Kresse, G.; Furthmüller, J. Efficient iterative schemes for ab initio total-energy calculations using a plane-wave basis set. Phys. Rev. B 1996, 54, 11169–11186. [Google Scholar] [CrossRef]
- Pfrommer, B.G.; Côté, M.; Louie, S.G.; Cohen, M.L. Relaxation of Crystals with the Quasi-Newton Method. J. Comput. Phys. 1997, 131, 233–240. [Google Scholar] [CrossRef] [Green Version]
- Press, W.H.; Flannery, B.P.; Teukolsky, S.A.; Vetterling, W.T. Numerical Recipes in C; Cambridge University Press: Cambridge, UK, 1992; p. 994. [Google Scholar]
- Shanno, D.F. Conjugate Gradient Methods with Inexact Searches. Math. Oper. Res. 1978, 3, 244–256. [Google Scholar] [CrossRef]
- Eyert, V. A Comparative Study on Methods for Convergence Acceleration of Iterative Vector Sequences. J. Comput. Phys. 1996, 124, 271–285. [Google Scholar] [CrossRef]
- Perdew, J.P.; Wang, Y. Accurate and simple analytic representation of the electron-gas correlation energy. Phys. Rev. B 1992, 45, 13244–13249. [Google Scholar] [CrossRef]
- Tkatchenko, A.; Scheffler, M. Accurate Molecular Van Der Waals Interactions from Ground-State Electron Density and Free-Atom Reference Data. Phys. Rev. Lett. 2009, 102, 073005. [Google Scholar] [CrossRef] [PubMed] [Green Version]
- Segall, M.D.; Lindan, P.J.D.; Probert, M.J.; Pickard, C.J.; Hasnip, P.J.; Clark, S.J.; Payne, M.C. First-principles simulation: Ideas, illustrations and the CASTEP code. J. Phys. Condens. Matter 2002, 14, 2717–2744. [Google Scholar] [CrossRef]
- Clark, S.J.; Segall, M.D.; Pickard, C.J.; Hasnip, P.J.; Probert, M.I.J.; Refson, K.; Payne, M.C. First principles methods using CASTEP. Z. Krist. Cryst. Mater. 2005, 220, 567–570. [Google Scholar] [CrossRef] [Green Version]
- Vanderbilt, D. Soft self-consistent pseudopotentials in a generalized eigenvalue formalism. Phys. Rev. B 1990, 41, 7892–7895. [Google Scholar] [CrossRef] [PubMed]
- Mulliken, R.S. Electronic Population Analysis on LCAO–MO Molecular Wave Functions. II. Overlap Populations, Bond Orders and Covalent Bond Energies. J. Chem. Phys. 1955, 23, 1841–1846. [Google Scholar] [CrossRef]
- Mulliken, R.S. Electronic Population Analysis on LCAO–MO Molecular Wave Functions. I. J. Chem. Phys. 1955, 23, 1833–1840. [Google Scholar] [CrossRef] [Green Version]
- Monkhorst, H.J.; Pack, J.D. Special points for Brillouin-zone integrations. Phys. Rev. B 1976, 13, 5188–5192. [Google Scholar] [CrossRef]
- Knotek, P.; Kutálek, P.; Černošková, E.; Vlček, M.; Tichý, L. The density, nanohardness and some optical properties of As–S and As–Se chalcogenide bulk glasses and thin films. RSC Adv. 2020, 10, 42744–42753. [Google Scholar] [CrossRef]
- Perdew, J.P. Density functional theory and the band gap problem. Int. J. Quantum Chem. 2009, 28, 497–523. [Google Scholar] [CrossRef]
- Perdew, J.P.; Zunger, A. Self-interaction correction to density-functional approximations for many-electron systems. Phys. Rev. B 1981, 23, 5048–5079. [Google Scholar] [CrossRef] [Green Version]
- Krbal, M.; Prokop, V.; Kononov, A.A.; Pereira, J.R.; Mistrik, J.; Kolobov, A.V.; Fons, P.J.; Saito, Y.; Hatayama, S.; Shuang, Y.; et al. Amorphous-to-Crystal Transition in Quasi-Two-Dimensional MoS2: Implications for 2D Electronic Devices. ACS Appl. Nano Mater. 2021, 4, 8834–8844. [Google Scholar] [CrossRef]
- Huo, N.; Li, Y.; Kang, J.; Li, R.; Xia, Q.; Li, J. Edge-states ferromagnetism of WS2 nanosheets. Appl. Phys. Lett. 2014, 104, 202406. [Google Scholar] [CrossRef]
- Kolomiets, B. Electrical and optical properties of vitreous chalcogenide semiconductor films. Thin Solid Films 1976, 34, 1–7. [Google Scholar] [CrossRef]
- Ignatiev, F.; Karpov, V.; Klinger, M. Atomic critical potentials and structure of non-single-well potentials in glasses. J. Non-Cryst. Solids 1983, 55, 307–323. [Google Scholar] [CrossRef]


| Type of Structure | Density (g/cm) |
|---|---|
| c-As2S3 (experiment) [26] | 3.494 |
| a-As2S3 (experiment) [46] | 3.193 |
| a-As2S3 mq-GOpt | 3.095 |
| a-As2S3:V mq-GOpt | 3.159 |
| a-As2S3:Mo mq-GOpt | 3.202 |
| a-As2S3:W mq-GOpt | 3.321 |
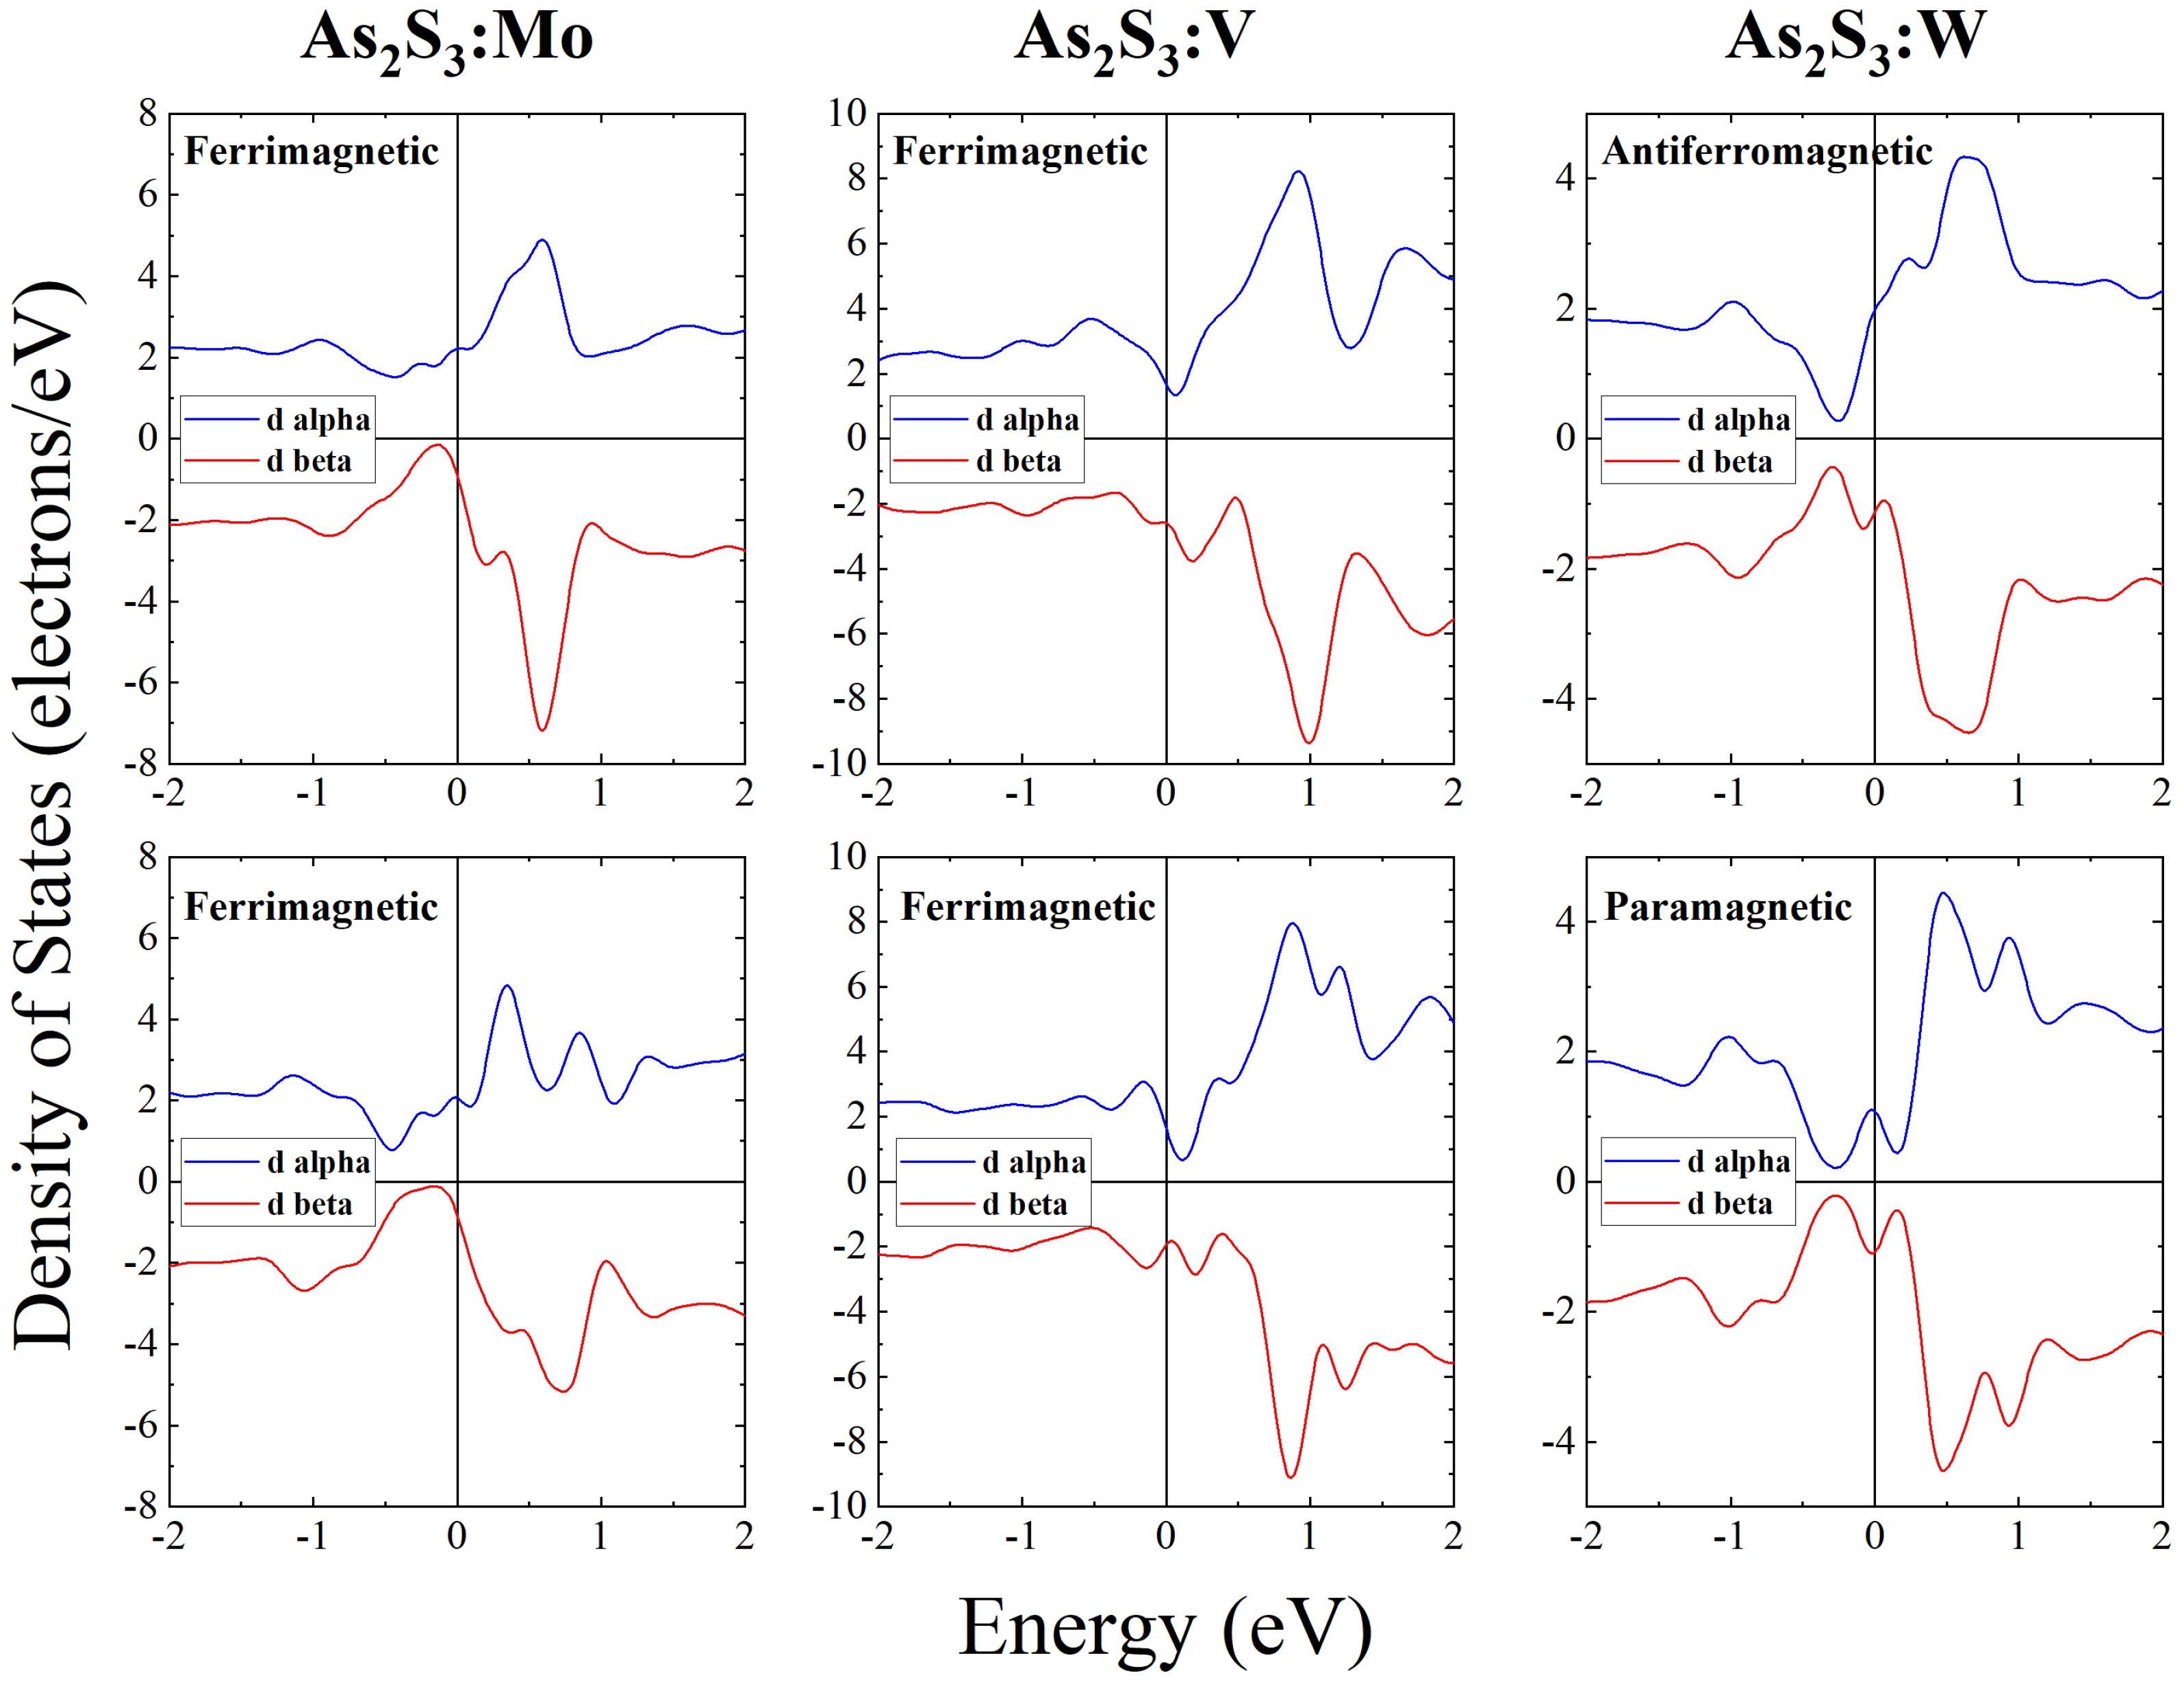
| Melt-Quenched | Melt-Quenched and Relaxed | |||||
|---|---|---|---|---|---|---|
| Dopant | ISD (ℏ/2) | IMSD (ℏ/2) | Magnetic Ordering | ISD (ℏ/2) | IMSD (ℏ/2) | Magnetic Ordering |
| Mo (4s4p4d5s) | 2.00 | 2.58 | ferrimagnetic | 2.00 | 2.54 | ferrimagnetic |
| V (3s3p3d4s) | 2.97 | 4.36 | ferrimagnetic | 1.00 | 1.88 | ferrimagnetic |
| W (5s5p5d6s) | 0.00 | 1.45 | antiferromagnetic | 0.00 | 0.00 | paramagnetic |
Disclaimer/Publisher’s Note: The statements, opinions and data contained in all publications are solely those of the individual author(s) and contributor(s) and not of MDPI and/or the editor(s). MDPI and/or the editor(s) disclaim responsibility for any injury to people or property resulting from any ideas, methods, instructions or products referred to in the content. |
© 2023 by the authors. Licensee MDPI, Basel, Switzerland. This article is an open access article distributed under the terms and conditions of the Creative Commons Attribution (CC BY) license (https://creativecommons.org/licenses/by/4.0/).
Share and Cite
Kuznetsov, V.G.; Gavrikov, A.A.; Krbal, M.; Trepakov, V.A.; Kolobov, A.V. Amorphous As2S3 Doped with Transition Metals: An Ab Initio Study of Electronic Structure and Magnetic Properties. Nanomaterials 2023, 13, 896. https://doi.org/10.3390/nano13050896
Kuznetsov VG, Gavrikov AA, Krbal M, Trepakov VA, Kolobov AV. Amorphous As2S3 Doped with Transition Metals: An Ab Initio Study of Electronic Structure and Magnetic Properties. Nanomaterials. 2023; 13(5):896. https://doi.org/10.3390/nano13050896
Chicago/Turabian StyleKuznetsov, Vladimir G., Anton A. Gavrikov, Milos Krbal, Vladimir A. Trepakov, and Alexander V. Kolobov. 2023. "Amorphous As2S3 Doped with Transition Metals: An Ab Initio Study of Electronic Structure and Magnetic Properties" Nanomaterials 13, no. 5: 896. https://doi.org/10.3390/nano13050896