
Experimental Study of As-Cast and Heat-Treated Single-Crystal Ni-Based Superalloy Interface Using TEM
 ,
,
Abstract
:1. Introduction
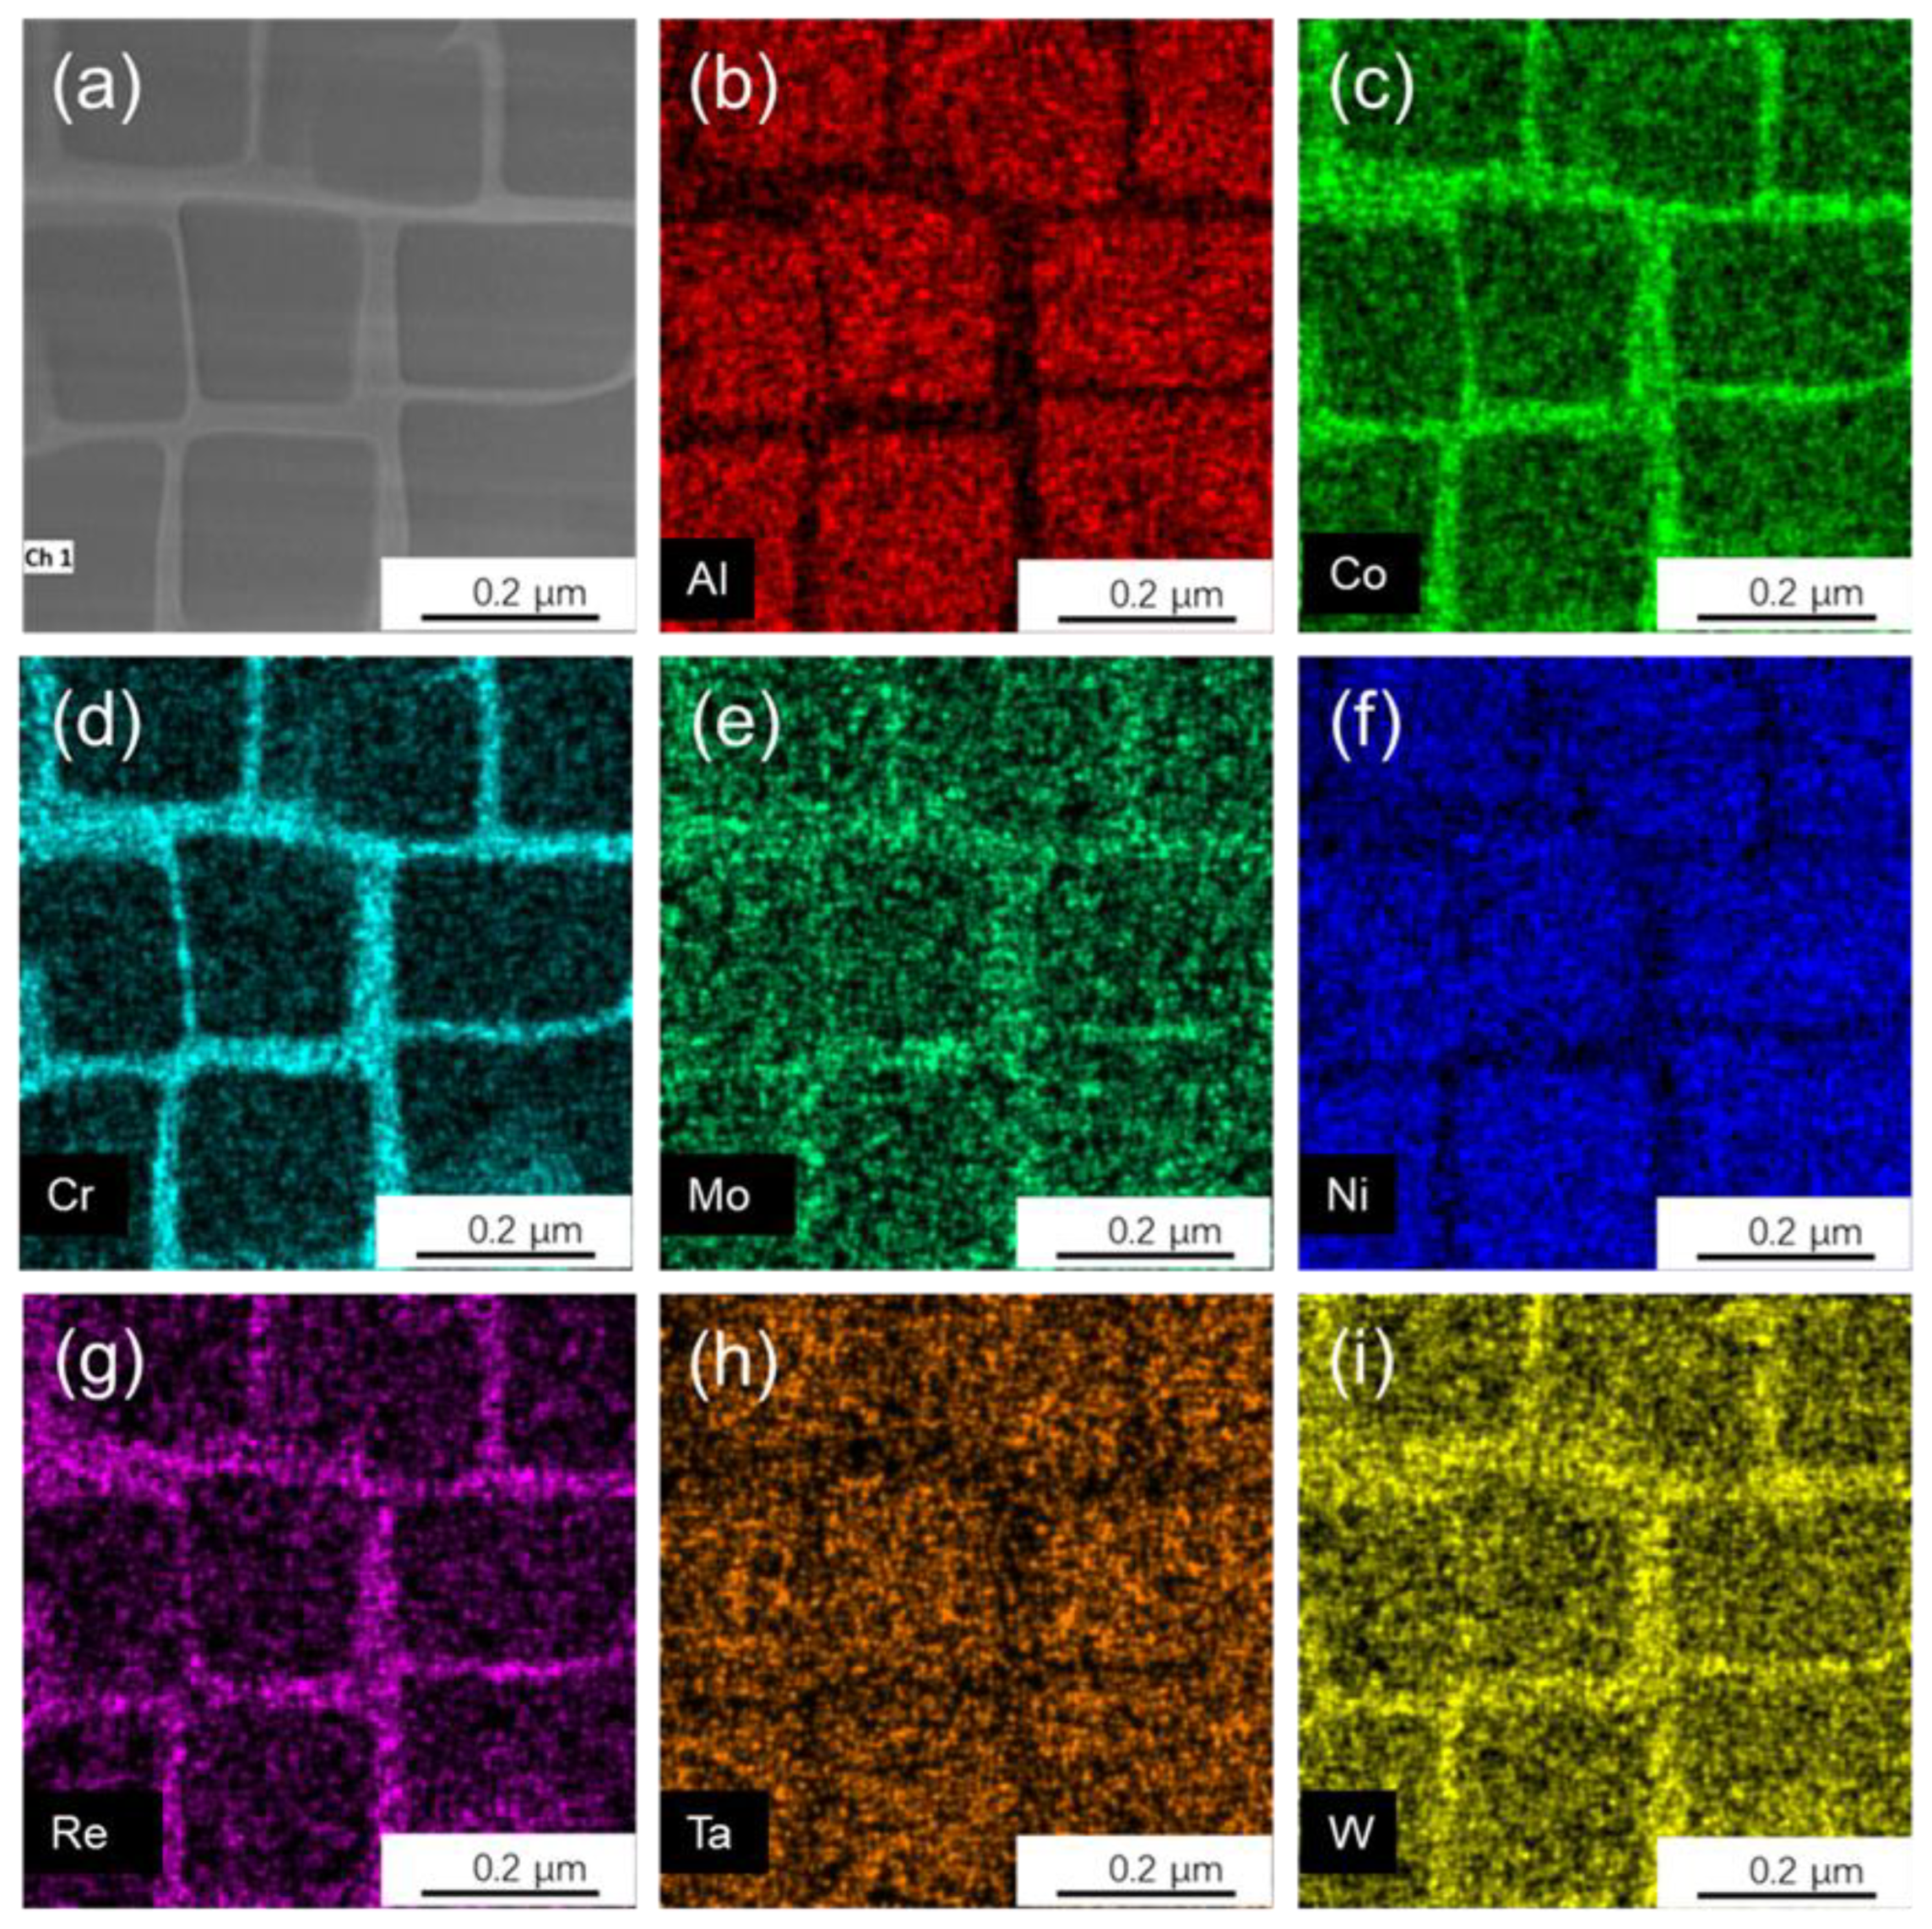
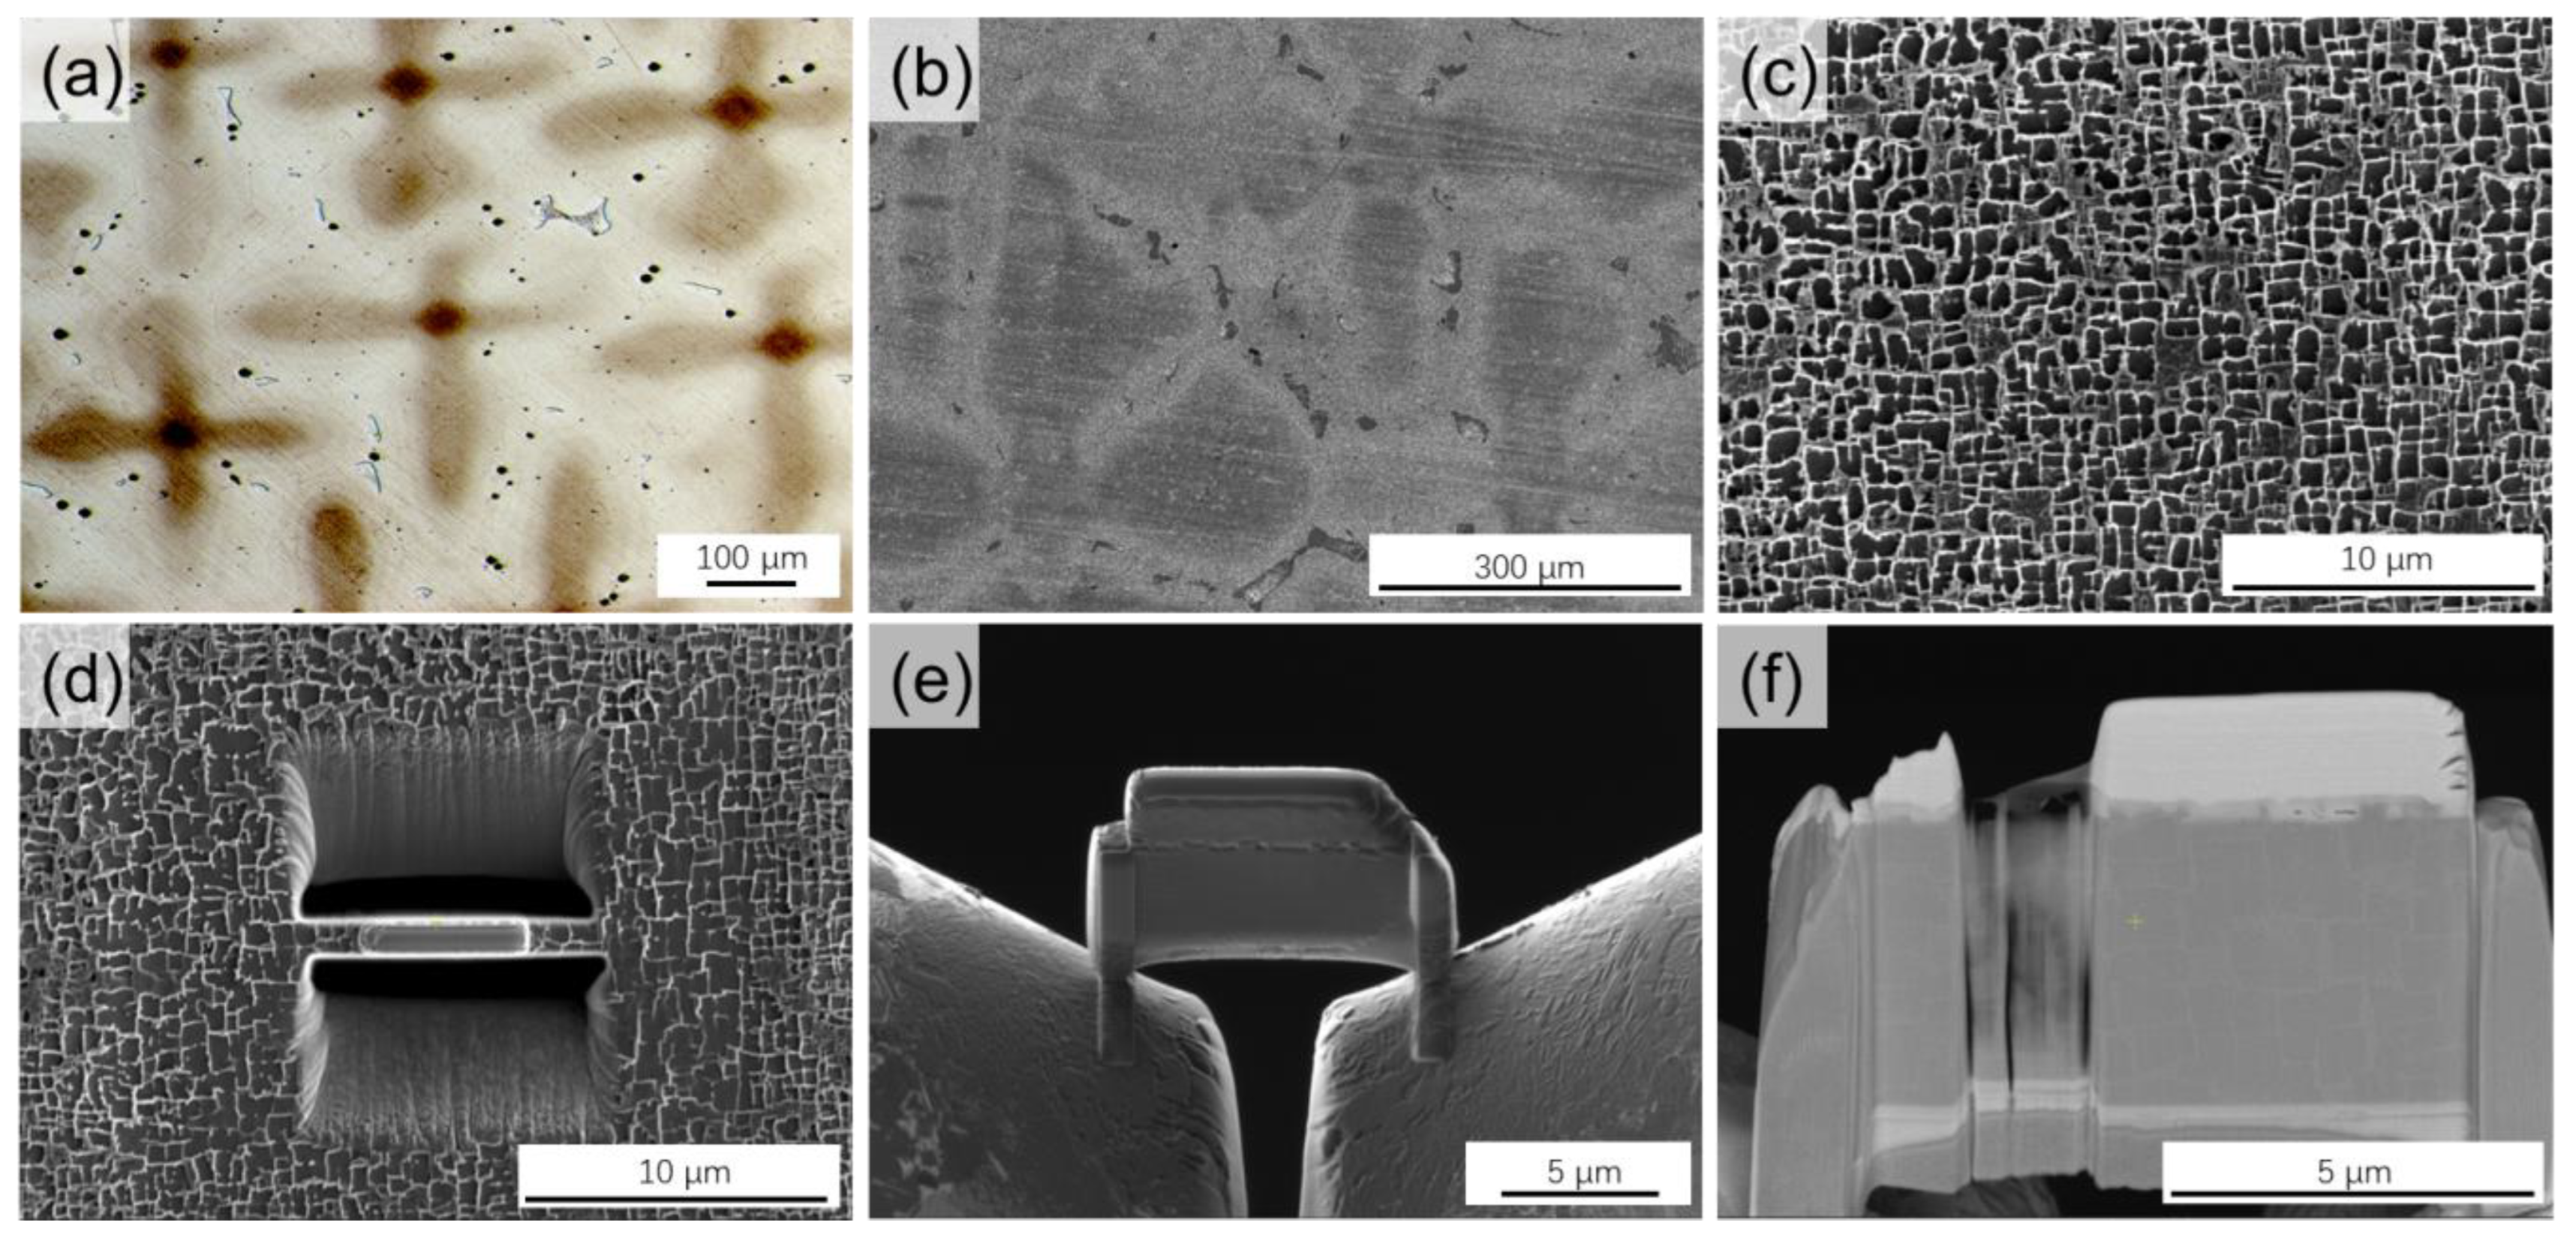
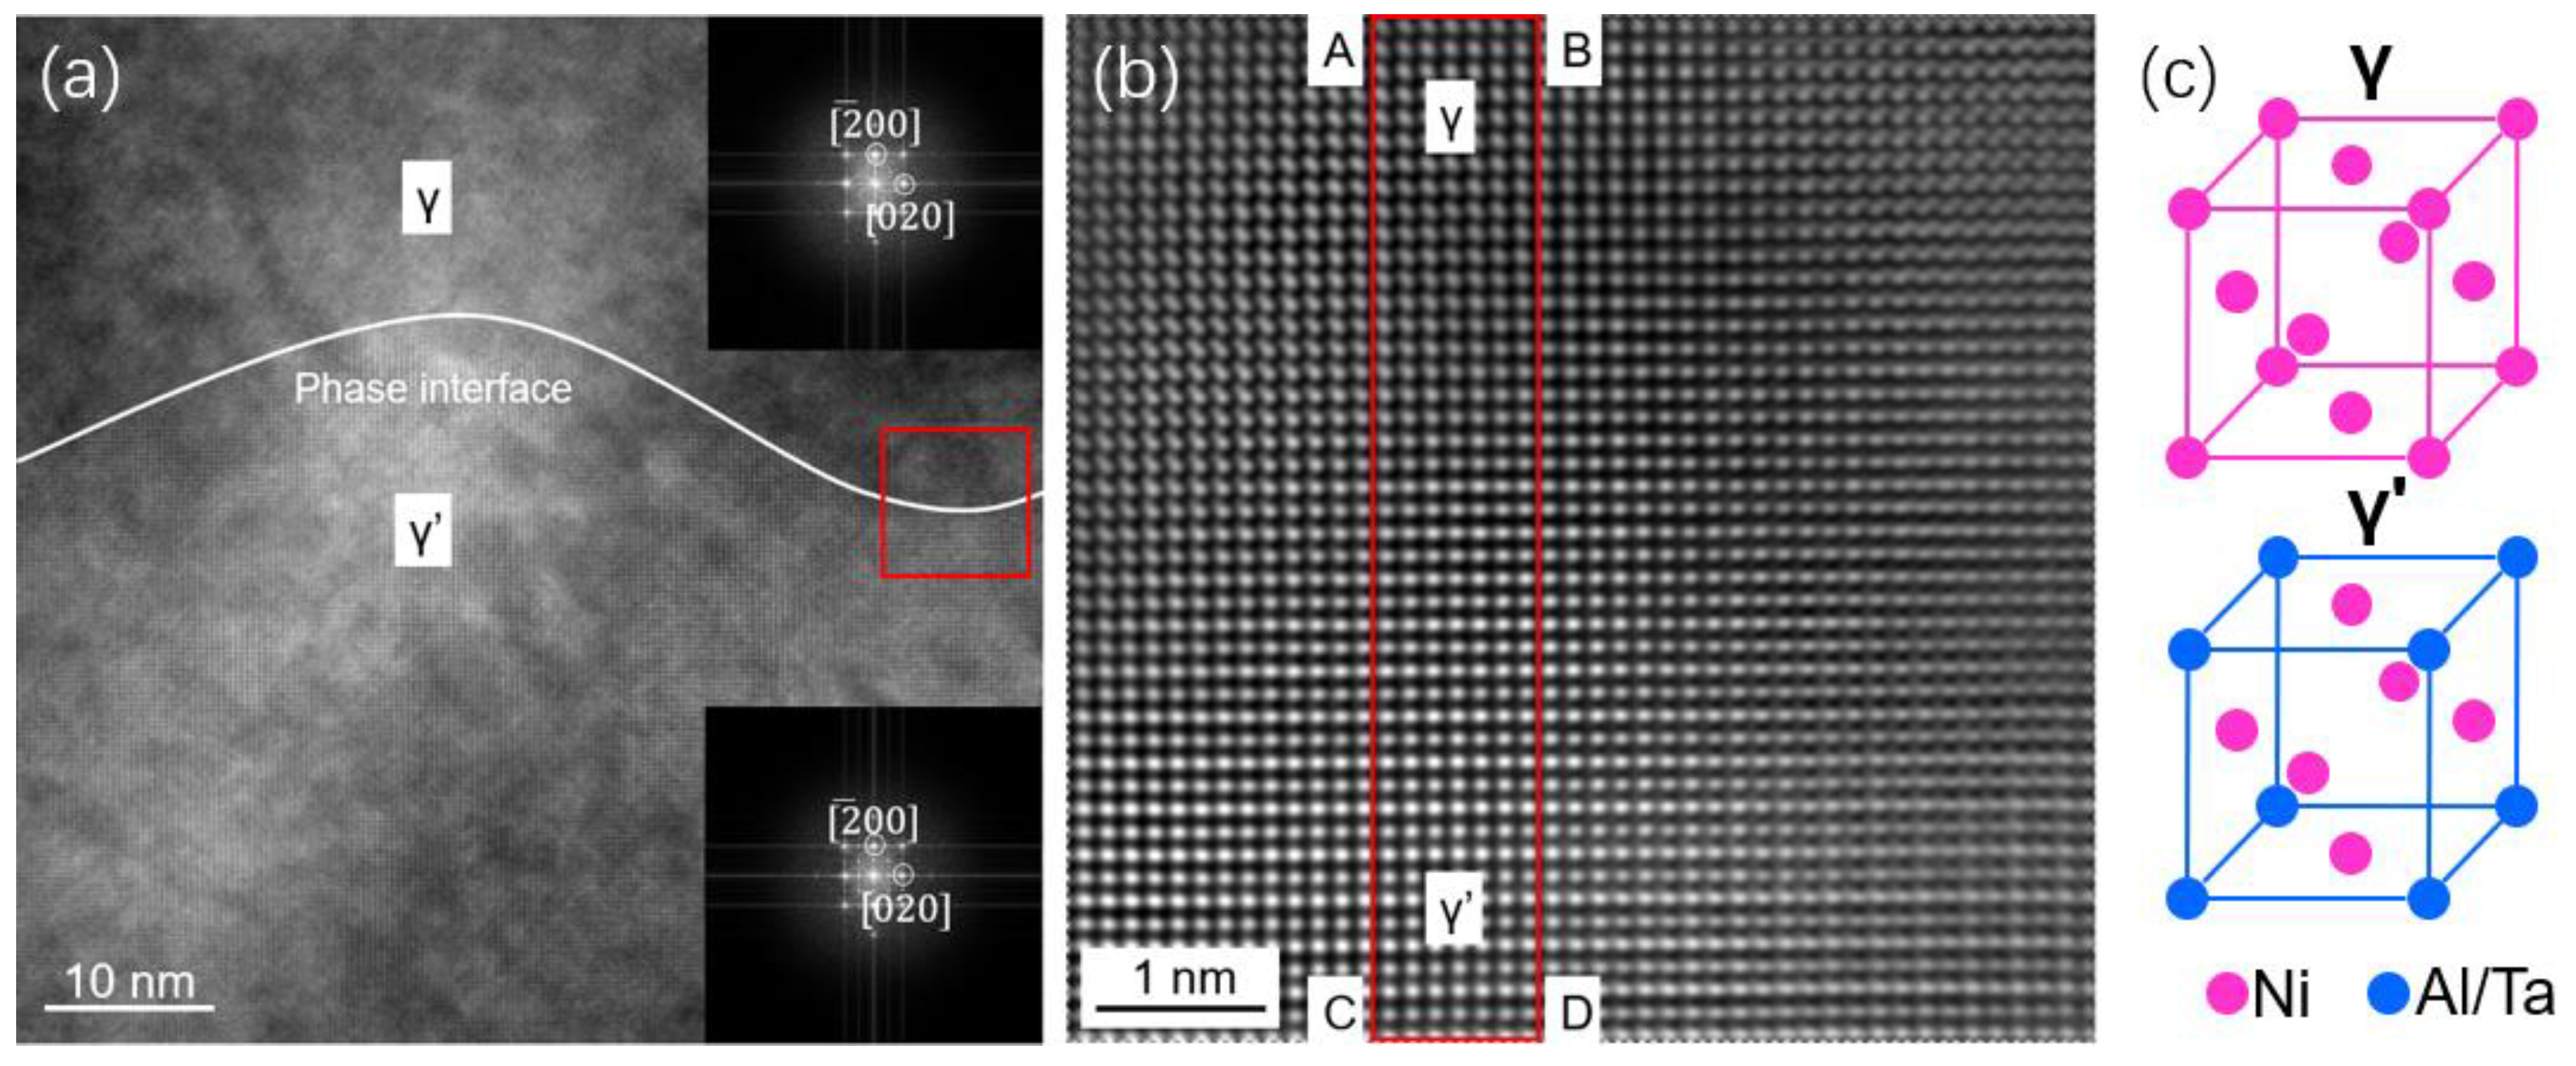
2. Materials and Methods
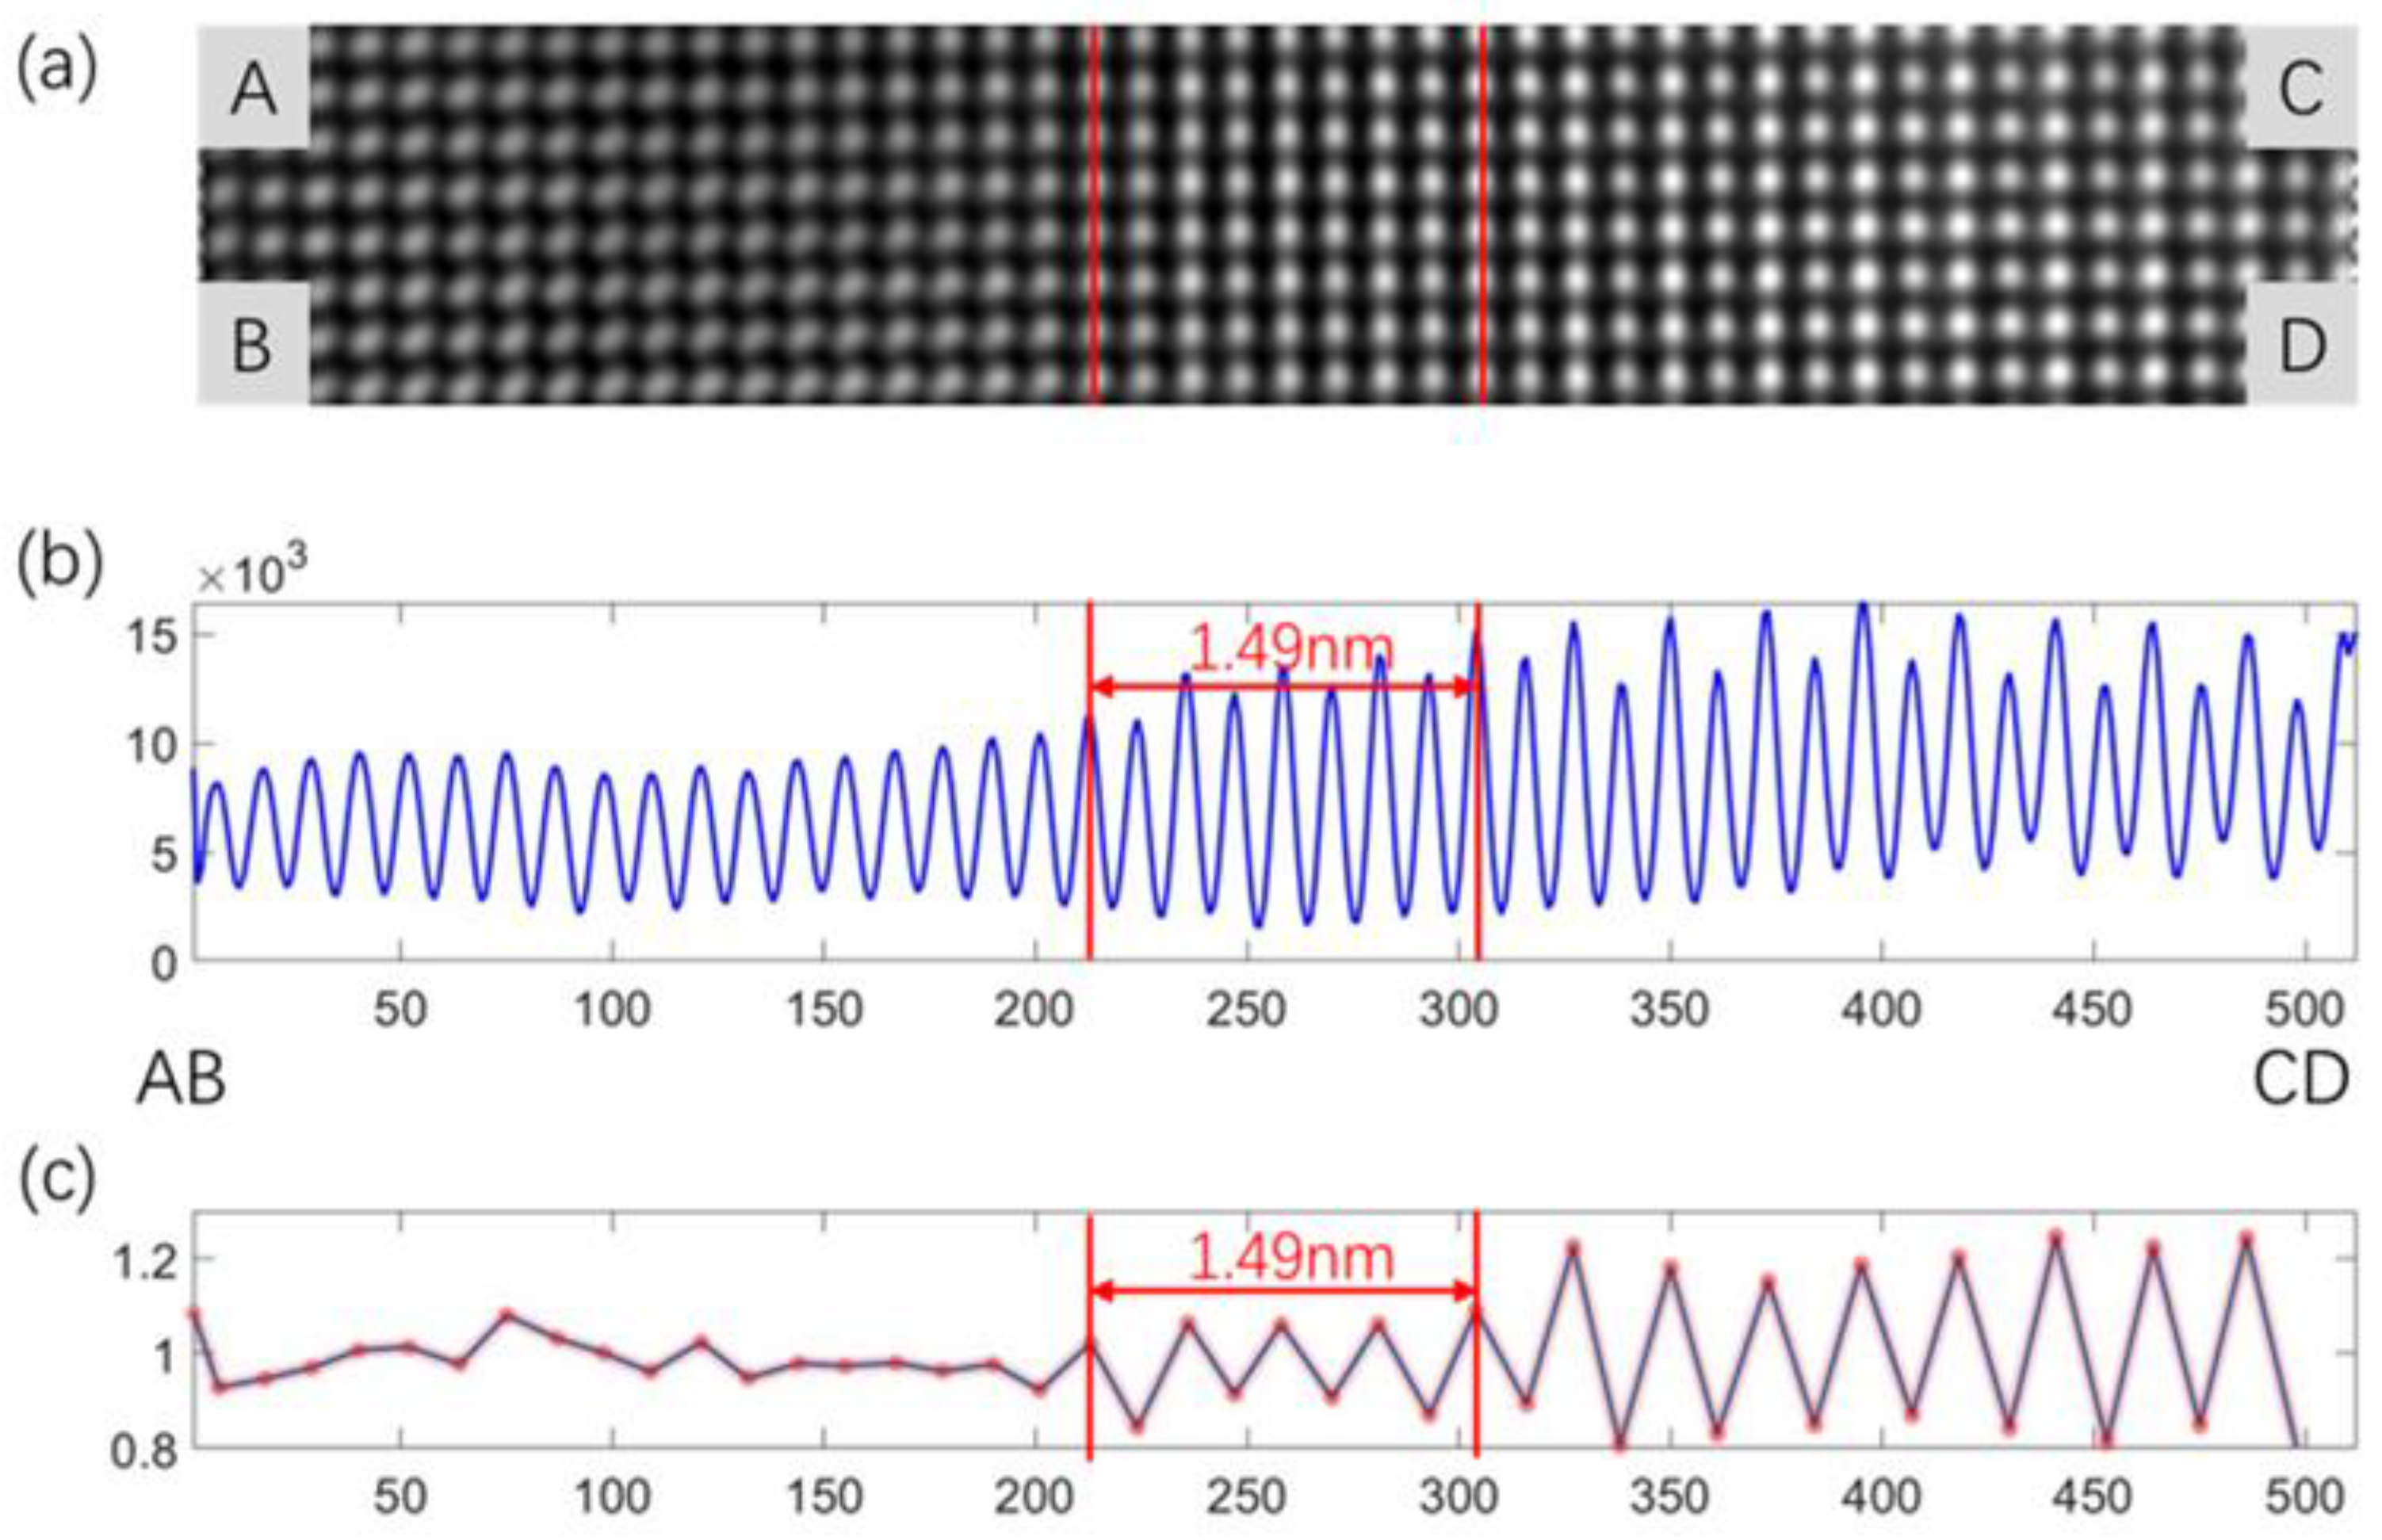
3. Results and Discussion
3.1. Dendritic in AS-Cast Sample
3.2. Dendrite in As-Cast Sample
3.3. Interdendrite in a Solid Solution Heat-Treated Sample
3.4. Dendrite in a Solid Solution Heat-Treated Sample
4. Conclusions
- (1)
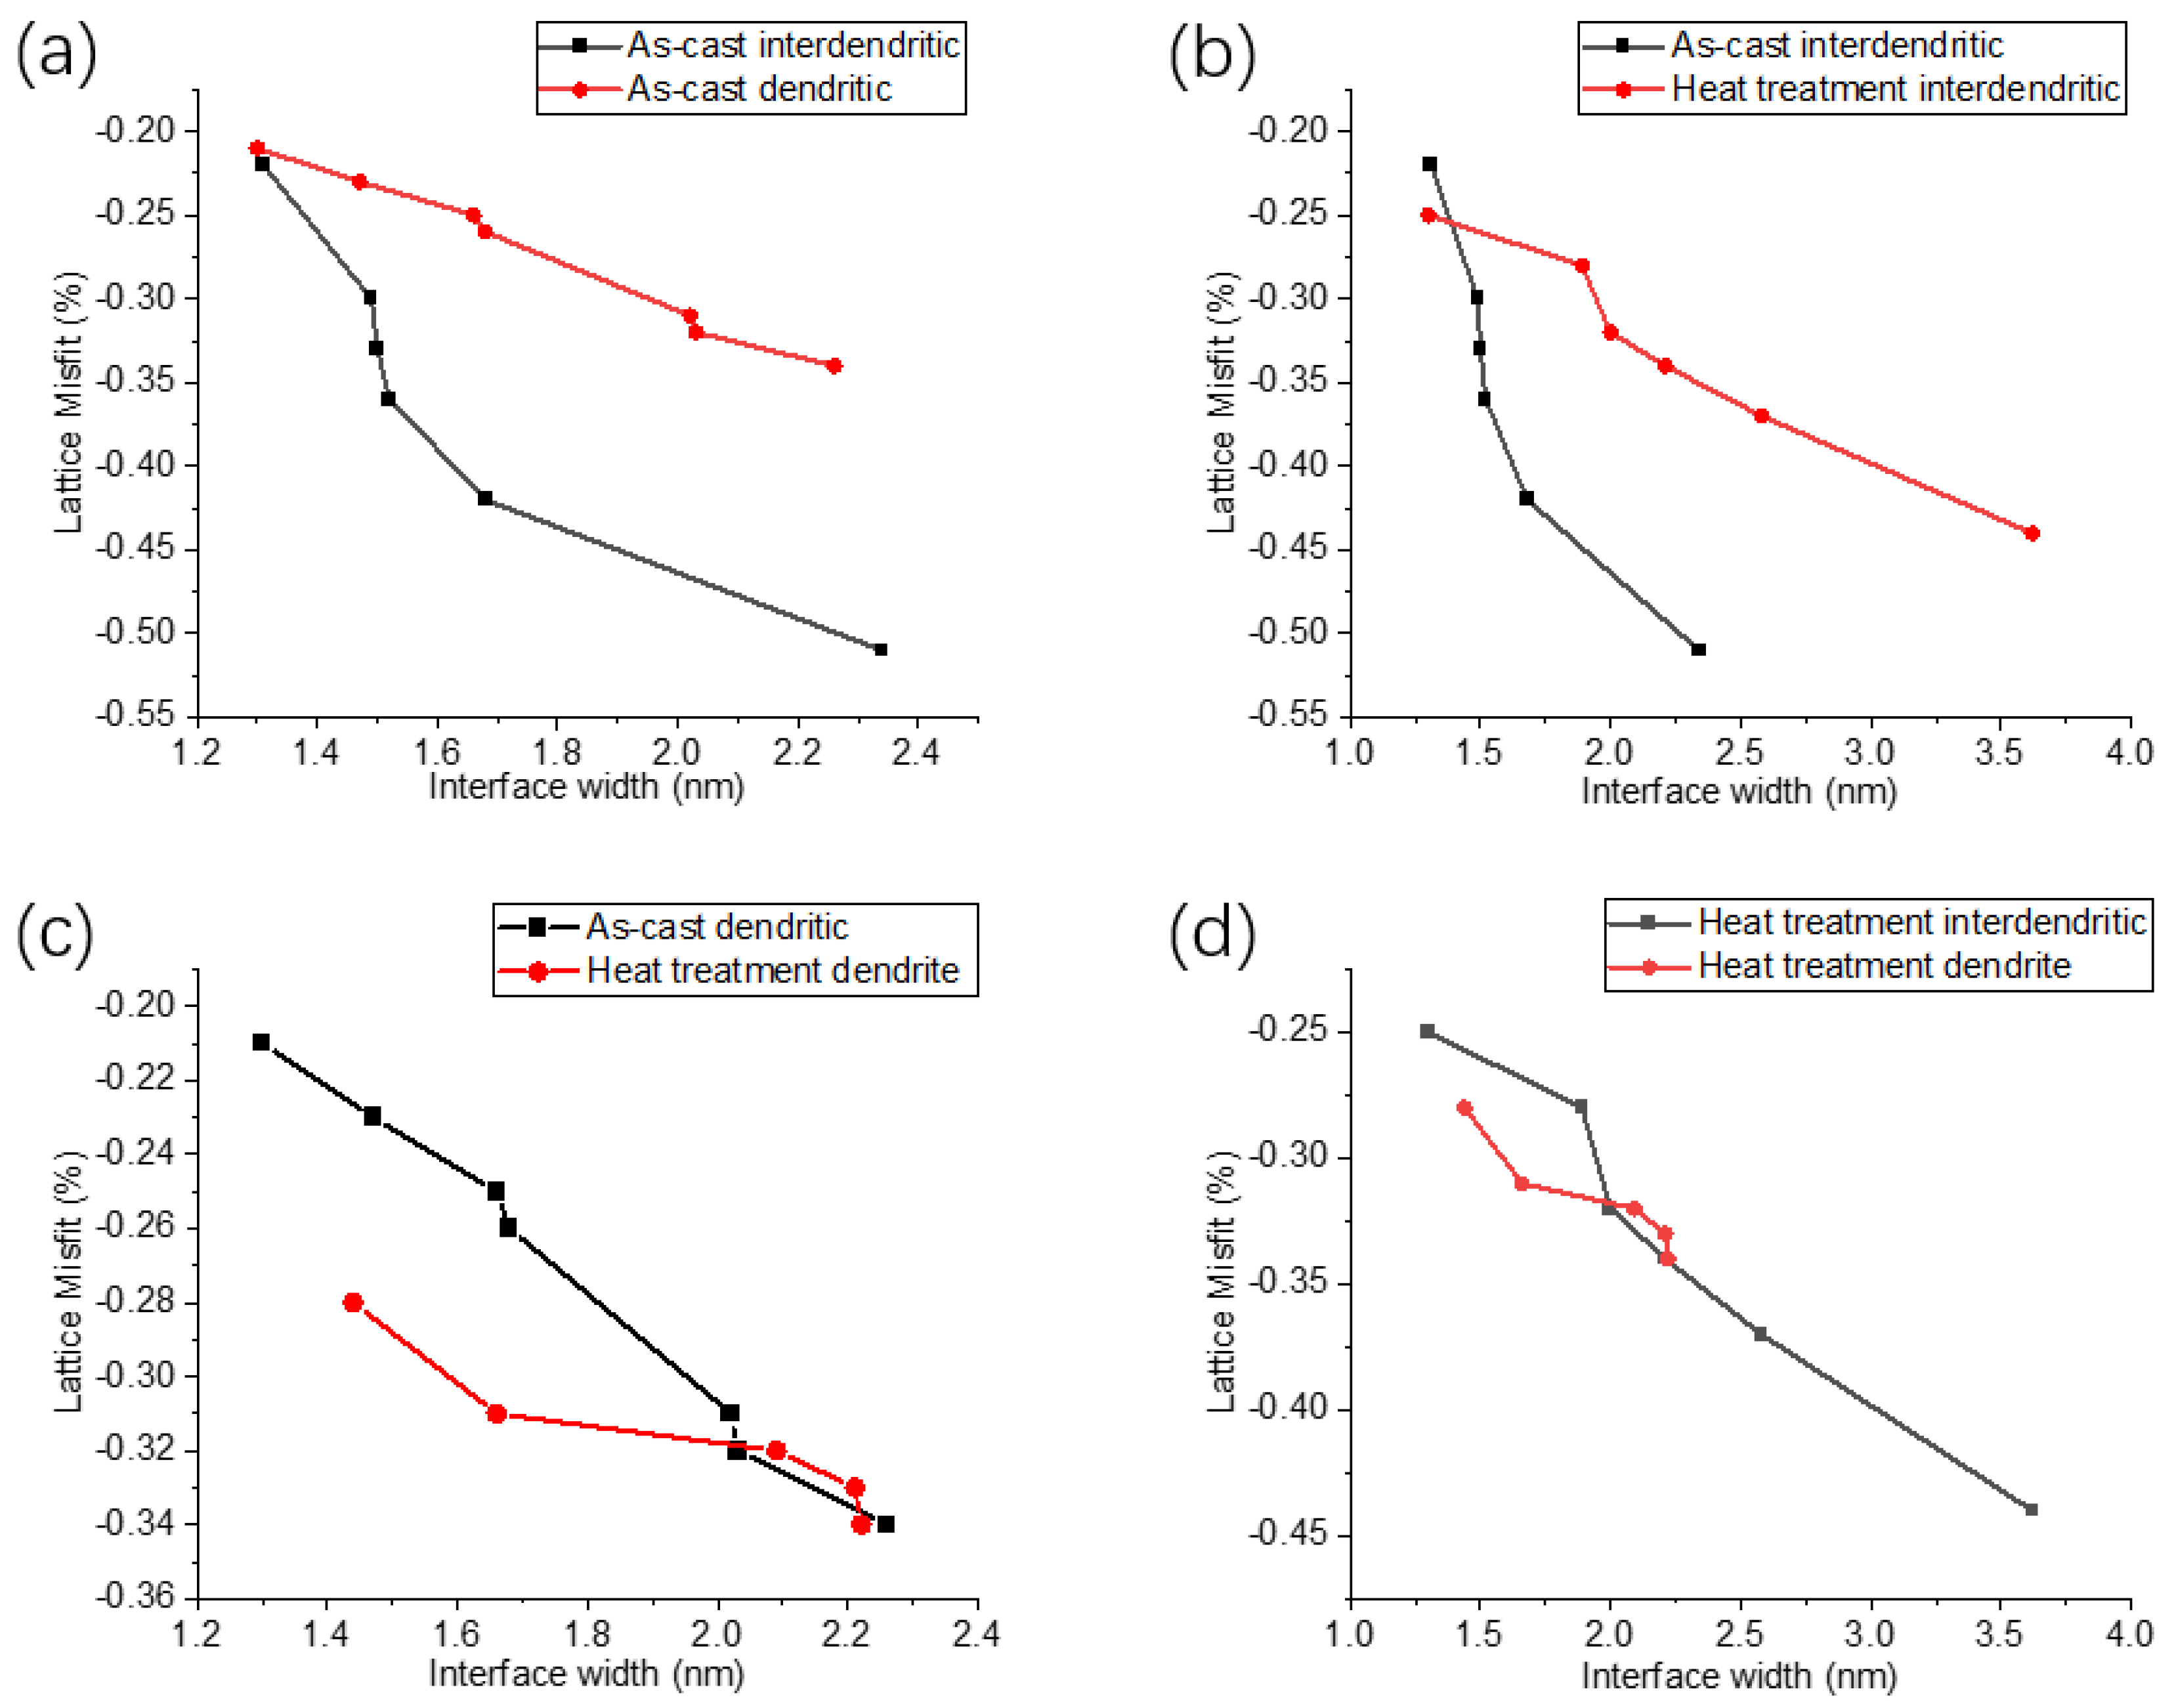
- The two-phase interface width in the dendritic region of as-cast SX Ni-based superalloy is larger than that in the interdendritic region. The misfit in the dendritic region is larger than that in the interdendritic region, which has a negative development trend;
- (2)
- There is a common law between the as-cast interdendritic and dendritic regions, which states that as the phase interface width increases, so does the absolute value of the misfit between the two phases;
- (3)
- The comparison of as-cast and heat-treated interdendritic samples reveals that after heat treatment, the phase interface width in the interdendritic region increases, the misfit decreases, the phase lattice constant increases, and the phase lattice constant decreases. By comparing the as-cast and heat-treated dendrites, it is found that the absolute value of the misfit of the as-cast dendrite sample is significantly smaller than that of the heat-treated sample, and the misfit between the two phases increases with the interface width;
- (4)
- The comparison between heat-treated interdendritic samples and heat-treated dendritic samples showed that the absolute value of the misfit between the two phases of the heat-treated interdendritic samples is smaller than that of the dendritic samples, and the absolute value of the misfit between the two phases also increases with the phase interface width.
Author Contributions
Funding
Data Availability Statement
Conflicts of Interest
References
- Pollock, T.M.; Tin, S. Nickel-based superalloys for advanced turbine engines: Chemistry, microstructure and properties. J. Propuls. Power 2006, 22, 361–374. [Google Scholar]
- Alizadeh-Sh, M.; Marashi, S.; Ranjbarnodeh, E.; Shoja-Razavi, R.; Oliveira, J. Prediction of solidification cracking by an empirical-statistical analysis for laser cladding of Inconel 718 powder on a non-weldable substrate. Opt. Laser Technol. 2020, 128, 106244. [Google Scholar]
- Li, S.; Li, J.; Jiang, Z.; Cheng, Y.; Li, Y.; Tang, S.; Leng, J.; Chen, H.; Zou, Y.; Zhao, Y. Controlling the columnar-to-equiaxed transition during Directed Energy Deposition of Inconel 625. Addit. Manuf. 2022, 57, 102958. [Google Scholar]
- Ramsperger, M.; Mújica Roncery, L.; Lopez-Galilea, I.; Singer, R.F.; Theisen, W.; Körner, C. Solution heat treatment of the single crystal nickel-base superalloy CMSX-4 fabricated by selective electron beam melting. Adv. Eng. Mater. 2015, 17, 1486–1493. [Google Scholar]
- Paraschiv, A.; Matache, G.; Puscasu, C. The effect of heat treatment on the homogenization of CMSX-4 Single-Crystal Ni-Based Superalloy. Transp. Res. Procedia 2018, 29, 303–311. [Google Scholar]
- Völkl, R.; Glatzel, U.; Feller-Kniepmeier, M. Measurement of the lattice misfit in the single crystal nickel based superalloys CMSX-4, SRR99 and SC16 by convergent beam electron diffraction. Acta Mater. 1998, 46, 4395–4404. [Google Scholar]
- Brückner, U.; Epishin, A.; Link, T.; Dressel, K. The influence of the dendritic structure on the γ/γ′-lattice misfit in the single-crystal nickel-base superalloy CMSX-4. Mater. Sci. Eng. A 1998, 247, 23–31. [Google Scholar]
- Colín, J.; Serna, S.; Campillo, B.; Rodríguez, R.; Juárez-Islas, J. Effect of Cu additions over the lattice parameter and hardness of the NiAl intermetallic compound. J. Alloy. Compd. 2010, 489, 26–29. [Google Scholar]
- Mishima, Y.; Ochiai, S.; Suzuki, T. Lattice parameters of Ni (γ), Ni3Al (γ’) and Ni3Ga (γ’) solid solutions with additions of transition and B-subgroup elements. Acta Metall. 1985, 33, 1161–1169. [Google Scholar]
- Liu, C.-M.; Cheng, H.-C.; Chao, C.-Y.; Ou, K.-L. Phase transformation of high temperature on Fe–Al–Mn–Cr–C alloy. J. Alloy. Compd. 2009, 488, 52–56. [Google Scholar]
- Harada, H.; Ishida, A.; Murakami, Y.; Bhadeshia, H.; Yamazaki, M. Atom-probe microanalysis of a nickel-base single crystal superalloy. Appl. Surf. Sci. 1993, 67, 299–304. [Google Scholar]
- Li, Y.; Shang, X.; Zhai, M.; Yu, L.; Wang, L.; Zhao, S. Surface characteristics and microstructure evolution of a nickel-base single crystal superalloy treated by ultrasonic shot peening. J. Alloy. Compd. 2022, 919, 165761. [Google Scholar]
- Luo, Z.P.; Wu, Z.T.; Miller, D.J. The dislocation microstructure of a nickel-base single-crystal superalloy after tensile fracture. Mater. Sci. Eng. A 2003, 354, 358–368. [Google Scholar] [CrossRef]
- Yang, X.; Wang, F.-H.; Wang, W.-L.; Liu, S.-F.; Chen, Y.-Q.; Tang, H.-P. Comparison of two-step surface treatment on surface roughness and corrosion resistance of TC4 alloy parts prepared by SLM and SEBM. J. Alloy. Compd. 2022, 921, 165929. [Google Scholar]
- Shu, D.; Tian, S.; Liu, L.; Zhang, B.; Tian, N. Elements distribution and deformation features of a 4.5% Re nickel-based single crystal superalloy during creep at high temperature. Mater. Charact. 2018, 141, 433–441. [Google Scholar] [CrossRef]
- Srinivasan, R.; Banerjee, R.; Viswanathan, G.; Nag, S.; Hwang, J.; Tiley, J.; Fraser, H. The use of advanced characterization to study transitions across solid state interfaces. Jom 2010, 62, 64–69. [Google Scholar]
- Seidman, D.N. Three-Dimensional Atom-Probe Tomography: Advances and Applications. Annu. Rev. Mater. Res. 2007, 37, 127–158. [Google Scholar] [CrossRef]
- Hwang, J.Y.; Nag, S.; Singh, A.R.P.; Srinivasan, R.; Tiley, J.; Fraser, H.L.; Banerjee, R. Evolution of the γ/γ′ interface width in a commercial nickel base superalloy studied by three-dimensional atom probe tomography. Scr. Mater. 2009, 61, 92–95. [Google Scholar] [CrossRef]
- Ge, B.; Luo, Y.; Li, J.; Zhu, J.; Tang, D.; Gui, Z. Study of γ/γ′ interfacial width in a nickel-based superalloy by scanning transmission electron microscopy. Philos. Mag. Lett. 2012, 92, 541–546. [Google Scholar] [CrossRef]
- Meher, S.; Viswanathan, G.B.; Nag, S.; Fraser, H.L.; Banerjee, R. Determination of the gamma prime/gamma interface width in a Co–Al–W alloy via coupled aberration-corrected scanning transmission electron microscopy and atom probe tomography. Scr. Mater. 2016, 121, 23–27. [Google Scholar] [CrossRef]
- Zhang, H.; Wen, H.; Liu, Z.; Zhang, Q.; Xie, H. TEM nano-Moiré evaluation for an invisible lattice structure near the grain interface. Nanoscale 2017, 9, 15923–15933. [Google Scholar]
- He, R.; Zhang, H.; Liu, Z.; Wen, H.; Xie, H. Interphase interface structure and evolution of a single crystal Ni-based superalloy based on HRTEM image analysis. Appl. Opt. 2022, 61, 563–569. [Google Scholar] [CrossRef]
- Hÿtch, M.; Snoeck, E.; Kilaas, R. Quantitative measurement of displacement and strain fields from HREM micrographs. Ultramicroscopy 1998, 74, 131–146. [Google Scholar]
- Parsa, A.B.; Wollgramm, P.; Buck, H.; Somsen, C.; Kostka, A.; Povstugar, I.; Choi, P.P.; Raabe, D.; Dlouhy, A.; Müller, J. Advanced scale bridging microstructure analysis of single crystal Ni-base superalloys. Adv. Eng. Mater. 2015, 17, 216–230. [Google Scholar]
- Tan, X.; Liu, J.; Song, X.; Jin, T.; Sun, X.; Hu, Z. Measurements of γ/γ’ lattice misfit and γ’volume fraction for a Ru-containing nickel-based single crystal superalloy. J. Mater. Sci. Technol. 2011, 27, 899–905. [Google Scholar]
- Brunetti, G.; Settefrati, A.; Hazotte, A.; Denis, S.; Fundenberger, J.-J.; Tidu, A.; Bouzy, E. Determination of γ–γ′ lattice misfit in a single-crystal nickel-based superalloy using convergent beam electron diffraction aided by finite element calculations. Micron 2012, 43, 396–406. [Google Scholar]
- Lahrman, D.; Field, R.; Darolia, R.; Fraser, H. Investigation of techniques for measuring lattice mismatch in a rhenium containing nickel base superalloy. Acta Metall. 1988, 36, 1309–1320. [Google Scholar]
- Huang, S.; An, K.; Gao, Y.; Suzuki, A. Determination of γ/γ′ Lattice Misfit in Ni-Based Single-Crystal Superalloys at High Temperatures by Neutron Diffraction. Metall. Mater. Trans. A 2018, 49, 740–751. [Google Scholar] [CrossRef]
- Wu, E.; Sun, G.; Chen, B.; Pirling, T.; Hughes, D.J.; Wang, S.; Zhang, J. A neutron diffraction study of lattice distortion, mismatch and misorientation in a single-crystal superalloy after different heat treatments. Acta Mater. 2013, 61, 2308–2319. [Google Scholar]
- Liu, J.; Zhang, L.; Ge, G. A study of residual Ti3Al in γ(TiAl) sheets using mismatch theory. Mater. Lett. 2020, 278, 128423. [Google Scholar] [CrossRef]
- Hoelzel, M.; Del Genovese, D.; Gilles, R.; Mukherji, D.; Toebbens, D.M.; Roesler, J.; Fuess, H. Phase analysis and lattice mismatches in superalloys DT706 and Inconel 706. Phys. B Condens. Matter 2006, 385, 594–596. [Google Scholar] [CrossRef]
- Minggang, W.; Sugui, T.; Xingfu, Y.; Benjian, Q. Influences of Element Re and Temperatures on the Lattice Parameter and Misfit of Single-Crystal Nickel-Based Superalloys. Rare Met. Mater. Eng. 2010, 39, 268–272. [Google Scholar]
- Giannuzzi, L.A.; Stevie, F.A. A review of focused ion beam milling techniques for TEM specimen preparation. Micron 1999, 30, 197–204. [Google Scholar]
- Pyczak, F.; Devirent, B.; Mughrabi, H. The Effects of Different Alloying Elements on the Thermal Expansion Coefficients, Lattice Constants and Misfit of Nickel-Based Superalloys Investigated by X-Ray Diffraction. In Proceedings of the Superalloys 2004 (Tenth International Symposium), Seven Springs Mountain Resort in Champion, PA, USA, 19–23 September 2004; pp. 827–836. [Google Scholar]
- Srinivasan, R.; Banerjee, R.; Hwang, J.Y.; Viswanathan, G.B.; Tiley, J.; Dimiduk, D.M.; Fraser, H.L. Atomic scale structure and chemical composition across order-disorder interfaces. Phys. Rev. Lett. 2009, 102, 086101. [Google Scholar] [CrossRef]
- Oni, A.A.; Broderick, S.R.; Rajan, K.; LeBeau, J.M. Atom site preference and γ′/γ mismatch strain in Ni Al Co Ti superalloys. Intermetallics 2016, 73, 72–78. [Google Scholar] [CrossRef]
- Sugui, T.; Minggang, W.; Huichen, Y.; Xingfu, Y.; Tang, L.; Benjiang, Q. Influence of element Re on lattice misfits and stress rupture properties of single crystal nickel-based superalloys. Mater. Sci. Eng. A 2010, 527, 4458–4465. [Google Scholar] [CrossRef]
- Tan, X.-P.; Liu, J.-L.; Tao, J.; Sun, X.-F.; Hu, Z.-Q. Influence of Cr addition on microstructure of a 5% Re-containing single crystal nickel-based superalloy. Trans. Nonferrous Met. Soc. China 2011, 21, 1004–1008. [Google Scholar]
- Liu, S.-L.; Yang, H.-J. Assessing the critical role of Re and Co addition in flow stress of Ni-based single-crystal superalloy: A molecular dynamics study. Mater. Today Commun. 2022, 31, 103296. [Google Scholar]
- Duan, H.; Qin, L.; Pei, Y.; Li, S.; Zhao, L.-D.; Ji, V.; Gong, S. Investigations into the Surface Strain/Stress State in a Single-Crystal Superalloy via XRD Characterization. Metals 2018, 8, 376. [Google Scholar] [CrossRef]
- Ning, L.; Zheng, Z.; Jin, T.; Tang, S.; Liu, E.; Tong, J.; Yu, Y.; Sun, X. Effect of heat treatments on the microstructure and property of a new nickel base single crystal superalloy. Acta Metall. Sin. 2014, 50, 1011–1018. [Google Scholar]
- Carroll, L.J.; Feng, Q.; Mansfield, J.F.; Pollock, T.M. Elemental partitioning in Ru-containing nickel-base single crystal superalloys. Mater. Sci. Eng. A 2007, 457, 292–299. [Google Scholar] [CrossRef]
- Heckl, A.; Neumeier, S.; Göken, M.; Singer, R.F. The effect of Re and Ru on γ/γ′ microstructure, γ-solid solution strengthening and creep strength in nickel-base superalloys. Mater. Sci. Eng. A 2011, 528, 3435–3444. [Google Scholar] [CrossRef]
- Song, W.; Wang, X.; Li, J.; Ye, L.; Hou, G.; Yang, Y.; Liu, J.; Liu, J.; Pei, W.; Zhou, Y. Effect of ruthenium on microstructure and high-temperature creep properties of fourth generation Ni-based single-crystal superalloys. Mater. Sci. Eng. A 2020, 772, 138646. [Google Scholar]
- Pengjie, Z.; Dehang, S.; Xinkang, G.; Yinbing, L. Role of Hf and Re on the lattice misfit between γ/γ′ of Co-Ti-V superalloys. J. Aeronaut. Mater. 2021, 41, 45–52. [Google Scholar]
- Zenk, C.H.; Neumeier, S.; Stone, H.J.; Göken, M. Mechanical properties and lattice misfit of γ/γ′ strengthened Co-base superalloys in the Co–W–Al–Ti quaternary system. Intermetallics 2014, 55, 28–39. [Google Scholar] [CrossRef]


| No. | Interface Width | Misfit | Lattice Constant (γ) | Lattice Constant (γ’) |
|---|---|---|---|---|
| 1 | 2.34 nm | −0.51% | 0.36897 | 0.36708 |
| 2 | 1.68 nm | −0.42% | 0.37213 | 0.37056 |
| 3 | 1.49 nm | −0.30% | 0.37128 | 0.37018 |
| 4 | 1.31 nm | −0.22% | 0.36856 | 0.36776 |
| 5 | 1.50 nm | −0.33% | 0.37152 | 0.37030 |
| 6 | 1.52 nm | −0.36% | 0.37225 | 0.37090 |
| No. | Interface Width | Misfit | Lattice Constant (γ) | Lattice Constant (γ’) |
|---|---|---|---|---|
| 1 | 2.26 nm | −0.34% | 0.37514 | 0.37386 |
| 2 | 1.47 nm | −0.23% | 0.36716 | 0.36629 |
| 3 | 2.02 nm | −0.31% | 0.36710 | 0.36598 |
| 4 | 1.66 nm | −0.25% | 0.37180 | 0.37088 |
| 5 | 1.30 nm | −0.21% | 0.36974 | 0.36896 |
| 6 | 1.68 nm | −0.26% | 0.37070 | 0.36976 |
| 7 | 2.03 nm | −0.32% | 0.37132 | 0.37014 |
| No. | Interface Width | Misfit | Lattice Constant (γ) | Lattice Constant (γ’) |
|---|---|---|---|---|
| 1 | 2.58 nm | −0.37% | 0.36952 | 0.36816 |
| 2 | 2.21 nm | −0.34% | 0.36948 | 0.36824 |
| 3 | 1.89 nm | −0.28% | 0.36273 | 0.36172 |
| 4 | 1.30 nm | −0.25% | 0.37098 | 0.37006 |
| 5 | 2.00 nm | −0.32% | 0.36743 | 0.36624 |
| 6 | 3.62 nm | −0.44% | 0.37184 | 0.37018 |
| No. | Interface Width | Misfit | Lattice Constant (γ) | Lattice Constant (γ’) |
|---|---|---|---|---|
| 1 | 2.22 nm | −0.34% | 0.37096 | 0.36972 |
| 2 | 1.44 nm | −0.28% | 0.36458 | 0.36356 |
| 3 | 2.21 nm | −0.33% | 0.37262 | 0.37142 |
| 4 | 2.09 nm | −0.32% | 0.37274 | 0.37158 |
| 5 | 1.66 nm | −0.31% | 0.37138 | 0.37024 |
Disclaimer/Publisher’s Note: The statements, opinions and data contained in all publications are solely those of the individual author(s) and contributor(s) and not of MDPI and/or the editor(s). MDPI and/or the editor(s) disclaim responsibility for any injury to people or property resulting from any ideas, methods, instructions or products referred to in the content. |
© 2023 by the authors. Licensee MDPI, Basel, Switzerland. This article is an open access article distributed under the terms and conditions of the Creative Commons Attribution (CC BY) license (https://creativecommons.org/licenses/by/4.0/).
Share and Cite
He, R.; Li, M.; Han, X.; Feng, W.; Zhang, H.; Xie, H.; Liu, Z. Experimental Study of As-Cast and Heat-Treated Single-Crystal Ni-Based Superalloy Interface Using TEM. Nanomaterials 2023, 13, 608. https://doi.org/10.3390/nano13030608
He R, Li M, Han X, Feng W, Zhang H, Xie H, Liu Z. Experimental Study of As-Cast and Heat-Treated Single-Crystal Ni-Based Superalloy Interface Using TEM. Nanomaterials. 2023; 13(3):608. https://doi.org/10.3390/nano13030608
Chicago/Turabian StyleHe, Runjun, Miao Li, Xiao Han, Wei Feng, Hongye Zhang, Huimin Xie, and Zhanwei Liu. 2023. "Experimental Study of As-Cast and Heat-Treated Single-Crystal Ni-Based Superalloy Interface Using TEM" Nanomaterials 13, no. 3: 608. https://doi.org/10.3390/nano13030608