Article

Efficient Detection of Nerve Agents through Carbon Nitride Quantum Dots: A DFT Approach

1
Department of Chemistry, College of Science, King Faisal University, Al-Ahsa 31982, Saudi Arabia
2
Department of Chemistry, COMSATS University Islamabad, Abbottabad Campus, Abbottabad 22060, Pakistan
3
Centre for Computational Materials Science, University of Malakand, Chakdara 18800, Pakistan
4
Department of Chemistry, University of Malakand, Chakdara 18800, Pakistan
5
Department of Physics, Abbottabad University of Science & Technology, Abbottabad 22010, Pakistan
6
Chemical Sciences, Faculty of Science, Universiti Brunei Darussalam, Jalan Tungku Link, Gadong BE1410, Brunei
*
Authors to whom correspondence should be addressed.
Nanomaterials 2023, 13(2), 251; https://doi.org/10.3390/nano13020251
Submission received: 22 December 2022 / Revised: 29 December 2022 / Accepted: 1 January 2023 / Published: 6 January 2023
(This article belongs to the Special Issue Nanomaterials in Sensing Applications)

Abstract

:
V-series nerve agents are very lethal to health and cause the inactivation of acetylcholinesterase which leads to neuromuscular paralysis and, finally, death. Therefore, rapid detection and elimination of V-series nerve agents are very important. Herein, we have carried out a theoretical investigation of carbon nitride quantum dots (C2N) as an electrochemical sensor for the detection of V-series nerve agents, including VX, VS, VE, VG, and VM. Adsorption of V-series nerve agents on C2N quantum dots is explored at M05-2X/6-31++G(d,p) level of theory. The level of theory chosen is quite adequate in systems describing non-bonding interactions. The adsorption behavior of nerve agents is characterized by interaction energy, non-covalent interaction (NCI), Bader’s quantum theory of atoms in molecules (QTAIM), frontier molecular orbital (FMO), electron density difference (EDD), and charge transfer analysis. The computed adsorption energies of the studied complexes are in the range of −12.93 to −17.81 kcal/mol, which indicates the nerve agents are physiosorbed onto C2N surface through non-covalent interactions. The non-covalent interactions between V-series and C2N are confirmed through NCI and QTAIM analysis. EDD analysis is carried out to understand electron density shifting, which is further validated by natural bond orbital (NBO) analysis. FMO analysis is used to estimate the changes in energy gap of C2N on complexation through HOMO-LUMO energies. These findings suggest that C2N surface is highly selective toward VX, and it might be a promising candidate for the detection of V-series nerve agents.

1. Introduction

V-series nerve agents are lethal organophosphorus compounds that can inhibit acetylcholinesterase present in the central nervous system. The inactivation of acetylcholinesterase results in the accumulation of acetylcholine in the synapse, which can lead to neuromuscular paralysis and, finally, death [1,2,3]. These nerve agents display a potential threat to the community due to their physical properties (odorless, colorless, high volatility), higher toxicity, facile synthesis, and rapid action [4]. V-series nerve agents are devastating weapons used by terrorists due to their dispersive and highly lethal nature [5,6]. For the last two decades, V-type nerve agents have been used in various terrorist attacks [7,8,9,10,11].
V-series are considered more potent than G-series due to their greater resistance to detoxification and higher stability [12]. Therefore, quick, effective analytical tools are required to detect V-type nerve agents that will help to prevent terrorist attacks utilizing these agents. A variety of alternative techniques have been developed and used, such as gas chromatography along with mass spectrometry [13,14], fluorescence spectroscopy [15], ion mobility spectrometry (IMS), desorption electrospray ionization (DESI) [16], paper-based sensors [17], and membrane technology [18]. Although the mentioned techniques are desirable to capture and destroy harmful CWAs, these techniques are accompanied by some drawbacks such as complex procedures, user-unfriendly, and being expensive. In contrast, electrochemical sensors are most commonly employed for the detection of various analytes due to their rapid response, low cost, user-friendly nature, and simplicity [19].
Literature reveals that several types of materials have been investigated as electrochemical sensors for rapid and selective detection of nerve agents and other lethal CWA. For example, magnesium oxide nano-sheets, 3D graphene, boron nitrite nano-sheets, metal organic frameworks (MOFs) [20,21,22], covalent organic frameworks (COFs) [23,24], graphitic carbon nitride [25], robust hydrophobic MOFs [26], chemo sensors [27], and graphene-based composite sensors [28,29] have been used in this regard. These materials show many valuable properties in the detection and destruction of toxic pollutants and harmful CWAs. Changes in electronic properties upon adsorption of aromatic analytes (coronene, benzene, circumcirumcoronene, and circumcoronene) over Cu(111) and Au(111) are described well through interface dipole interactions [30,31]. However, these materials possess a small surface area, low porosity, rapid deactivation, less active sites for adsorption, and low reproducibility. Thus, a space is available to explore new sensing material, which must exhibit rapid response, large surface area, high sensitivity, and selectivity.
Herein, we designed and studied nitrogen-containing carbon nitride quantum dots (C2N) as a sensor for the detection of V-series nerve agents [32]. The C2N quantum dots have shown some remarkable properties, such as greater thermal stability, high electron-rich nitrogen content, and high surface area [33]. C2N shows higher specific surface area, good thermal stability, and conductivity than other CN-based compounds. According to the study of Tian et al., the limit of thermal stability of different material composites with C2N in different stoichiometry is ≈700–750 °C [34]. We previously showed through MD simulations that the structure of C2N is quite stable beyond 400 °C [35]. Many promising applications of C2N have been reported in the literature, such as fluorescence spectroscopy [36] and photocatalysis [37,38,39,40]. Similarly, C2N has been extensively explored theoretically for hydrogen storage [41], selective detection of picric acid [42], detection of ammonia [43], and batteries [44,45]. Recently, 2D C2N surface has been investigated for the selective detection of NH3 as an electrochemical sensor [43,46]. The presence of an electron-rich nitrogenated cavity makes the adsorption process facile; therefore, C2N surface is a promising candidate for adsorption and sensing applications [47].
In our previously reported studies on C2N surface, C2N showed high selectivity towards NH3 (among studied toxic analytes; HF, PH3, HCN, NH3, and H2S), NM (N-mustard) (among studied analytes; GA, GB, GF, GD, NM, and SM) and NI3 (among studied nitrogen halides; NBr3, NCl3, and NI3) on conductivity basis. In summary, the C2N surface has remained selective towards analytes that exhibit S–H, N–H, or C–H bonds of a methyl group attached to a phosphorus or nitrogen group [40,43,47,48]. Additionally, C2N surface bears a well-defined activity that is better suited for the adsorption of V-type nerve agents. An extensive literature survey reveals that literature is silent upon the evaluation of interactions of V-type nerve agents (VX, VE, VM, VR, VG) with C2N surface [49]. In the current study, we have carried out DFT calculations to study the mode of adsorption of five different V-series nerve agents on C2N surface. The perturbation in band gap upon complexation is evaluated through frontier molecular orbital (FMO) analysis. The nature of the interactions is examined by the quantum theory of atoms in molecules (QTAIM), non-covalent interaction (NCI), symmetry adapted perturbation theory (SAPT0) analysis, and electron density differences (EDD).

2. Computational Methodology

All optimizations were performed using the M05-2X method with a 6-31++G(d,p) level of theory, and calculations were computed via Gaussian 09 software. M05-2X, a calibrated hybrid method with two non-local exchange functions, is best for capturing non-covalent interactions [50]. We used the M05-2X functional for our DFT study based on already reported benchmark studies in the literature. This functional is best specifically when dispersion interactions dominate among non-covalent interactions, as in the case of our study. A benchmark study was performed by Burns et al. on several hybrid functionals, and they reported that dispersion dominated non-covalent interactions could be better studied through the M05-2x hybrid functional [51]. Quite rich literature is available on the efficiency of the M05-2X hybrid functional for non-bonding interactions [25,52,53,54,55,56,57]. While frontier molecular orbitals (FMO) analysis was performed using the B3LYP method with 6-31G(d) level of theory because the accuracy of this method is well reported in the literature [58,59,60]. Visualization of the optimized geometries was performed through GaussView 5.0 and Chemcraft software [61,62]. Several possible orientations for each analyte were studied to obtain the most stable configuration with the lowest energy of each complex. The interaction energies of interacting fragments were evaluated by the following equation:
ΔE = Ecomplex − (EV-series + EC2N)
In Equation (1): Ecomplex, EC2N, and EV-series represent the electronic energies of V-series nerve agents C2N complexes, isolated C2N surface, and V-series nerve agents, respectively. Frontier molecular orbital (FMO) analysis is carried out to analyze the change in the energy band gap [63]. To study the charge transfer between V-series nerve agents and C2N surface, natural bond orbital (NBO) and electron density differences (EDD) analysis was performed [64]. EDD analysis provides a visual portrayal of the charge transfer among interacting fragments through colored isosurfaces and further validates NBO results [65].
NCI analysis is computed to visualize and differentiate the interactive forces existing among the analyte and C2N surface. Multiwfn 3.7 software is employed to construct 2D RDG graphs and 3D isosurfaces of V-series@C2N complexes. The non-covalent interaction index is generally dependent on two variables, RDG (reduced density gradient) and ρ (electron density), and they are interrelated by the equation given below:
R D G = 1 2 ( 3 π ) 1 / 3   ρ ρ 3 / 4
According to the divergence theorem, the density of net gradient flux is indicated by the Laplacian (∇2ρ) sign. A positive sign of Laplacian (∇2ρ > 0) indicates that the flux is leaving, whereas the negative sign (∇2ρ < 0) shows that flux is entering in an infinitesimally small volume in the vicinity of the reference point [47]. Therefore, the sign of Laplacian indicates the accumulation or depletion of electron density at the reference point. In NCI analysis, the nature of interactions is described via a color scheme dependent on the value of sign(λ2)ρ. The appearance of blue spikes and isosurfaces show strong electrostatic interactions with a corresponding negative value of sign(λ2)ρ in 2D-RDG graphs and 3D plots, respectively. While sign(λ2)ρ with small negative values indicates weak van der Waals forces, appearing as green spikes and isosurfaces in 2D-RDG graphs and 3D plots, respectively. Red isosurfaces appear when sign(λ2)ρ has large positive values and indicates repulsive interactions [42,56,65].
Symmetry-adapted perturbation theory (SAPT) analysis is also carried out to understand the mode of interaction present between the V-series and C2N surface. SAPT0 calculations were computed with PSI4 software. SAPT0 analysis consists of four components of interaction energies, i.e., induction (ΔEind), dispersion (ΔEdisp), electrostatic (ΔEelstat), and exchange (ΔEexch). The equation for SAPT0 ΔEint can be written as:
ΔEint = ΔEind + ΔEdisp + ΔEelstat + ΔEexch
Hence, SAPT0 total consists of the sum of these four contributing factors, i.e., ΔEind, ΔEdisp, ΔEelstat, and ΔEexch, which stabilizes V-series nerve agents with C2N upon complexation [66]. Among these components, ΔEdisp, ΔEelstat, and ΔEind are attractive forces, whereas the ΔEexch factor is a repulsive force.
Another useful tool for quantifying non-covalent interactions is QTAIM analysis. Important topological parameters, including electronic density (ρ), Laplacian (∇2ρ), and total energy density (H(r)), are employed to confirm the types of interactions via bond critical points (BCPs). Similarly, other parameters, such as the local potential energy V(r), local Lagrangian kinetic energy G(r), and total energy density H(r), are being used to understand the types of interactions existing between the V-series and C2N surface. Whereas, in topological analysis, Laplacian (∇2ρ) and electronic density (ρ) are the two main parameters used to examine the strength of a bond for particular BCPs [42,67,68,69]. Overall, we used Multiwfn, VMD, Gnuplot, and GIMP for NCI, QTAIM, and EDD analyses, while the SAPT0 graph was generated through MS excel. The features of PCs used are Workstation Intel Core i7 6700 K processor, 8 MB Cache 6th Generation Gigabit H 110 main board, with DDR IV, RAM 1900 MHZ, 16 GB, tower casing 400-Watt supply, DVD RW, SATA 10,000 GB hard disk. The average time taken for optimization in this study is two days, 19 h 7 min, while for properties average run time is 5 h 11 min.

3. Results and Discussion

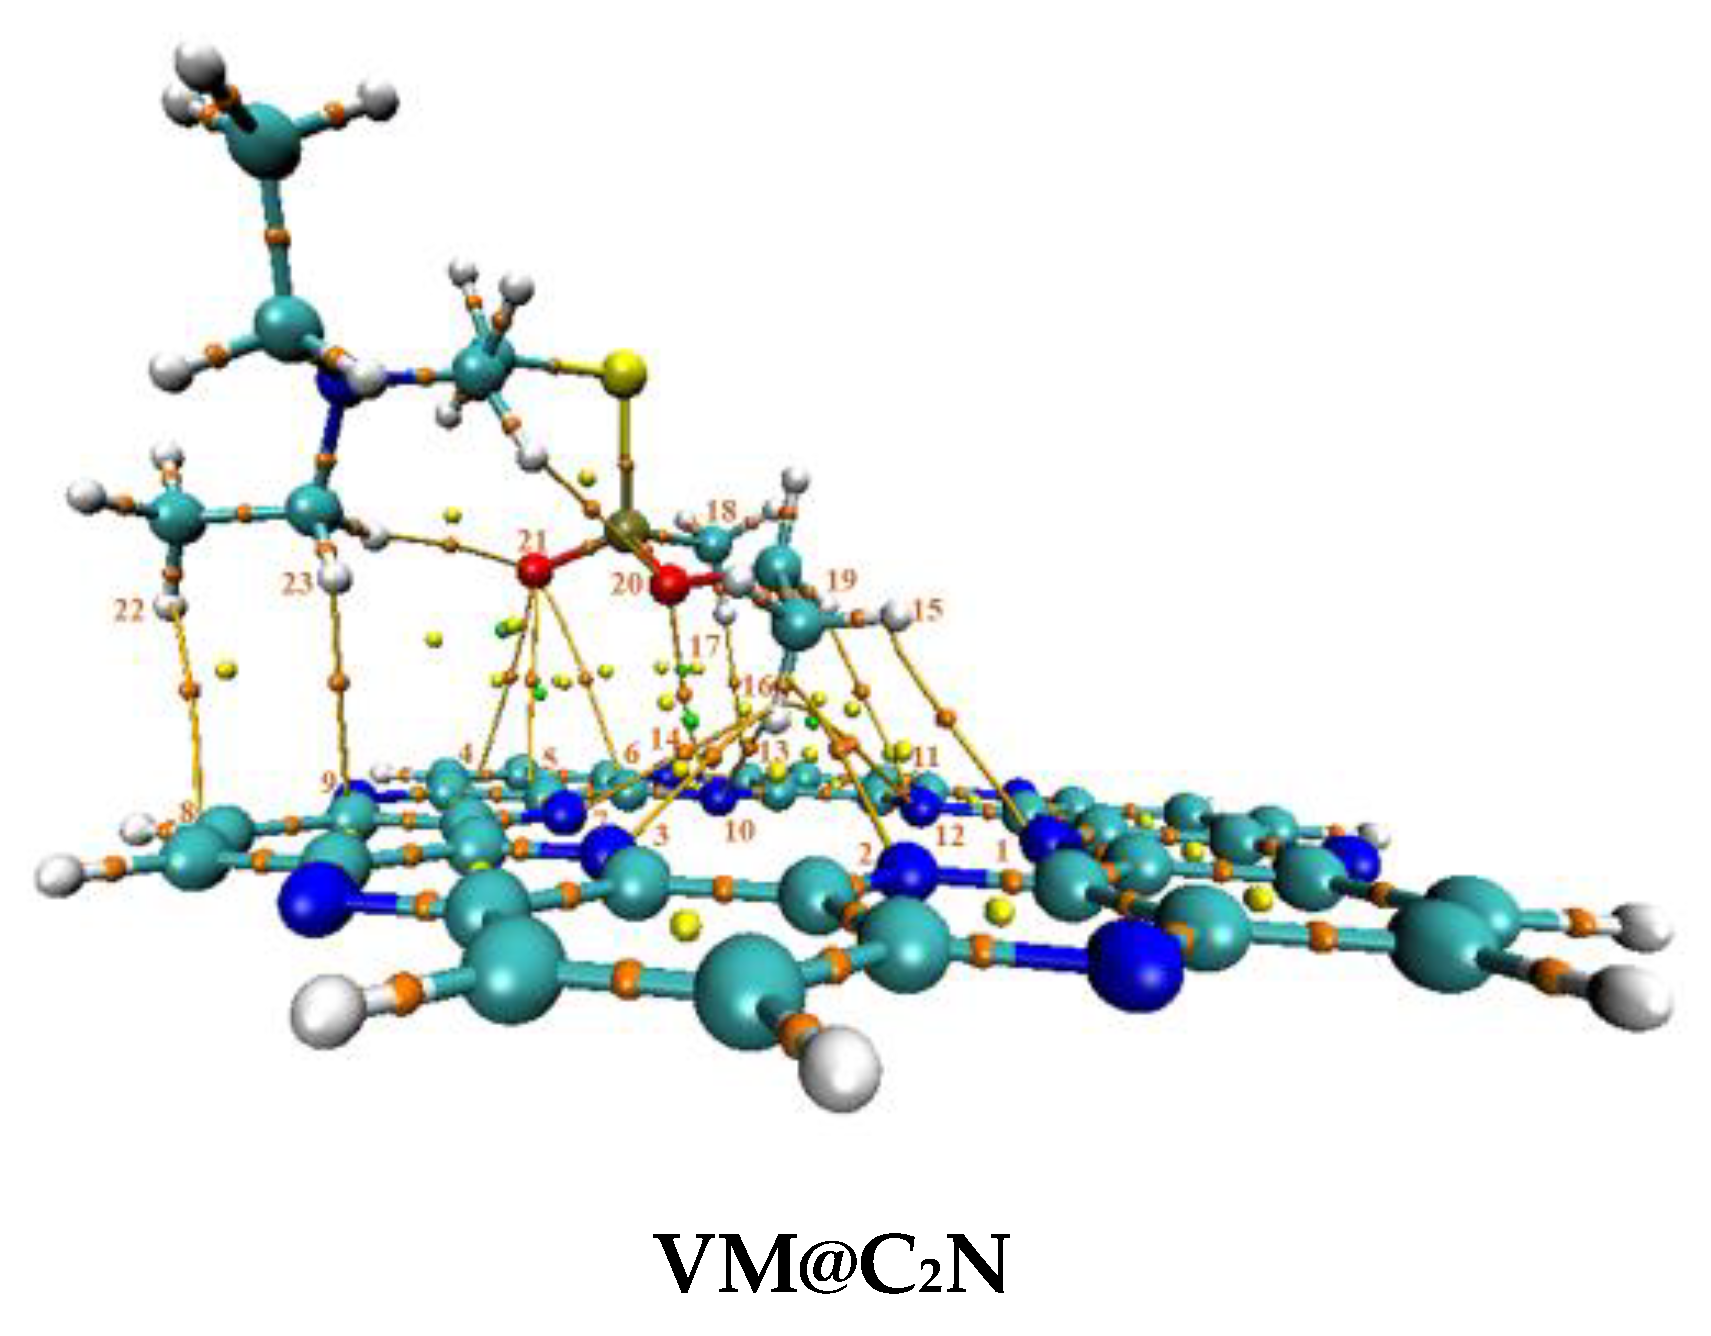
3.1. Geometric Optimization and Adsorption Energies

In the current study, the adsorption behavior of five different V-series nerve agents was examined against C2N surface. The chemical structures of these V-series nerve agents are presented in Figure 1. V-series nerve agents selected as analytes are VX; O-Ethyl-S-[2(diisopropylamino)ethyl] methylphosphonothioate, VS; O-Ethyl-S-[2(diisopropylamino)ethyl] ethylphosphonothioate VE; O-Ethyl-S-[2-(diethylamino)ethyl] ethylphosphonothioate. VG; O,O-Diethyl-S-[2-(diethylamino)ethyl] phosphorothioate and VM; O-Ethyl-S-[2-(diethylamino)ethyl] methylphosphonothioate (Figure 1). In V-type nerve agents, a thiophosphate (S-P=O) group makes up the central unit. On one side of the thiophosphate group, an -OR group is attached, while on the other side, R group is present (the R group could be methyl or ethyl) (see Figure 1) [70].
The optimized C2N quantum dot is shown in Figure 2. C2N consists of alternate pyrazine and benzene rings. In C2N material, the presence of an electron-rich nitrogenated cavity might help in the adsorption of analytes and thus make them suitable candidates for sensing studies against CWAs. The C2N surface consists of four appropriate binding sites; A; the center of C2N surface, B; triangular region made by C-N atoms, C; at the top of benzene rings and D; is over pyrazine rings (see Figure 2) [71,72].
All possible orientations were explored over four favorable binding sites to get the most stable and lowest energy configuration for all V-series@C2N complexes. The most stable optimized geometries of V-series@C2N complexes are presented in Figure 3.
Interaction distance and energy (Eint) are two important parameters for real estimation of interaction behavior [73]. The bond interaction distance decreases when the analyte approaches the surface (C2N) for complexation. Interactions existing between V-series nerve agents and C2N surface are attributed to the minimum interaction distance, which can be understood via interaction energy. We have presented interaction distances for all complexes (V-series@C2N) along with corresponding interaction energy in Table 1.
The interaction energies of VG@C2N, VM@C2N, and VX@C2N complexes are quite comparable, and interaction energy values are −17.81 kcal/mol, −17.69 kcal/mol, and −17.64 kcal/mol, respectively (see Table 1). Whereas the other two complexes, i.e., VE@C2N and VS@C2N, have interaction energy values of −13.97 kcal/mol and −12.93 kcal/mol, respectively. The optimized stable geometry of VX@C2N showed strong non-covalent interactions between the H-atoms of VX and the N-atoms of C2N. The strongest H---N interactions are observed between H9---N3 and H8---N5 atoms (see Figure 3) of the VX@C2N complex with interaction distances of 2.38 Å and 2.40 Å, respectively. Whereas relatively weak H---N interactions are observed between H10---N1, H9---N2, and H9---N4 atoms of VX@C2N complex with interaction distances of 2.75 Å, 2.80 Å, and 2.85 Å, respectively. Moreover, van der Waals interactions are also observed between the H7 atom of VX and the H6 atom of C2N with an interaction distance of 2.78 Å (see Figure 3).
The most stable configuration of VS@C2N shows that H-atoms of the ethyl group of VS are projecting towards the C2N surface and interacting with N-atoms of the C2N cavity. The bond distances of H---N interactions range from 2.84 Å to 2.99 Å in the VS@C2N complex. On the other hand, the stable geometry of the VE@C2N complex shows the least interaction distance of 2.55 Å for H8---N2 atoms. In this case, the H-atoms of VE are inclined towards C2N surface, thus interacting with the N-atoms of C2N.
Similarly, the most stable configuration of the VG@C2N complex was obtained after optimizing several interactive modes on C2N surface. The stable geometry of the VG@C2N complex reveals that the H-atoms of VG interact with the N-atoms of the surface. H10 and H11 atoms of VG both show strong interactions with N-atoms of C2N, i.e., H10---N3, H10---N4, H7---N1, and H7---N2 with interaction distances of 2.42 Å, 2.72 Å, 2.84 Å, and 2.40 Å, respectively. VG@C2N complex also shows interaction distances of 2.84 Å (O9---C5) and 2.90 Å (H8---H6).
In the case of the VM@C2N complex, the H-atoms of the ethyl group of VM were heading towards the N-atom’s surface, whereas the remaining part of the VM analyte flipped away from the surface (C2N), giving an umbrella-like appearance. Strong H---N interactions are observed at interaction distances of 2.86, 2.79, and 2.913 Å for H7---N1, H6---N2, and H6---N3, respectively, between the H-atoms of VR and the six nitrogen atoms of the C2N cavity. One weak van der Waals interaction is observed at a bond distance of 2.66 Å (H5---H4).
For all V-series@C2N, the interaction energy values reveal that all analytes are physiosorbed on C2N surface. The strongest interaction from studied V-series nerve agents is observed for VG nerve agents with an interaction energy of −17.81 kcal/mol. The interaction energy trend for studied V-series nerve agents is VG@C2N > VM@C2N > VX@C2N > VE@C2N > VS@C2N.
In the case of VS@C2N and VE@C2N complexes, the longer bond distance between analytes and C2N atoms resulted in a lowering of interaction energy after complexation as compared to the rest of the studied V-series nerve agents.

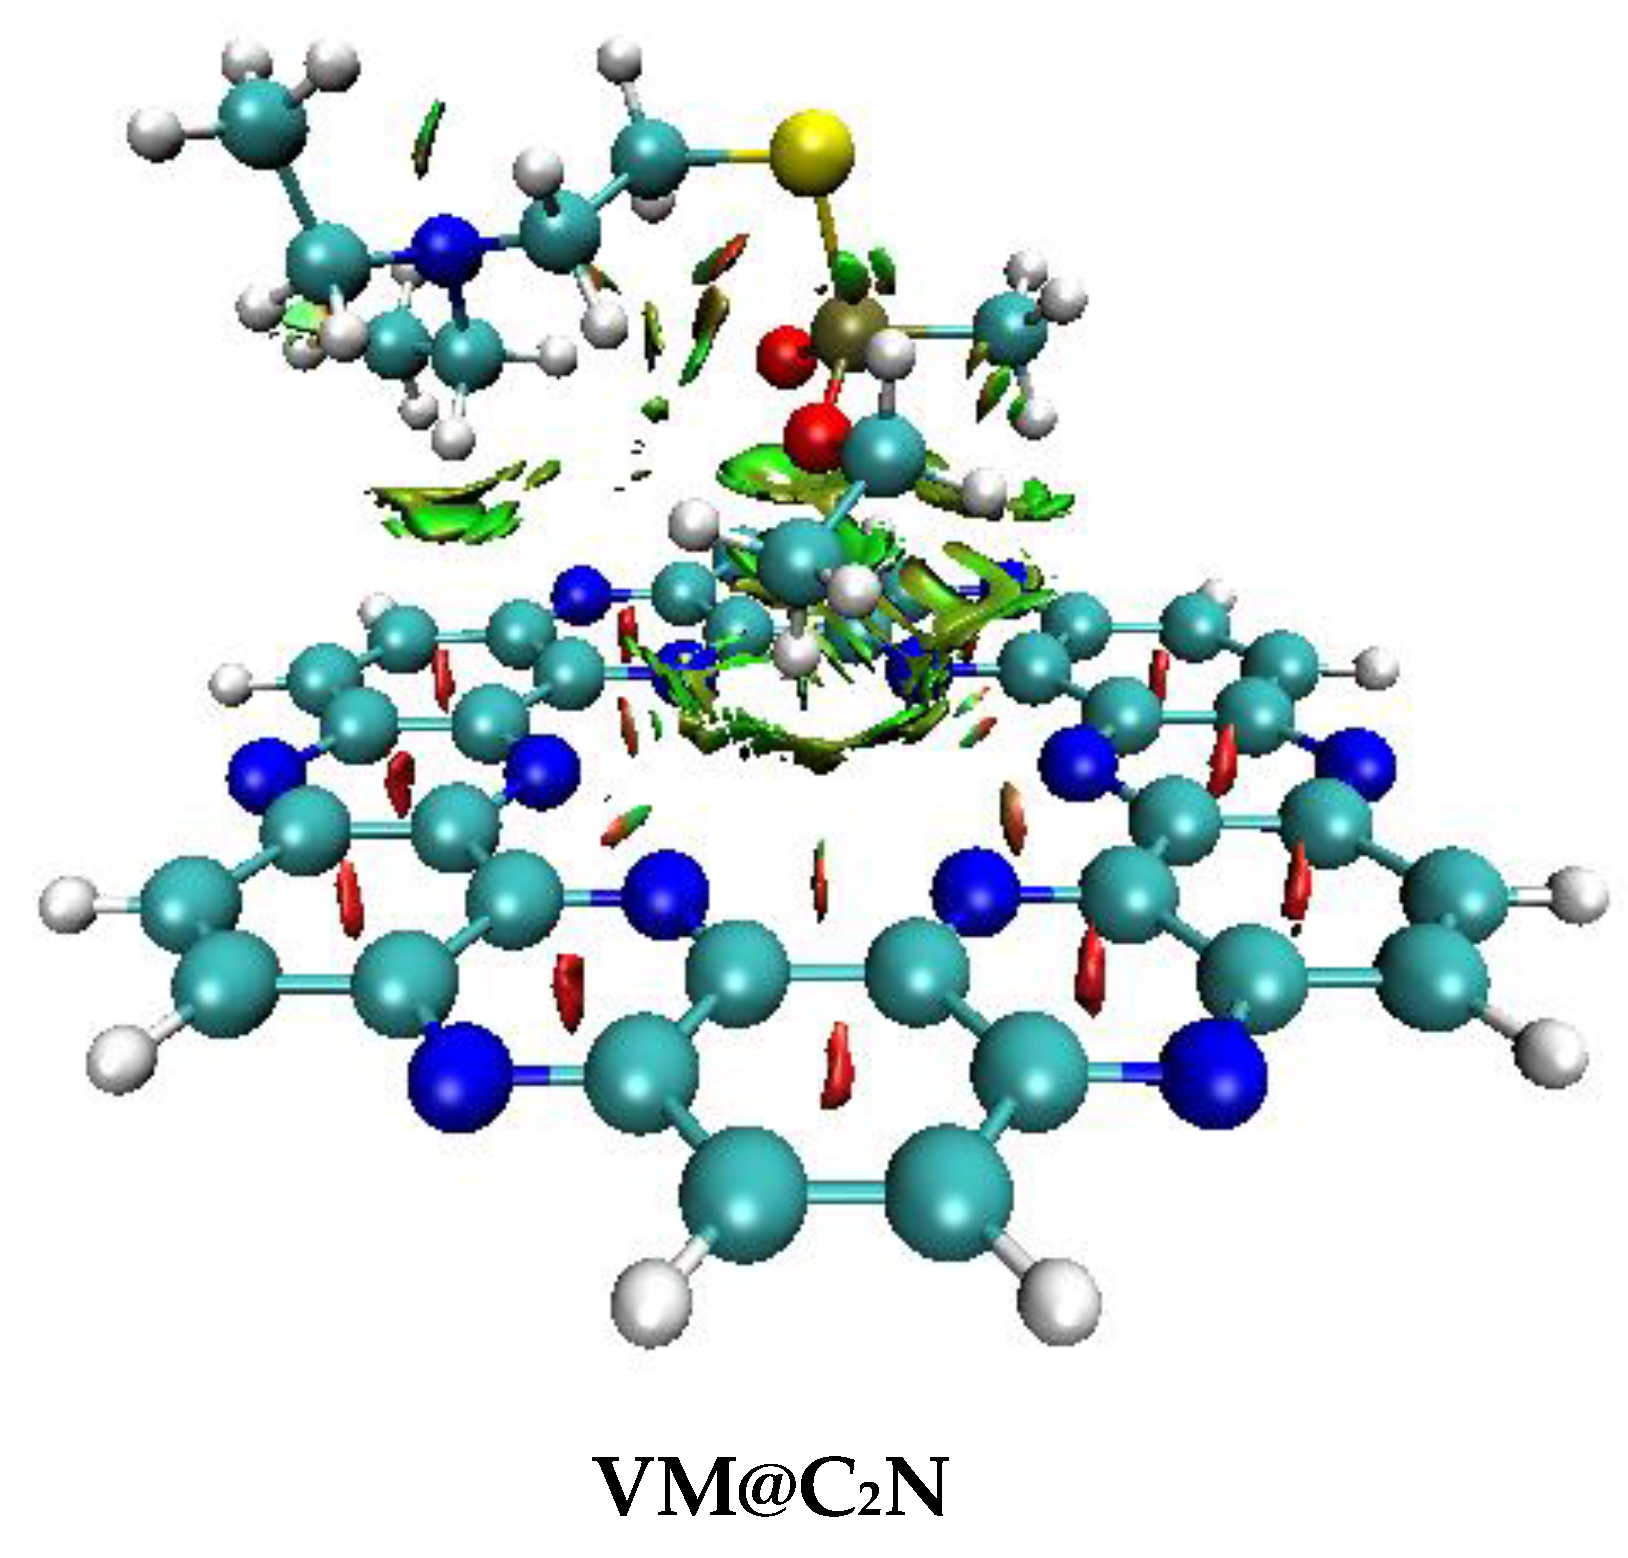
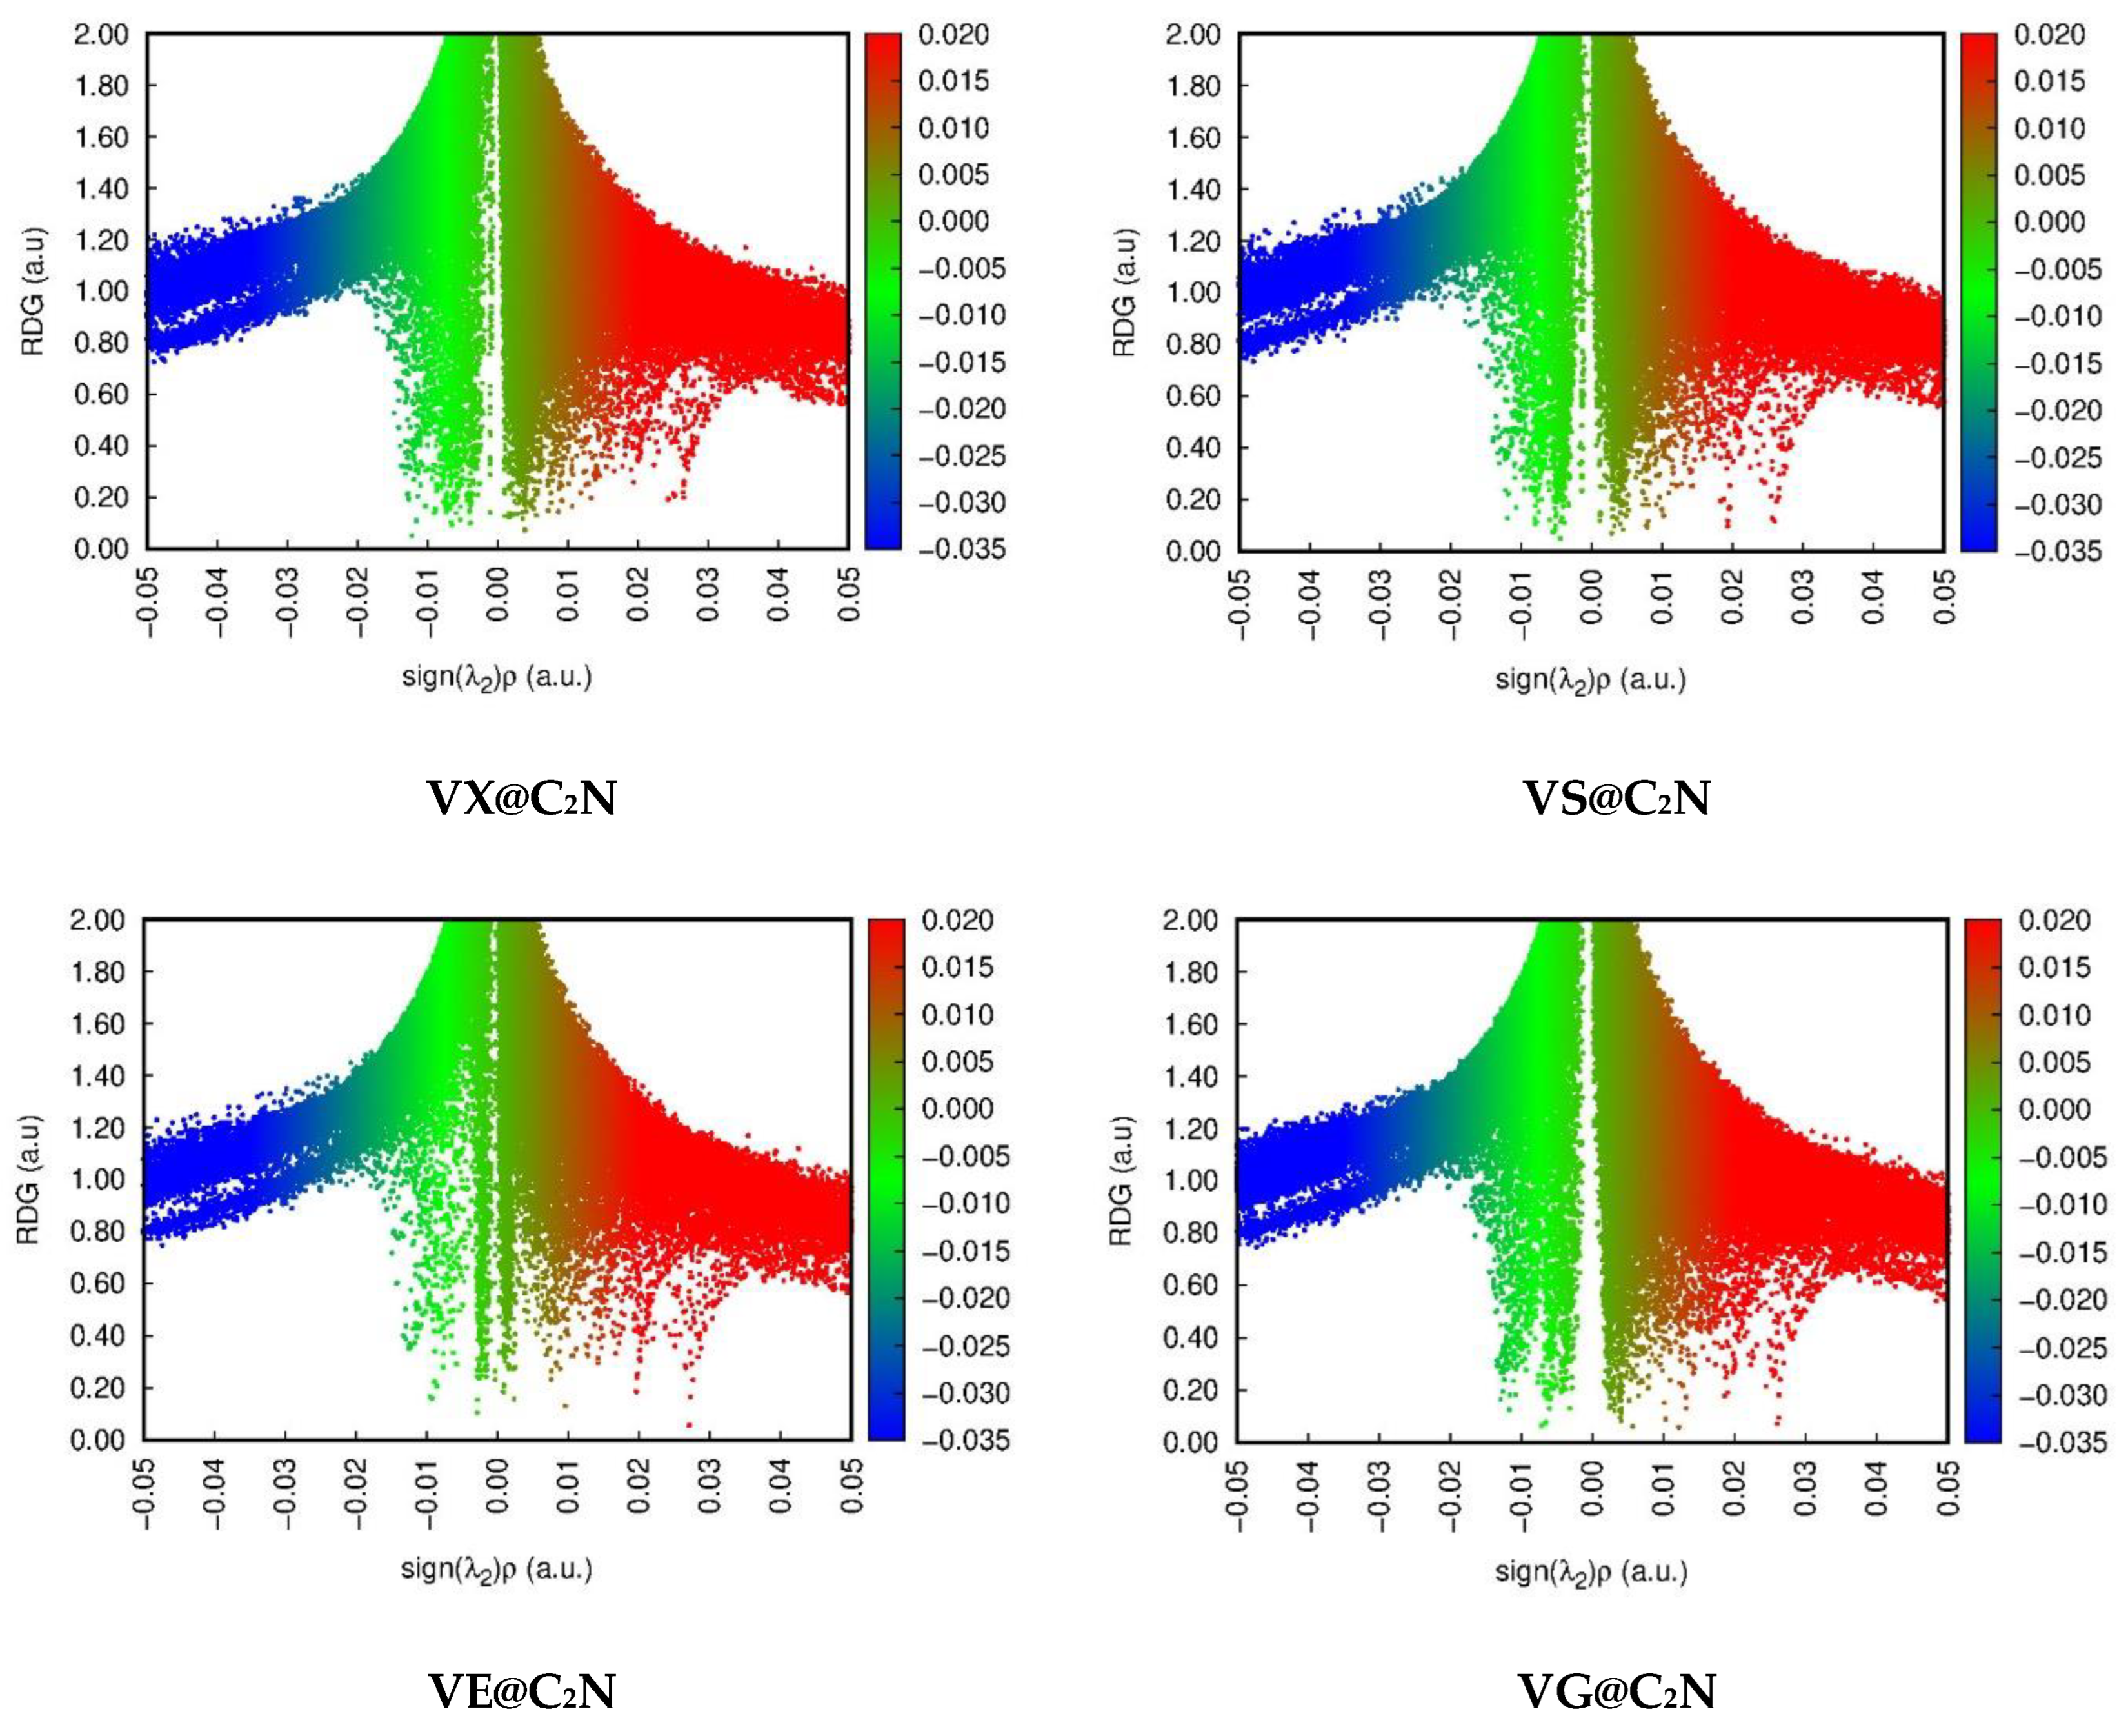
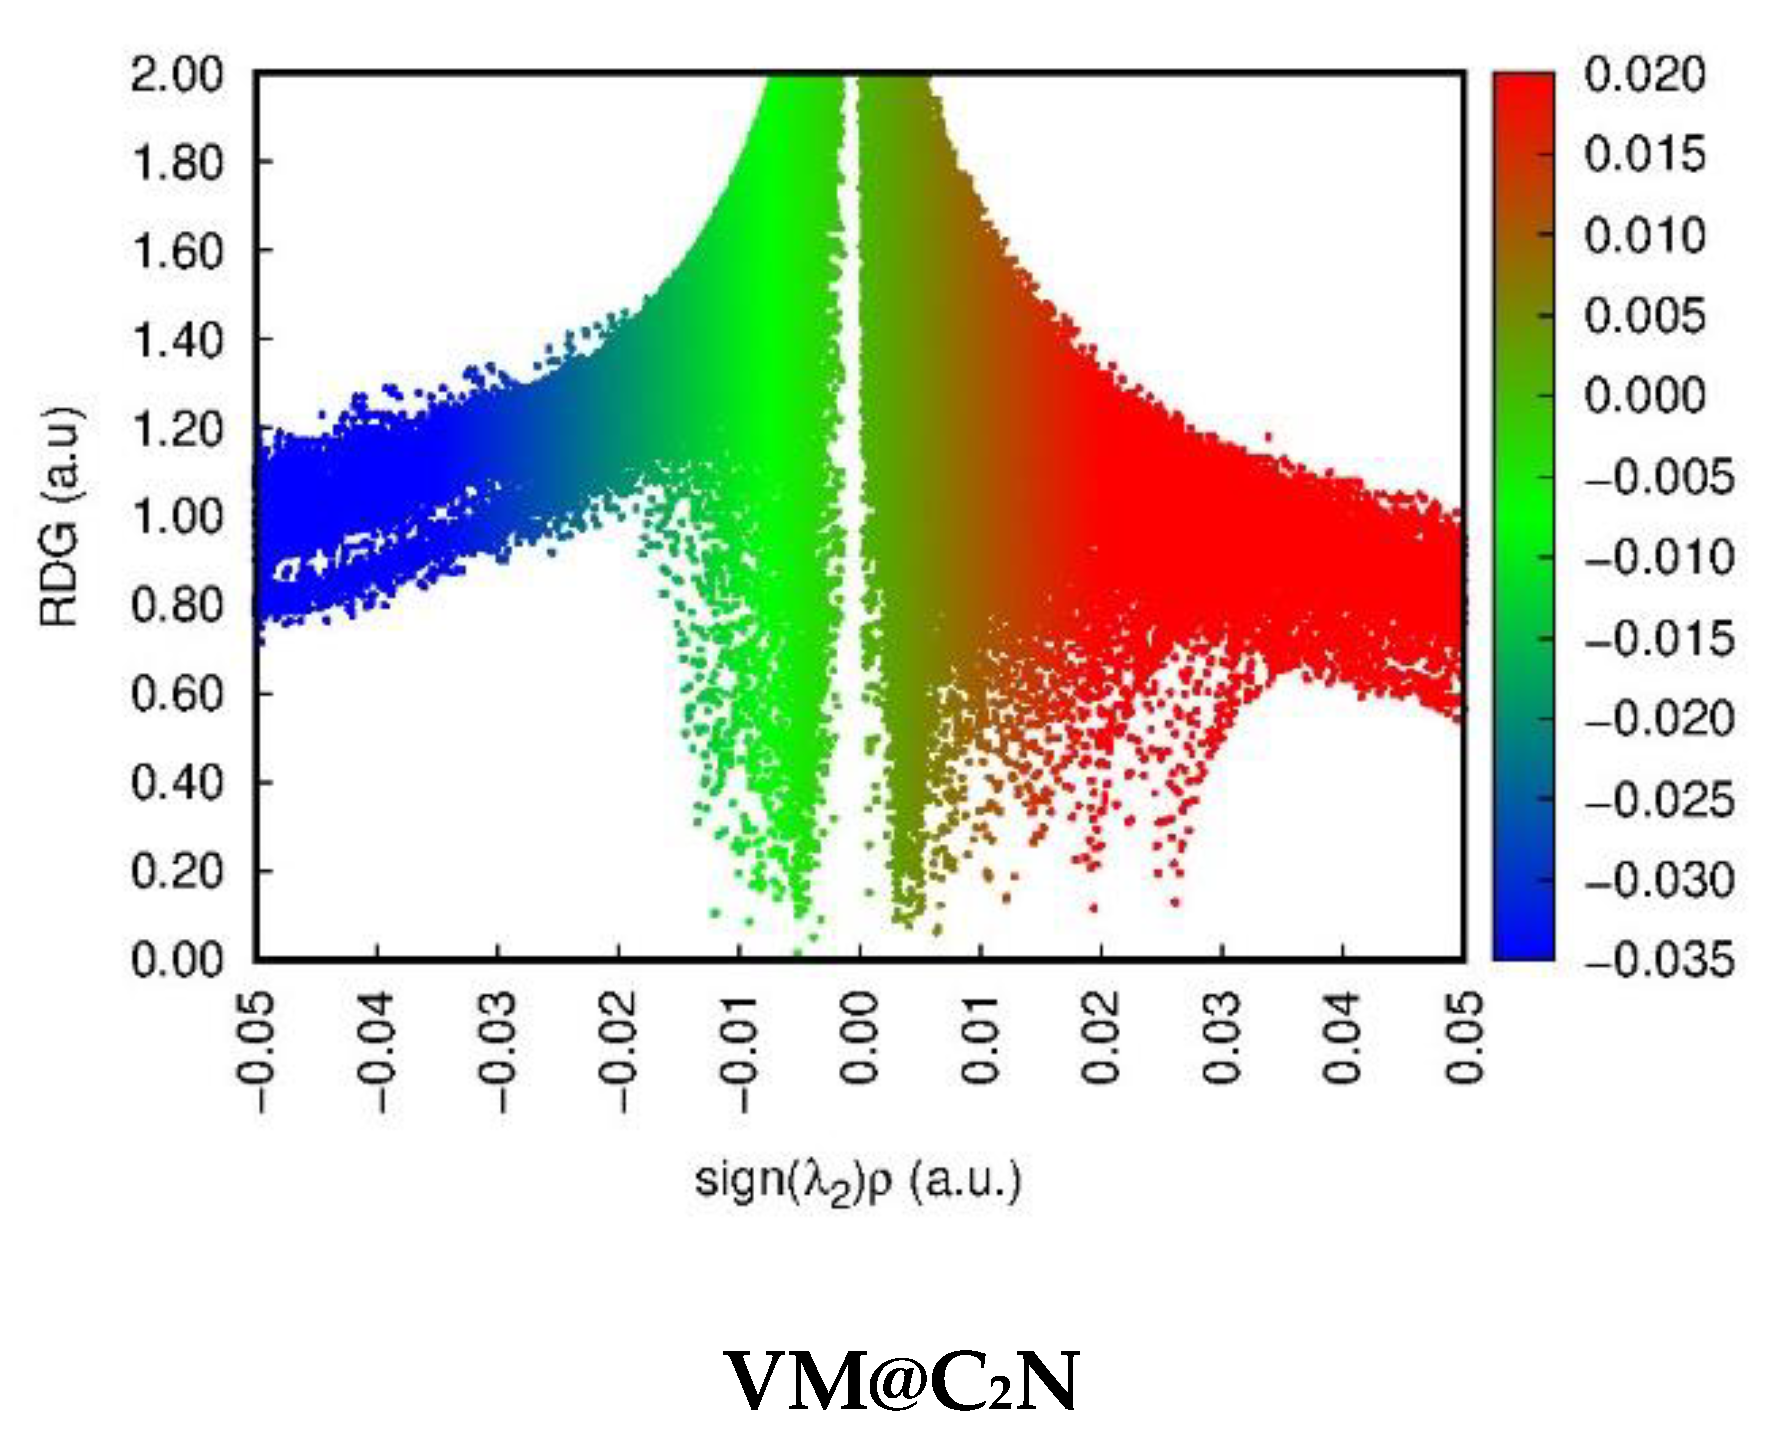
3.2. Non-Covalent Interactions (NCI) Analysis

NCI analysis is a useful tool for characterizing the nature of interactions, and it helps in differentiating between different nonbonding interactions, such as weak van der Waals interactions, H-bonding, and repulsive interactions. The NCI analysis gives a clear explanation of non-covalent interactions based on the second eigen value with the first differential of electron density (ρ), known as RDG (reduced density gradient) [74]. In NCI analysis, the 2D-RDG graphs are observed by plotting the reduced density gradient (RDG) at the y-axis versus signλ2(ρ) at the x-axis. In signλ2(ρ), ρ indicates the bonding strength, whereas signλ2 gives the information regarding the type of bonding. For repulsion, the positive value of signλ2(ρ) indicates the presence of weak van der Waals interactions. The color map in the 3D isosurface is also dependent on the value of signλ2(ρ) of NCI analysis. If the values are positive, i.e., signλ2(ρ) > 0, red isosurfaces result, indicating steric repulsive interaction. Negative values, i.e., signλ2(ρ) < 0, resulted in the appearance of green isosurfaces, which represent van der Waals interactions. The appearance of blue isosurfaces in 3D images among interacting fragments of complex resulted from a large negative value of signλ2(ρ), i.e., signλ2(ρ) > −0.02, which corresponds to strong electrostatic interactions [69].
The 2D-RDG graphs and colored 3D isosurfaces are presented in Figure 4 and Figure 5, respectively. In NCI analysis, the colored map reveals the appearance of a green isosurface between C2N surface and V-series nerve agents, which indicates the existence of weak van der Waals interactions. The 3D green isosurfaces in the case of VG@C2N, VM@C2N, and VX@C2N complexes are more prominent as compared to the other two complexes, which shows the stability of these complexes, which is in accordance with the results of interactions energy. Furthermore, 2D-RDG plots depict that the projection of scattered green spikes in all V-series@ C2N complexes appears in the range of 0.00 a.u. to −0.015 a.u., which confirms weak van der Waals interactions in all complexes. The existence of steric repulsion in all complexes is also confirmed through red-colored 3D isosurfaces, which are observed in the center of pyrazine and benzene rings of the C2N unit (Figure 4).
Similarly, more negative values of λ2 and deep RDG confirms the presence of strong electrostatic interactions, specifically hydrogen bonding. 2D NCI graphs depict that the spikes appear at signλ2(ρ) > −0.01 (a.u.). which presents strong electrostatic interactions, whereas, below this negative value, London dispersion force exists.

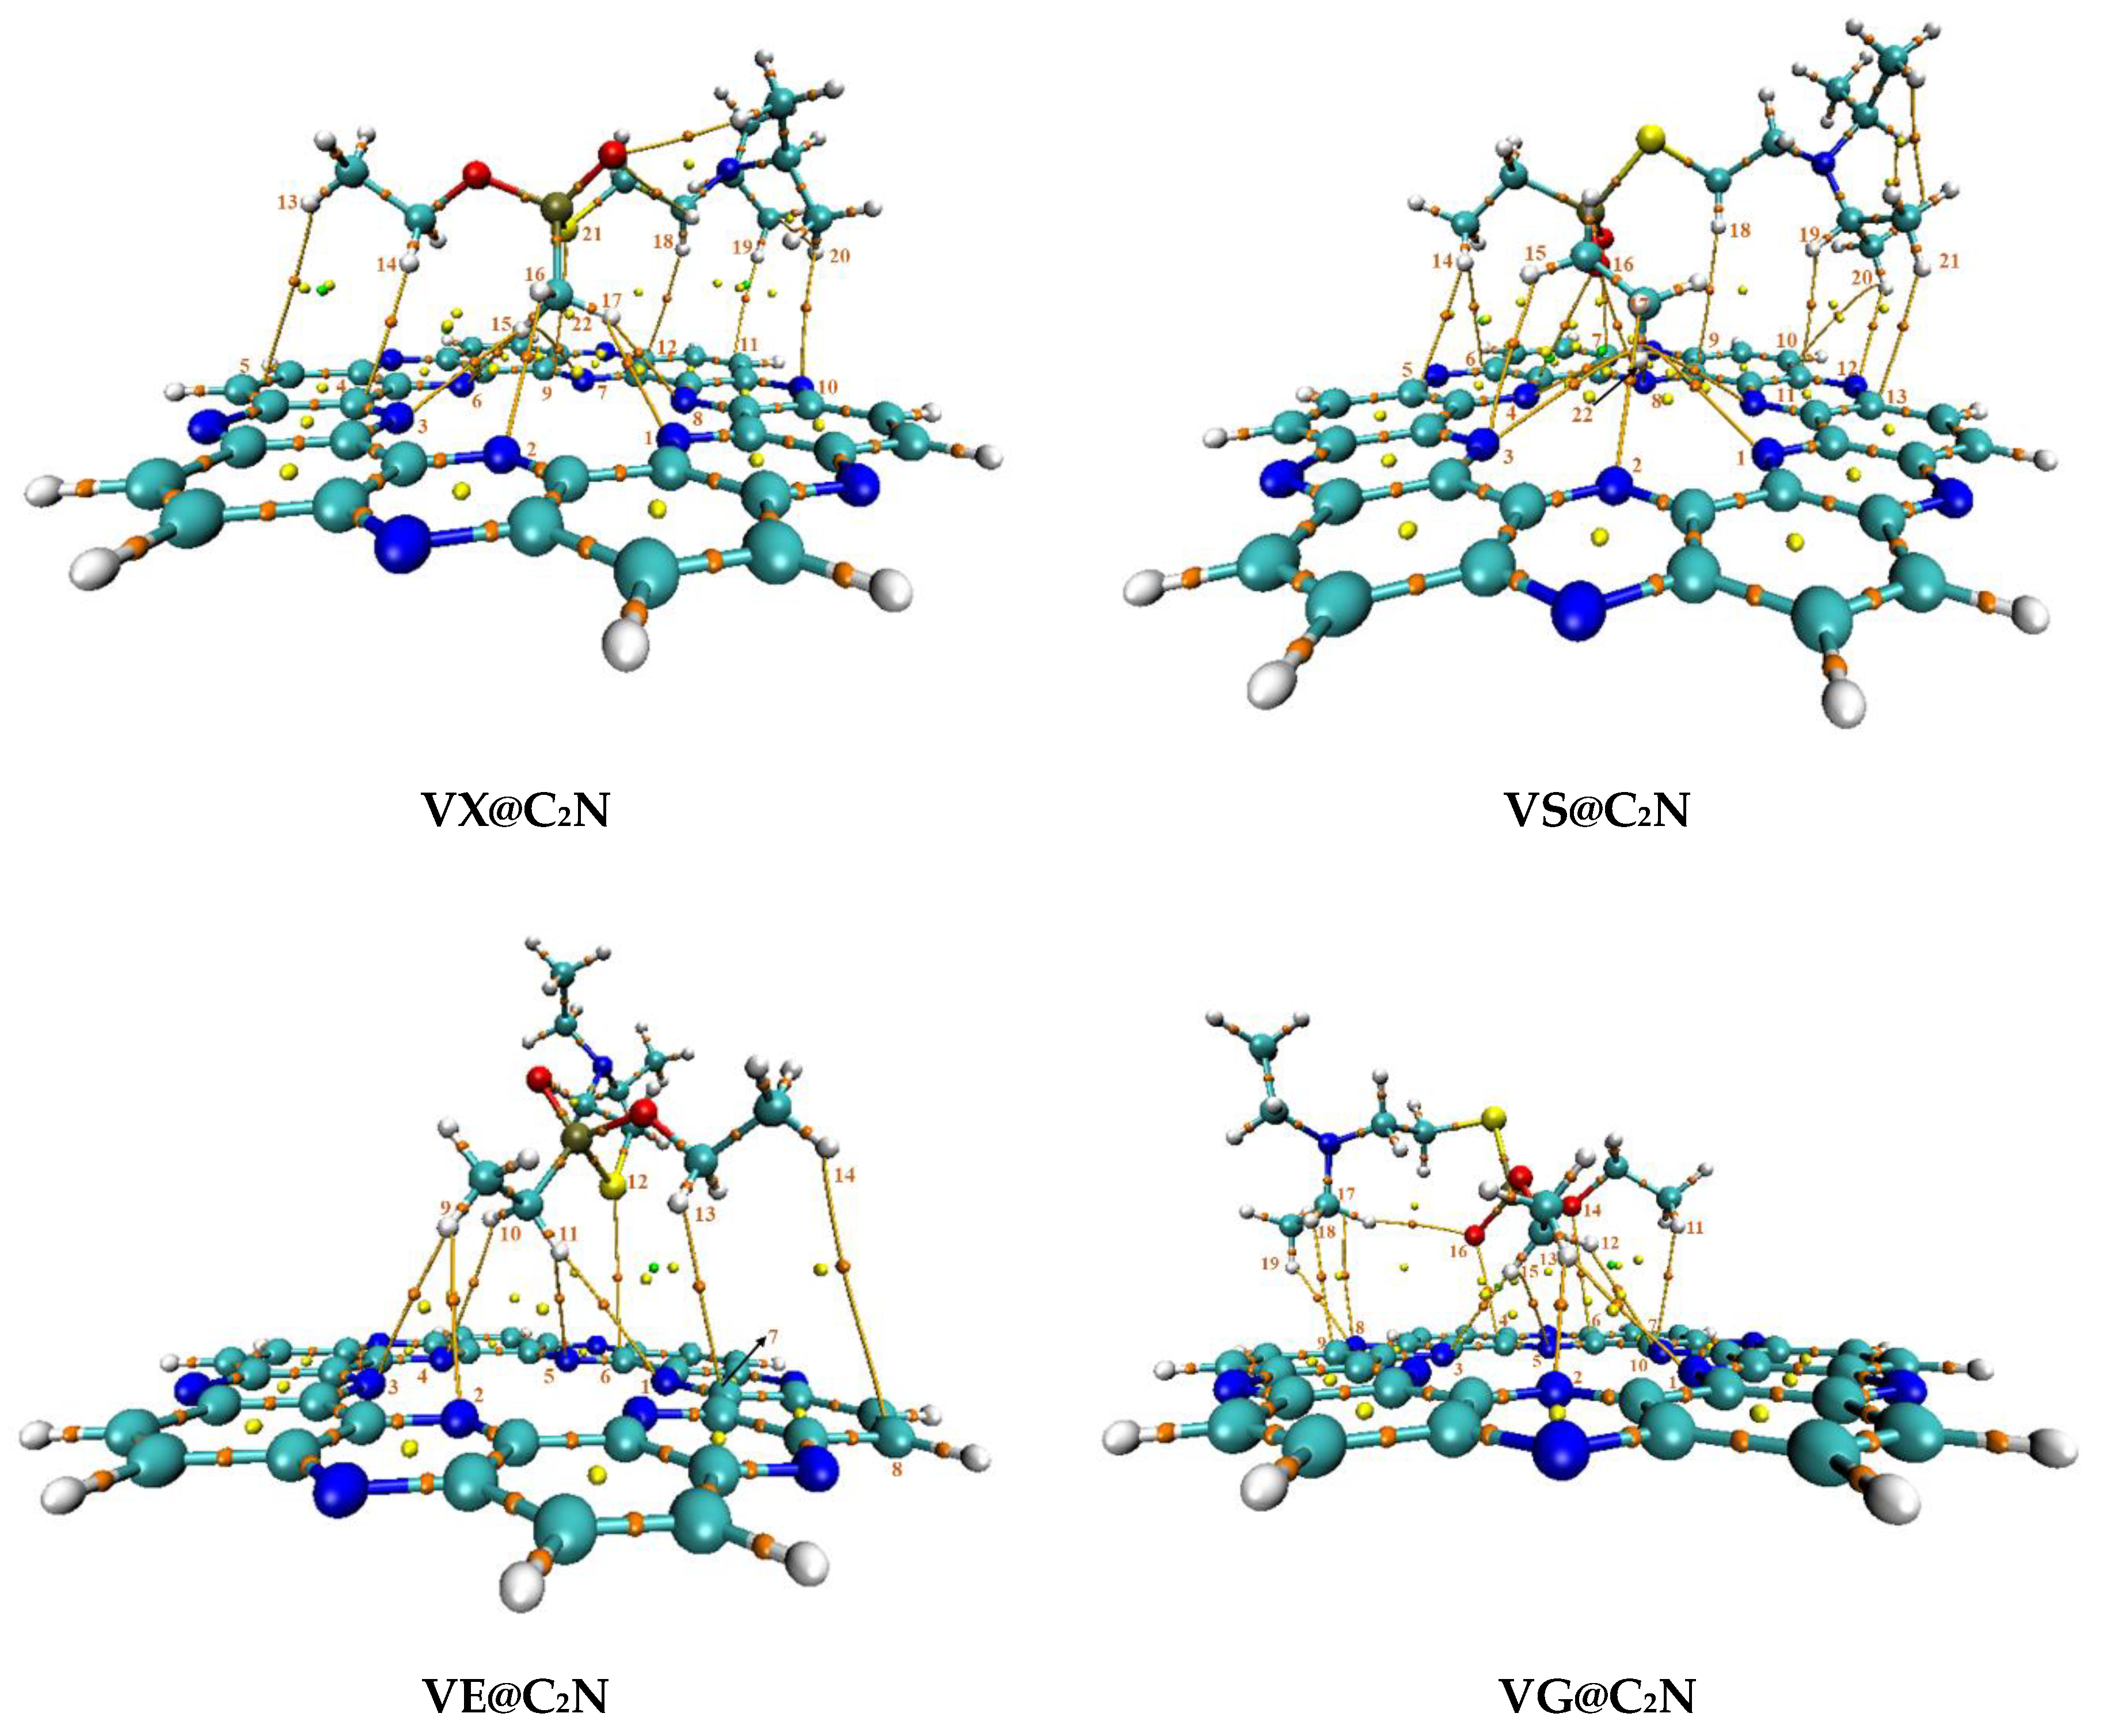
3.3. Quantum Theory of Atoms in Molecules (QTAIM) Analysis
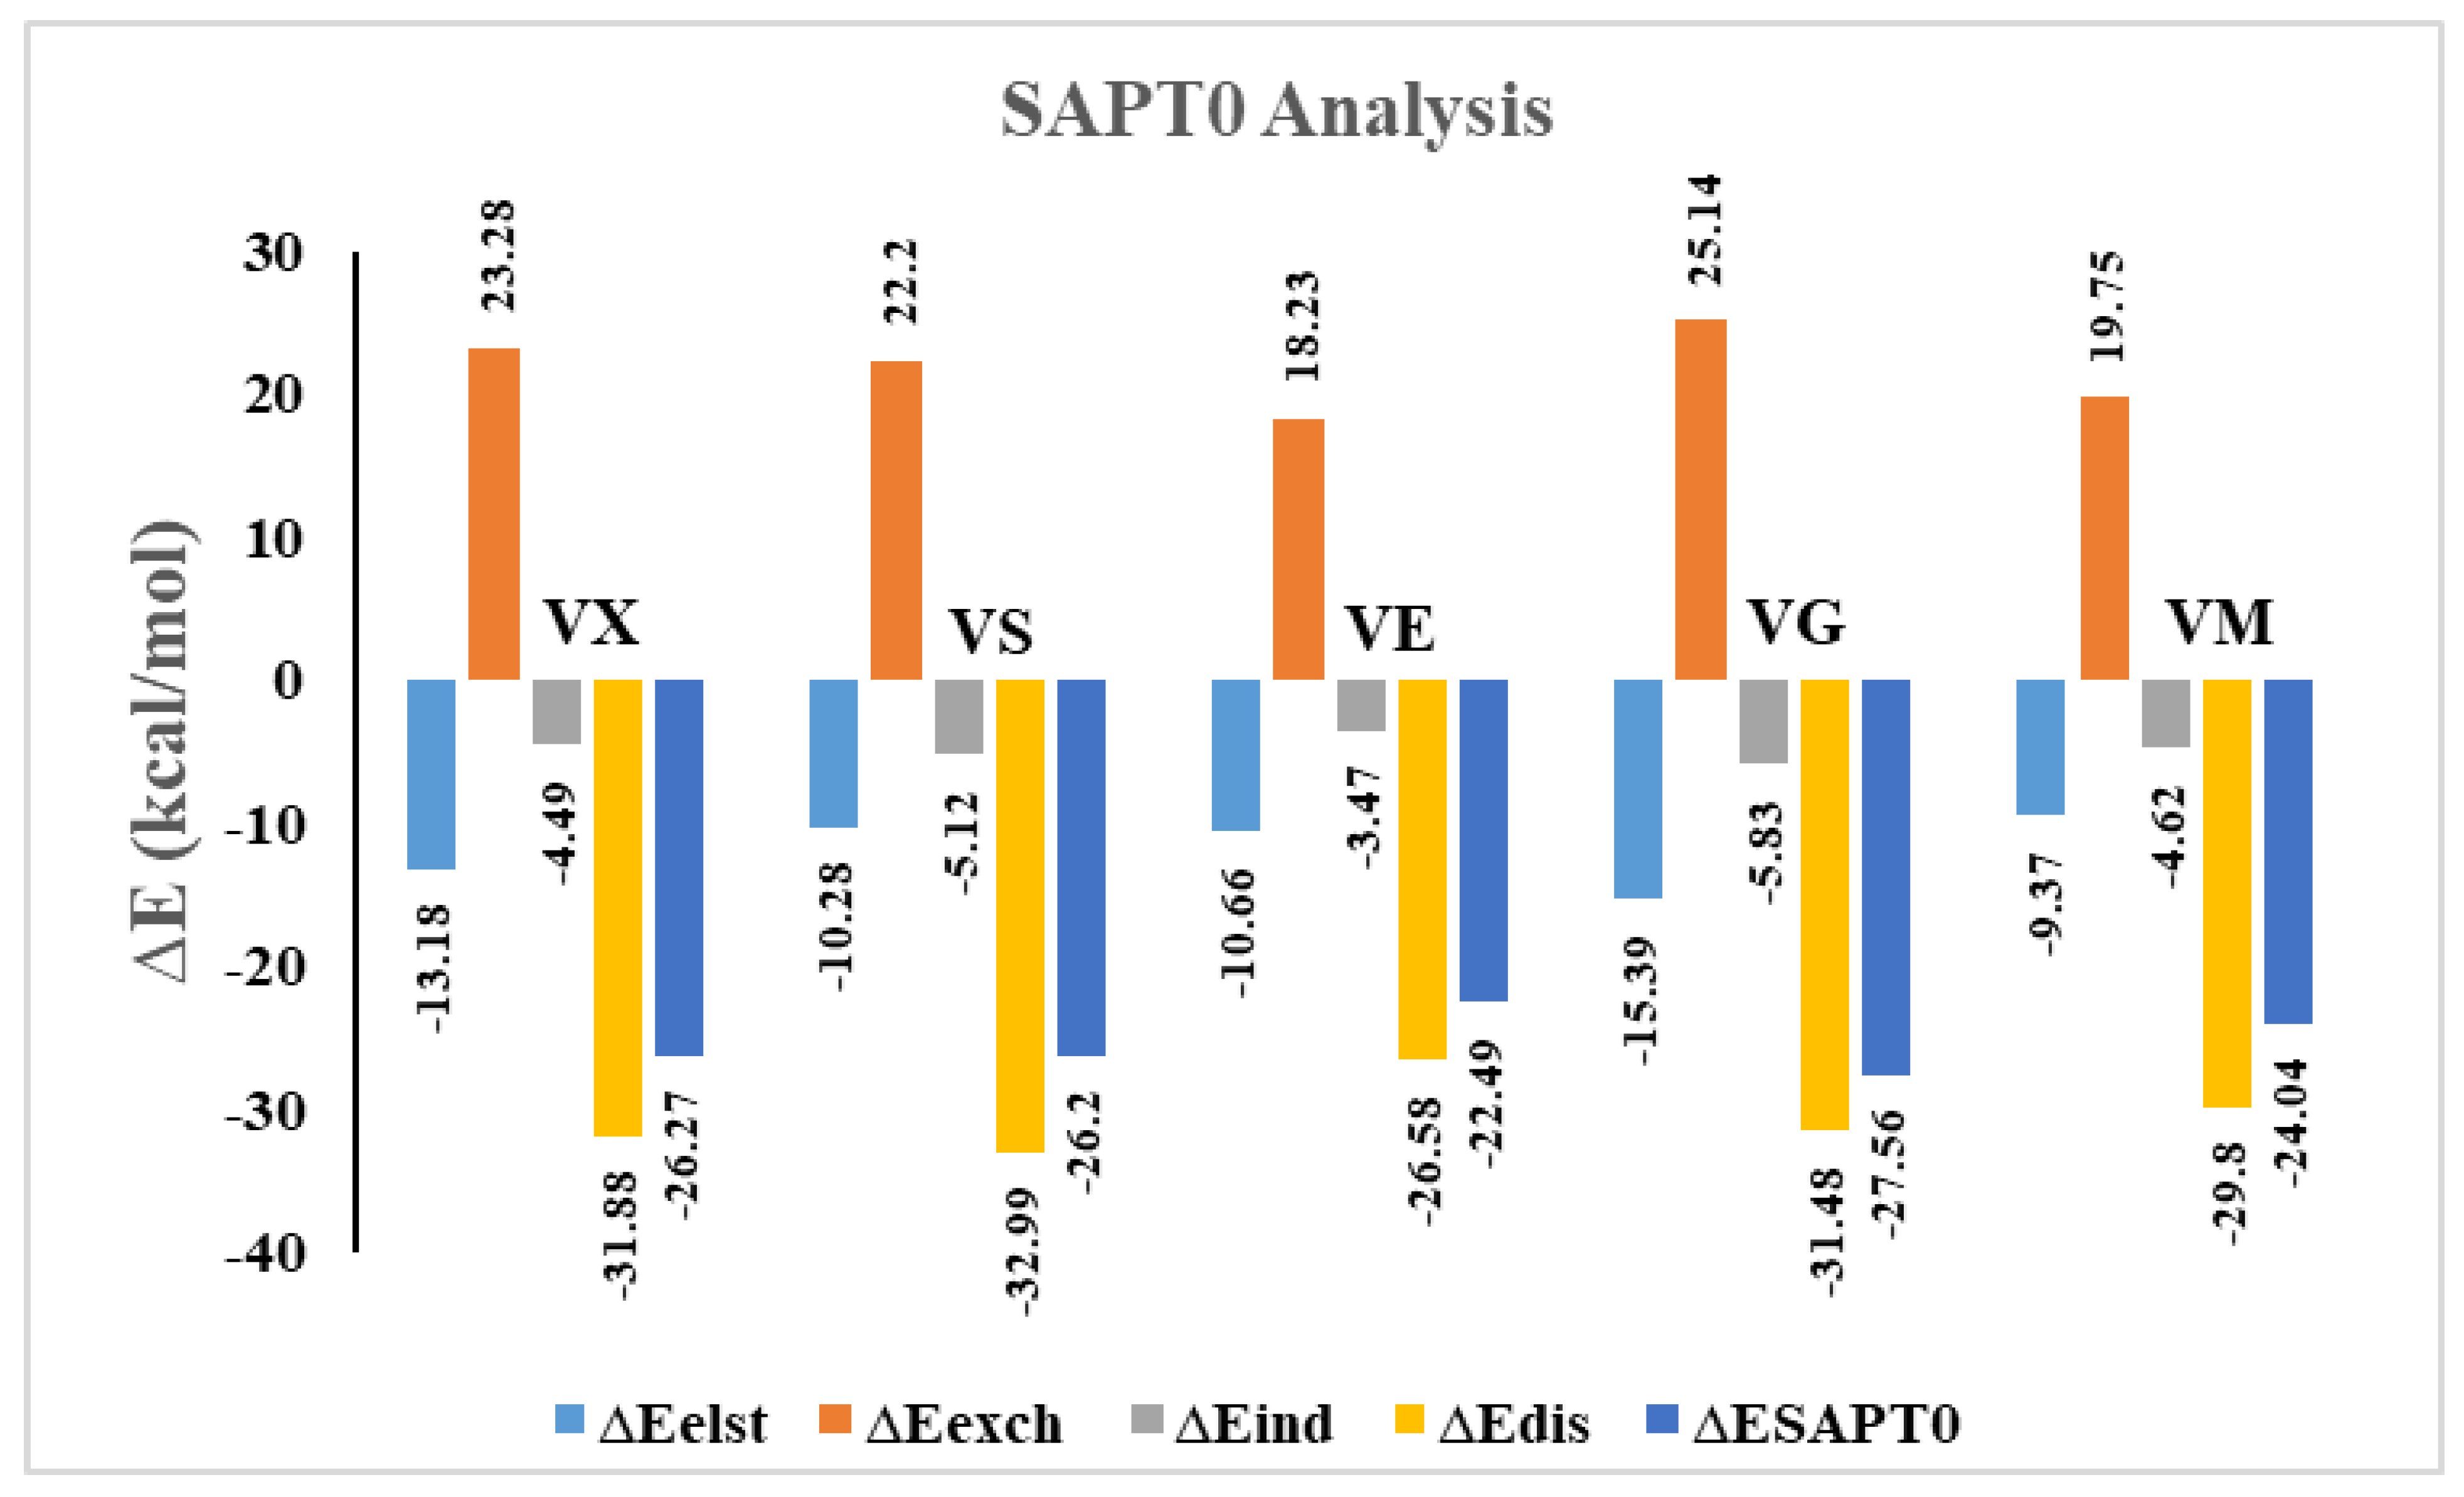
The non-covalent interactions among V-series analytes and C2N surface are further explored via Bader’s quantum theory of atoms in molecules (QTAIM) analysis. The topological parameters employed to study the nature of non-covalent interactions at BCPs are electronic density ρ(r), Laplacian of electronic density ∇2ρ(r), local Potential energy V(r), local Lagrangian kinetic energy G(r), and total energy density H(r). For covalent bonds, values of ρ must be positive and greater than 0.1 a.u., while Laplacian (∇2ρ) is always a large value with a negative sign. On the contrary, for non-covalent interactions, the values of ρ are always less than 0.1 a.u. (ρ < 0.1 a.u.) and ∇2ρ is positive with small values [75,76]. Similarly, for covalent interactions, the ratio of −V/G > 2, whereas for non-covalent interactions, the ratio of −V/G must be less than 1 (−V/G < 1) [77].
Geometries of all complexes are optimized at M05-2X/6-31++G(d,p) level of theory to characterize QTAIM results. The results of topological parameters calculated via QTAIM analysis for V-series@C2N complexes are reported in Table 2. Topological 3D isosurfaces of all studied V-series@C2N complexes obtained through QTAIM analysis are shown in Figure 6. The values of electron density (ρ) and Laplacian (∇2ρ) reported in Table 2 justify the existence of non-covalent interactions in all studied V-series@C2N complexes. A total of 11 BCPs are observed in the case of the VX@C2N complex with six H---N, four H---C, and one S---C bond interactions. The values of electron density (ρ) and Laplacian (∇2ρ) are in the range of 0.004 to 0.012 a.u. and 0.011 to 0.037 a.u., respectively, which clearly indicates the existence of non-covalent weak interactions. The values of total energy density H(r), local Potential energy V(r), and local Lagrangian kinetic energy G(r) are also observed in the range of non-covalent weak interactions. The maximum number of BCPs are observed for the VS@C2N complex, which is 14 (see Table 2). The values of electron density ρ for observed BCPs is in the range of 0.003 to 0.009 a.u., and the range of values for Laplacian ∇2ρ is 0.012 to 0.026 a.u.
Similarly, six BCPs are present for the VE@C2N complex with five H---N and one S---C bond interactions. The strongest interactions are obtained for H11---N1 and H11---N5 bonds with electron density ρ and Laplacian ∇2ρ values of 0.003 a.u. 0.010 a.u., respectively. In the case of the VG@C2N complex, 11 BCPs are observed with seven H---N, two H---C, and two O---C bond interactions. The values of electron density (ρ) and Laplacian (∇2ρ) are in the range of 0.004 to 0.011 a.u. and 0.014 to 0.036 a.u., respectively. For the VM@C2N complex, the total BCPs observed are 13, with seven H---N, three O---C, two H---C, and one O---N bond interaction (see Figure 6 & Table 2). The values of electron density (ρ) and Laplacian (∇2ρ) are observed in the range of 0.004 to 0.009 a.u. and 0.014 to 0.029 a.u., respectively, which indicate that only non-covalent interactions exist between VM analyte and C2N surface.
The ratio of −V/G is also calculated for each BCPs of all studied V-series@C2N complexes. The highest individual −V/G values for studied complexes i.e., VX@C2N, VS@C2N, VE@C2N, VG@C2N and VM@C2N are 0.96, 0.96, 0.70. 0.91 and 0.86, respectively (Table 2). Moreover, the ratio of −V/G also indicates that the local potential energy V(r) parameter is dominant in all V-series@C2N complexes. Potential energy mainly rises due to the rise in values of Laplacian and electron density. The values of Laplacian, electron density, and −V/G also indicate that non-covalent interactions exist in all studied complexes.
Apparently, the observed values of all topological parameters, i.e., electron density ρ(r), Laplacian ∇2ρ(r) total energy density H(r), Potential energy V(r), and Lagrangian kinetic energy G(r) for all studied V-series@C2N complexes indicate that only non-covalent interactions exist among nerve agents and 2D surface. Therefore, all the V-series nerve agents are physiosorbed on C2N surface. Among studied V-series nerve agents, the lowest BCPs are examined in the case of the VE@C2N complex, i.e., six. Furthermore, the topological parameters such as ρ, ∇2ρ, G, V, and H have the lowest values in cases of VE@C2N complex as compared to the rest of V-series@C2N complexes.

3.4. SAPT0 Analysis

Symmetry adapted perturbation theory (SAPT0) analysis is used to characterize the interactions quantitatively between V-series nerve agents and C2N surface. SAPT0 analysis consists of four contributing factors (interaction energies), i.e., electrostatic (ΔEelst), exchange (ΔEexch), induction (ΔEind), and dispersion (ΔEdisp) [78]. The sum of these four components, Eelst, Eexch, Eind, and Edis, gives the total SAPT0 energy (ESAPT0) [79]. The contribution of each interaction energy component is obtained through SAPT0 analysis, and values are reported in Table 3, whereas a graphical representation of V-series@C2N complexes is shown in Figure 7.
The highest contribution of the Eexch component is observed in the VG@C2N complex (25.14 kcal/mol), followed by VX@C2N, VS@C2N, VM@C2N, and VE@C2N complexes with Eexch values of 23.28, 22.20, 19.75, and 18.23 kcal/mol, respectively. The contribution of remaining energy components for the VX@C2N complex are −13.18 kcal/mol (Eelst), −4.49 kcal/mol (Eind), and −31.88 kcal/mol (Edisp). SAPT0 results clearly indicate that the dispersion component is the major stabilizing factor (64.34%), followed by the Eelst component, which contributes 26.60%. Similarly, for the VS@C2N complex, the values of Eelst, Edisp, and Eind are −10.28, −32.99, and −5.12 kcal/mol, respectively. In the case of the VE@C2N complex, again, Edisp is a dominant contributing factor with 65.29% (−26.58 kcal/mol) contribution. Whereas Eelst and Eind are less dominant towards total SAPT0 with 26.18% (−10.66 kcal/mol) and 8.52% (−3.47 kcal/mol) contribution, respectively. VM@C2N complex again follows the same trend of SAPT energy components, where the Edisp factor shows the highest contribution (68.05%), while Eelest and Eind indicate less contribution of 21.39% and 10.55% towards total SAPT0, respectively.
SAPT0 analysis indicates that the majority of SAPT0 energy components are negative, which reveals that attractive forces are more dominating between analytes and C2N surface (see Table 3). Whereas the exchange component (∆Eexch) shows positive values, which reveals the presence of repulsive force between two interacting components. The highest stabilization energy is observed in the case of the VG@C2N complex among ESAPT0 energy values, which is in accordance with interaction energy (Eint) analysis (see Table 1). The overall order of the SAPT0 component’s contribution towards total SAPT0 energy (ESAPT0) is Edisp > Eelest > Eind. This trend indicates that the major stabilizing factor among SAPT0 components is Edisp.

4. Electronic Properties

4.1. Natural Bond Orbital (NBO) Analysis

The NBO analysis is carried out to analyze the quantity of charge transfer after the complexation of V-series nerve agents with C2N surface. Electronic properties play an important role in understanding the nature of interactions existing among nerve agents and C2N surface. The values of NBO charges upon the interaction of analytes and surface are given in Table 3. The negative value of NBO charges shows that the charge is transferred from surface to analyte and vice versa [80].
NBO analysis reveals that the values of NBO charges appeared in the range of −0.023 e to −0.002 e. Here the negative sign indicates that, for all V-series@C2N complexes, the charge is transferred from C2N surface to V-series agents. The NBO charge values of studied nerve agents are −0.023 e, −0.020 e, −0.013 e, −0.012 e, and −0.002 e for VX, VS, VE, VG, and VM, respectively (Table 4). This trend is observed due to charge transfer upon the interaction of the positively charged H-atoms of nerve agents (VX, VS, VE, VG, and VM) with the electron-rich C2N surface. The highest amount of charge transfer (−0.023 e and −0.020 e) was examined for VX@C2N and VS@C2N complexes, respectively, which might be due to the strong electrostatic interaction (hydrogen bonding) of H-atoms with N-atoms of C2N cavity. Furthermore, small NBO charge transfer in the London dispersion force case of VM@C2N complex reveals the existence of weaker non-covalent interactions.

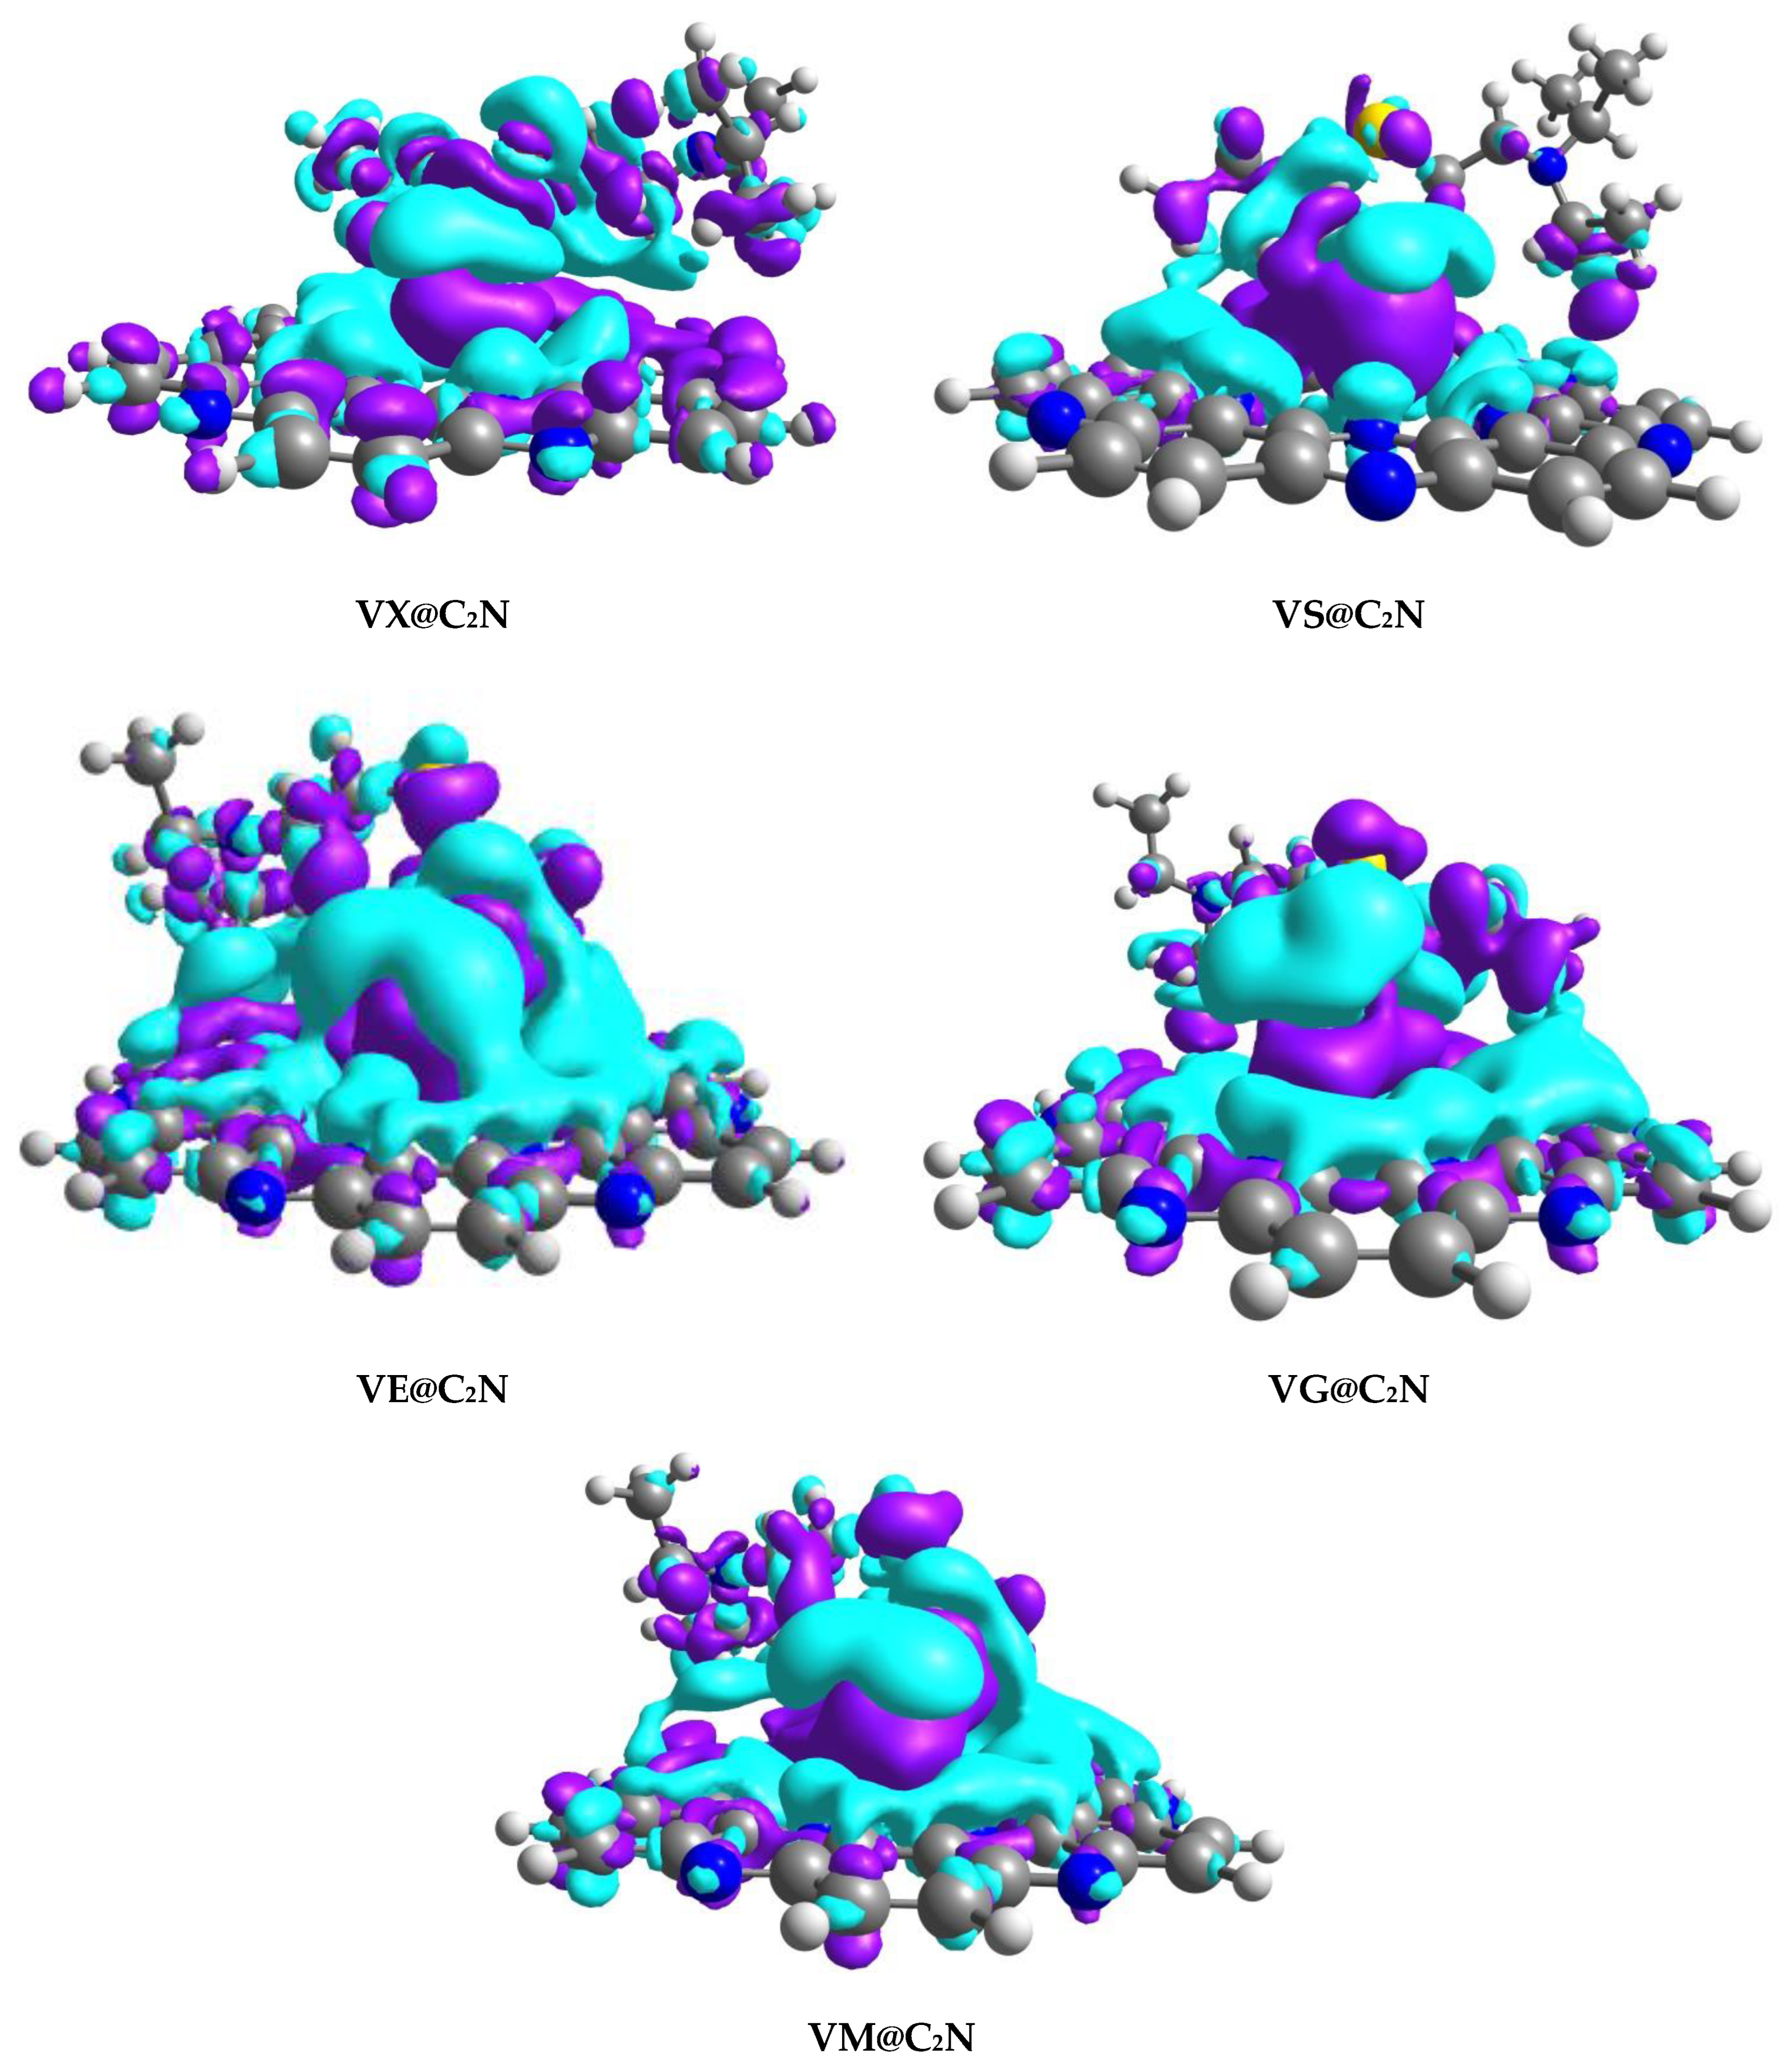
4.2. Electron Density Differences (EDD)

The type of interactions upon adsorption of nerve agents on C2N surface was further characterized through Electron Density Difference (EDD) analysis. EDD plots of V-series@C2N complexes (Isovalue = 0.004 a.u.) are given in Figure 7. The isosurfaces were obtained using multiwfn 3.7 software(Tian Lu, Beijing Kein Research Center for Natural Sciences). Electron density difference was calculated through the variance of electron density among V-series@C2N complexes and the aggregate electron density of bare C2N surface and isolated V-series nerve agents.
The appearance of blue and purple isosurfaces in EDD analysis indicates orbital interaction between C2N surface and nerve agents (Figure 8). Blue isosurfaces depict an accumulation of electronic density, whereas purple isosurfaces show a depletion of electron density. Blue isosurfaces appeared due to the electrostatic interaction of H-atoms of considered V-type nerve agents and N-atoms of C2N surface, which resulted in a higher accumulation of electron density among nerve agents and C2N surface. Moreover, blue surfaces also reveal sigma (σ) donation of charge from N-atoms of C2N surface to V-type nerve agents, thereby confirming charge transfer from surface towards analytes. The appearance of purple isosurfaces has also been noticed in Figure 8, which indicates the reduction of electron density at the interacting H-atoms of V-series agents. EDD plots revealed electronic density shifting among analytes and surface rings C2N, i.e., benzene and pyrazine rings. Electron Density Difference (EDD) results are also validated through charge transfer (NBO) analysis.

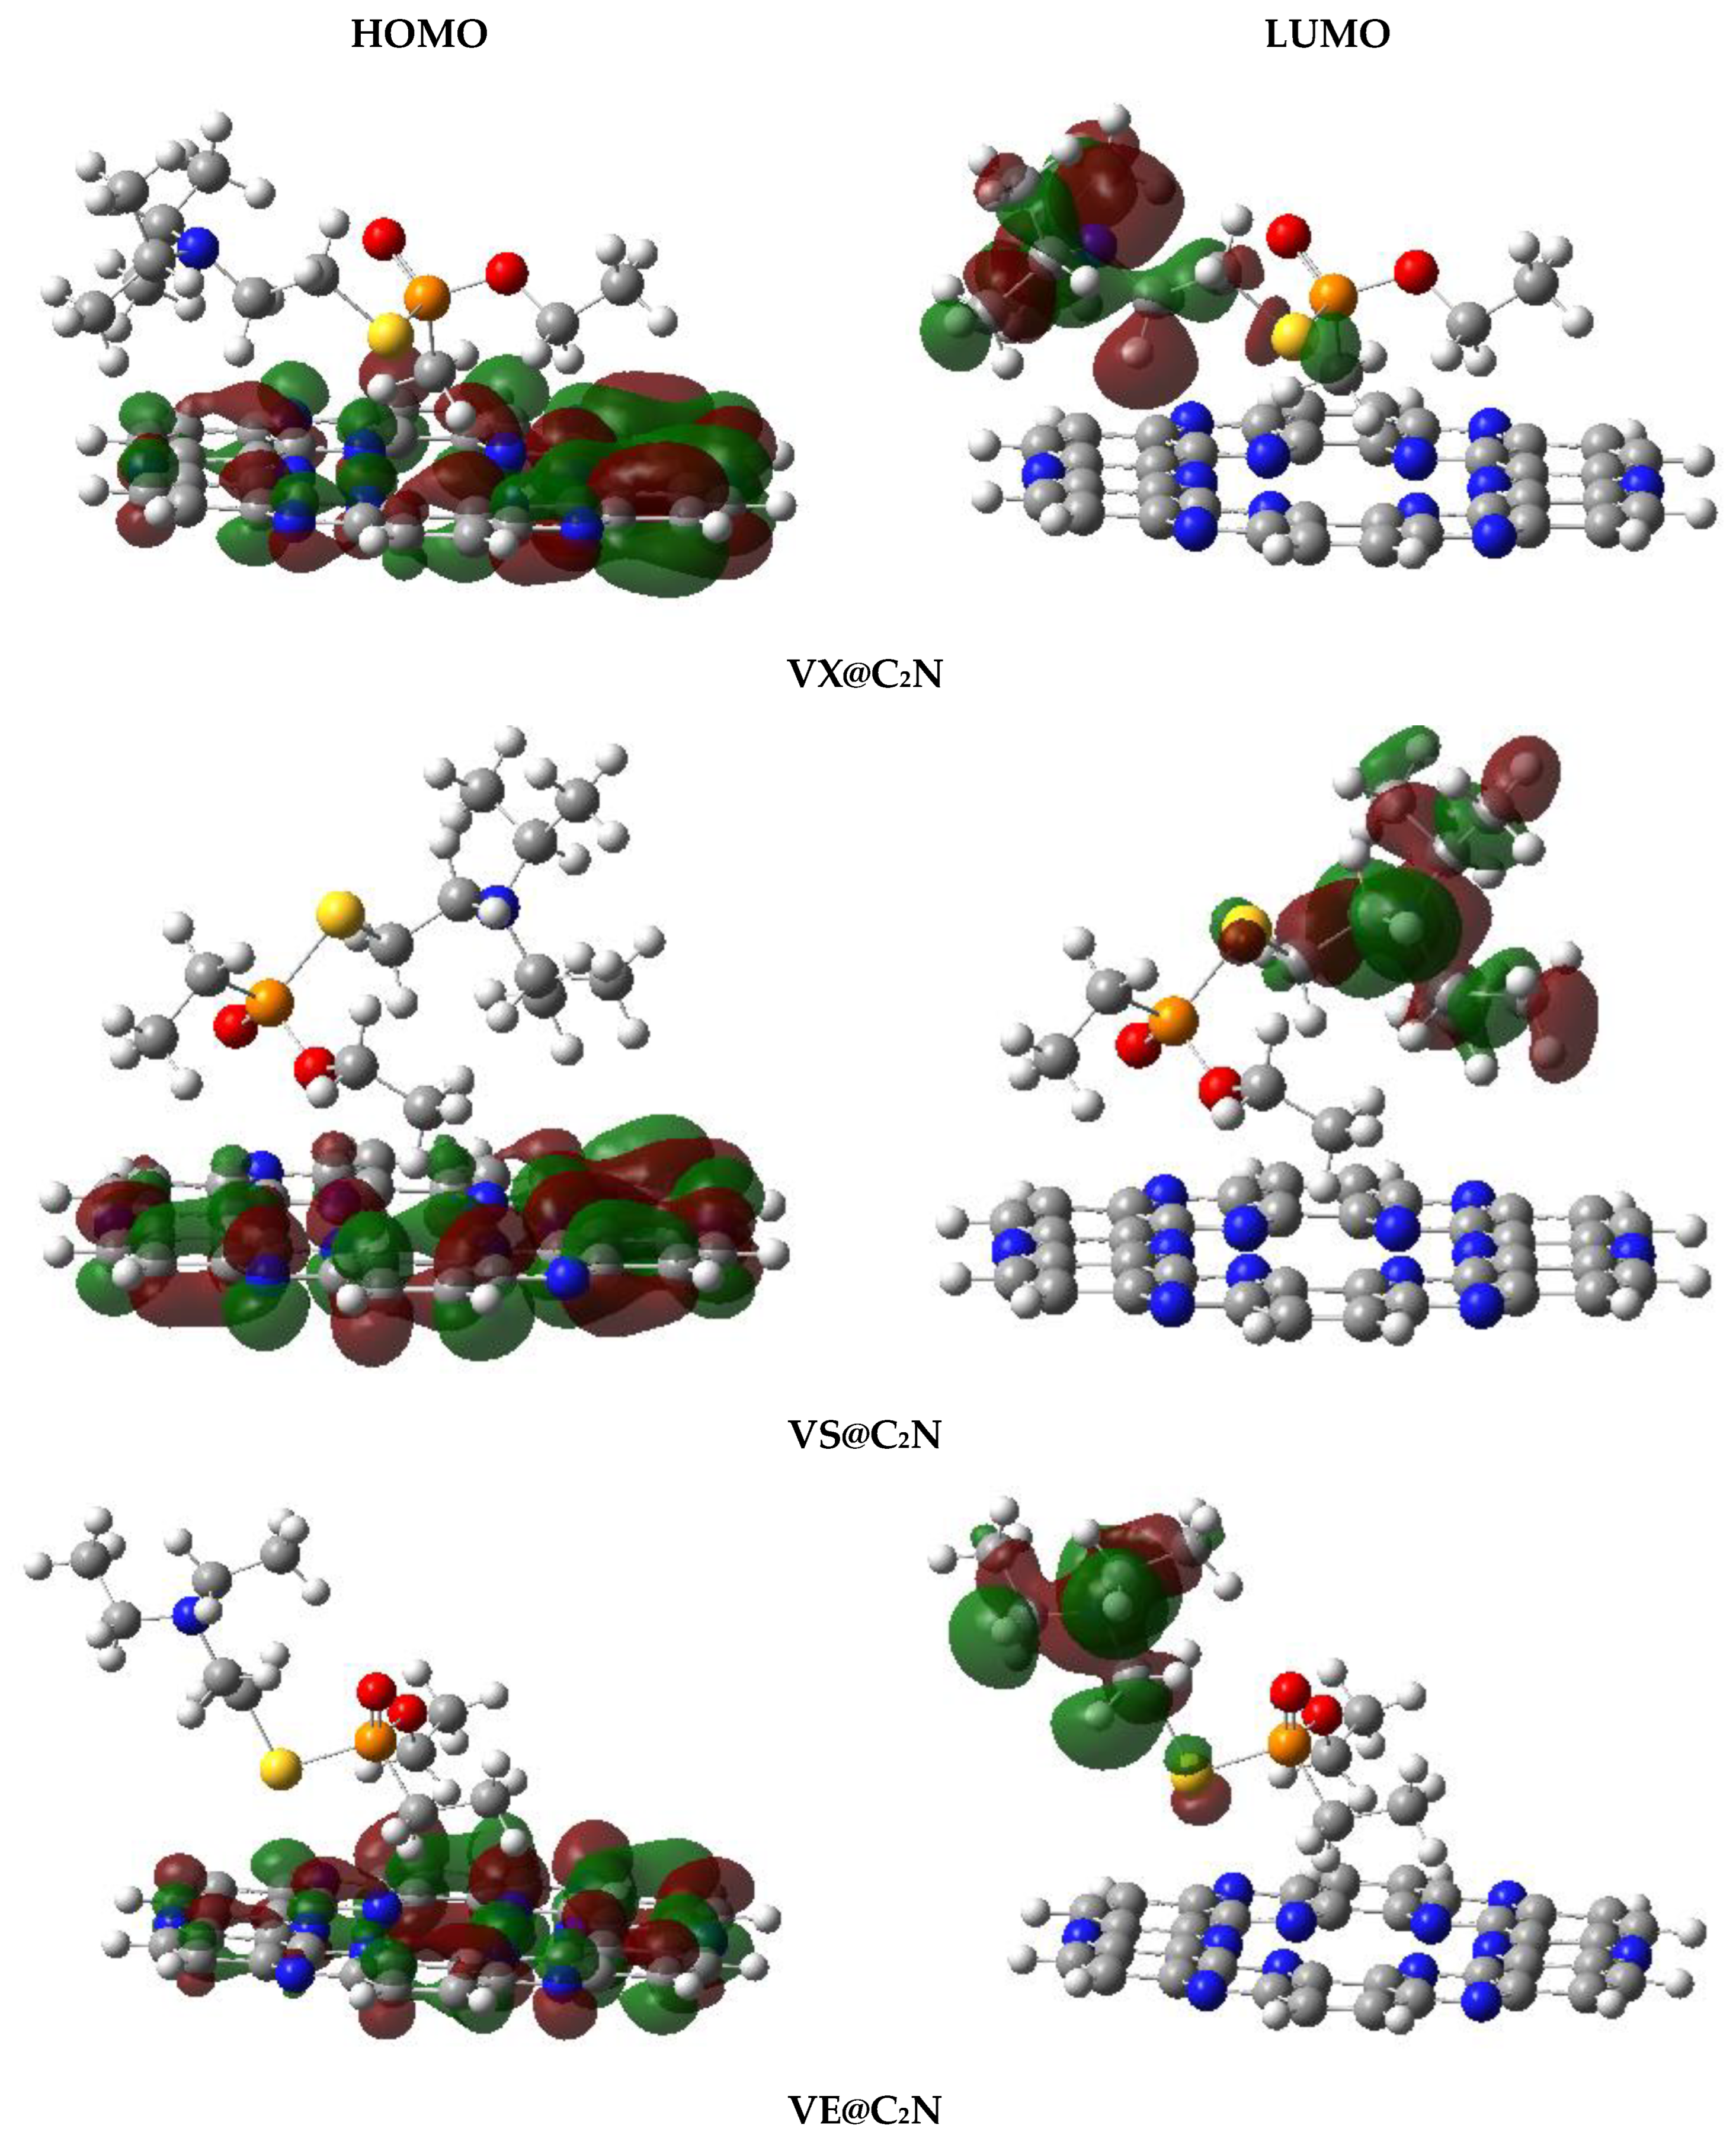
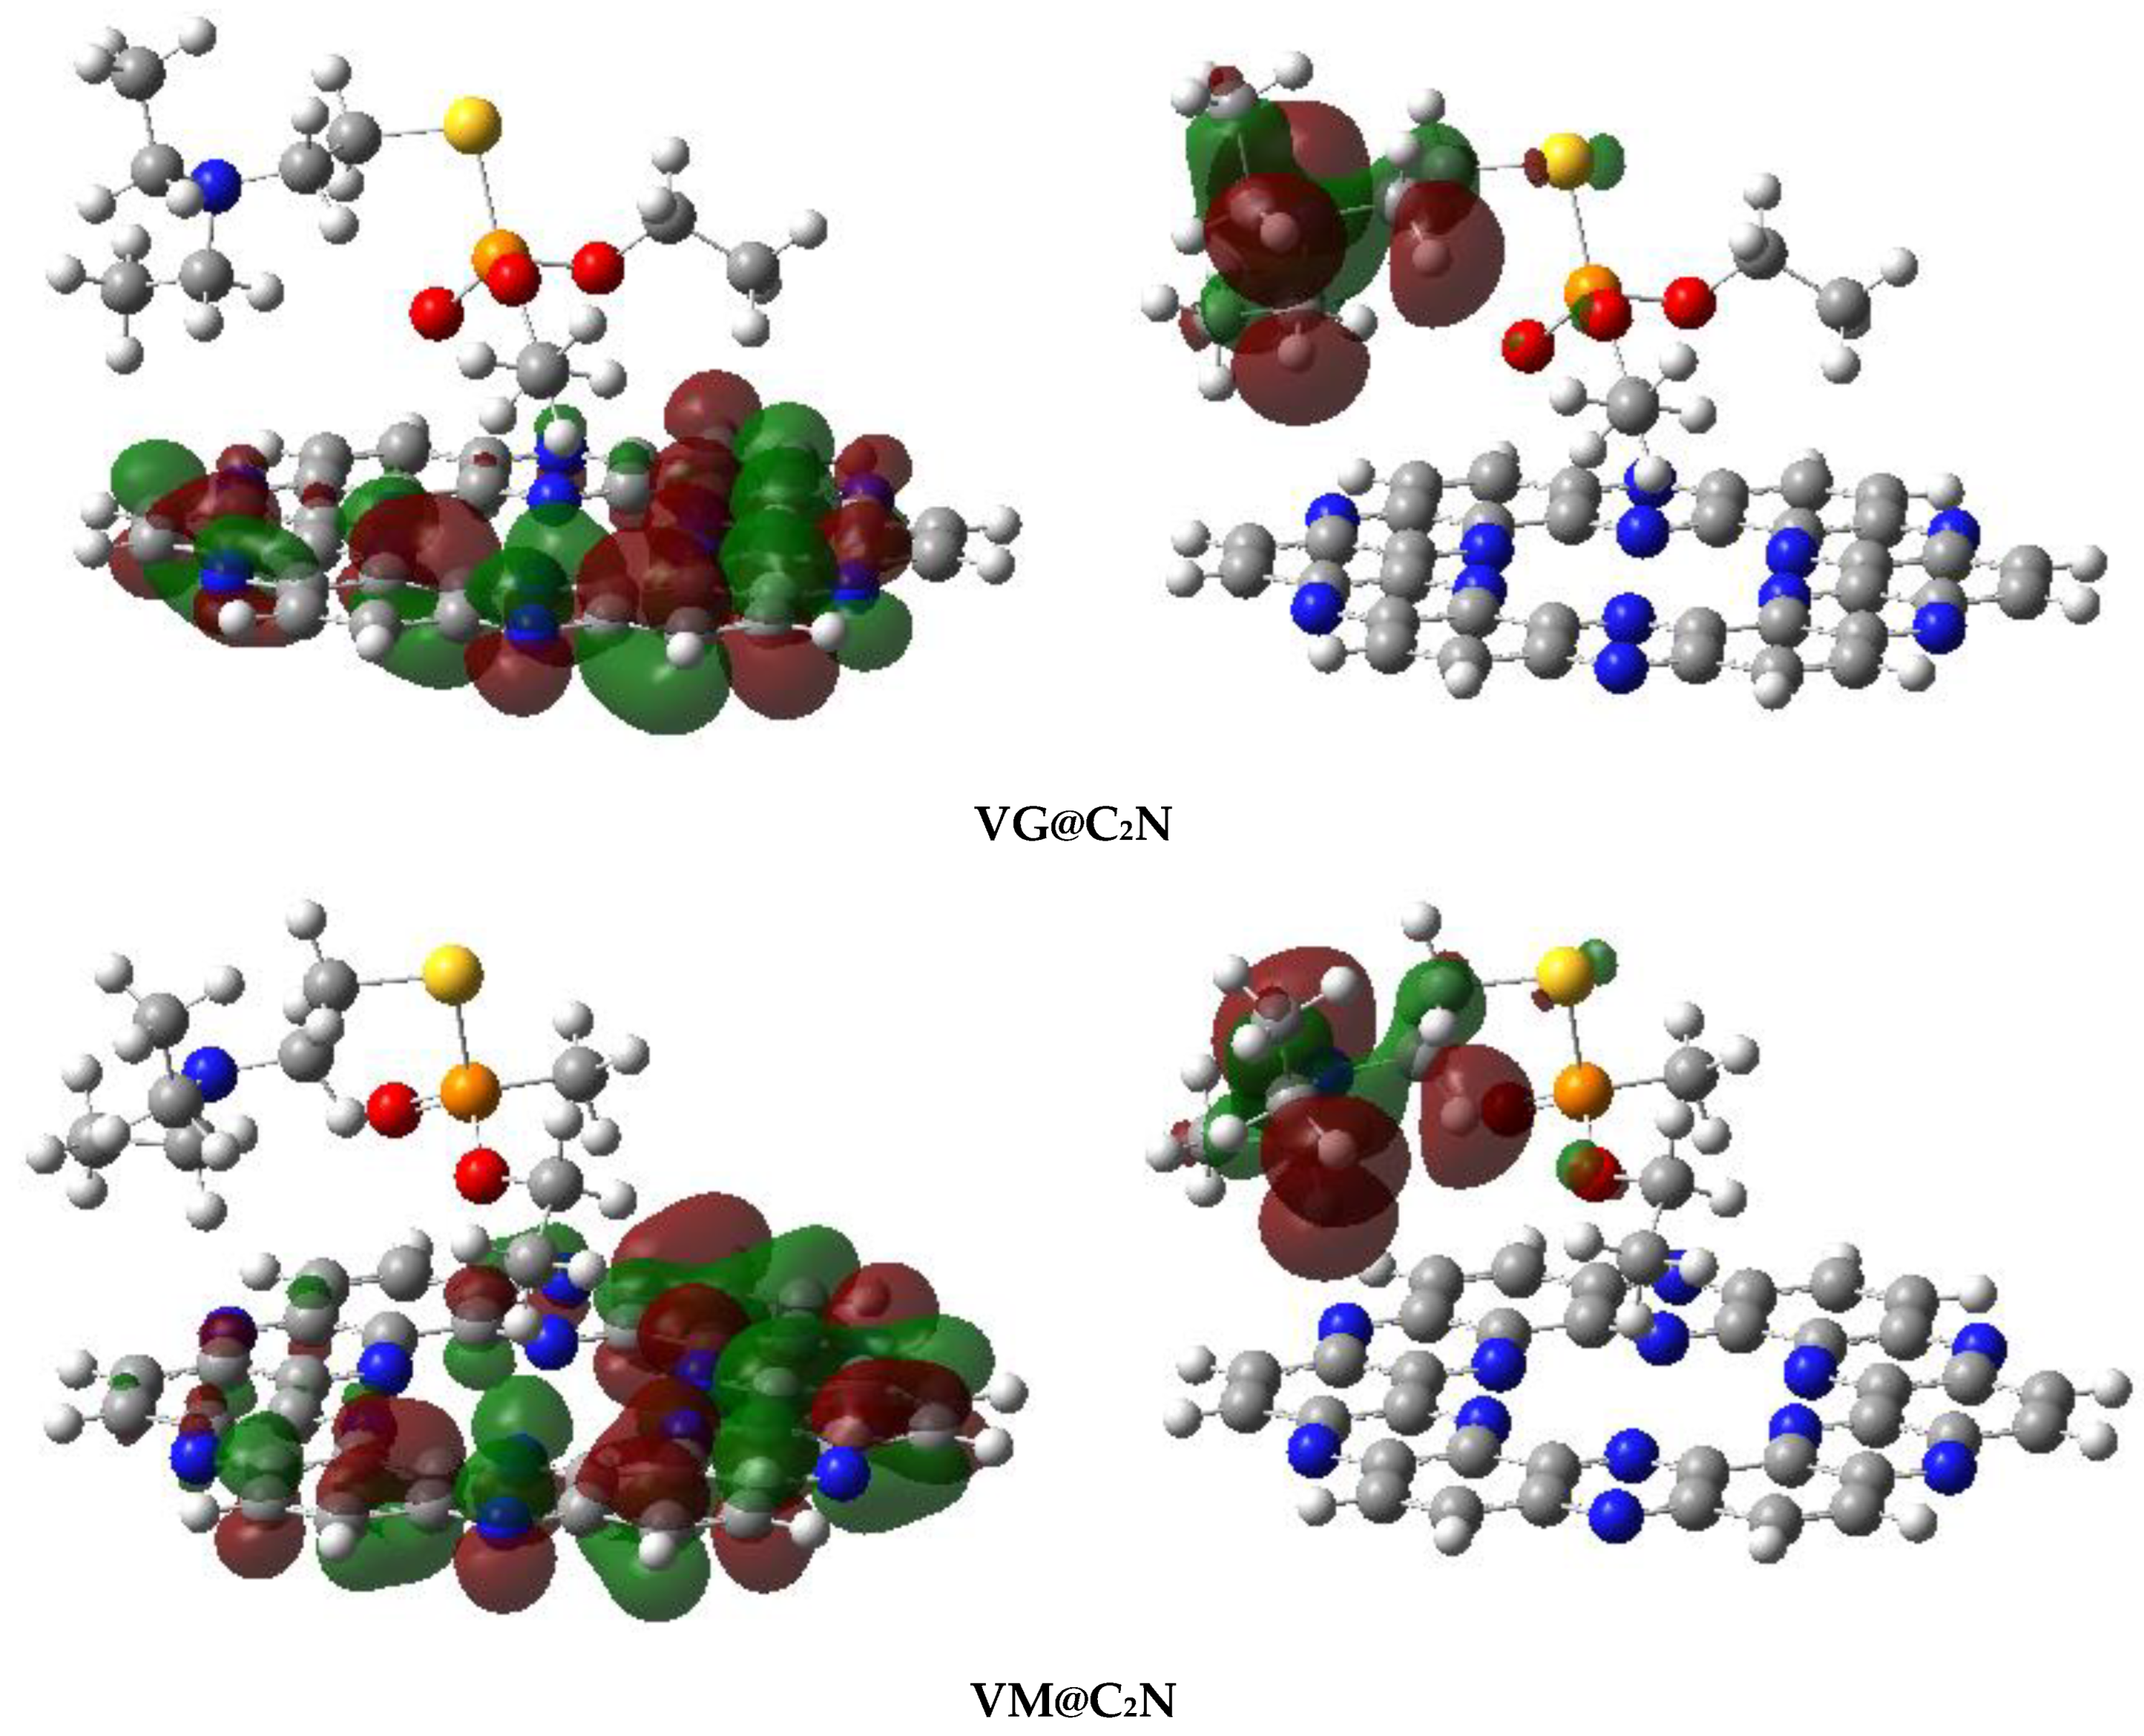
4.3. Frontier Molecular Orbital (FMO) Analysis

Upon complexation with V-series nerve agents, the variation in electronic properties of C2N sheet is evaluated via frontier molecular orbitals analysis. FMO analysis was employed to study the conductivity of the considered material through a change in band gap. Generally, conductivity rises with the decrease in the energy gap (HOMO-LUMO gap) and vice versa [81].
The values of HOMO-LUMO energies in a.u. and eV and their differences (band gap) in eV are reported in Table 4. Isosurfaces of HOMO and LUMO for studied complexes are presented in Figure 9. For bare C2N surface, the HOMO energy is −6.40 eV, the LUMO energy is −2.69 eV, and the energy gap (EH-L) for bare C2N surface is 3.71 eV. The HOMO-LUMO energy gaps (EH-L) of V-series@C2N complexes are 2.13 eV (VX@C2N), 2.63 eV (VS@C2N), 2.47 eV (VE@C2N), 2.81 eV (VG@C2N), and 2.80 eV (VM@C2N). For all studied V-series nerve agents, an appreciable reduction in the HOMO-LUMO energy gap (EH-L) is observed upon the adsorption of V-series analytes on C2N surface.
As a result of the complexation of C2N surface with analyte VX, the HOMO energy increases from −6.40 eV to −5.02 eV, and LUMO energy reduces from −2.69 eV to −2.89. Moreover, the HOMO-LUMO energy gap (EH-L) is changed from 3.71 eV to 2.13 eV. Similar behavior with slight differences is observed for the rest of the V-series nerve agents in terms of variation in energies of HOMO and LUMO and energy gap (EH-L). Upon adsorption of VS over C2N, the energy of HOMO increases (−5.37 eV), which results in a reduced EH-L gap of 2.63 eV, compared to 3.71 eV for isolated C2N. Similarly, the interaction of VE with C2N surface increases the HOMO energy value and decreases LUMO energy; EH-L is reduced to 2.47 eV (see Table 4). Moreover, VG and VM nerve agents also show the same trend upon complexation; HOMO energy values increase to −5.56 eV and −5.57, and LUMO energy values reduce to −2.75 eV and −2.78 eV, respectively. The EH-L are also reduced to 2.81 eV and 2.80 eV for VG and VM complexes, respectively. Among studied V-series@C2N, the most prominent HOMO-LUMO energy gap (EH-L) reduction (2.13 eV) is observed for the VX@C2N complex.
In all studied V-series@C2N complexes, HOMO orbital density is located over C2N surface, whereas, in the case of LUMO, the orbital density is mostly distributed on V-series nerve agents (analytes). Overall, FMO data clearly displays that all studied V-series nerve agents show an appreciable reduction in the EH-L gap upon complexation, which revealed that C2N surface shows higher sensitivity towards V-series nerve agents.

5. Recovery Time

The stability of an ideal sensor can be measured through its ability to reprocess. Suitable recovery time is essential for the adsorption of nerve agents because the very high recovery response of a sensor leads to poisoning of the surface, whereas a very short recovery time does not provide appreciable time for the analyte to stay on the surface. The recovery response time of a sensor is theoretically calculated via transition theory which is given by the equation:
τ = υ 1 exp ( E a d s K T )
where τ, υ, K, Eads, and T represent recovery time, attempt frequency, Boltzmann constant interaction energy, and temperature of recovery, respectively. To evaluate the recovery time of C2N, an attempt frequency of 1012 s−1 is applied [82,83,84]. The recovery times (τ) of V-series@C2N complexes are calculated by using Equation (4) at three different temperatures, i.e., 298, 350, and 400 K. Recovery times of 8.53 s, 11.40 s, and 9.29 s are observed in the case of VX@C2N, VG@C2N, and VM@C2N complexes, respectively. Recovery time improves by rising temperature, i.e., the obtained values of recovery time at 400 K are 4.30 × 10⁻³ s, 5.33 × 10⁻³ s, and 4.58 × 10⁻³ for VX@C2N, VG@C2N, and VM@C2N complexes, respectively. However, the recovery time results seem much better compared to reported values for other surfaces. A short recovery time of 0.63 × 10⁻⁶ s at room temperature for the desorption of G-series nerve agent (GF) from graphdiyne (GDY) surface has been reported in the literature [85]. Moreover, for the desorption of NO2 from C3N surface, 6.8 s of recovery time is required. Similarly, a recovery time of 102 s is needed for the desorption of CO from Au-MoS2 surface at room temperature [86,87]. The C2N surface has been investigated previously by our research group, and very short recovery times of 0.027 s, 0.012 s, and 0.073 s at 298 K for VR, NM, and GF analytes, respectively, had been calculated [25,47]. Desorption results of V-type nerve agents indicates that C2N surface can act as a potential candidate as a sensor with suitable recovery time.

6. Conclusions

In the present study, the sensing ability of carbon nitride quantum dots (C2N) is carried out against V-type nerve agents through DFT at M05-2X/6-31++G(d,p) level of theory. Interaction energy (Eint) values of optimized geometries predict that all studied V-series@C2N complexes are stable (thermodynamically), and adsorption is exothermic. The results indicate that the VE@C2N complex is the most stable complex with the highest interaction energy of −17.81 kcal/mol. The stability of the VE@C2N complex is attributed due to the presence of strong electrostatic forces, as revealed by QTAIM analysis. Laplacian and electron density values and −V/G ratio of all complexes characterized via QTAIM analysis indicate that only non-covalent interactions exist between V-series and C2N units. Non-covalent interaction (NCI) studies depicted by the presence of green spikes revealed weak van der Waals interactions among interacting fragments. FMO analysis indicated that an appreciable decrease in the HOMO-LUMO energy gap (EH-L) occurred for all studied complexes. Reduction in band gap also reveals that C2N surface is highly sensitive and selective towards V-type nerve agents. A short recovery response time of 3.01 ms at 298 K is predicted for the desorption of VS from C2N. The key findings distinctly indicate a better performance of C2N surface as an electrochemical sensor towards the VX analyte. We believe that these results will play a crucial role for an experimentalist to tailor a highly selective electrochemical sensor using C2N surface.

Author Contributions

Conceptualization, K.A. and S.S.; methodology, S.S. and M.Y.; software, A.A.K. and B.A.; validation, M.Y., A.A.K. and B.A.; investigation, S.S. and S.M.; resources, K.A., Y.S.S.A.-F. and N.S.S.; writing—original draft preparation, S.S. and M.Y.; writing—review and editing, K.A., M.Y. and N.S.S.; supervision, K.A.; project administration, K.A., Y.S.S.A.-F. and N.S.S.; funding acquisition, K.A., Y.S.S.A.-F. and N.S.S. All authors have read and agreed to the published version of the manuscript.

Funding

Deanship of Scientific Research, Vice Presidency for Graduate Studies and Scientific Research, King Faisal University, Saudi Arabia [Grant No. 2262], and Higher Education Commission, Pakistan for the support [Grant No. 2981].

Acknowledgments

This work was supported by the Deanship of Scientific Research, Vice Presidency for Graduate Studies and Scientific Research, King Faisal University, Saudi Arabia [Grant No. 2262]. Also, thanks to the Higher Education Commission, Pakistan, for the support [Grant No. 2981].

Conflicts of Interest

The authors declare no conflict of interest.

References

  1. Wu, W.; Sui, S.; Li, J.; Zong, L.; Li, D.; Xiao, Y.; Wang, L.; Zhu, H.; Shen, Y.; Jiang, Z. A fluorescent probe bearing two reactive groups discriminates between fluoride-containing G series and sulfur-containing V series nerve agents. Analyst 2020, 145, 5425–5429. [Google Scholar]
  2. Kim, K.; Tsay, O.G.; Atwood, D.A.; Churchill, D.G. Destruction and detection of chemical warfare agents. Chem. Rev. 2011, 111, 5345–5403. [Google Scholar] [CrossRef]
  3. Snyder, D.T.; Demond, P.S.; Szalwinski, L.J.; Dhummakupt, E.S.; McBride, E.M.; Cooks, R.G.; Glaros, T.; Mach, P.M. Two-dimensional MS/MS scans on a linear ion trap mass analyzer: Identification of V-series chemical warfare agents. Int. J. Mass Spectrom. 2019, 444, 116171. [Google Scholar] [CrossRef]
  4. Dennison, G.H.; Johnston, M.R. Mechanistic insights into the luminescent sensing of organophosphorus chemical warfare agents and simulants using trivalent lanthanide complexes. Chem. A Eur. J. 2015, 21, 6328–6338. [Google Scholar] [CrossRef]
  5. Marrs, T.C.; Rice, P.; Vale, J.A. The role of oximes in the treatment of nerve agent poisoning in civilian casualties. Toxicol. Rev. 2006, 25, 297–323. [Google Scholar] [CrossRef]
  6. Shamai Yamin, T.; Prihed, H.; Madmon, M.; Blanca, M.; Weissberg, A. Structural elucidation of V-type nerve agents by liquid chromatography/electrospray ionization mass spectrometry. J. Mass Spectrom. 2020, 55, e4617. [Google Scholar] [CrossRef]
  7. Rosman, Y.; Eisenkraft, A.; Milk, N.; Shiyovich, A.; Ophir, N.; Shrot, S.; Kreiss, Y.; Kassirer, M. Lessons learned from the Syrian sarin attack: Evaluation of a clinical syndrome through social media. Ann. Intern. Med. 2014, 160, 644–648. [Google Scholar] [CrossRef]
  8. Sulaiman, I.S.C.; Chieng, B.W.; Pojol, F.E.; Ong, K.K.; Rashid, J.I.A.; Yunus, W.M.Z.W.; Kasim, N.A.M.; Halim, N.A.; Noor, S.A.M.; Knight, V.F. A review on analysis methods for nerve agent hydrolysis products. Forensic Toxicol. 2020, 38, 297–313. [Google Scholar] [CrossRef]
  9. Tanimoto, T.; Oshima, Y.; Yuji, K.; Ozaki, A.; Kami, M. Organophosphate poisoning and terrorism. Malays. J. Med. Sci. 2017, 24, 111–112. [Google Scholar] [CrossRef]
  10. Stojiljković, M.P. Nerve agents–a clear and present danger to mankind. Scr. Med. 2019, 50, 109–111. [Google Scholar] [CrossRef]
  11. Salem, H.; Ternay Jr, A.L.; Smart, J.K. Brief history and use of chemical warfare agents in warfare and terrorism. In Chemical Warfare Agents; CRC Press: Boca Raton, FL, USA, 2019; pp. 3–15. [Google Scholar]
  12. Huo, D.; Yang, L.; Hou, C. Optical detection of dimethyl methyl-phosphonate with monosulfonate tetraphenyl porphyrin-plant-esterase complex. Sens. Lett. 2009, 7, 72–78. [Google Scholar] [CrossRef]
  13. Rowell, F.; Seviour, J.; Lim, A.Y.; Elumbaring-Salazar, C.G.; Loke, J.; Ma, J. Detection of nitro-organic and peroxide explosives in latent fingermarks by DART-and SALDI-TOF-mass spectrometry. Forensic Sci. Int. 2012, 221, 84–91. [Google Scholar] [CrossRef]
  14. Seto, Y.; Kanamori-Kataoka, M.; Komano, A.; Nagoya, T.; Sasano, R.; Matsuo, S. Gas chromatography-mass spectrometry with spiral large-volume injection for determination of fluoridated phosphonates produced by fluoride-mediated regeneration of nerve agent adduct in human serum. J. Chromatogr. A 2019, 1583, 108–116. [Google Scholar] [CrossRef]
  15. Dennison, G.H.; Bochet, C.G.; Curty, C.; Ducry, J.; Nielsen, D.J.; Sambrook, M.R.; Zaugg, A.; Johnston, M.R. Supramolecular agent–simulant correlations for the luminescence based detection of V-series chemical warfare agents with trivalent lanthanide complexes. Eur. J. Inorg. Chem. 2016, 2016, 1348–1358. [Google Scholar] [CrossRef]
  16. Song, Y.; Cooks, R.G. Reactive desorption electrospray ionization for selective detection of the hydrolysis products of phosphonate esters. J. Mass Spectrom. 2007, 42, 1086–1092. [Google Scholar] [CrossRef]
  17. Cinti, S.; Minotti, C.; Moscone, D.; Palleschi, G.; Arduini, F. Fully integrated ready-to-use paper-based electrochemical biosensor to detect nerve agents. Biosens. Bioelectron. 2017, 93, 46–51. [Google Scholar] [CrossRef]
  18. Takahashi, F.; Kazui, Y.; Miyaguchi, H.; Ohmori, T.; Tanaka, R.; Jin, J. Simple colorimetric screening of the nerve agent VX using gold nanoparticles and a hand-powered extraction device. Sens. Actuators B Chem. 2021, 327, 128902. [Google Scholar] [CrossRef]
  19. Liu, G.; Lin, Y. Electrochemical stripping analysis of organophosphate pesticides and nerve agents. Electrochem. Commun. 2005, 7, 339–343. [Google Scholar]
  20. Privett, B.J.; Shin, J.H.; Schoenfisch, M.H. Electrochemical sensors. Anal. Chem. 2008, 80, 4499–4517. [Google Scholar] [CrossRef] [Green Version]
  21. Bobbitt, N.S.; Mendonca, M.L.; Howarth, A.J.; Islamoglu, T.; Hupp, J.T.; Farha, O.K.; Snurr, R.Q. Metal–organic frameworks for the removal of toxic industrial chemicals and chemical warfare agents. Chem. Soc. Rev. 2017, 46, 3357–3385. [Google Scholar] [CrossRef]
  22. Stassen, I.; Burtch, N.; Talin, A.; Falcaro, P.; Allendorf, M.; Ameloot, R. An updated roadmap for the integration of metal–organic frameworks with electronic devices and chemical sensors. Chem. Soc. Rev. 2017, 46, 3185–3241. [Google Scholar] [CrossRef]
  23. Chen, S.; Yuan, B.; Liu, G.; Zhang, D. Electrochemical Sensors Based on Covalent Organic Frameworks: A Critical Review. Front. Chem. 2020, 8, 1082. [Google Scholar] [CrossRef]
  24. Alkhalifah, M.A.; Yar, M.; Bayach, I.; Sheikh, N.S.; Ayub, K. Covalent Organic Framework (C6N6) as a Drug Delivery Platform for Fluorouracil to Treat Cancerous Cells: A DFT Study. Materials 2022, 15, 7425. [Google Scholar] [CrossRef]
  25. Yar, M.; Hashmi, M.A.; Khan, A.; Ayub, K. Carbon nitride 2-D surface as a highly selective electrochemical sensor for V-series nerve agents. J. Mol. Liq. 2020, 311, 113357. [Google Scholar] [CrossRef]
  26. Islamoglu, T.; Chen, Z.; Wasson, M.C.; Buru, C.T.; Kirlikovali, K.O.; Afrin, U.; Mian, M.R.; Farha, O.K. Metal–organic frameworks against toxic chemicals. Chem. Rev. 2020, 120, 8130–8160. [Google Scholar] [CrossRef]
  27. Chen, L.; Wu, D.; Yoon, J. Recent advances in the development of chromophore-based chemosensors for nerve agents and phosgene. ACS Sens. 2018, 3, 27–43. [Google Scholar] [CrossRef] [Green Version]
  28. Royo, S.; Martínez-Máñez, R.; Sancenón, F.; Costero, A.M.; Parra, M.; Gil, S. Chromogenic and fluorogenic reagents for chemical warfare nerve agents’ detection. Chem. Commun. 2007, 46, 4839–4847. [Google Scholar] [CrossRef] [Green Version]
  29. Wu, H.; Huo, D.; Zhao, Y.; Ma, N.; Hou, J.; Liu, M.; Shen, C.; Hou, C. A non-enzymatic electro-chemical sensor for organophosphorus nerve agents mimics and pesticides detection. Sens. Actuators B Chem. 2017, 252, 1118–1124. [Google Scholar]
  30. Medeiros, P.V.; Gueorguiev, G.; Stafström, S. Bonding, charge rearrangement and interface dipoles of benzene, graphene, and PAH molecules on Au (1 1 1) and Cu (1 1 1). Carbon 2015, 81, 620–628. [Google Scholar] [CrossRef]
  31. Kakanakova-Georgieva, A.; Giannazzo, F.; Nicotra, G.; Cora, I.; Gueorguiev, G.K.; Persson, P.O.; Pécz, B. Material proposal for 2D indium oxide. Appl. Surf. Sci. 2021, 548, 149275. [Google Scholar] [CrossRef]
  32. Mahmood, J.; Lee, E.K.; Jung, M.; Shin, D.; Jeon, I.-Y.; Jung, S.-M.; Choi, H.-J.; Seo, J.-M.; Bae, S.-Y.; Sohn, S.-D. Nitrogenated holey two-dimensional structures. Nat. Commun. 2015, 6, 6486. [Google Scholar] [CrossRef] [PubMed] [Green Version]
  33. Panigrahi, P.; Desai, M.; Talari, M.K.; Bae, H.; Lee, H.; Ahuja, R.; Hussain, T. Selective decoration of nitrogenated holey graphene (C2N) with titanium clusters for enhanced hydrogen storage application. Int. J. Hydrogen Energy 2021, 46, 7371–7380. [Google Scholar] [CrossRef]
  34. Tian, Z.; Fechler, N.; Oschatz, M.; Heil, T.; Schmidt, J.; Yuan, S.; Antonietti, M. C2NxO1−x framework carbons with defined microporosity and Co-doped functional pores. J. Mater. Chem. A 2018, 6, 19013–19019. [Google Scholar] [CrossRef]
  35. Ahsan, F.; Yar, M.; Gulzar, A.; Ayub, K. Therapeutic potential of C2N as targeted drug delivery system for fluorouracil and nitrosourea to treat cancer: A theoretical study. J. Nanostruct. Chem. 2022, 1–14. [Google Scholar] [CrossRef]
  36. Wang, Y.; Li, Y.; Ju, W.; Wang, J.; Yao, H.; Zhang, L.; Wang, J.; Li, Z. Molten salt synthesis of water-dispersible polymeric carbon nitride nanoseaweeds and their application as luminescent probes. Carbon 2016, 102, 477–486. [Google Scholar] [CrossRef] [Green Version]
  37. Shinde, S.; Sami, A.; Lee, J.-H. Sulfur mediated graphitic carbon nitride/S-Se-graphene as a metal-free hybrid photocatalyst for pollutant degradation and water splitting. Carbon 2016, 96, 929–936. [Google Scholar] [CrossRef]
  38. Zhang, Y.; Antonietti, M. Photocurrent generation by polymeric carbon nitride solids: An initial step towards a novel photovoltaic system. Chem. Asian J. 2010, 5, 1307–1311. [Google Scholar] [CrossRef] [PubMed]
  39. Su, F.; Mathew, S.C.; Möhlmann, L.; Antonietti, M.; Wang, X.; Blechert, S. Aerobic oxidative coupling of amines by carbon nitride photocatalysis with visible light. Angew. Chem. 2011, 123, 683–686. [Google Scholar] [CrossRef]
  40. Shah, A.B.; Sarfaraz, S.; Yar, M.; Sheikh, N.S.; Hammud, H.H.; Ayub, K. Remarkable Single Atom Catalyst of Transition Metal (Fe, Co & Ni) Doped on C2N Surface for Hydrogen Dissociation Reaction. Nanomaterials 2023, 13, 29. [Google Scholar]
  41. Qin, G.; Cui, Q.; Yun, B.; Sun, L.; Du, A.; Sun, Q. High capacity and reversible hydrogen storage on two dimensional C2N monolayer membrane. Int. J. Hydrogen Energy 2018, 43, 9895–9901. [Google Scholar] [CrossRef]
  42. Yar, M.; Shah, A.B.; Hashmi, M.A.; Ayub, K. Selective detection and removal of picric acid by C2N surface from a mixture of nitro-explosives. New J. Chem. 2020, 44, 18646–18655. [Google Scholar] [CrossRef]
  43. Yar, M.; Hashmi, M.A.; Ayub, K. Nitrogenated holey graphene (C2N) surface as highly selective electrochemical sensor for ammonia. J. Mol. Liq. 2019, 296, 111929. [Google Scholar] [CrossRef]
  44. Panigrahi, P.; Sajjad, M.; Singh, D.; Hussain, T.; Andreas Larsson, J.; Ahuja, R.; Singh, N. Two-dimensional Nitrogenated Holey Graphene (C2N) monolayer based glucose sensor for diabetes mellitus. Appl. Surf. Sci. 2022, 573, 151579. [Google Scholar] [CrossRef]
  45. Sajjad, M.; Hussain, T.; Singh, N.; Larsson, J.A. Superior Anchoring of Sodium Polysulfides to the Polar C2N 2D Material: A Potential Electrode Enhancer in Sodium–Sulfur Batteries. Langmuir 2020, 36, 13104–13111. [Google Scholar] [CrossRef]
  46. Yong, Y.; Cui, H.; Zhou, Q.; Su, X.; Kuang, Y.; Li, X. C2N monolayer as NH3 and NO sensors: A DFT study. Appl. Surf. Sci. 2019, 487, 488–495. [Google Scholar] [CrossRef]
  47. Yar, M.; Ahsan, F.; Gulzar, A.; Ayub, K. Adsorption and sensor applications of C2N surface for G-series and mustard series chemical warfare agents. Microporous Mesoporous Mater. 2021, 317, 110984. [Google Scholar] [CrossRef]
  48. Sarfaraz, S.; Yar, M.; Khan, A.A.; Ahmad, R.; Ayub, K. DFT investigation of adsorption of nitro-explosives over C2N surface: Highly selective towards trinitro benzene. J. Mol. Liq. 2022, 352, 118652. [Google Scholar] [CrossRef]
  49. Deshpande, S.S.; Deshpande, M.D.; Hussain, T.; Ahuja, R. Investigating CO2 storage properties of C2N monolayer functionalized with small metal clusters. J. CO2 Util. 2020, 35, 1–13. [Google Scholar] [CrossRef]
  50. Yar, M.; Ayub, K. Expanding the horizons of covalent organic frameworks to electrochemical sensors; A case study of CTF-FUM. Microporous Mesoporous Mater. 2020, 300, 110146. [Google Scholar] [CrossRef]
  51. Burns, L.A.; Mayagoitia, Á.V.; Sumpter, B.G.; Sherrill, C.D. Density-functional approaches to noncovalent interactions: A comparison of dispersion corrections (DFT-D), exchange-hole dipole moment (XDM) theory, and specialized functionals. J. Chem. Phys. 2011, 134, 084107. [Google Scholar] [CrossRef]
  52. Sajid, H.; Mahmood, T.; Ayub, K. High sensitivity of polypyrrole sensor for uric acid over urea, acetamide and sulfonamide: A density functional theory study. Synth. Met. 2018, 235, 49–60. [Google Scholar] [CrossRef]
  53. Blanco, F.; Alkorta, I.; Rozas, I.; Solimannejad, M.; Elguero, J. A theoretical study of the interactions of NF3 with neutral ambidentate electron donor and acceptor molecules. Phys. Chem. Chem. Phys. 2011, 13, 674–683. [Google Scholar] [CrossRef] [PubMed] [Green Version]
  54. Munsif, S.; Ayub, K. Permeability and storage ability of inorganic X12Y12 fullerenes for lithium atom and ion. Chem. Phys. Lett. 2018, 698, 51–59. [Google Scholar] [CrossRef]
  55. Wasim, F.; Mahmood, T.; Ayub, K. An accurate cost effective DFT approach to study the sensing behaviour of polypyrrole towards nitrate ions in gas and aqueous phases. Phys. Chem. Chem. Phys. 2016, 18, 19236–19247. [Google Scholar] [CrossRef]
  56. Yar, M.; Hashmi, M.A.; Ayub, K. The C2N surface as a highly selective sensor for the detection of nitrogen iodide from a mixture of NX3 (X = Cl, Br, I) explosives. RSC Adv. 2020, 10, 31997–32010. [Google Scholar] [CrossRef]
  57. Zhao, Y.; Schultz, N.E.; Truhlar, D.G. Design of Density Functionals by Combining the Method of Constraint Satisfaction with Parametrization for Thermochemistry, Thermochemical Kinetics, and Noncovalent Interactions. J. Chem. Theory Comput. 2006, 2, 364–382. [Google Scholar] [CrossRef] [PubMed]
  58. Ullah, H.; Shah, A.-u.-H.A.; Bilal, S.; Ayub, K. DFT study of polyaniline NH3, CO2, and CO gas sensors: Comparison with recent experimental data. J. Phys. Chem. C 2013, 117, 23701–23711. [Google Scholar] [CrossRef]
  59. Tirado-Rives, J.; Jorgensen, W.L. Performance of B3LYP density functional methods for a large set of organic molecules. J. Chem. Theory Comput. 2008, 4, 297–306. [Google Scholar] [CrossRef]
  60. Senthilkumar, K.; Kondratowicz, M.; Lis, T.; Chmielewski, P.J.; Cybińska, J.; Zafra, J.L.; Casado, J.; Vives, T.; Crassous, J.; Favereau, L. Lemniscular [16] cycloparaphenylene: A radially conjugated figure-eight aromatic molecule. J. Am. Chem. Soc. 2019, 141, 7421–7427. [Google Scholar] [CrossRef]
  61. Sarfaraz, S.; Yar, M.; Ayub, K. Covalent triazine framework (CTF-0) surface as a smart sensing material for the detection of CWAs and industrial pollutants. Mater. Sci. Semicond. Process. 2022, 139, 106334. [Google Scholar] [CrossRef]
  62. Sarfaraz, S.; Yar, M.; Ans, M.; Gilani, M.A.; Ludwig, R.; Hashmi, M.A.; Hussain, M.; Muhammad, S.; Ayub, K. Computational investigation of a covalent triazine framework (CTF-0) as an efficient electrochemical sensor. RSC Adv. 2022, 12, 3909–3923. [Google Scholar] [CrossRef]
  63. Sajid, H.; Ayub, K.; Mahmood, T. A comprehensive DFT study on the sensing abilities of cyclic oligothiophenes (n CTs). New J. Chem. 2019, 43, 14120–14133. [Google Scholar] [CrossRef]
  64. Hussain, R.; Saeed, M.; Mehboob, M.Y.; Khan, S.U.; Khan, M.U.; Adnan, M.; Ahmed, M.; Iqbal, J.; Ayub, K. Density functional theory study of palladium cluster adsorption on a graphene support. RSC Adv. 2020, 10, 20595–20607. [Google Scholar] [CrossRef]
  65. Jadoon, T.; Mahmood, T.; Ayub, K. Silver-graphene quantum dots based electrochemical sensor for trinitrotoluene and p-nitrophenol. J. Mol. Liq. 2020, 306, 112878. [Google Scholar] [CrossRef]
  66. Khan, S.; Sajid, H.; Ayub, K.; Mahmood, T. Adsorption behaviour of chronic blistering agents on graphdiyne; excellent correlation among SAPT, reduced density gradient (RDG) and QTAIM analyses. J. Mol. Liq. 2020, 316, 113860. [Google Scholar] [CrossRef]
  67. Khan, S.; Sajid, H.; Ayub, K.; Mahmood, T. High sensitivity of graphdiyne nanoflake toward detection of phosgene, thiophosgene and phosogenoxime; a first-principles study. J. Mol. Graph. Model. 2020, 100, 107658. [Google Scholar] [CrossRef] [PubMed]
  68. Khan, A.A.; Ahmad, R.; Ahmad, I. Density functional theory study of emerging pollutants removal from water by covalent triazine based framework. J. Mol. Liq. 2020, 309, 113008. [Google Scholar] [CrossRef]
  69. Farooqi, B.A.; Yar, M.; Ashraf, A.; Farooq, U.; Ayub, K. Graphene-polyaniline composite as superior electrochemical sensor for detection of cyano explosives. Eur. Polym. J. 2020, 138, 109981. [Google Scholar] [CrossRef]
  70. Dennison, G.H.; Sambrook, M.R.; Johnston, M.R. VX and VG chemical warfare agents bidentate complexation with lanthanide ions. Chem. Commun. 2013, 50, 195–197. [Google Scholar] [CrossRef]
  71. Mushtaq, M.; Khan, S.; Tit, N. Magnetization effect of Mn-embedded in C2N on hydrogen adsorption and gas-sensing properties: Ab-initio analysis. Appl. Surf. Sci. 2021, 537, 147970. [Google Scholar] [CrossRef]
  72. Zhou, X.; Han, J. Design and simulation of C2N based solar cell by SCAPS-1D software. Mater. Res. Express 2020, 7, 126303. [Google Scholar] [CrossRef]
  73. Sajid, H.; Mahmood, T.; Ayub, K. An accurate comparative theoretical study of the interaction of furan, pyrrole, and thiophene with various gaseous analytes. J. Mol. Model. 2017, 23, 295. [Google Scholar] [CrossRef] [PubMed]
  74. Sajid, H.; Ullah, F.; Ayub, K.; Mahmood, T. Cyclic versus straight chain oligofuran as sensor: A detailed DFT study. J. Mol. Graph. Model. 2020, 97, 107569. [Google Scholar] [CrossRef]
  75. Cremer, D.; Kraka, E. Chemical bonds without bonding electron density—Does the difference electron-density analysis suffice for a description of the chemical bond? Angew. Chem. Int. Ed. Engl. 1984, 23, 627–628. [Google Scholar] [CrossRef]
  76. Yuan, K.; Liu, C.; Han, J.; Yu, G.; Wang, J.; Duan, H.; Wang, Z.; Jian, X. Phthalazinone structure-based covalent triazine frameworks and their gas adsorption and separation properties. RSC Adv. 2016, 6, 12009–12020. [Google Scholar] [CrossRef]
  77. Mata, I.; Alkorta, I.; Espinosa, E.; Molins, E. Relationships between interaction energy, intermolecular distance and electron density properties in hydrogen bonded complexes under external electric fields. Chem. Phys. Lett. 2011, 507, 185–189. [Google Scholar] [CrossRef]
  78. Pastorczak, E.; Corminboeuf, C. Perspective: Found in translation: Quantum chemical tools for grasping non-covalent interactions. J. Chem. Phys. 2017, 146, 120901. [Google Scholar] [CrossRef] [Green Version]
  79. Varadwaj, A.; Marques, H.M.; Varadwaj, P.R. Is the fluorine in molecules dispersive? Is molecular electrostatic potential a valid property to explore fluorine-centered non-covalent interactions? Molecules 2019, 24, 379. [Google Scholar] [CrossRef] [PubMed] [Green Version]
  80. Rad, A.S.; Ayub, K. O3 and SO2 sensing concept on extended surface of B12N12 nanocages modified by Nickel decoration: A comprehensive DFT study. Solid State Sci. 2017, 69, 22–30. [Google Scholar] [CrossRef]
  81. Arshad, M.N.; Faidallah, H.M.; Asiri, A.M.; Kosar, N.; Mahmood, T. Structural, spectroscopic and nonlinear optical properties of sulfonamide derivatives; experimental and theoretical study. J. Mol. Struct. 2020, 1202, 127393. [Google Scholar] [CrossRef]
  82. Peng, S.; Cho, K.; Qi, P.; Dai, H. Ab initio study of CNT NO2 gas sensor. Chem. Phys. Lett. 2004, 387, 271–276. [Google Scholar] [CrossRef]
  83. Bai, L.; Zhou, Z. Computational study of B-or N-doped single-walled carbon nanotubes as NH3 and NO2 sensors. Carbon 2007, 45, 2105–2110. [Google Scholar] [CrossRef]
  84. Hosseinian, A.; Asadi, Z.; Edjlali, L.; Bekhradnia, A.; Vessally, E. NO2 sensing properties of a borazine doped nanographene: A DFT study. Comput. Theor. Chem. 2017, 1106, 36–42. [Google Scholar] [CrossRef]
  85. Khan, S.; Yar, M.; Kosar, N.; Ayub, K.; Arshad, M.; Zahid, M.N.; Mahmood, T. First-principles study for exploring the adsorption behavior of G-series nerve agents on graphdyine surface. Comput. Theor. Chem. 2020, 1191, 113043. [Google Scholar] [CrossRef]
  86. Ma, D.; Ju, W.; Li, T.; Zhang, X.; He, C.; Ma, B.; Lu, Z.; Yang, Z. The adsorption of CO and NO on the MoS2 monolayer doped with Au, Pt, Pd, or Ni: A first-principles study. Appl. Surf. Sci. 2016, 383, 98–105. [Google Scholar] [CrossRef]
  87. Ma, D.; Zhang, J.; Li, X.; He, C.; Lu, Z.; Lu, Z.; Yang, Z.; Wang, Y. C3N monolayers as promising candidates for NO2 sensors. Sens. Actuators B Chem. 2018, 266, 664–673. [Google Scholar] [CrossRef]
Figure 1. Chemical structures of studies V-type nerve agents.
Nanomaterials 13 00251 g001
Figure 2. Optimized geometry of C2N surface with four binding sites (A, B, C, and D) at the M05-2X/6-31++G(d,p) level of theory (yellow shows nitrogen, red represents hydrogen and light purple represents carbon).
Nanomaterials 13 00251 g002
Figure 3. The optimized geometries of V-series@C2N complexes at M05-2X/6-31++G(d,p) level of theory.
Nanomaterials 13 00251 g003
Figure 4. NCI 3D isosurfaces of optimized geometries of stable V-series@C2N complexes computed at M05-2X method (iso value 0.05 a.u.) here red color is for repulsive interaction, green color indicates weak van der Waal’s forces interactions, and blue color is for strong electrostatic interactions.
Nanomaterials 13 00251 g004aNanomaterials 13 00251 g004b
Figure 5. 2D-RDG plots of studied complexes via NCI analysis.
Nanomaterials 13 00251 g005aNanomaterials 13 00251 g005b
Figure 6. QTAIM analysis of studied V-series@C2N complexes and yellow lines between nerve agent molecules and C2N sheet indicates bond paths, whereas orange-colored dots present on bond paths show the bond critical points (BCPs).
Nanomaterials 13 00251 g006aNanomaterials 13 00251 g006b
Figure 7. SAPT0 analysis of V-series@C2N complexes graphical representation.
Nanomaterials 13 00251 g007
Figure 8. EDD plots of V-series@C2N with Iso value = 0.004 a.u. (Blue isosurfaces show accumulation of electron density, while purple isosurfaces represent depletion of electron density).
Nanomaterials 13 00251 g008
Figure 9. HOMO-LUMO densities of the studied V-series@C2N surface.
Nanomaterials 13 00251 g009aNanomaterials 13 00251 g009b
Table 1. Bond lengths (Å) and interaction energies (kcal/mol) of the V-series@C2N complexes at the M05-2X/ 6-31++G(d,p) level of theory.
Nitro@C2N
ComplexIntermolecular BondBond Length (Å)Eint (kcal/mol)
VX@C2NH10--N12.80−17.64
H9--N22.75
H9--N32.38
H9--N42.85
H8--N52.40
H7--H62.78
VS@C2NH7--N12.87−12.93
H6--N32.96
H6--N42.84
H5--N22.99
VE@C2NH9--N12.87−13.97
H8--N22.55
H8--N32.72
H10--N52.72
H10--N62.65
H7--N42.72
VG@C2NH7--N12.84−17.81
H7--N22.40
H10--N32.42
H10--N42.72
H8--H62.90
O9--C52.84
VM@C2NH7--N12.86−17.69
H6--N22.79
H6--N32.91
H5--H42.66
Table 2. Topological parameters obtained through QTAIM analysis for studied V-series@C2N complexes.
Analyte---C2Nρ
(a.u)
2ρ
(a.u)
G (r)
(a.u)
V(r)
(a.u)
H(r)
(a.u)
−V/GEint (kcal/mol)
VX@C2N
H19---C110.0070.0220.004−0.00350.00100.87−1.10
H17---N10.0120.0370.008−0.00770.00070.96−2.41
H20---N100.0070.0220.005−0.00370.00100.74−1.16
H16---N20.0060.0200.004−0.00310.00090.77−0.97
H15---N60.0060.0220.004−0.00350.00100.87−1.10
H15---N30.0110.0360.008−0.00730.00090.91−2.29
H17---N80.0060.0210.004−0.00320.00100.80−1.00
H14---C40.0040.0110.002−0.00170.00060.85−0.53
H13---C50.0050.0170.004−0.00210.00080.52−0.66
S21---C220.0080.0230.005−0.00370.00100.74−1.16
H18---C120.0050.0150.003−0.00230.00080.77−0.72
VS@C2N
H20---C100.0030.0120.002−0.00180.00060.90−0.56
H22---N10.0040.0140.003−0.00190.00070.63−0.59
H22---N30.0050.0190.004−0.00290.00090.72−0.91
H20---N120.0050.0180.004−0.00290.00080.72−0.91
H22---N40.0050.0190.004−0.00280.00090.70−0.88
H22---N80.0060.0210.004−0.00320.00100.80−1.00
H22---N110.0050.0190.004−0.00290.00090.72−0.91
H19---C100.0040.0140.003−0.00200.00080.67−0.62
H18---C90.0040.0130.003−0.00180.00070.60−0.56
O16---N80.0080.0260.006−0.00490.00090.82−1.54
H14---C50.0050.0170.003−0.00270.00080.90−0.85
H14---C60.0050.0170.003−0.00270.00080.90−0.85
H21---C130.0030.0120.002−0.00180.00060.90−0.56
O16---N40.0090.0320.007−0.00670.00070.96−2.10
O16---C70.0080.0290.006−0.00550.00090.92−1.72
VE@C2N
H9---N30.0020.0080.002−0.00110.00050.55−0.34
H9---N20.0020.0080.002−0.00100.00050.50−0.31
S12---C60.0030.0090.002−0.00110.00050.55−0.34
H10---N40.0020.0080.002−0.00110.00050.55−0.34
H11---N10.0030.0100.002−0.00140.00060.70−0.44
H11---N50.0030.0100.002−0.00140.00060.70−0.44
VG@C2N
H12---N100.0070.0250.005−0.00400.00100.80−1.25
O14---C60.0040.0140.003−0.00230.00070.77−0.72
O16---C40.0070.0250.005−0.00400.00110.80−1.25
H13---N10.0110.0330.008−0.00700.00070.87−2.19
H15---N30.0110.0360.008−0.00730.00080.91−2.29
H15---N50.0050.0180.004−0.00300.00080.75−0.94
H13---N20.0060.0200.004−0.00340.00080.85−1.07
H11---C70.0060.0190.004−0.00290.00100.72−0.91
H18---C90.0040.0140.003−0.00210.00070.70−0.66
H17---N80.0060.0200.004−0.00350.00080.87−1.10
H19---N80.0040.0140.003−0.00230.00060.77−0.72
VM@C2N
O21---C60.0050.0180.004−0.00310.00080.77−0.97
H16---N120.0050.0170.003−0.00250.00080.83−0.78
O21---C40.0050.0170.004−0.00290.00070.72−0.91
O21---C50.0050.0180.004−0.00310.00070.77−0.97
O20---N100.0090.0290.007−0.00600.00060.86−1.88
H17---C130.0070.0230.005−0.00370.00100.74−1.16
H19---C110.0040.0140.003−0.00200.00080.67−0.62
H16---N20.0060.0190.004−0.00290.00100.72−0.91
H16---N30.0060.0200.004−0.00310.00100.77−0.97
H16---N70.0050.0160.003−0.00240.00080.80−0.75
H16---N100.0040.0140.003−0.00200.00070.67−0.63
H15---N10.0050.0180.004−0.00290.00080.72−0.91
H23---N90.0040.0150.003−0.00240.00070.80−0.75
Table 3. SAPT0 analysis of V-series@C2N complexes (kcal/mol).
Complexes∆Eelst%∆Eexch ∆Eind%∆Edis%∆ESAPT0
VX@C2N−13.1826.6023.28−4.499.06−31.8864.34−26.27
VS@C2N−10.2821.2422.20−5.1210.59−32.9968.17−26.20
VE@C2N−10.6626.1818.23−3.478.52−26.5865.29−22.49
VG@C2N−15.3929.2025.14−5.8311.06−31.4859.73−27.56
VM@C2N−9.3721.3919.75−4.6210.55−29.8068.05−24.04
Table 4. FMO and NBO results of most stable V-series@C2N complexes.
ComplexesHOMO eVLUMO eVEH-LNBO (e)
VX@C2N−5.02−2.892.13−0.023
VS@C2N−5.37−2.742.63−0.020
VE@C2N−5.35−2.882.47−0.012
VG@C2N−5.56−2.752.81−0.013
VM@C2N−5.57−2.782.80−0.002
C2N−6.40−2.693.71--
Disclaimer/Publisher’s Note: The statements, opinions and data contained in all publications are solely those of the individual author(s) and contributor(s) and not of MDPI and/or the editor(s). MDPI and/or the editor(s) disclaim responsibility for any injury to people or property resulting from any ideas, methods, instructions or products referred to in the content.

