Article

Microorganism-Templated Nanoarchitectonics of Hollow TiO2-SiO2 Microspheres with Enhanced Photocatalytic Activity for Degradation of Methyl Orange

1
Department of Chemical and Biochemical Engineering, College of Chemistry and Chemical Engineering, Xiamen University, Xiamen 361005, China
2
Department of Chemical Engineering and Pharmacy, College of Chemical Engineering and Materials Science, Quanzhou Normal University, Quanzhou 362000, China
*
Author to whom correspondence should be addressed.
Nanomaterials 2022, 12(9), 1606; https://doi.org/10.3390/nano12091606
Submission received: 5 April 2022 / Revised: 3 May 2022 / Accepted: 4 May 2022 / Published: 9 May 2022

Abstract

:
In this study, hollow SiO2 microspheres were synthesized by the hydrolysis of tetraethyl orthosilicate (TEOS) according to the Stober process, in which Pichia pastoris GS 115 cells were served as biological templates. The influence of the preprocessing method, the TEOS concentration, the ratio of water to ethanol, and the aging time on the morphology of microspheres was investigated and the optimal conditions were identified. Based on this, TiO2-SiO2 microspheres were prepared by the hydrothermal process. The structures and physicochemical properties of TiO2-SiO2 photocatalysts were systematically characterized and discussed. The photocatalytic activity for the degradation of methyl orange (MO) at room temperature under Xe arc lamp acting as simulated sunlight was explored. The result showed that the as-prepared TiO2-SiO2 microspheres exhibited a good photocatalytic performance.

1. Introduction

The rapid development of the textile industry not only brings considerable economic benefits, but also aggravates environmental pollution. Due to the complex composition of textile wastewater and its high content of organic substances, harmful substances, and deep chroma, which cause serious harm to water bodies, the treatment of textile wastewater is imperative [1,2]. Water-soluble azo dyes including MO are the main targets of pollution control. Many treatment methods of dye removal have been investigated, including adsorption [3,4], photo-Fenton oxidation [5,6,7], H2O2/UV (ultraviolet) treatment [8,9], photocatalysis [10,11], and biological treatment [12,13,14]. Among these methods, photocatalysis is considered an effective method to degrade dyes in wastewater [15].
TiO2 is considered to be one of the most promising photocatalysts for the removal of organic pollutants in textile wastewater due to its low cost, strong oxidizing properties, non-toxicity, and biochemical inertness [16,17,18]. However, there are some imperfections, such as its large energy gap, high photoelectric hole recombination rate, etc. [19,20,21,22]. The small nanoparticles have a high surface energy and readily form agglomerates, and their wide band gap (3.2 eV) makes them inactive under visible light irradiation. Moreover, the application in high temperature and high-pressure reactions is limited due to the poor mechanical strength and thermal stability of TiO2. Therefore, researchers are looking for more effective methods with which to improve the surface-active sites of TiO2, the photoelectron-hole separation rate, the solar energy usage efficiency, and the spectral response to enhance its photocatalytic performance [23]. One of the most promising methods to enhance the activity of TiO2 under visible light and sunlight irradiation is to dope non-metals such as N, C, and Si. Due to the difference in properties between Si and Ti, mesoporous SiO2 is more stable than mesoporous TiO2. Mesoporous TiO2 can easily cause the collapse of the mesoporous structure when the template is removed by calcination at high temperatures, while silicon-based materials have a good thermal stability. Taking advantage of the good thermal stability of silicon-based materials, titanium-silicon composites could be prepared by loading titanium onto mesoporous silicon-based materials, which can effectively solve the pore structure instability of mesoporous TiO2 [20].
The methods used for combining TiO2 and SiO2 can be roughly divided into two categories. One involves the mechanical mixture of TiO2 and SiO2. The other involves the use of chemical methods such as co-precipitation and sol–gel, where the composite oxide TiO2-SiO2 with Ti-O-Si bonds is obtained [24,25,26]. It is generally believed that TiO2-SiO2 oxides with Ti-O-Si bonds perform better as catalyst supports than mechanically mixed TiO2-SiO2 [27]. Among various composite oxides, TiO2-SiO2 composite oxides, especially in the mesoporous structure, exhibit a good chemical stability, availability, reusability, and controllability of pore structure [28]. Compared with other chemical methods, hydrothermal methods are often applied for the preparation of metal oxide materials because of their characteristics of a fast reaction speed, an adjustable structure, and crystallinity. In this study, microorganism cells-templated TiO2-SiO2 hollow microspheres were synthesized by the combination of the Stober process and the hydrothermal process and the photocatalytic activity for the degradation of methyl orange was investigated (see Figure A1).

2. Materials and Methods

2.1. Materials

TEOS (tetraethyl orthosilicate, purity ≥ 98%), TBOT (titanium butoxide, purity ≥ 99%), 25% ammonia solution (purity ≥ 99.5%), nitric acid (65.0~68.0%), methyl orange, and ethanol (purity ≥ 99.7%) were used without further purification. Pichia pastoris GS115 (P. pastoris GS115) cells were cultured in our laboratory.

2.2. Methods

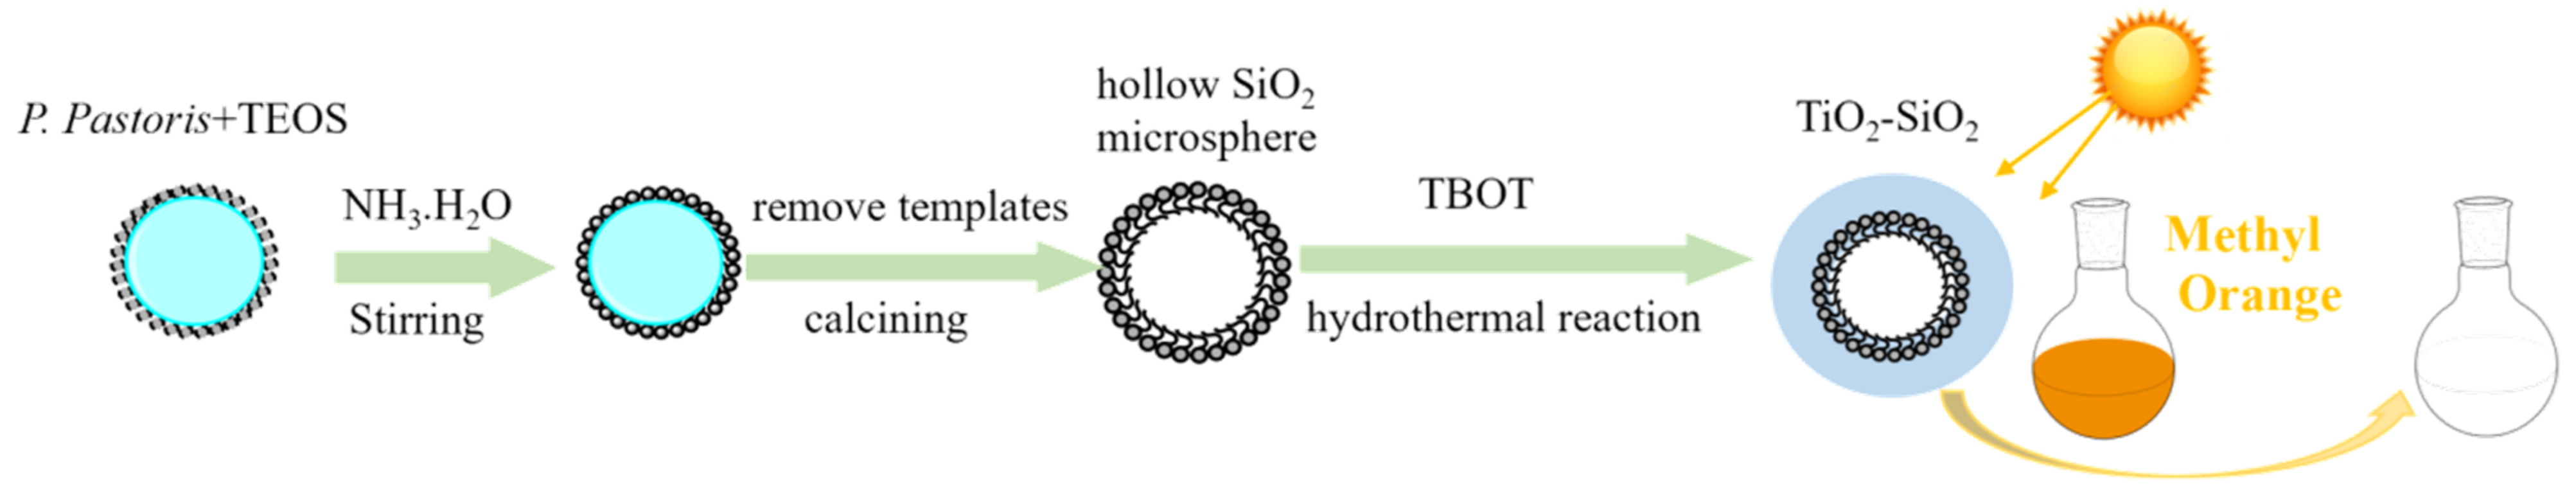
2.2.1. Preparation of Hollow SiO2 Microspheres

Hollow SiO2 microspheres were synthesized using microorganism cells as templates according to the Stober process. In a typical experiment, 0.2 g of P. pastoris GS115 cells were suspended in 4.2 mL of ultrapure water and 10.5 mL of absolute ethanol (the ratio of water–ethanol was 1/2). The mixture was placed on a magnetic stirrer to stir at 25 °C for 1 h. Then, 6.4 mL of TEOS (1.2 mol/L, if not specified) was added and allowed to react for 2 h, followed by 2.85 mL of ammonia for another 1 h. The suspension was agitated at 25 °C for 12 h (if not specified). The product was separated by centrifugation (3500 r/min, 10 mins) and washed with ethanol and water several times. The precipitate was dried and calcinated at 550 °C for 2 h with a heating rate of 2 °C/min.

2.2.2. Preparation of TiO2-SiO2

A total of 2 g of the as-synthesized hollow SiO2 microspheres was dispersed in 25 mL of anhydrous ethanol and 0.25 mL of TBOT. The solution was labeled as solution A. Then, 0.2 mL of nitric acid was added into the mixture of anhydrous ethanol (25 mL) and ultra-pure water (10 mL). The solution was labeled as solution B. Solution A was continuously stirred at 25 °C for 5 min, and then solution B was added drop by drop and stirred for another 2 h. The mixture was transferred to a reaction kettle and heated at 180 °C for 24 h. After the hydrothermal reaction was completed, the samples were separated by centrifugation (3500 r/min, 10 min) and washed alternately with water and ethanol several times. The obtained samples were dried in an oven at 80 °C for 10 h and calcinated at 550 °C for 1 h with a heating rate of 2 °C/min.

2.2.3. Determination of Photocatalytic Performance

The photocatalytic experiments were carried out in a glass vessel by a 300 W Xe arc lamp acting as simulated sunlight. The initial concentration of the methyl orange was 10 mg/L. A total of 80 mg of the photocatalyst was taken in 80 mL of MO solution. Illumination was implemented after dark treatment for 1 h to reach adsorption–desorption equilibrium. At specific time intervals (every 20 min), 4 mL of the sample was taken from the suspensions and centrifuged to remove the catalyst prior to spectral measurement.

2.3. Characterization Methods

The crystal structure of the samples was determined by an X-ray diffractometer (XRD, X’Pert Pro MPD, Panalytical, The Netherlands) operated at a voltage of 40 kV and a current of 30 mA with Cu Kα radiation. The observations of morphology and microstructure were performed on a scanning electron microscope (SEM, ZEISS Sigma, Oberkochen, Germany) and a transmission electron microscope (TEM, Philips Tecnai F30, Eindhoven, The Netherlands) operated at an accelerating voltage of 300 kV. The specific surface area, pore volume, and pore size distribution of the samples were determined by Tristar-type low-temperature N2 physical adsorption and desorption (BET, NOVA2200e, Quantachrome, Boynton Beach, FL, USA). The thermogravimetric (TG) studies were carried out on Netzsch TG209F1 thermobalance (NETZSCH Scientific Instruments Co., Selb, Germany) under a flowing-air atmosphere at a heating rate of 10 °C/min. X-ray Photoelectron Spectroscopy (XPS) measurements were performed on a PHI 5000 versa probe-II microprobe (Ulvac-Phi, Kanagawa, Japan). The UV-DRS analysis was performed on a UV-VIS Cary 5000 instrument (Varian, Palo Alto, CA, USA). BaSO4 was served as a reference. The Fourier Transform Infrared Spectroscopy (FTIR) analysis was carried out on a Nicolet 6700 instrument (Thermo Fisher Scientific, Waltham, MA, USA).

3. Results and Discussion

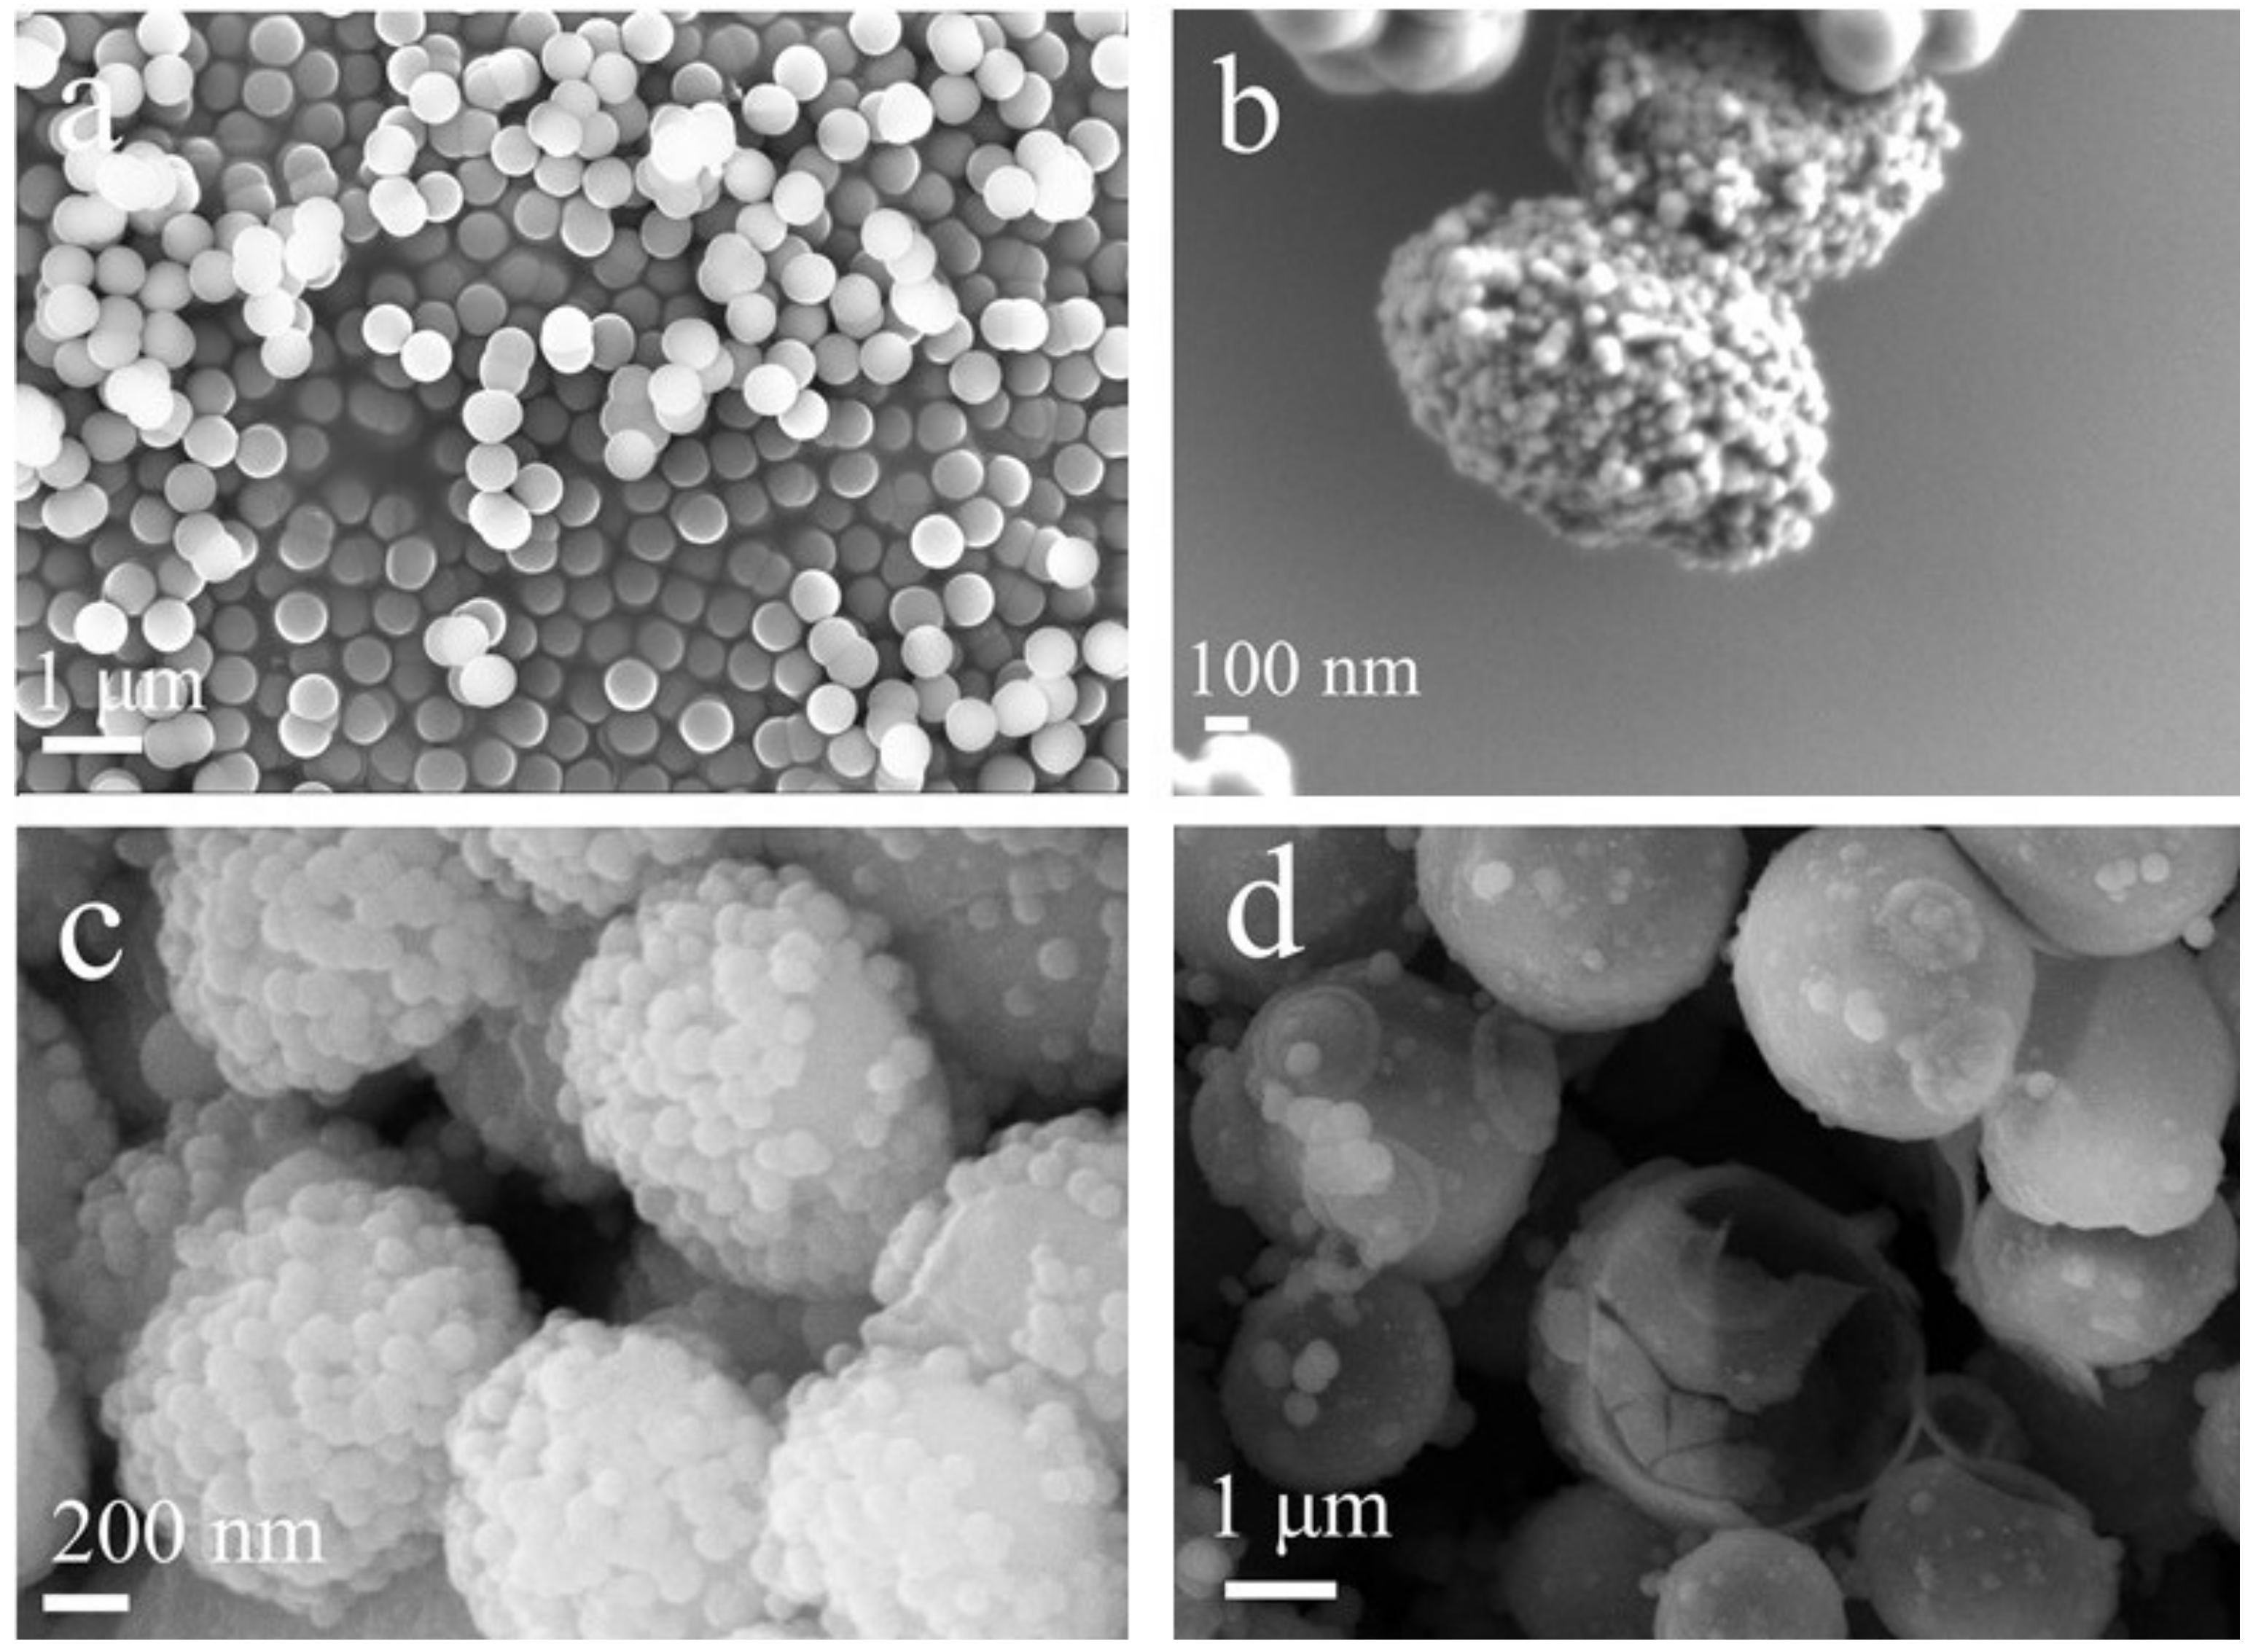
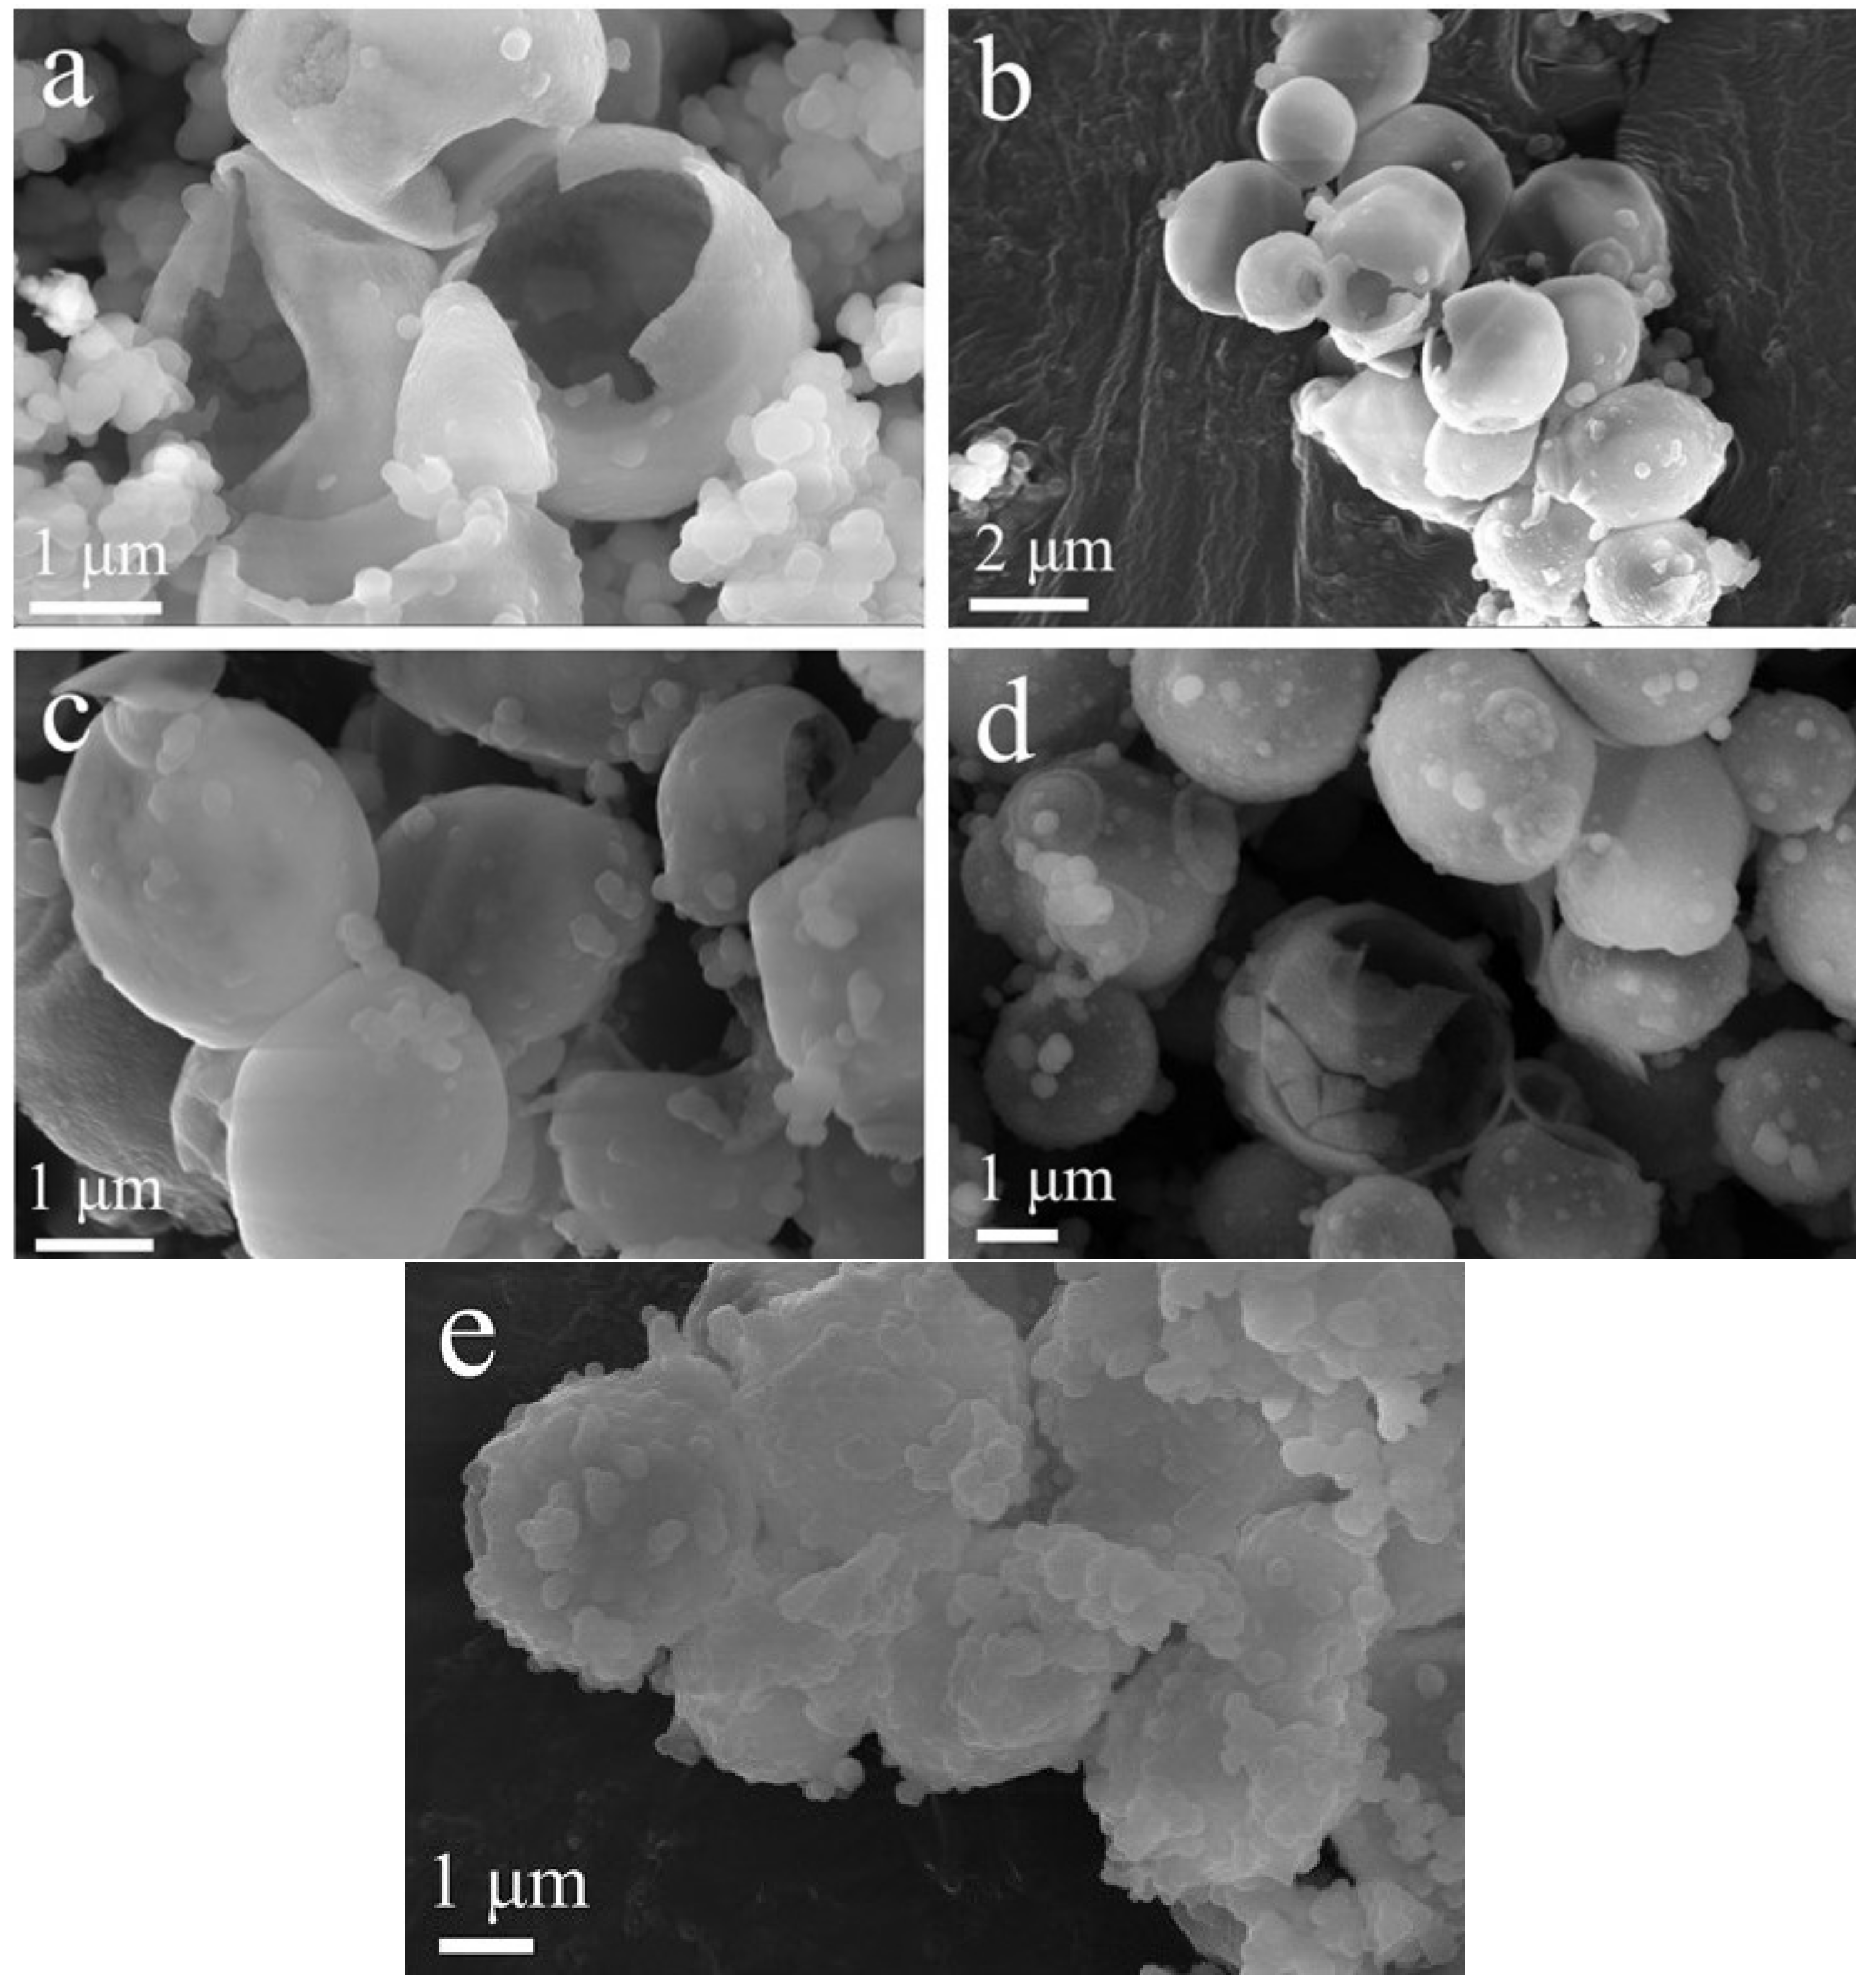
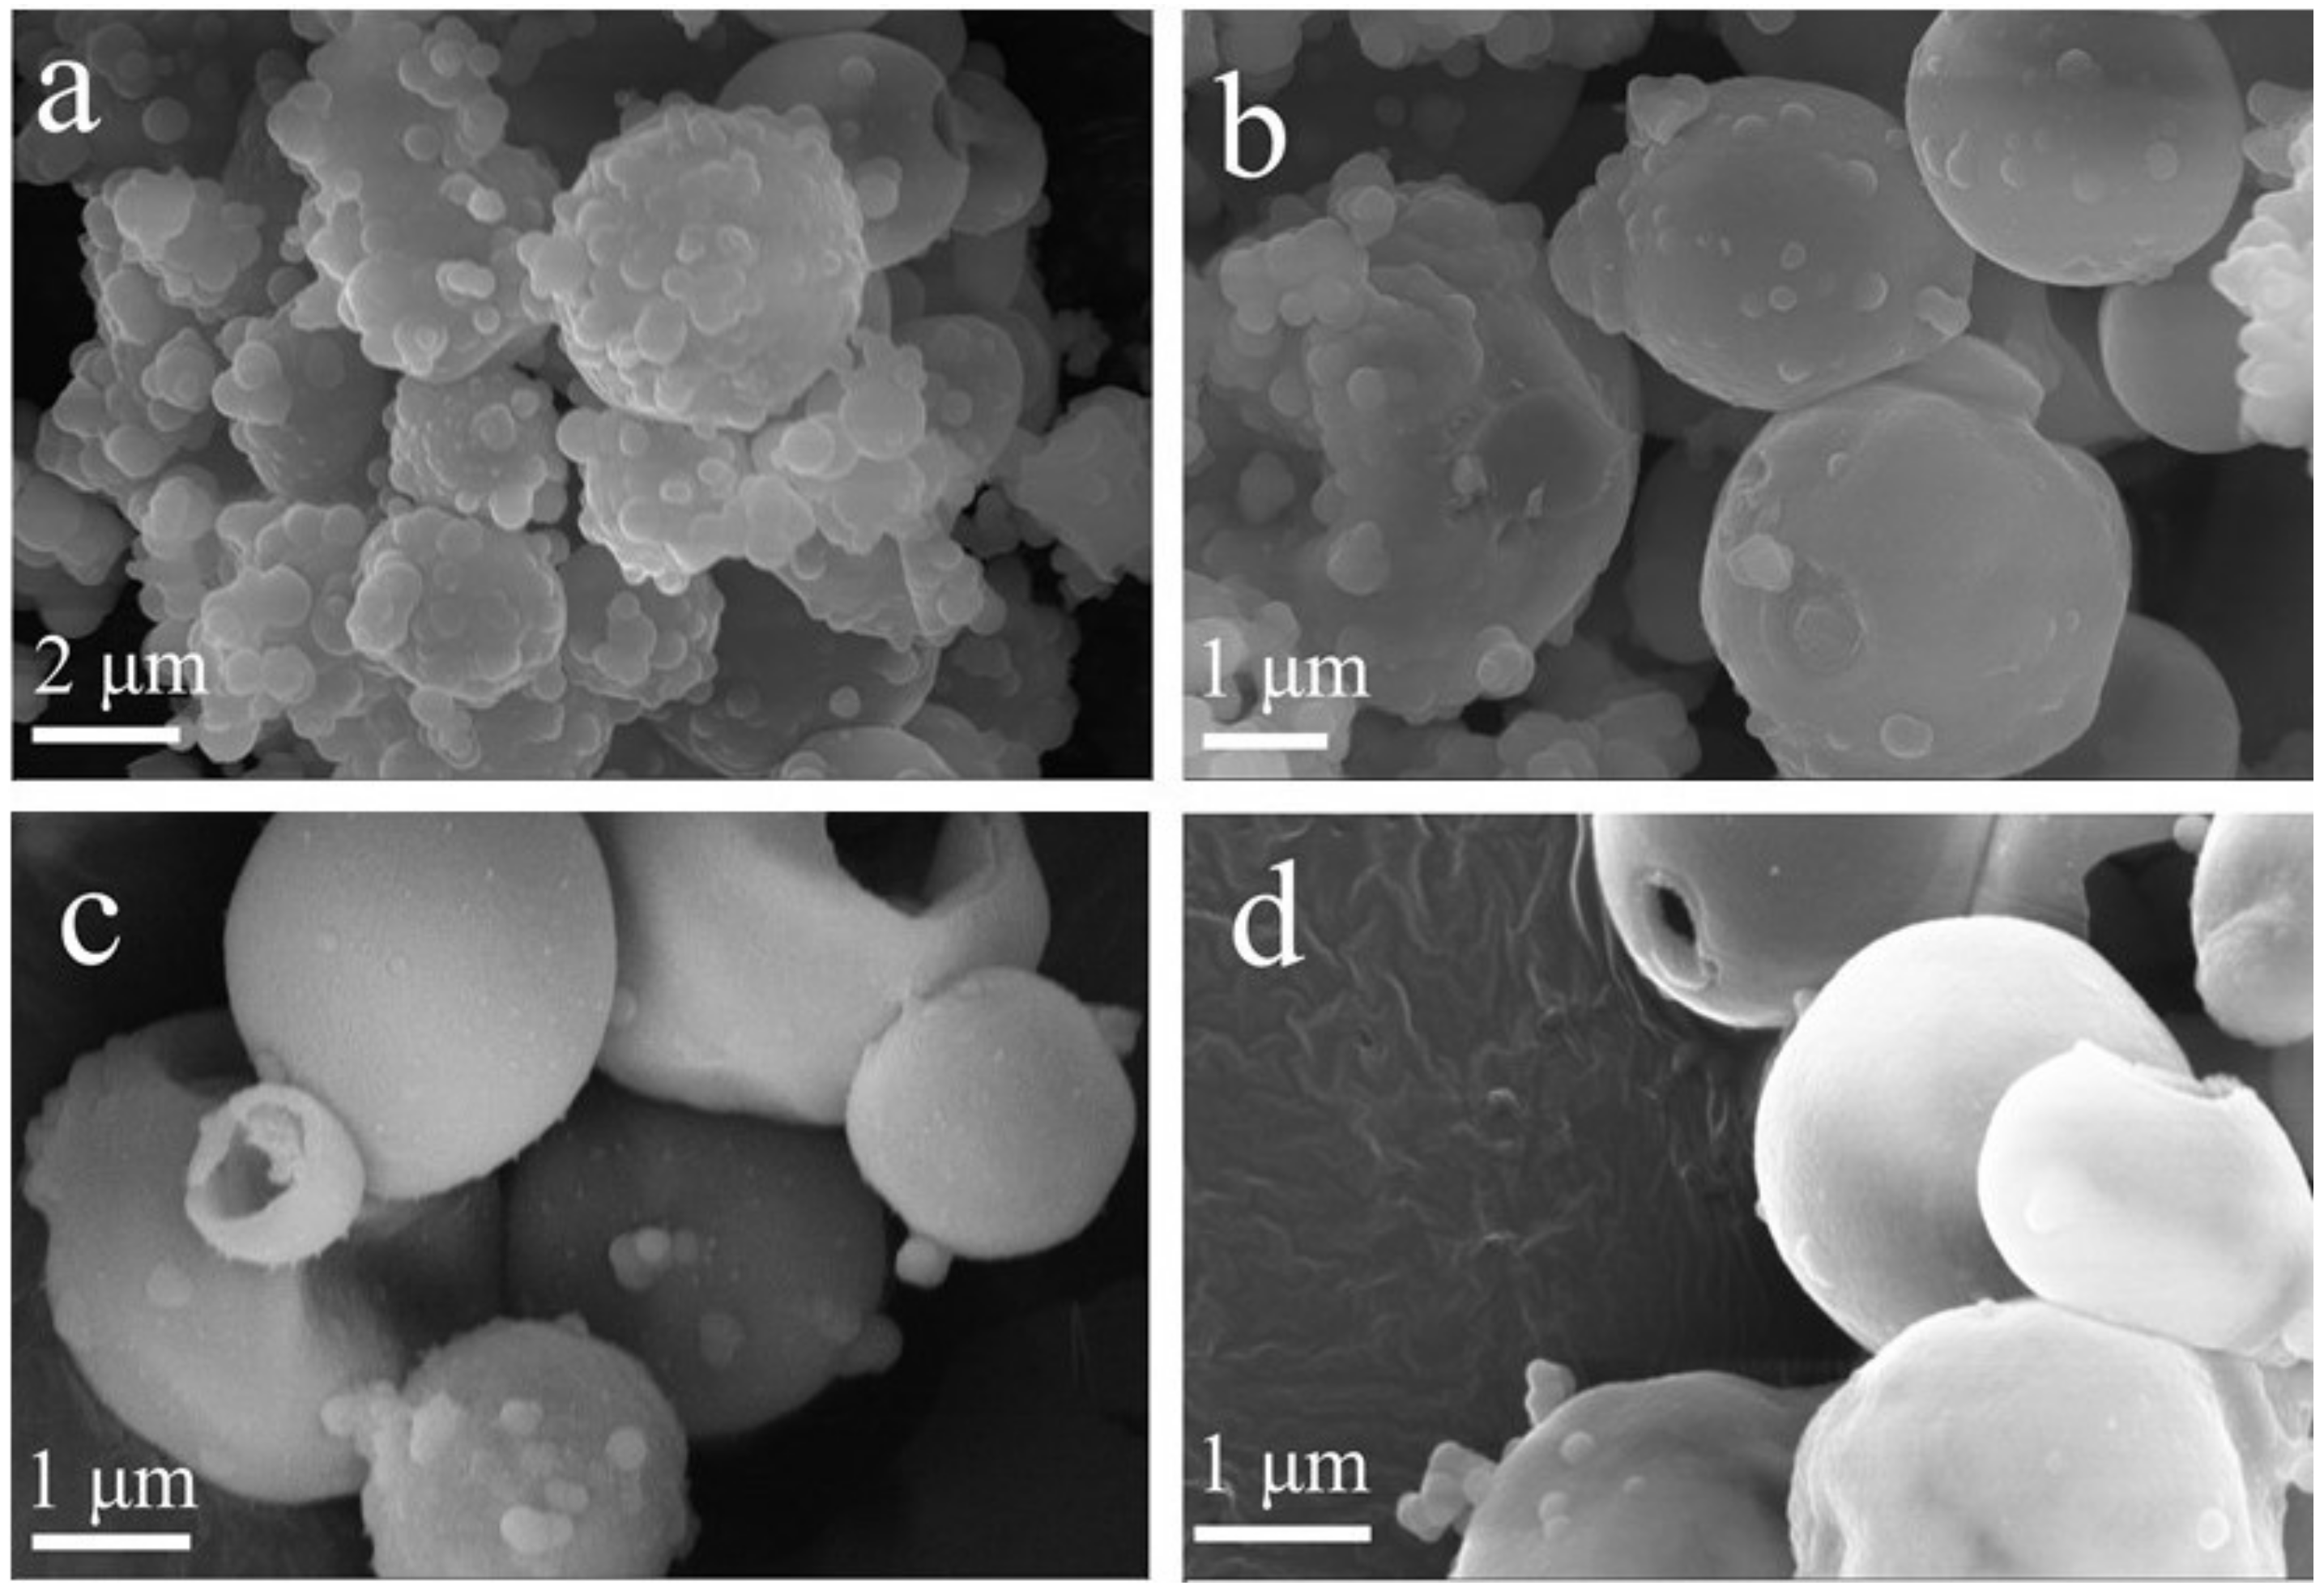
3.1. Preparation of Hollow SiO2 Microspheres

In recent years, inorganic hollow micro/nanostructures have attracted extensive attention due to their unique morphologies, unique physicochemical properties, and potential applications in dyes, drug delivery, and efficient catalysis [29,30]. The template method is one of the most commonly used methods for the synthesis of hollow nanomaterials [31]. The application of microorganisms as a template is considered to be an economical and green method [32,33,34,35]. Herein, the hollow SiO2 was prepared by using the P. pastoris GS115 cells as a template and the influence of different reaction conditions on the structure were investigated.

3.1.1. Effect of Preprocessing Methods

Templates are vital for the preparation of hollow material. As shown in Figure 1a, solid SiO2 microspheres with a particle size of 200–300 nm were obtained when no template was introduced. When P. pastoris GS 115 cells with the size of 1–2 μm were introduced, the obtained microspheres had successfully replicated the template structure (Figure 1b–d). The solvent has an obvious influence on the morphology. When P. pastoris GS 115 cells were suspended in ethanol or a hybrid system of ethanol and ammonia, there were many nano SiO2 particles on the surface of hollow SiO2, making the surface more rough and still agglomerate, which was shown in Figure 1b,c. While hollow, SiO2 with a smooth surface and a good dispersion could be prepared if P. pastoris GS115 cells were firstly suspended in a water–ethanol mixture (the ratio of water–ethanol is 1/2, Figure 1d).

3.1.2. Effect of TEOS Concentration

The concentration of TEOS has an effect on the morphology of microspheres. When the TEOS concentration was low, small SiO2 particles agglomerated and the concentration was not enough to form the complete hollow structure, as shown in Figure 2a. As the TEOS concentration gradually increased, more complete microspheres with hollow structure could successfully be prepared (Figure 2b–d). As the concentration of TEOS continued to increase, the excess SiO2 particles continued to grow on the surface of the hollow SiO2 microspheres due to the limited amount of templates. The surface of the prepared microspheres was relatively rough and agglomerated together to form larger clusters (Figure 2e). Therefore, to prepare hollow SiO2 microspheres with a smooth surface and good dispersibility, the optimal TEOS concentration is between 1.0 and 1.2 mol/L.

3.1.3. Effect of the Ratio of Water to Ethanol

As shown in Figure 3, when the ratio of water to ethanol was low, the generated SiO2 particles would continue to grow on the surface of hollow SiO2 microspheres, which made the surface of the prepared microspheres relatively rough and caused the hollow microspheres to have a certain degree of agglomeration (Figure 3a). With the increase in water/ethanol, the surface of the microspheres became smoother (Figure 3b–d).

3.1.4. Effect of Aging Time

The aging time also has an obvious effect on the surface of microspheres. As shown in Figure 4a, when the aging time was 6 h, the hollow SiO2 microsphere structure was irregular and the dispersion was poor. With the aging time extended to 12 h, a complete hollow SiO2 microsphere structure was formed with an even dispersion (Figure 4c). Complete hollow microsphere structures could be formed by extending the aging time (Figure 4d,e).
The TG and FTIR characterizations were performed and the results were shown in Figure A2 and Figure A3. The results confirm the formation of SiO2 and show that there may be some residual biomass on the microsphere.

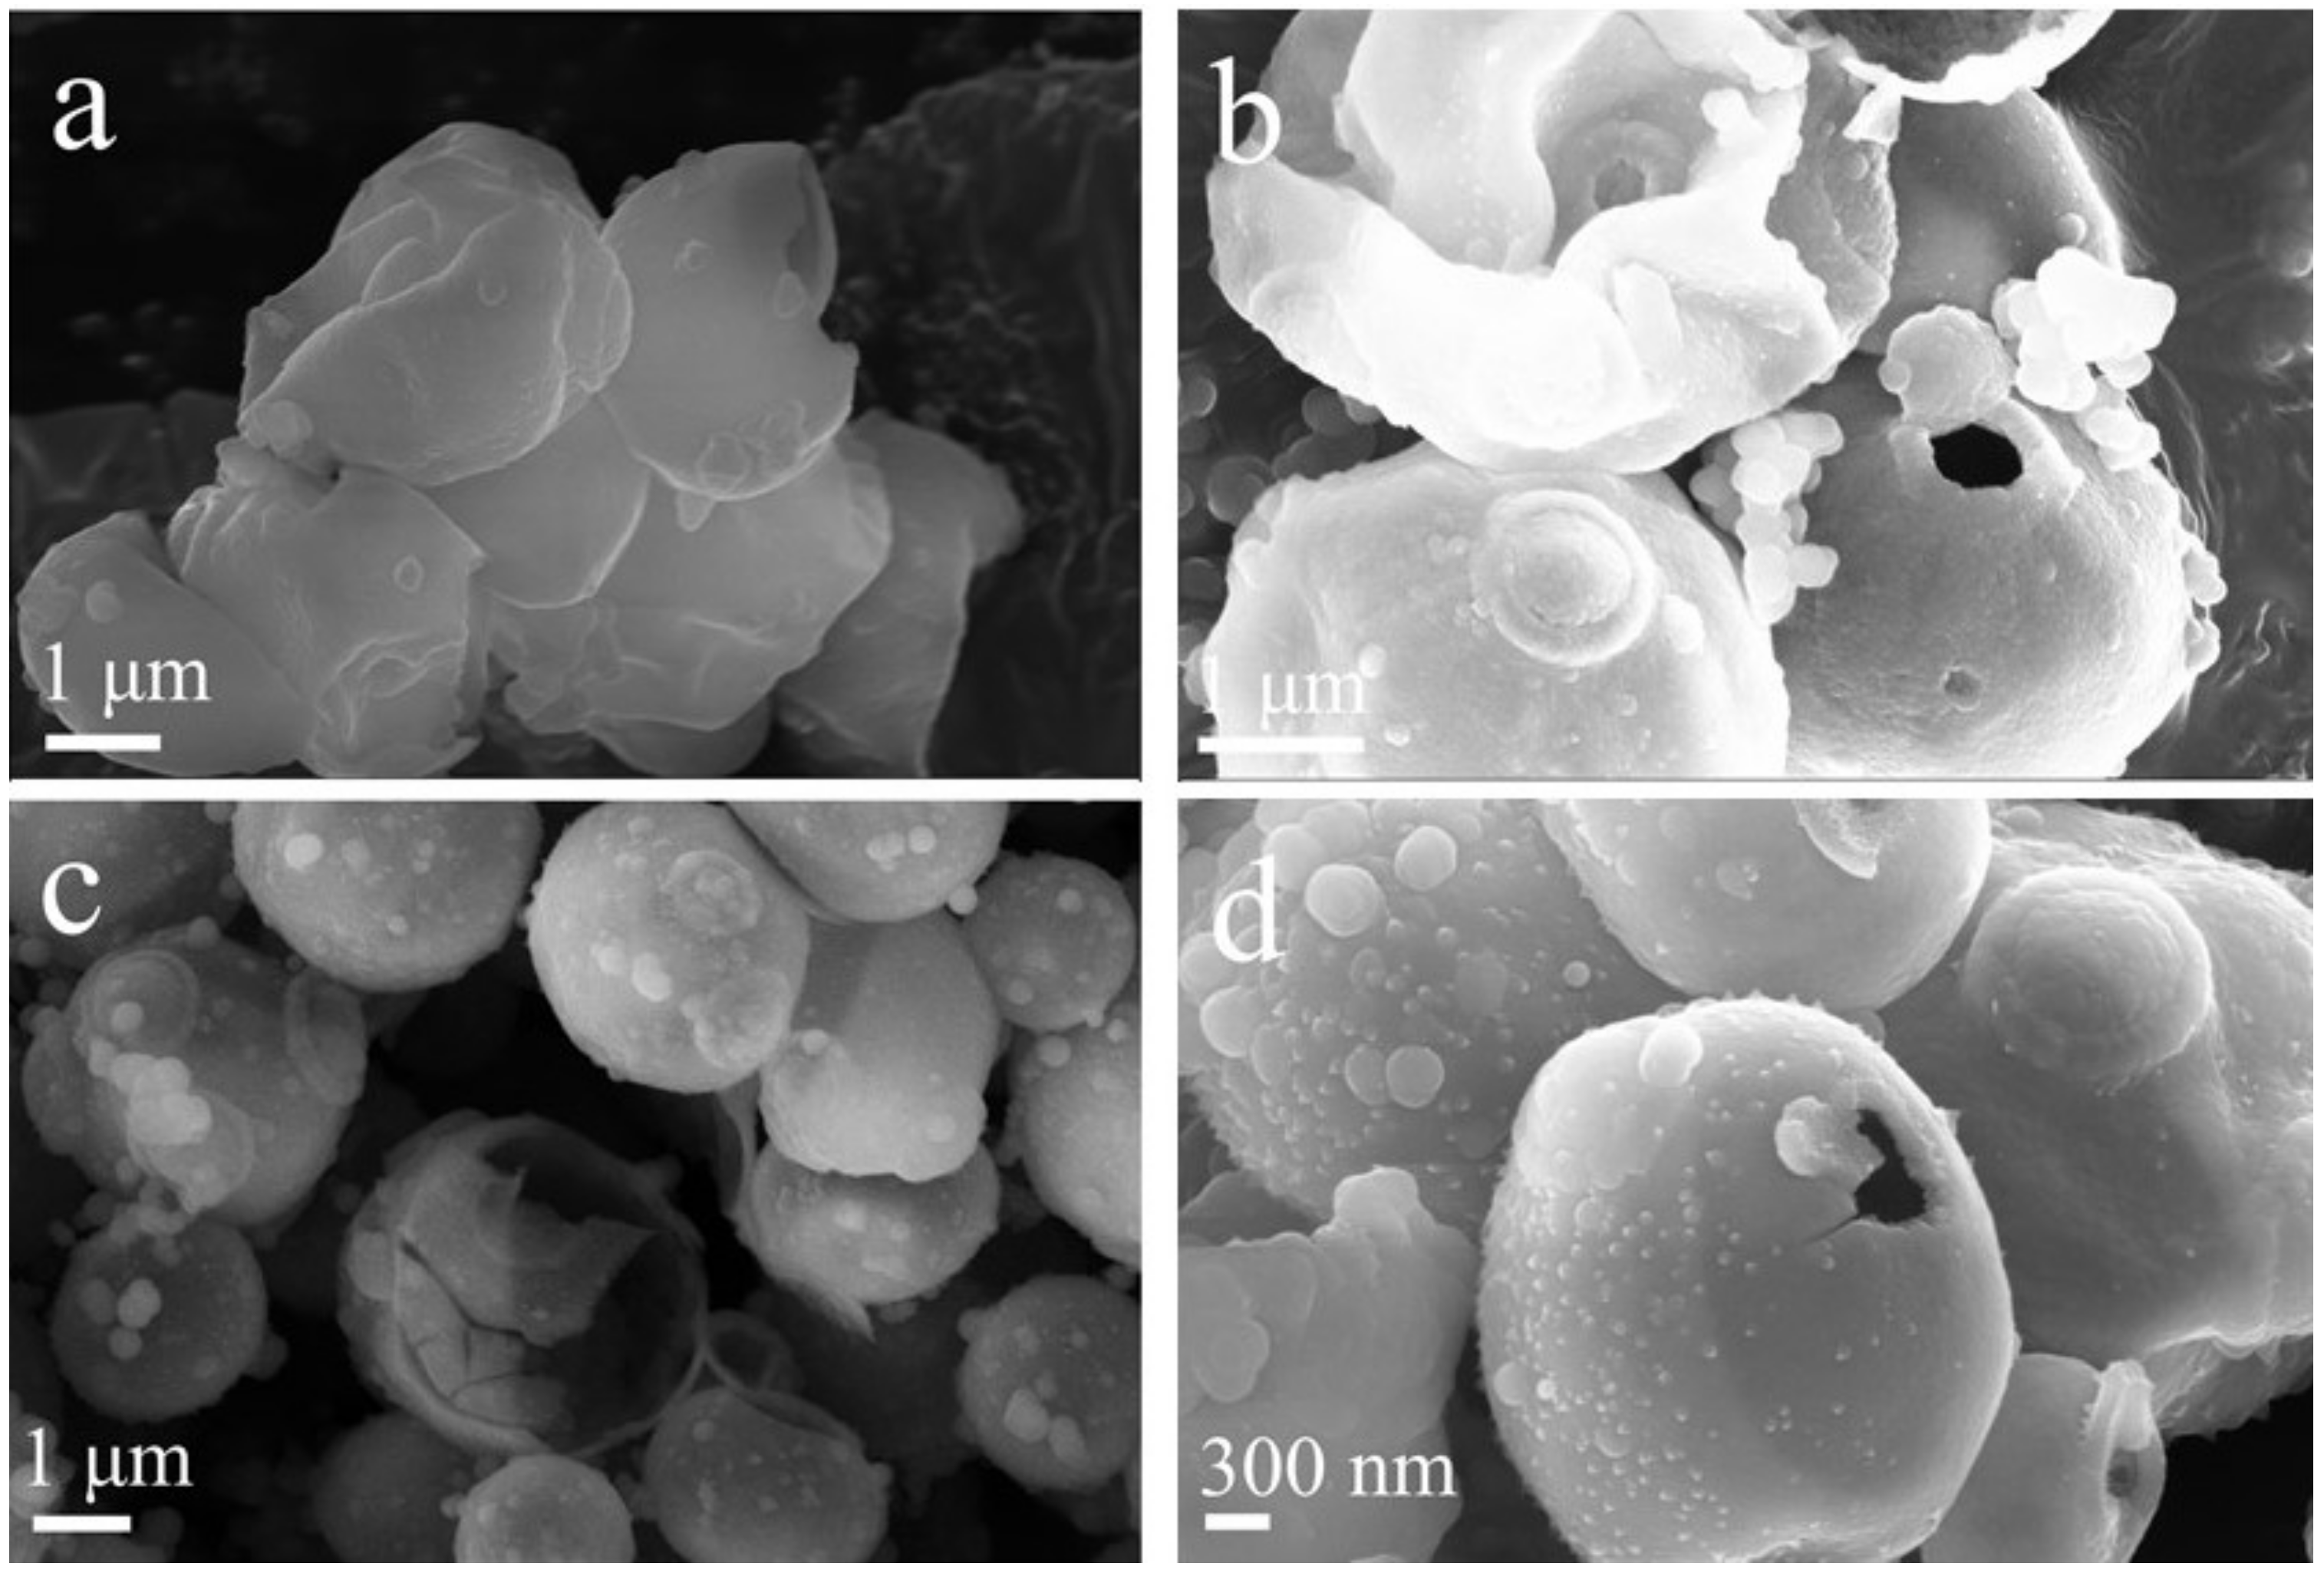
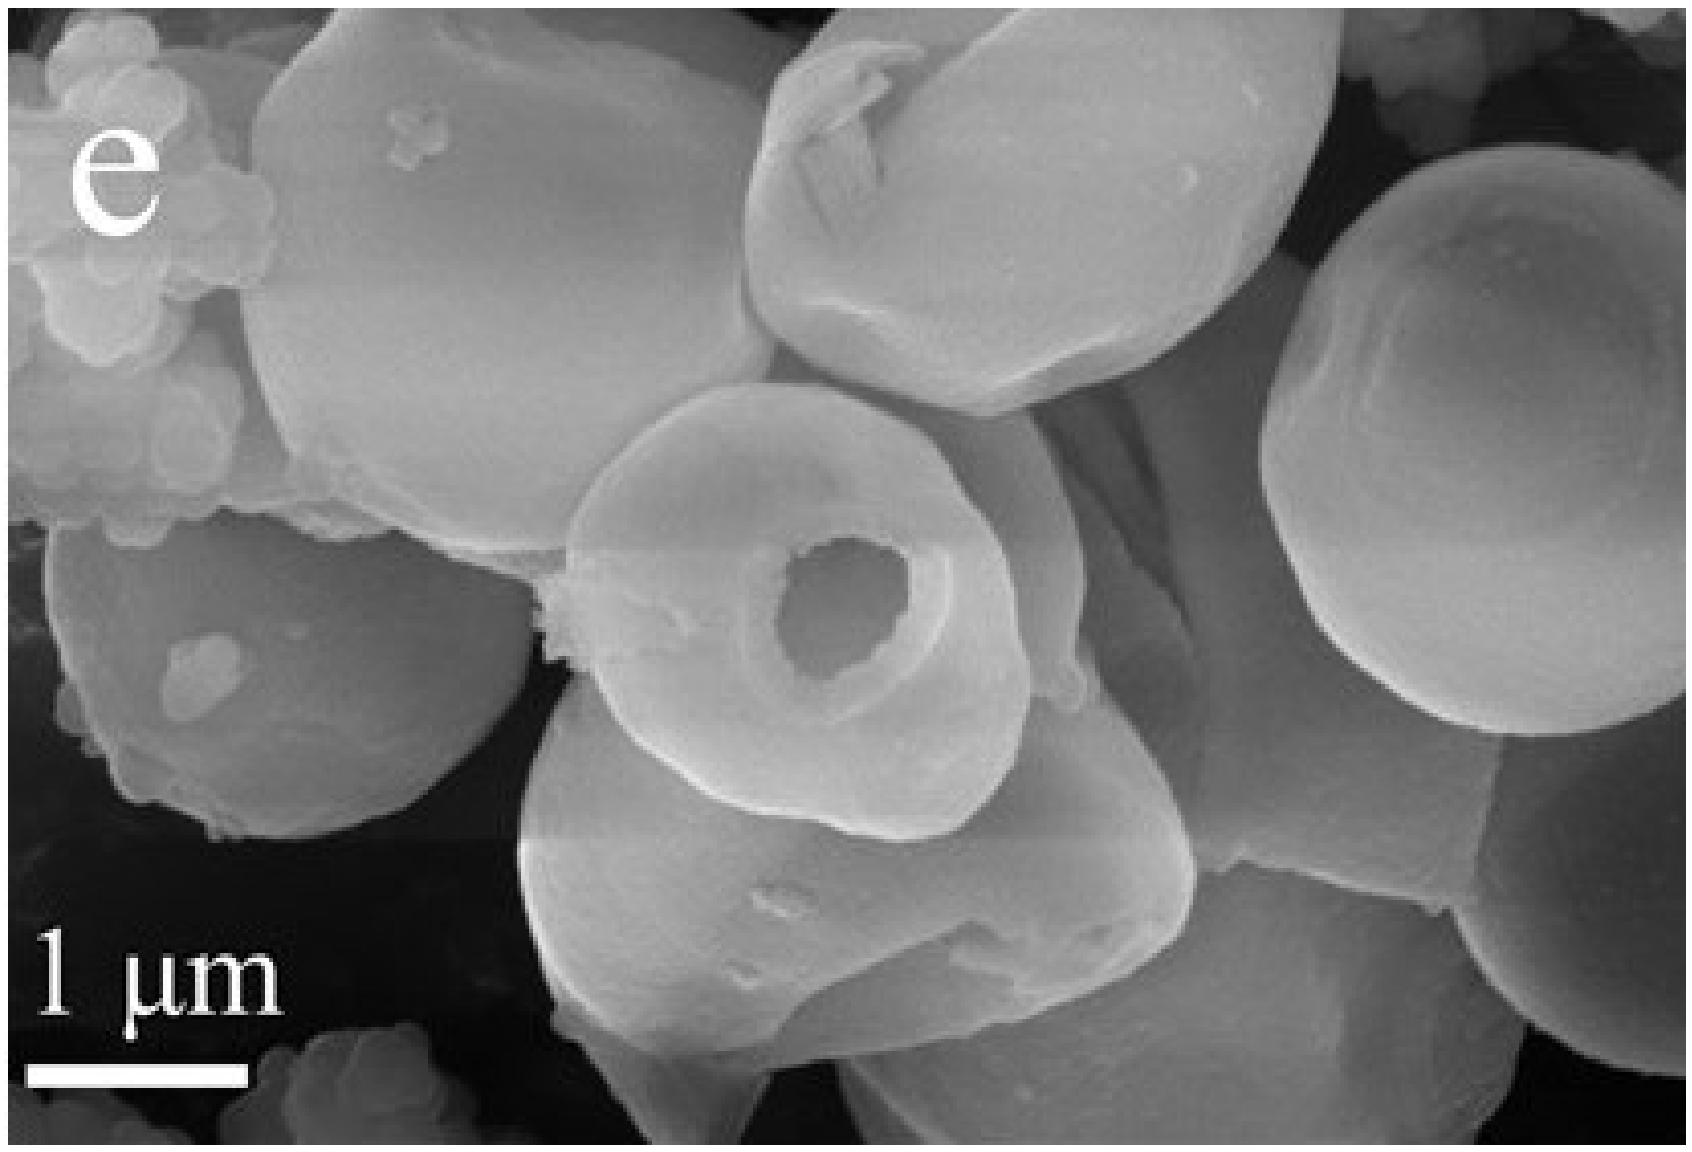
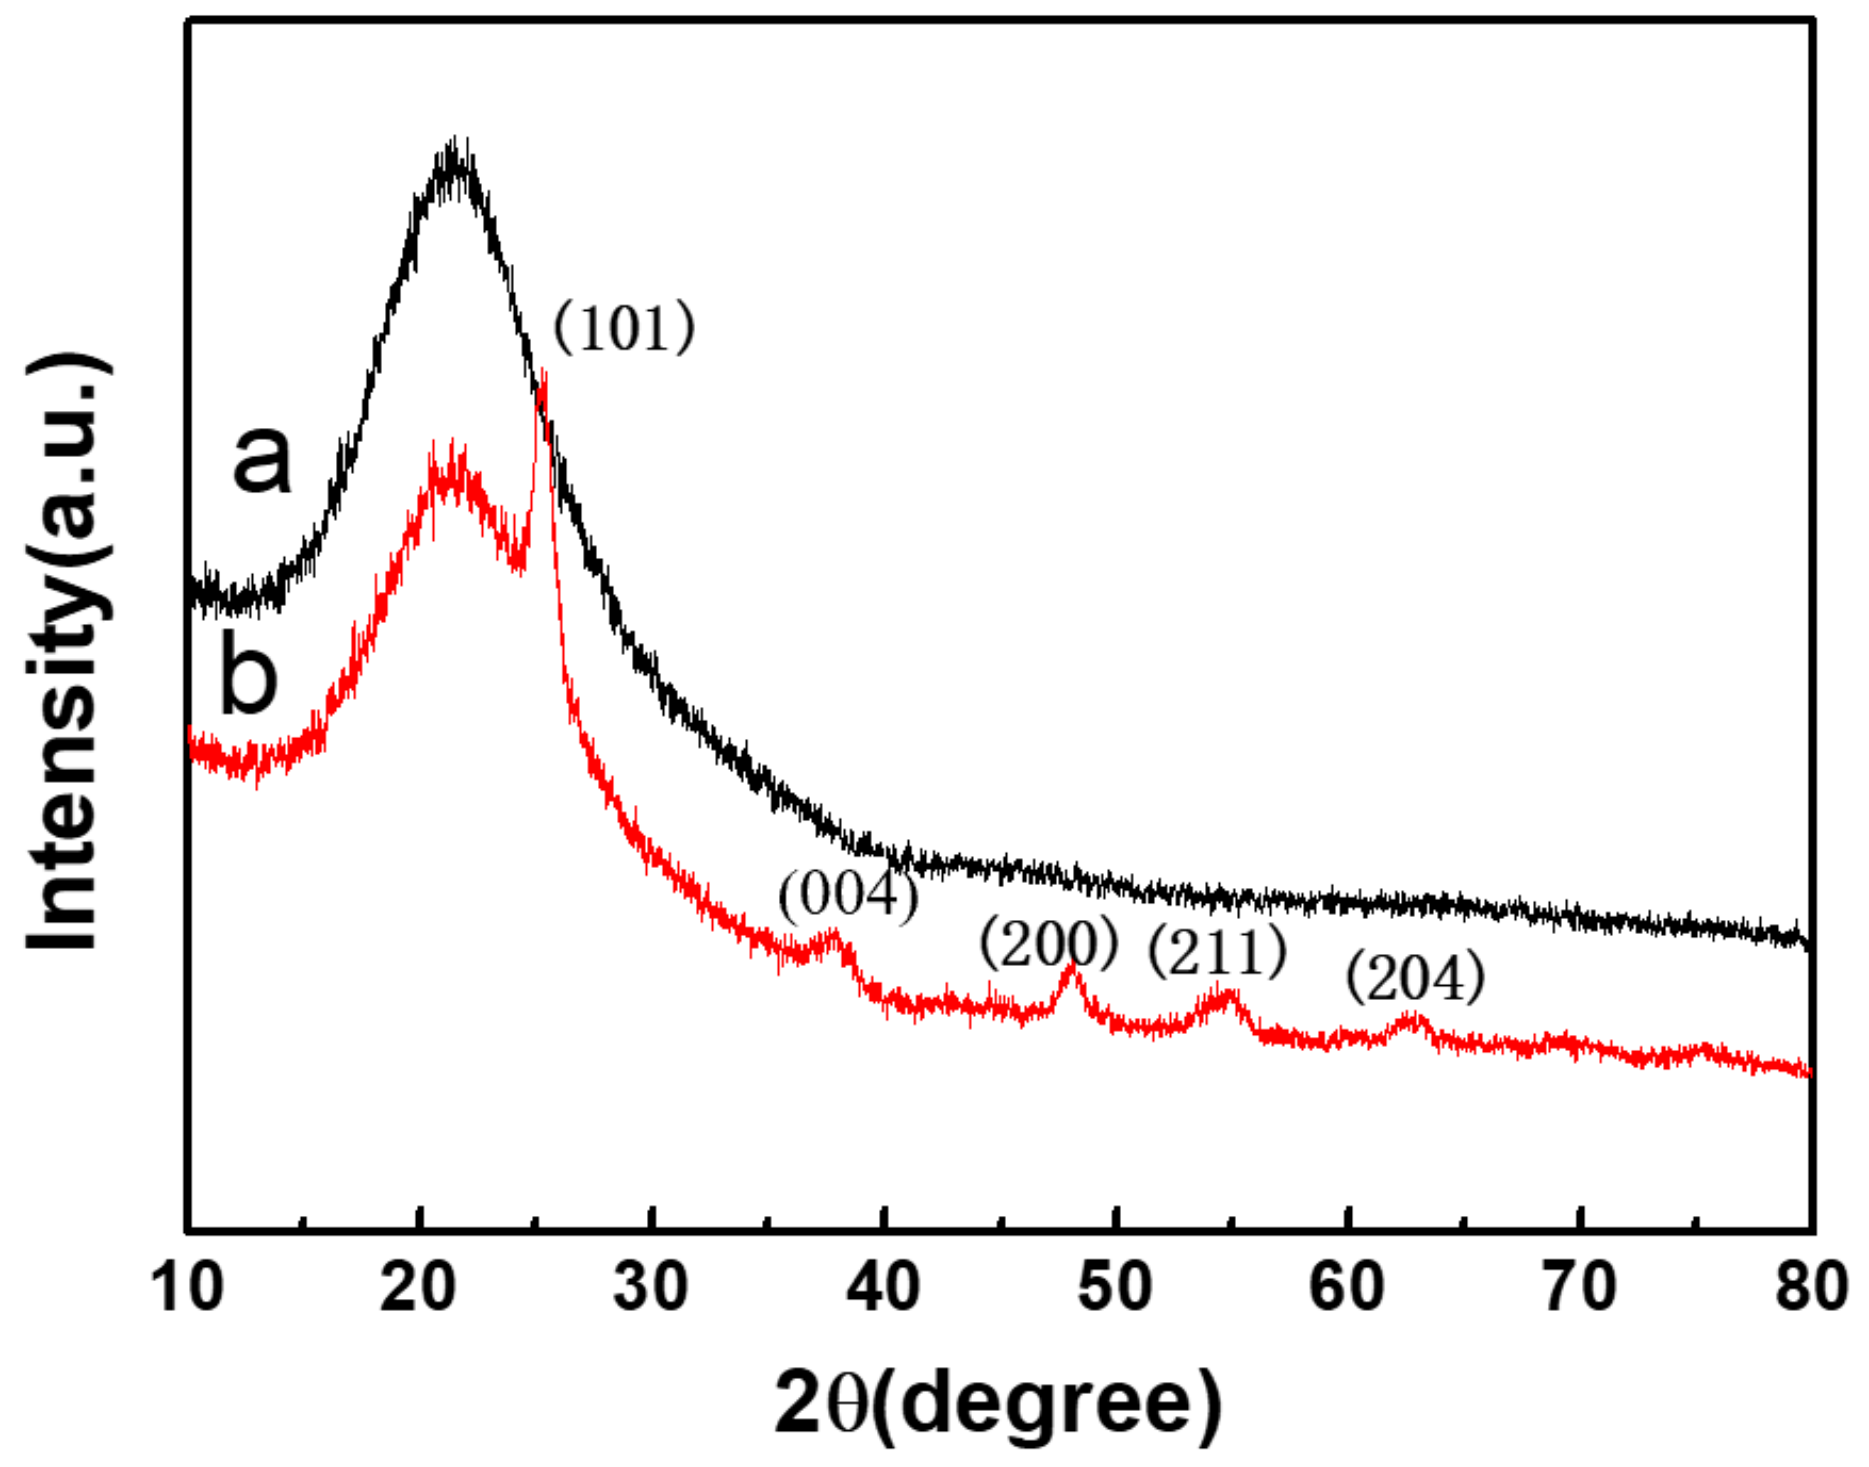
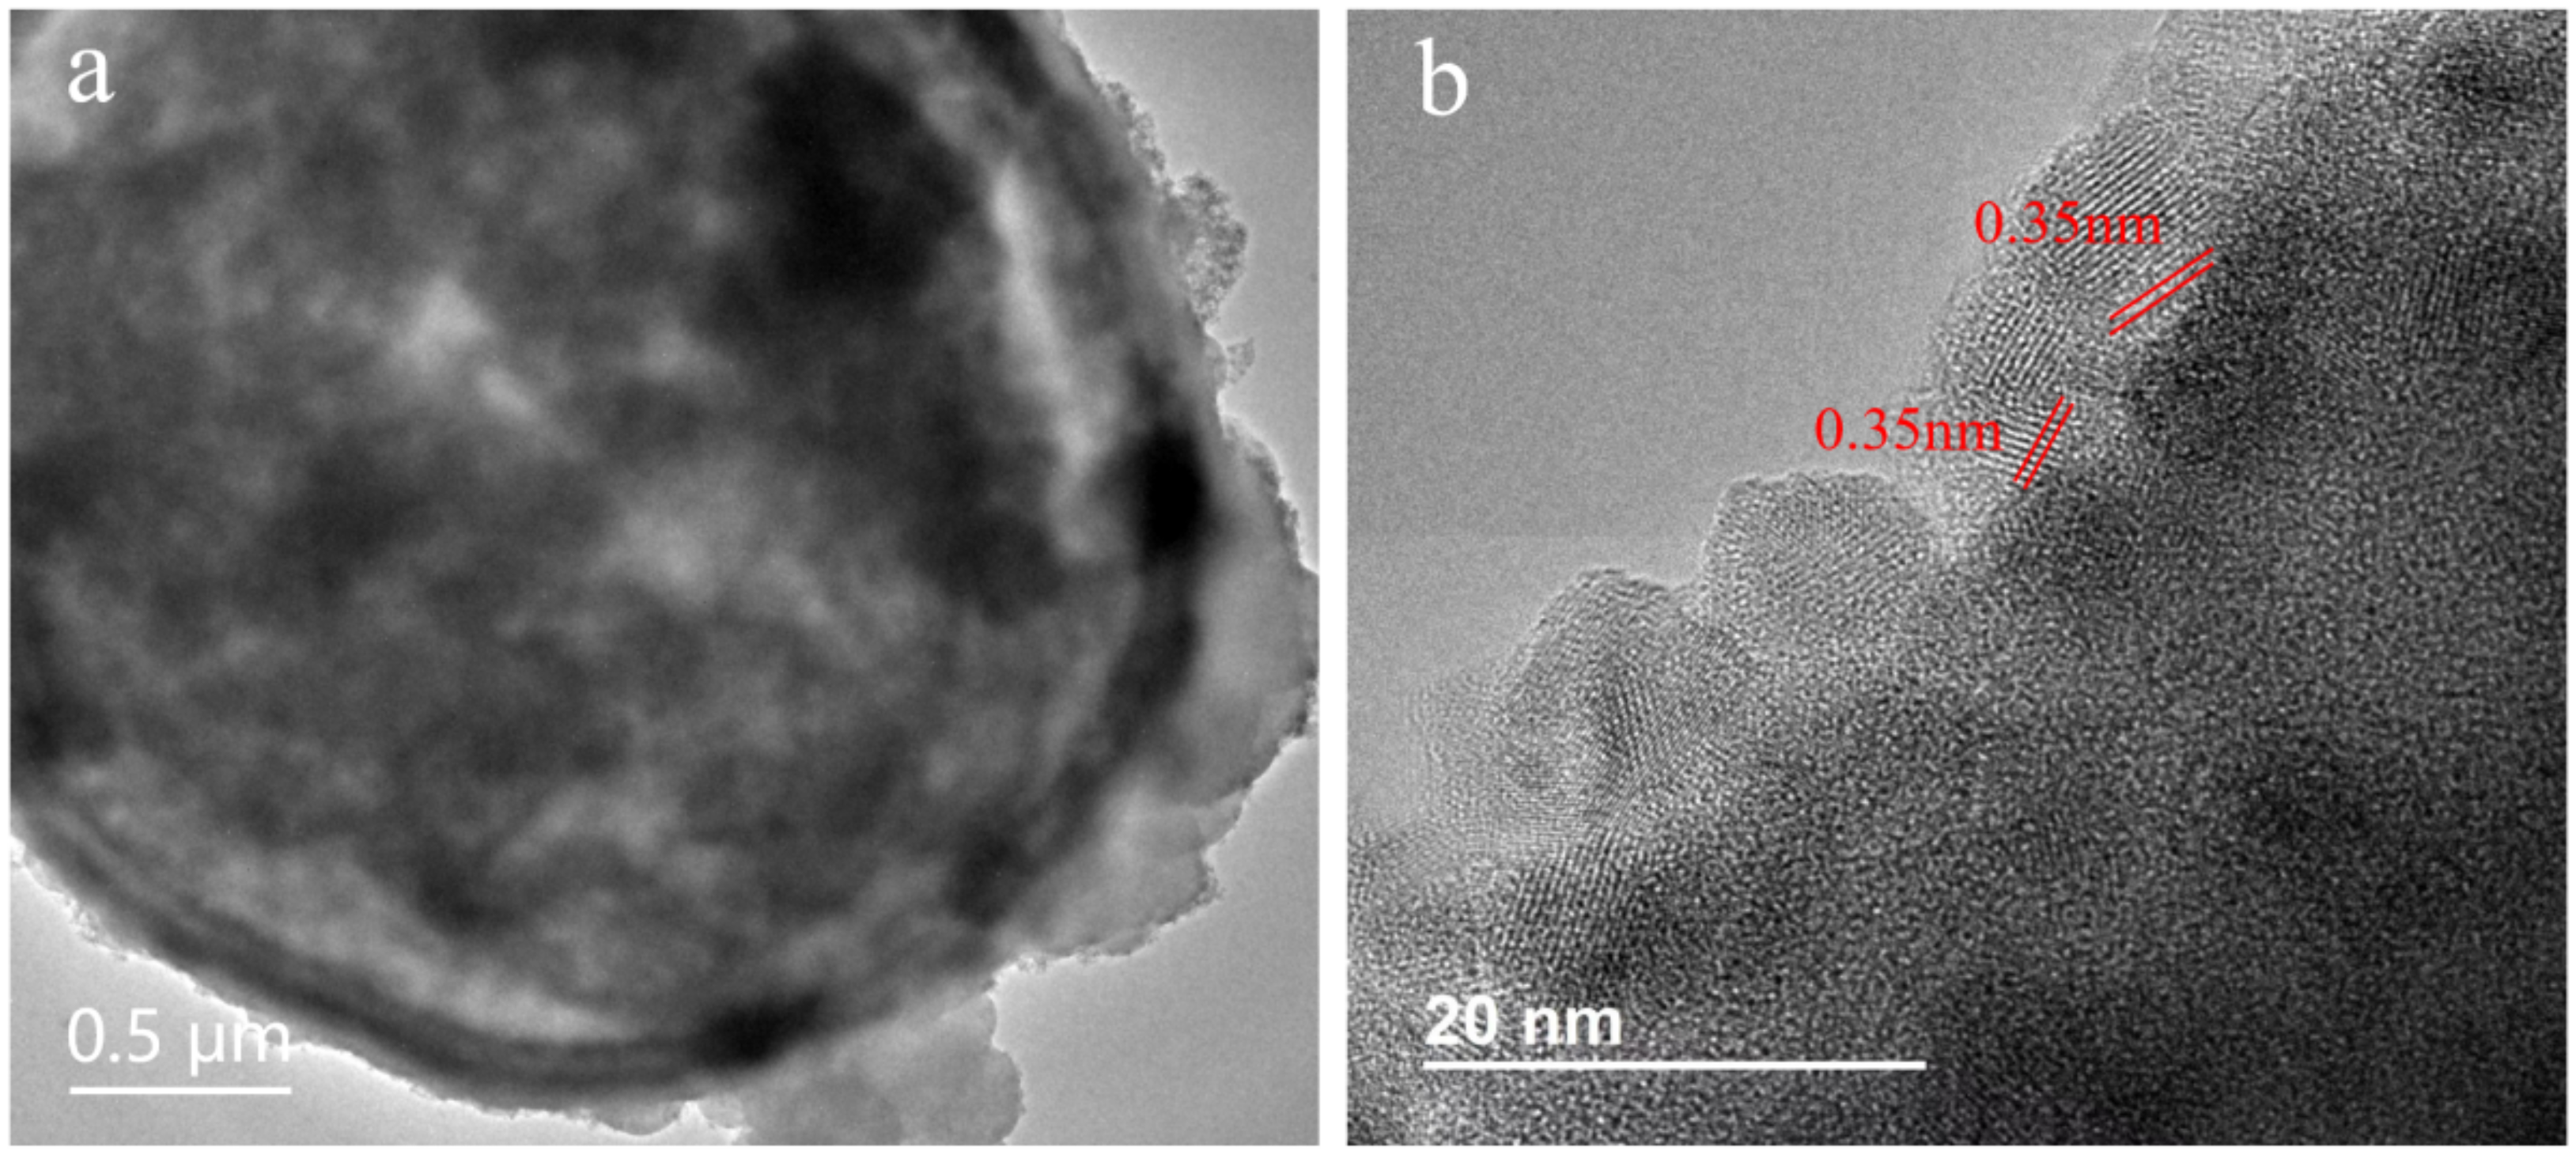
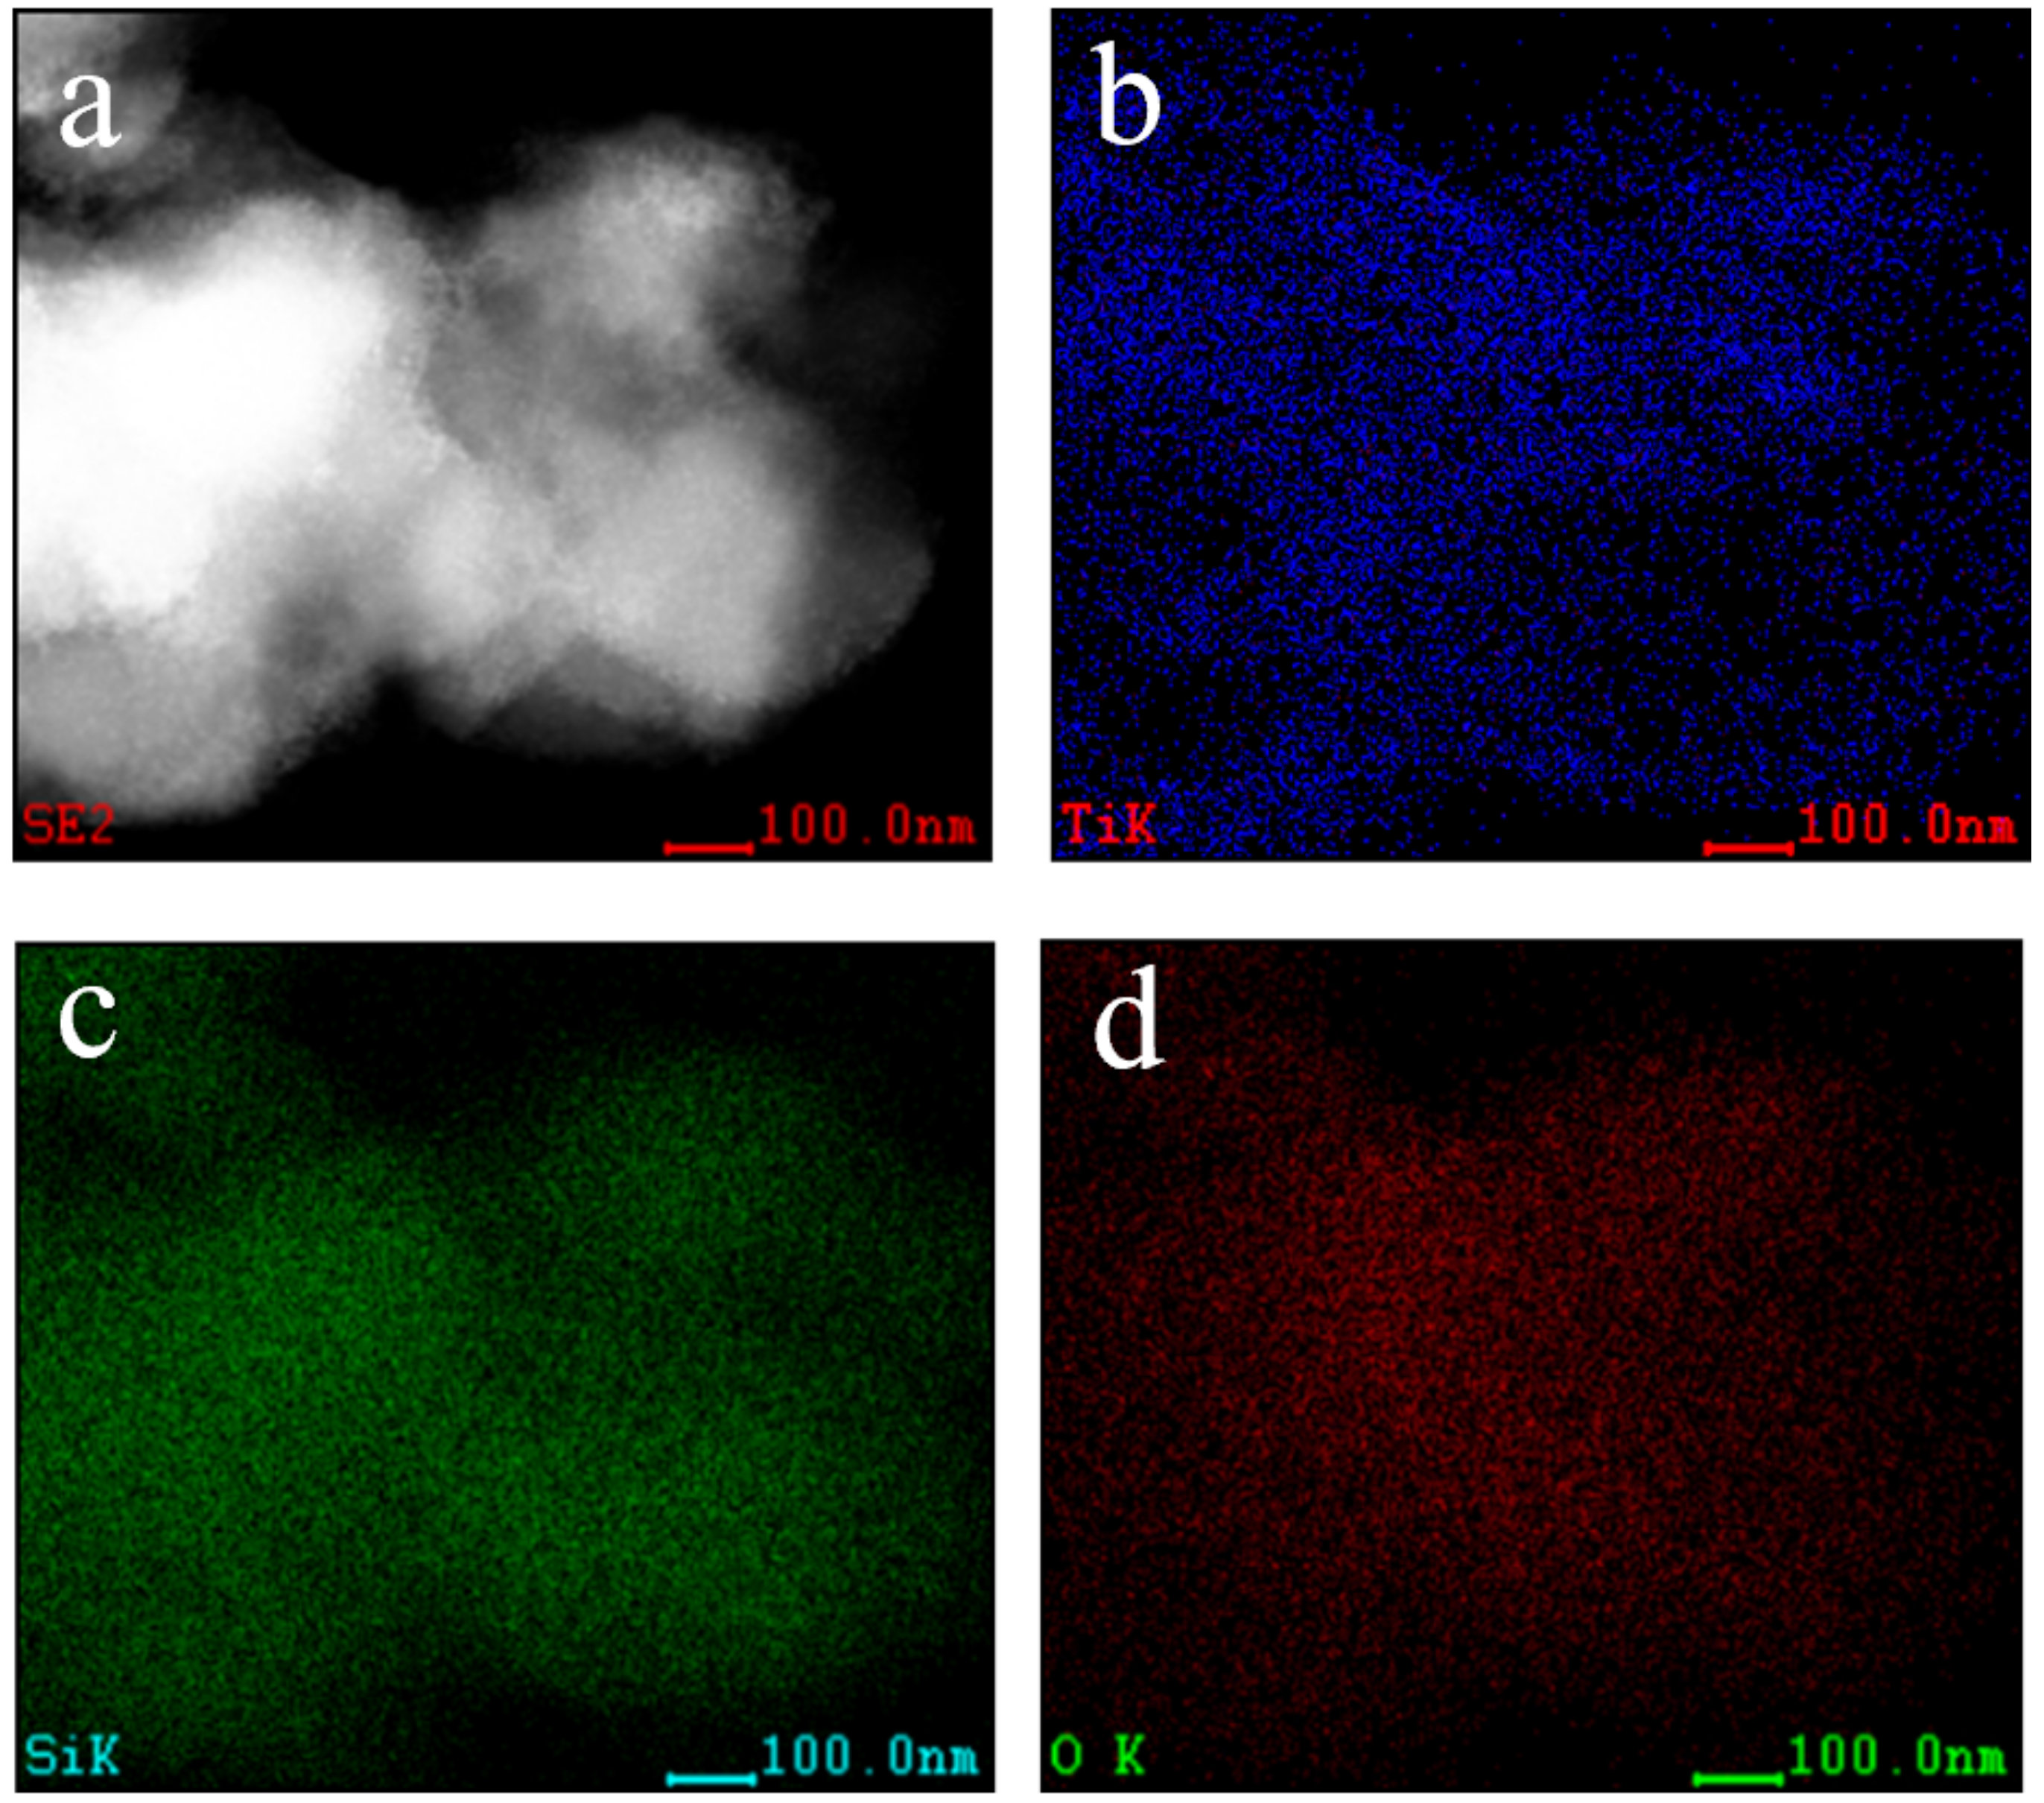
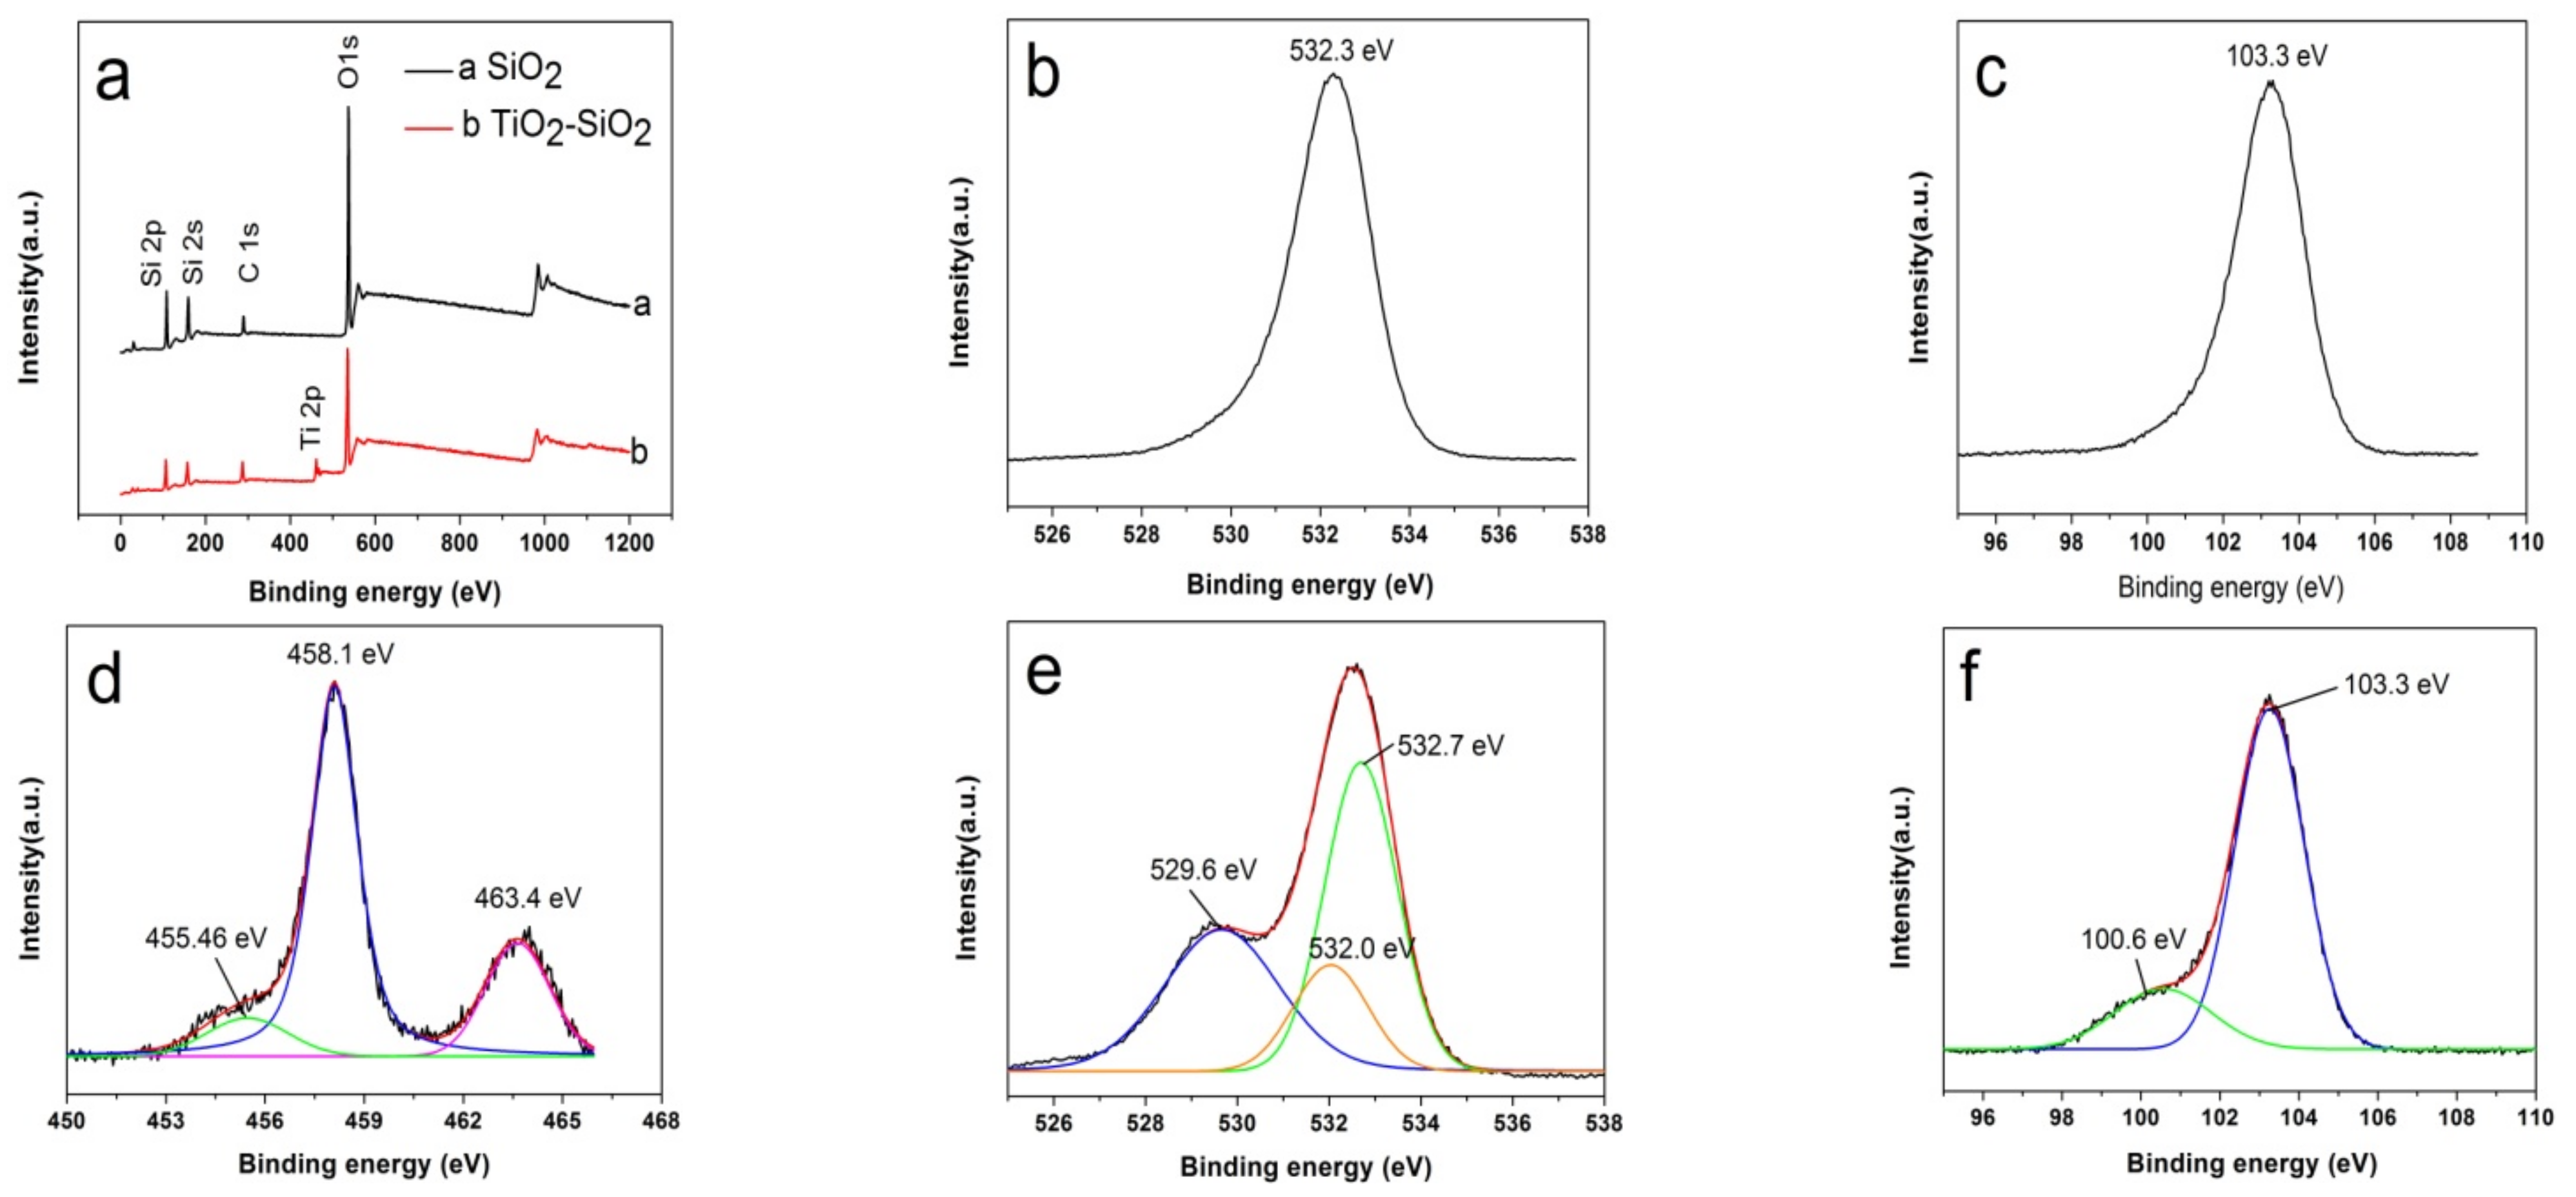
3.2. Preparation of Hollow TiO2-SiO2

Based on the above, TiO2 was coated on the surface of hollow SiO2 microspheres to prepare TiO2-SiO2 by the hydrothermal method.
XRD patterns of SiO2 and TiO2-SiO2 were displayed in Figure 5. The hollow SiO2 microsphere was amorphous (curve a in Figure 5). The main peaks at 25.3°, 37.9°, 47.8°, 54.3°, and 63.0° in curve b could be assigned to the diffraction of the (101), (004), (200), (211), and (204) planes of anatase TiO2 [36]. Generally, the anatase TiO2 will change to rutile TiO2 after high-temperature roasting. However, no rutile formation was found in this sample because of the spatial grid effect after silicon addition, which improved the structural thermal stability of mesoporous TiO2 and inhibited the transformation of anatase to rutile [37].
To observe the microscopic morphology and internal structure of the prepared TiO2-SiO2, TEM characterization was carried out and the results were shown in Figure 6. In Figure 6a, a layer of material was successfully coated on the surface of SiO2. The spacing of the lattice plane in Figure 6b was 0.35 nm, which was consistent with the d value of the (101) plane of the anatase TiO2, confirming that the surfaces of the SiO2 were successfully coated by TiO2.
In order to confirm the elemental composition and distribution of the TiO2-SiO2 catalyst, Si, O, and Ti elements were selected for an EDX surface scan. As shown in Figure 7, the distribution ranges of the O, Si, and Ti elements are consistent with the positions occupied by SiO2 and the distribution is very uniform. This reflects not only the O and Si element properties of SiO2, but also the fact that the titanium layer is successfully coated on the surface of the hollow SiO2 microspheres.
The full XPS spectra of SiO2 and TiO2-SiO2 were shown in Figure 8a and several peaks corresponding to Si, C, Ti, and O elements could be observed. Figure 8b showed the XPS spectrum of O1s of the sample SiO2. The characteristic peak appeared at 532.3 eV and could be assigned to the binding energy of O 1s in Si-O-Si. The peak centered at around 103.3 eV in Figure 8c confirmed the presence of the Si element in SiO2. A Ti 2p XPS spectrum of TiO2-SiO2 in Figure 8d was fitted into three peaks. The peaks located at 458.1 eV and 463.4 eV were assigned to Ti 2p3/2 and Ti 2p1/2 of TiO2, respectively. A minor peak at 455.46 eV might be attributed to the low valence states of Ti [38]. The coating of TiO2 exerted a great influence on the O 1s XPS spectrum (Figure 8e), which could be split into three peaks. The peak located at 529.6 eV and 532.7 eV were related to Ti–O–Ti and Si–O–Si. The peak at 532.0 eV could be assigned to the binding energy of the Si-O-Ti species, indicating the bonding of TiO2 to SiO2 [39]. Figure 8f showed the XPS spectrum of Si 2p of the sample TiO2-SiO2. There were two characteristic peaks of Si 2p located at 100.6 eV and 103.3 eV, showing that the coating of TiO2 had an effect on the binding energy of the Si element.
The specific surface area (SBET), pore volume (VP), and pore diameter (DP) of different samples are summarized in Table 1. Compared with SiO2 without a template, the specific surface area, pore volume, and pore diameter of SiO2 produced by a yeast template increased by different degrees, and the increase in the specific surface area from 10.95 m2 g−1 to 15.97 m2 g−1 was mainly due to the successful formation of a hollow microsphere structure. When the hollow SiO2 microspheres were coated with titanium, the specific surface area, pore volume, and pore diameter increased, which may be beneficial by providing more active sites and increasing the catalytic activity of the catalyst.
Figure 9a shows the N2 adsorption–desorption isothermal curve and Barret Joyner Halenda (BJH) pore diameter distribution of SiO2 prepared by the P. pastoris GS115 template. The N2 adsorption–desorption isothermal curve belongs to the Langmuir-type IV mesoporous channel adsorption curve. At P/Po = 0.8–1.0, small hysteresis rings appears, which maybe have been caused by slight changes in the pore diameter of SiO2 and the phenomenon of different pore sizes, and it could also have been caused by a small number of interstices between particles. The BJH pore diameter distribution diagram of SiO2 inserted in Figure 9a shows that the mesopore diameter is in the range of 5 to 18 nm.
Figure 9b shows the N2 adsorption–desorption isothermal curve and the BJH pore diameter distribution of TiO2-SiO2. At the low-pressure stage (P/Po < 0.8), there is a certain linear relationship between the adsorption amount and partial pressure, which may occur in a single layer of physical adsorption. When the partial pressure P/Po is approximately 0.8, the adsorption amount increases sharply and the adsorption enters the abrupt phase. The reason is that N2 condenses the capillary in the mesoporous channel. When the partial pressure P/Po continues to increase, another abrupt jump occurs and a hysteresis ring appears under high partial pressure. At this time, N2 condenses between material particles. It can be seen from the BJH pore diameter distribution curve inserted in Figure 9b that the sample pore diameter is mainly distributed between 5 and 20 nm. There are also concentrated holes, possibly caused by gaps between spherical particles of varying sizes.

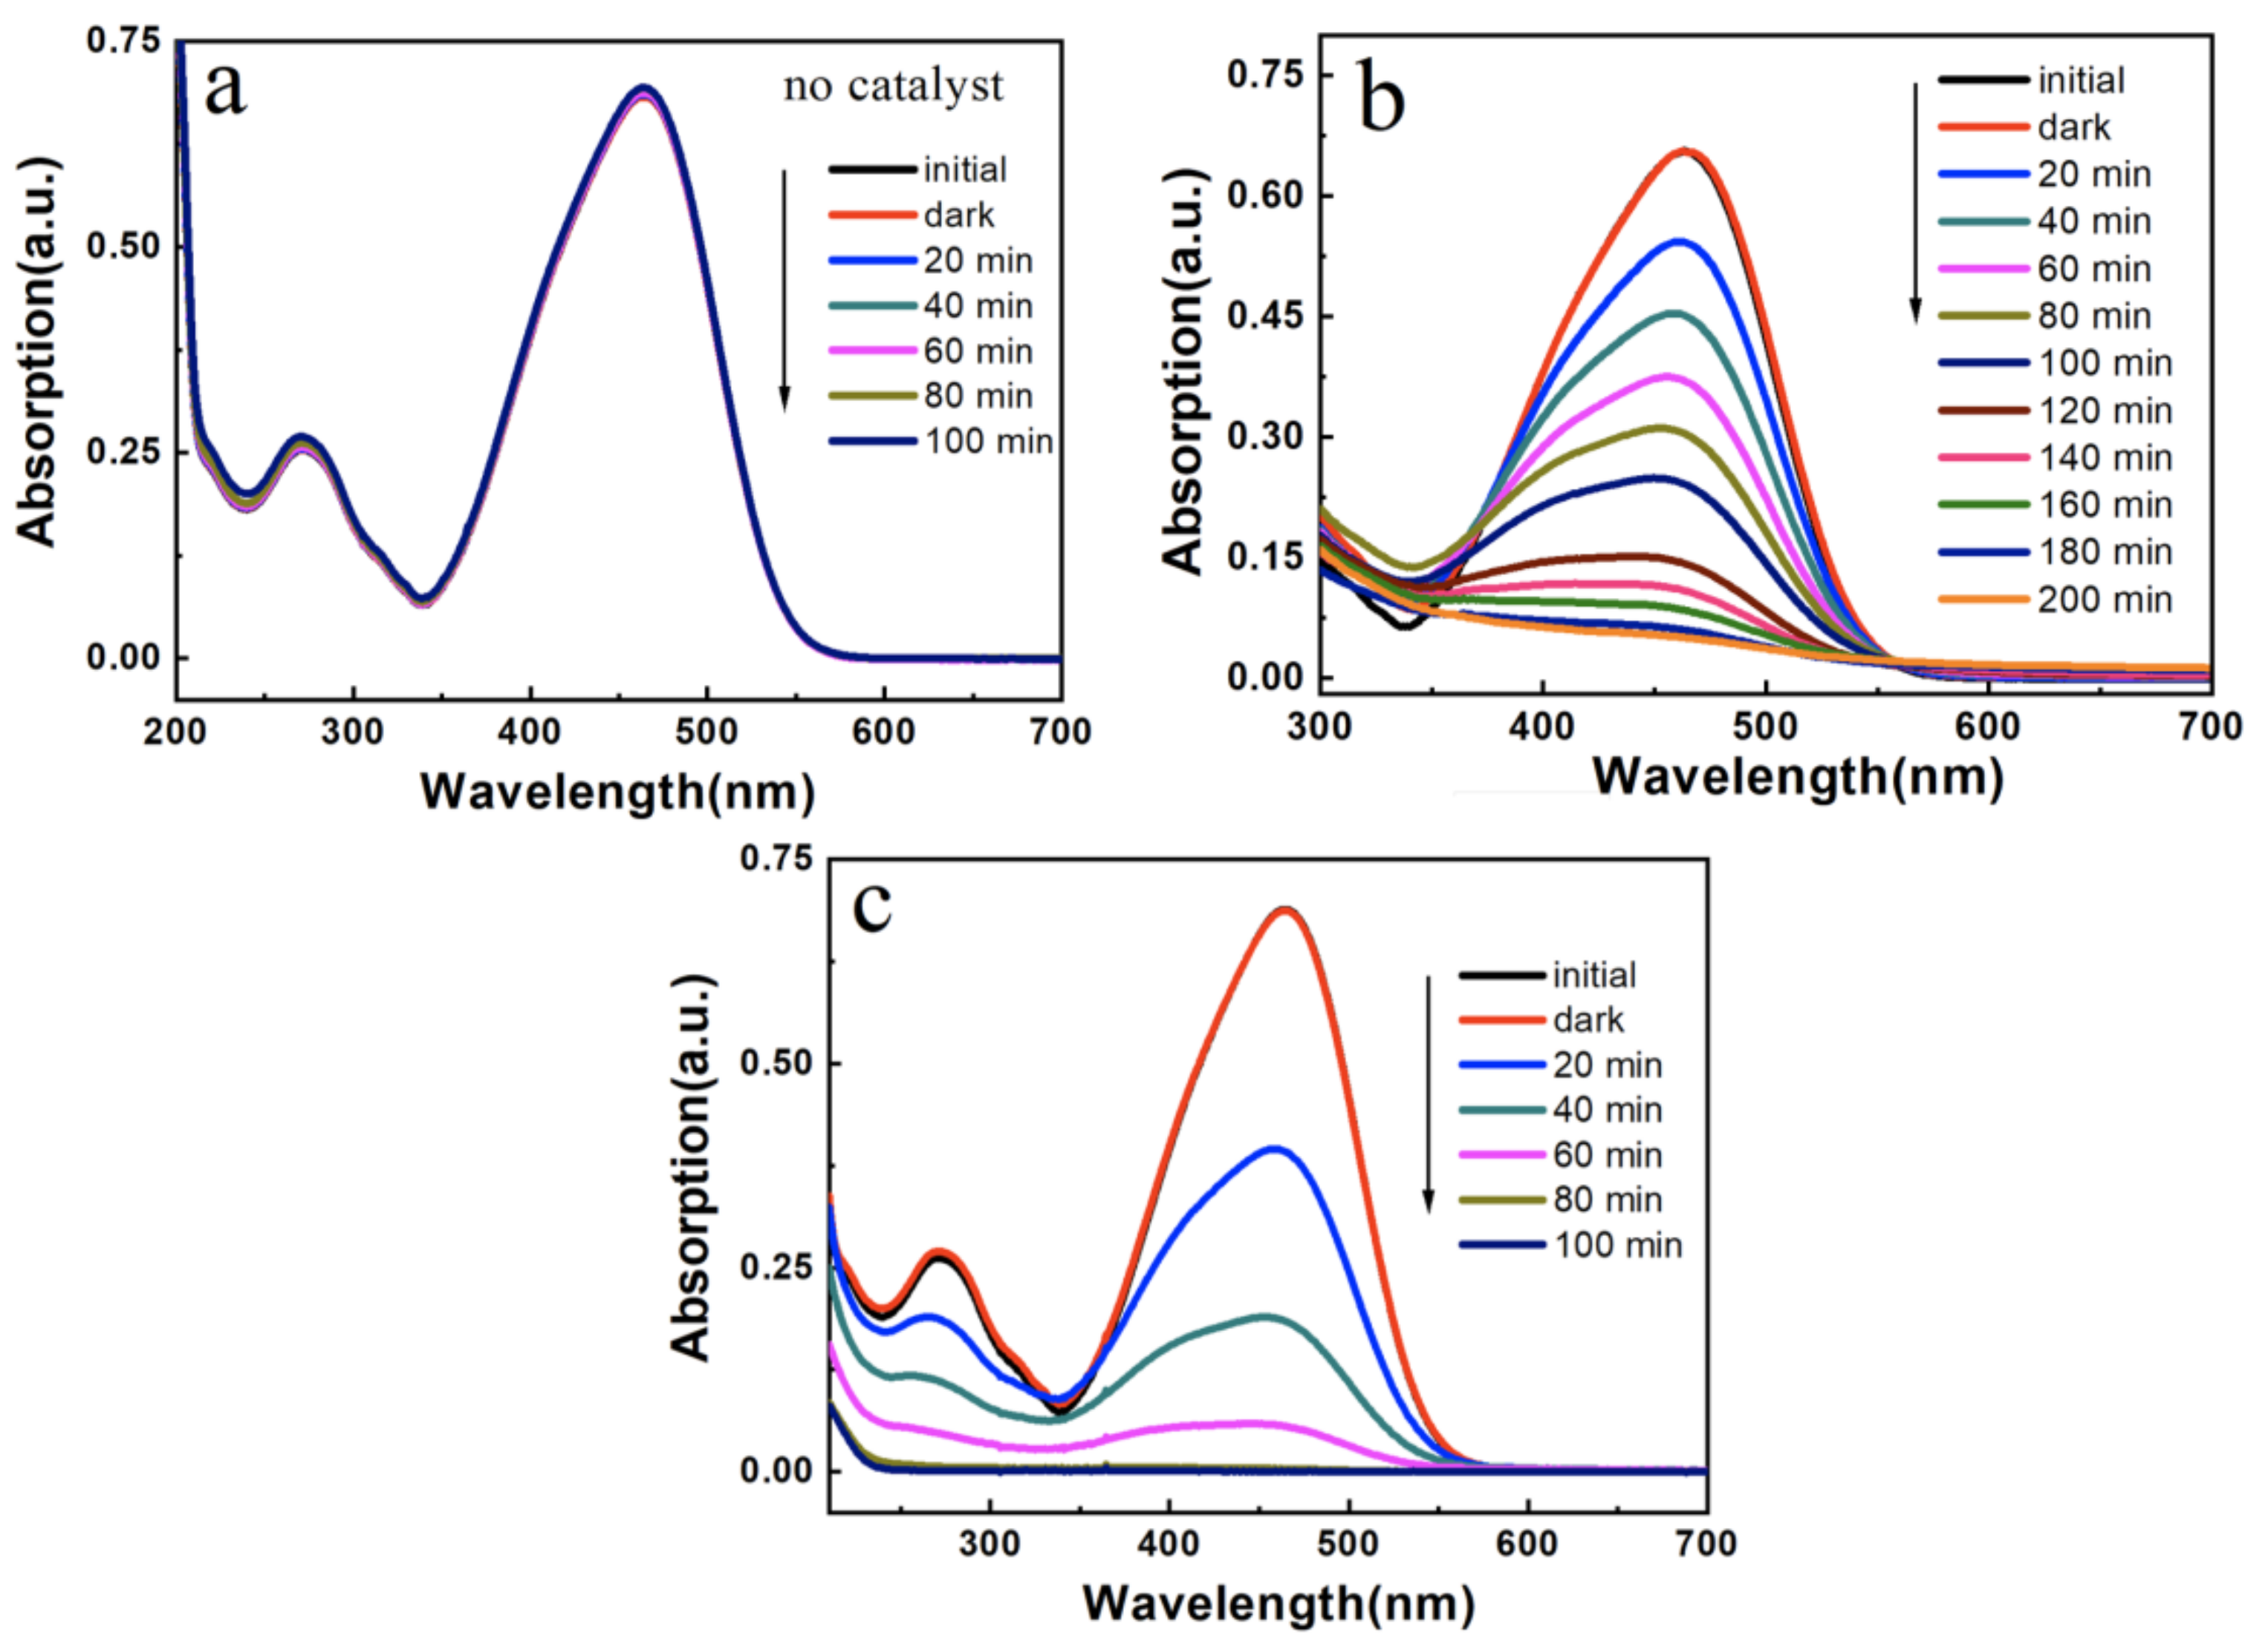
3.3. Photocatalytic Activity

It could be seen from the Figure 10a that the absorbance of the solution was basically unchanged when the catalyst was not added. After the catalyst was introduced, the absorbance of MO gradually decreased with the extension of time. Moreover, the hollow TiO2 microspheres were also prepared using P. pastoris GS115 as a template (see Figure A4). Comparing Figure 10b,c, it could be seen that the photocatalytic degradation ability of TiO2-SiO2 was higher than that of pure TiO2 prepared with P. pastoris GS115 as a template. The probable cause was that the introduction of SiO2 to TiO2 could reduce its surface energy to a certain extent and reduce its agglomeration, forming active hydroxyl radicals, and thereby enhancing the photocatalytic ability of TiO2 [40]. Jiang et al. [39] reported the preparation of hierarchical hollow TiO2@SiO2 composite microspherse and studied their photocatalytic performance on MO. The degradation rate was 99.7% after 3 h. Zhang et al. [41] prepared TiO2/SiO2 by the sol–gel method. The degradation rate of MO was 98.03% within 180 min using the 250 W mercury lamp as the light source. As shown in Figure 10c, the absorbance of MO was reduced to zero, indicating that MO was completely degraded in 100 min. The result suggests that the as-prepared TiO2-SiO2 microspheres exhibit an excellent photocatalytic activity.
The estimated band gaps of pure TiO2 and TiO2-SiO2 prepared with P. pastoris GS115 as a template are 3.23 eV and 3.63 eV, respectively (Figure 11). The band gap of TiO2-SiO2 is more than that of pure TiO2, indicating that the introduction of silicon leads to an increase in the band gap of the semiconductor and enhances the redox capacity of holes and electrons. Hence, the photocatalytic activity can be improved.

4. Conclusions

In summary, P. pastoris GS115 was employed as a typical microbe to demonstrate its potential in synthesizing high-efficient photocatalysts for the degradation of organic contaminants. Hollow SiO2 microspheres with a spherical morphology were successfully synthesized using the microbe template. The morphology and surface roughness of the hollow particles could be controlled by the reaction conditions. TiO2-SiO2 microspheres were successfully prepared by the hydrothermal process. Results indicated that TiO2-SiO2 kept in the favorable anatase phase of TiO2. The as-prepared TiO2-SiO2 exhibited good photocatalytic activity for the degradation of MO and the degradation rate could reach 99.9% in 100 min because of an increase in the band gap. This work is of great significance for employing microbes in the preparation of promising photocatalysts for large-scale practical application.

Author Contributions

Resources, X.J. and S.C.; Supervision, J.H. and Q.L.; Writing—original draft, S.L.; Writing—review & editing, L.L. All authors have read and agreed to the published version of the manuscript.

Funding

This research was funded by Natural Science Foundation of Fujian Province of China, grant number 2016J05044.

Institutional Review Board Statement

Not applicable.

Informed Consent Statement

Not applicable.

Data Availability Statement

The data presented in this study are available on request from the corresponding author.

Conflicts of Interest

The authors declare no conflict of interest.

Appendix A

Figure A1. Reaction mechanism diagram.
Nanomaterials 12 01606 g0a1
When TEOS is added to a mixture of water and ethanol containing microorganism, TEOS is attached to the cell wall. After the addition of ammonia, TEOS begins to hydrolyze and the resulting SiO2 particles grow in the cell wall. Due to the slow hydrolysis rate of weak alkali in ammonia water, the adsorbed SiO2 nanoparticles on the cell wall surface have enough time to grow. After calcination, the template is removed and the hollow SiO2 microspheres are synthesized. TiO2-SiO2 microspheres are prepared by the hydrothermal process and the photocatalytic activity for the degradation of methyl orange (MO) at room temperature under Xe arc lamp acting as simulated sunlight was explored.
In order to investigate the influence of microbe templates on the preparation of SiO2, the samples were characterized by TG. Figure A2 shows the TG characterization diagrams of Pichia pastoris GS115 and uncalcined SiO2. From the TG spectrum of P. pastoris GS115, it can be seen that there is a small weight loss peak at 85 °C, which is mainly caused by the desorption of water on the surface of the sample; in the range of 200–700 °C, in the spectrum a distinct weight loss step appeared, which was caused by the gradual breakdown of the biomass molecules of the P. pastoris GS115. The TG spectrum of uncalcined SiO2 microspheres is similar to the weight loss peak of P. pastoris GS115, which indicates that some biomass may remain on the surface of the uncalcined SiO2 microspheres.
Figure A2. TG curves of P. pastoris GS115 and uncalcined SiO2 (conditions: TEOS concentration 1.2 mol/L, the ratio of water to ethanol 1/2, aging time 12 h).
Nanomaterials 12 01606 g0a2
From the spectrum of uncalcined SiO2 in Figure A3, the structural water –OH anti scaling vibration peak appears at 3450 cm−1, and the peak near 1638cm−1 is the H–OH bend vibration peak of water. The peak at 955 cm−1 belongs to the bending vibration absorption peak of Si–OH, which is consistent with the literature reports. After calcination, the strong and wide absorption band at 1095 cm−1 is attributed to Si–O–Si anti scaling vibration peak, and the peak at 798cm−1 is attributed to Si–O symmetric stretching vibration peak.
Figure A3. FT-IR spectra of SiO2.
Nanomaterials 12 01606 g0a3
Figure A4. SEM images of TiO2 prepared from P. pastoris GS115 as a template.
Nanomaterials 12 01606 g0a4

References

  1. Behera, M.; Nayak, J.; Banerjee, S.; Chakrabortty, S.; Tripathy, S.K. A review on the treatment of textile industry waste effluents towards the development of efficient mitigation strategy: An integrated system design approach. J. Environ. Chem. Eng. 2021, 9, 105277. [Google Scholar] [CrossRef]
  2. Kishor, R.; Purchase, D.; Saratale, G.D.; Saratale, R.G.; Ferreira, L.F.R.; Bilal, M.; Chandra, R.; Bharagava, R.N. Ecotoxicological and health concerns of persistent coloring pollutants of textile industry wastewater and treatment approaches for environmental safety. J. Environ. Chem. Eng. 2021, 9, 105012. [Google Scholar] [CrossRef]
  3. Konicki, W.; Aleksandrzak, M.; Moszyński, D.; Mijowska, E. Adsorption of anionic azo-dyes from aqueous solutions onto graphene oxide: Equilibrium, kinetic and thermodynamic studies. J. Colloid Interface Sci. 2017, 496, 188–200. [Google Scholar] [CrossRef] [PubMed]
  4. Tran, T.H.; Le, H.H.; Pham, T.H.; Nguyen, D.T.; La, D.D.; Chang, S.W.; Lee, S.M.; Chung, W.J. Comparative study on methylene blue adsorption behavior of coffee husk-derived activated carbon materials prepared using hydrothermal and soaking methods. J. Environ. Chem. Eng. 2021, 9, 105362. [Google Scholar] [CrossRef]
  5. Domenzain-Gonzalez, J.; Castro-Arellano, J.J.; Galicia-Luna, L.A.; Rodriguez-Cruz, M.; Hernandez-Lopez, R.T.; Lartundo-Rojas, L. Photocatalytic membrane reactor based on Mexican Natural Zeolite: RB5 dye removal by photo-Fenton process. J. Environ. Chem. Eng. 2021, 9, 105281. [Google Scholar] [CrossRef]
  6. Verma, P.; Samanta, S.K.; Mishra, S. Photon-independent NaOH/H2O2–based degradation of rhodamine-B dye in aqueous medium: Kinetics, and impacts of various inorganic salts, antioxidants, and urea. J. Environ. Chem. Eng. 2020, 8, 103851. [Google Scholar] [CrossRef]
  7. Arslan-Alaton, I.; Tureli, G.; Olmez-Hanci, T. Treatment of azo dye production wastewaters using Photo-Fenton-like advanced oxidation processes: Optimization by response surface methodology. J. Photochem. Photobiol. A Chem. 2009, 202, 142–153. [Google Scholar] [CrossRef]
  8. Muruganandham, M.; Swaminathan, M. Photochemical oxidation of reactive azo dye with UV–H2O2 process. Dyes Pigments 2004, 62, 269–275. [Google Scholar] [CrossRef]
  9. Neamtu, M.; Siminiceanu, I.; Yediler, A.; Kettrup, A. Kinetics of decolorization and mineralization of reactive azo dyes in aqueous solution by the UV/H2O2 oxidation. Dyes Pigments 2002, 53, 93–99. [Google Scholar] [CrossRef]
  10. Dang, T.-D.; Nguyen-Thi, L.; Nguyen-Xuan, T.; Le, H.T.; Vo, H.T.; Nguyen, T.H.P.; La, D.D.; Kim, G.-M.; Chang, S.W.; Nguyen, D.D. Hierarchical zero-valent iron fabricated from microfluidic reactor for the removal of organic dyes from aqueous media. Sustain. Energy Technol. Assess. 2021, 44, 101031. [Google Scholar] [CrossRef]
  11. La, D.D.; Jadha, R.W.; Gosavi, N.M.; Rene, E.R.; Nguyen, T.A.; Xuan-Thanh, B.; Nguyen, D.D.; Chung, W.J.; Chang, S.W.; Nguyen, X.H.; et al. Natureinspired organic semiconductor via solvophobic self-assembly of porphyrin derivative as an effective photocatalyst for degradation of rhodamine B dye. J. Water Process Eng. 2021, 40, 101876. [Google Scholar] [CrossRef]
  12. Ahila, K.G.; Ravindran, B.; Muthunarayanan, V.; Nguyen, D.D.; Nguyen, X.C.; Chang, S.W.; Nguyen, V.K.; Thamaraiselvi, C. Phytoremediation potential of freshwater macrophytes for treating dye-containing wastewater. Sustainability 2021, 13, 329. [Google Scholar] [CrossRef]
  13. Türgay, O.; Ersoz, G.; Atalay, S.; Forss, J.; Welander, U. The treatment of azo dyes found in textile industry wastewater by anaerobic biological method and chemical oxidation. Sep. Purif. Technol. 2011, 79, 26–33. [Google Scholar] [CrossRef]
  14. Chaturvedi, A.; Rai, B.N.; Singh, R.S.; Jaiswal, R.P. Comparative toxicity assessment using plant and luminescent bacterial assays after anaerobic treatments of dyeing wastewater in a recirculating fixed bed bioreactor. J. Environ. Chem. Eng. 2021, 9, 105466. [Google Scholar] [CrossRef]
  15. Jangid, N.K.; Jadoun, S.; Yadav, A.; Srivastava, M.; Kaur, N. Polyaniline-TiO2-based photocatalysts for dyes degradation. Polym. Bull. 2021, 78, 4743–4777. [Google Scholar] [CrossRef]
  16. Fernández-Pérez, A.; Marbán, G. Titanium dioxide: A heterogeneous catalyst for dark peroxidation superior to iron oxide. J. Environ. Chem. Eng. 2020, 8, 104254. [Google Scholar] [CrossRef]
  17. Thi-Tuyet Hoang, M.; Thi-Kim Tran, A.; Suc, N.V. The-Vinh Nguyen, Antibacterial activities of gel-derived Ag-TiO2-SiO2 nanomaterials under different light irradiation. AIMS Mater. Sci. 2015, 3, 339–348. [Google Scholar] [CrossRef]
  18. Wanag, A.; Sienkiewicz, A.; Rokicka-Konieczna, P.; Kusiak-Nejman, E.; Morawski, A.W. Influence of modification of titanium dioxide by silane coupling agents on the photocatalytic activity and stability. J. Environ. Chem. Eng. 2020, 8, 103917. [Google Scholar] [CrossRef]
  19. Lakshmanareddy, N.; Rao, V.N.; Cheralathan, K.K.; Subramaniam, E.P.; Shankar, M.V. Pt/TiO2 nanotube photocatalyst—Effect of synthesis methods on valance state of Pt and its influence on hydrogen production and dye degradation. J. Colloid Interf. Sci. 2019, 538, 83–98. [Google Scholar] [CrossRef]
  20. Wang, J.D.; Gu, Z.J.; Zhang, J.L.; Chen, X.; Li, M.J.; Yu, Y.; Ge, M.Q.; Li, X.Q. Mesoporous structure TiO2/SiO2 composite for methylene blue adsorption and photodegradation. Micro. Nano. Lett. 2019, 14, 323–328. [Google Scholar] [CrossRef]
  21. Saroj, S.; Singh, L.; Singh, S.V. Photodegradation of direct blue-199 in carpet industry wastewater using iron-doped TiO2 nanoparticles and regenerated photocatalyst. Int. J. Chem. Kinet. 2019, 51, 189–205. [Google Scholar] [CrossRef]
  22. Zhang, W.P.; Li, G.Y.; Liu, H.L.; Chen, J.Y.; Ma, S.T.; An, T.C. Micro/nano-bubble assisted synthesis of Au/TiO2@CNTs composite photocatalyst for photocatalytic degradation of gaseous styrene and its enhanced catalytic mechanism. Environ. Sci-Nano 2019, 6, 948–958. [Google Scholar] [CrossRef]
  23. Huang, J.J.; Jing, H.X.; Li, N.; Jiao, L.X.; Zhou, W. Fabrication of magnetically recyclable SnO2-TiO2/CoFe2O4 hollow core-shell photocatalyst: Improving photocatalytic efficiency under visible light irradiation. J. Solid State Chem. 2019, 271, 103–109. [Google Scholar] [CrossRef]
  24. Smeets, V.; Boissiere, C.; Sanchez, C.; Gaigneaux, E.M.; Peeters, E.; Sels, B.F.; Dusselier, M.; Debecker, D.P. Aerosol route to TiO2-SiO2 catalysts with tailored pore architecture and high epoxidation activity. Chem. Mater. 2019, 31, 1610–1619. [Google Scholar] [CrossRef]
  25. Wang, W.; Chen, H.; Fang, J.; Lai, M. Large-scale preparation of rice-husk-derived mesoporous SiO2@TiO2 as efficient and promising photocatalysts for organic contaminants degradation. App. Surf. Sci. 2019, 467, 1187–1194. [Google Scholar] [CrossRef]
  26. Wu, Y.; Li, M.; Yuan, J.; Lu, J.; Wu, P.; Liu, C.; Wang, X. Rapid preparation of TiO2-SiO2 heterostructure photonic crystal in the near infrared region via a modified electrophoresis-assisted self-assembly process. Mater. Res. Bull. 2018, 100, 353–356. [Google Scholar] [CrossRef]
  27. Wu, J.; He, X.D.; Li, G.Z.; Deng, J.H.; Chen, L.; Xue, W.B.; Li, D.J. Rapid construction of TiO2/SiO2 composite film on Ti foil as lithium-ion battery anode by plasma discharge in solution. Appl. Phys. Lett. 2019, 114, 043903–043908. [Google Scholar] [CrossRef]
  28. Zhou, Z.R.; Dong, P.; Wang, D.Y.; Liu, M.; Duan, J.G.; Nayaka, G.P.; Wang, D.; Xu, C.Y.; Hua, Y.X.; Zhang, Y.J. Silicon-titanium nanocomposite synthesized via the direct electrolysis of SiO2/TiO2 precursor in molten salt and their performance as the anode material for lithium-ion batteries. J. Alloy Compd. 2019, 781, 362–370. [Google Scholar] [CrossRef]
  29. Hao, N.; Nie, Y.; Xu, Z.; Closson, A.B.; Usherwood, T.; Zhang, J.X. Microfluidic continuous flow synthesis of functional hollow spherical silica with hierarchical sponge-like large porous shell. Chem. Eng. J. 2019, 366, 433–438. [Google Scholar] [CrossRef]
  30. He, J.Q.; Chen, D.Y.; Li, N.J.; Xu, Q.F.; Li, H.; He, J.H.; Lu, J.M. Hollow mesoporous Co3O4-CeO2 composite nanotubes with open ends for efficient catalytic CO oxidation. J. ChemSusChem 2019, 12, 1084–1090. [Google Scholar] [CrossRef]
  31. Tardy, B.L.; Richardson, J.J.; Guo, J.; Lehtonen, J.; Ago, M.; Rojas, O.J. Lignin nano- and microparticles as template for nanostructured materials: Formation of hollow metal-phenolic capsules. Green Chem. 2018, 20, 1335–1344. [Google Scholar] [CrossRef] [Green Version]
  32. Atla, S.B.; Chen, Y.-J.; Chiu, H.-W.; Chen, C.-C.; Shu, J.-C. Microbial induced synthesis of CeCO3OH and CeO2 hollow rods micro/nanostructure. Mater. Lett. 2016, 167, 238–241. [Google Scholar] [CrossRef]
  33. Wei, L.; Ma, M.X.; Lu, Y.H.; Wang, D.S.; Zhang, S.L.; Zhao, T.; Ma, W.P. Hydrogen generation from hydrolysis of sodium borohydride using Co3O4 hollow microspheres synthesized with yeast template. J. Inorg. Mater. 2018, 33, 648–652. [Google Scholar]
  34. Tripathi, R.; Narayan, A.; Bramhecha, I.; Sheikh, J. Development of multifunctional linen fabric using chitosan film as a template for immobilization of in-situ generated CeO2 nanoparticles. Int. J. Biol. Macromol. 2019, 121, 1154–1159. [Google Scholar] [CrossRef]
  35. Records, W.C.; Yoon, Y.; Ohmura, J.; Chanut, N.; Belcher, A.M. Virus-templated Pt-Ni(OH)2 nanonetworks for enhanced electrocatalytic reduction of water. Nano Energy 2019, 58, 167–174. [Google Scholar] [CrossRef] [Green Version]
  36. Yaacob, K.A.; Riley, J.D. Study on the influence of synthesis temperature of anatase TiO2 nanoparticles for electrophoretic deposition. Adv. Mater. Res. 2013, 620, 161–165. [Google Scholar] [CrossRef]
  37. Jongsomjit, B.; Wongsalee, T.; Praserthdam, P. Catalytic behaviors of mixed TiO2-SiO2-supported cobalt Fischer–Tropsch catalysts for carbon monoxide hydrogenation. Mater. Chem. Phys. 2006, 97, 343–350. [Google Scholar] [CrossRef]
  38. Esfandiaria, N.; Kashefia, M.; Mirjalilia, M.; Afsharnezhad, S. Role of silica mid-layer in thermal and chemical stability of hierarchical Fe3O4-SiO2-TiO2 nanoparticles for improvement of lead adsorption: Kinetics, thermodynamic and deep XPS investigation. Mat. Sci. Eng. B 2020, 262, 114690. [Google Scholar] [CrossRef]
  39. Jiang, Q.; Huang, J.; Ma, B.; Yang, Z.; Zhang, T.; Wang, X. Recyclable, hierarchical hollow photocatalyst TiO2@SiO2 composite microsphere realized by raspberry-like SiO2. Colloid Surface A 2020, 602, 125112. [Google Scholar] [CrossRef]
  40. Deng, H.; Jiang, X. Preparation of TiO2/SiO2 and photocatalytic degradation of Methyl Orange. J. Textile 2007, 28, 76–83. [Google Scholar]
  41. Zhang, C.H.; Li, J.; Chen, Z.M.; Zhu, Q.F. Preparation of TiO2/SiO2 and photocatalytic oxidative degradation of methyl orange. J. North Cent. Univ. 2015, 36, 682–688. [Google Scholar]
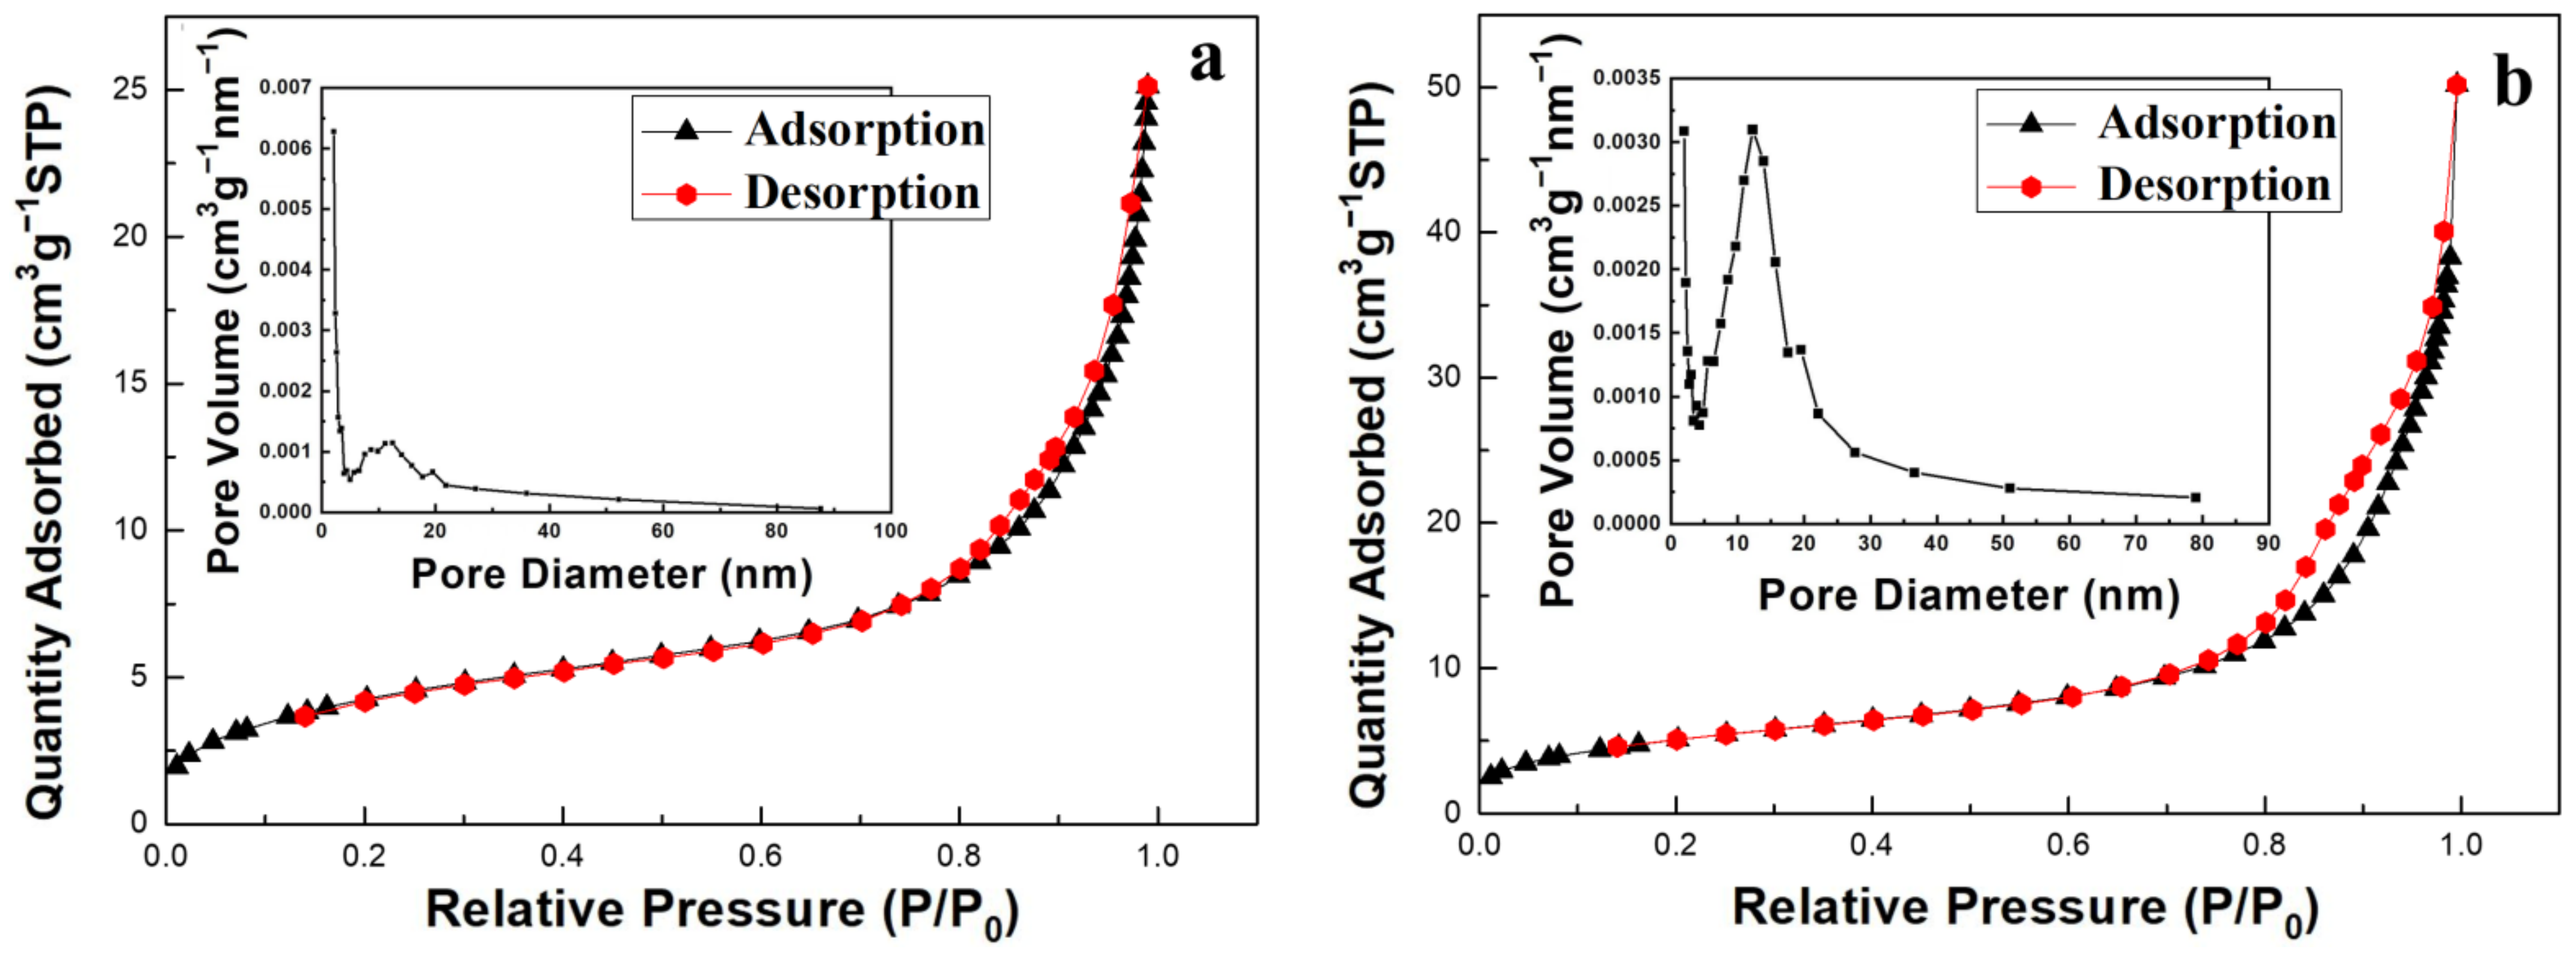
Figure 1. SEM images of SiO2 prepared by different preprocessing methods: (a) without adding template; (b) P. pastoris GS 115 were suspended in ethanol and followed by TEOS and ammonia; (c) P. pastoris GS 115 were suspended in a hybrid system of ethanol and ammonia and followed by TEOS and ammonia; (d) P. pastoris GS 115 were suspended in an ethanol–water mixture and followed by TEOS and ammonia.
Nanomaterials 12 01606 g001
Figure 2. SEM images of SiO2 synthesized at different TEOS concentrations: (a) 0.9 mol/L; (b) 1.0 mol/L; (c) 1.1 mol/L; (d) 1.2 mol/L; (e) 1.3 mol/L.
Nanomaterials 12 01606 g002
Figure 3. SEM images of SiO2 synthesized at different ratios of water to ethanol: (a) 1/1; (b) 1/1.5; (c) 1/2; (d) 1/2.5.
Nanomaterials 12 01606 g003
Figure 4. SEM images of SiO2 synthesized at different aging times: (a) 6 h; (b) 10 h; (c) 12 h; (d) 24 h; (e) 36 h.
Nanomaterials 12 01606 g004aNanomaterials 12 01606 g004b
Figure 5. XRD patterns of SiO2 and TiO2-SiO2.
Nanomaterials 12 01606 g005
Figure 6. (a) TEM image and (b) high-resolution TEM image of the TiO2-SiO2.
Nanomaterials 12 01606 g006
Figure 7. EDX elemental mapping investigation of (a) TiO2-SiO2 (b) Ti; (c) Si; (d) O.
Nanomaterials 12 01606 g007
Figure 8. XPS spectra of SiO2 and TiO2-SiO2. (a) Survey scan; (b) O 1s of SiO2; (c) Si 2p of SiO2; (d) Ti 2p of TiO2-SiO2; (e) O 1s of TiO2-SiO2; (f) Si 2p of TiO2-SiO2.
Nanomaterials 12 01606 g008
Figure 9. (a) N2 adsorption–desorption isotherm curves of SiO2. Inset is Barret Joyner Halenda (BJH) pore size distribution of SiO2; (b) N2 adsorption–desorption isotherm curves of TiO2-SiO2. Inset is BJH pore size distribution of TiO2- SiO2.
Nanomaterials 12 01606 g009
Figure 10. Photocatalytic activity of (a) no catalyst; (b) TiO2 prepared from P. pastoris GS115 as a template; (c) TiO2-SiO2 prepared from P. pastoris GS115 as a template for MO degradation.
Nanomaterials 12 01606 g010
Figure 11. Estimated band gaps of (a) TiO2 prepared from P. pastoris GS115 as a template and (b) TiO2-SiO2 prepared from P. pastoris GS115 as a template based on the Tauc/Davis–Mott model.
Nanomaterials 12 01606 g011
Table 1. Specific surface area and pore size distribution parameters of different samples.
SampleSBET (m2g−1)Vp (cm3g−1)Dp (nm)
SiO2 without template10.950.0228.06
SiO2 with yeast template15.970.0399.73
TiO2-SiO218.880.07113.01
Publisher’s Note: MDPI stays neutral with regard to jurisdictional claims in published maps and institutional affiliations.

