
Three-Phase Mixed Titania Powder Modified by Silver and Silver Chloride with Enhanced Photocatalytic Activity under UV–Visible Light


Abstract
:1. Introduction
2. Experiment
2.1. Material Preparation
2.2. Characterization Techniques
2.3. Photocatalytic and Electrochemical Experiment
3. Results and Discussion
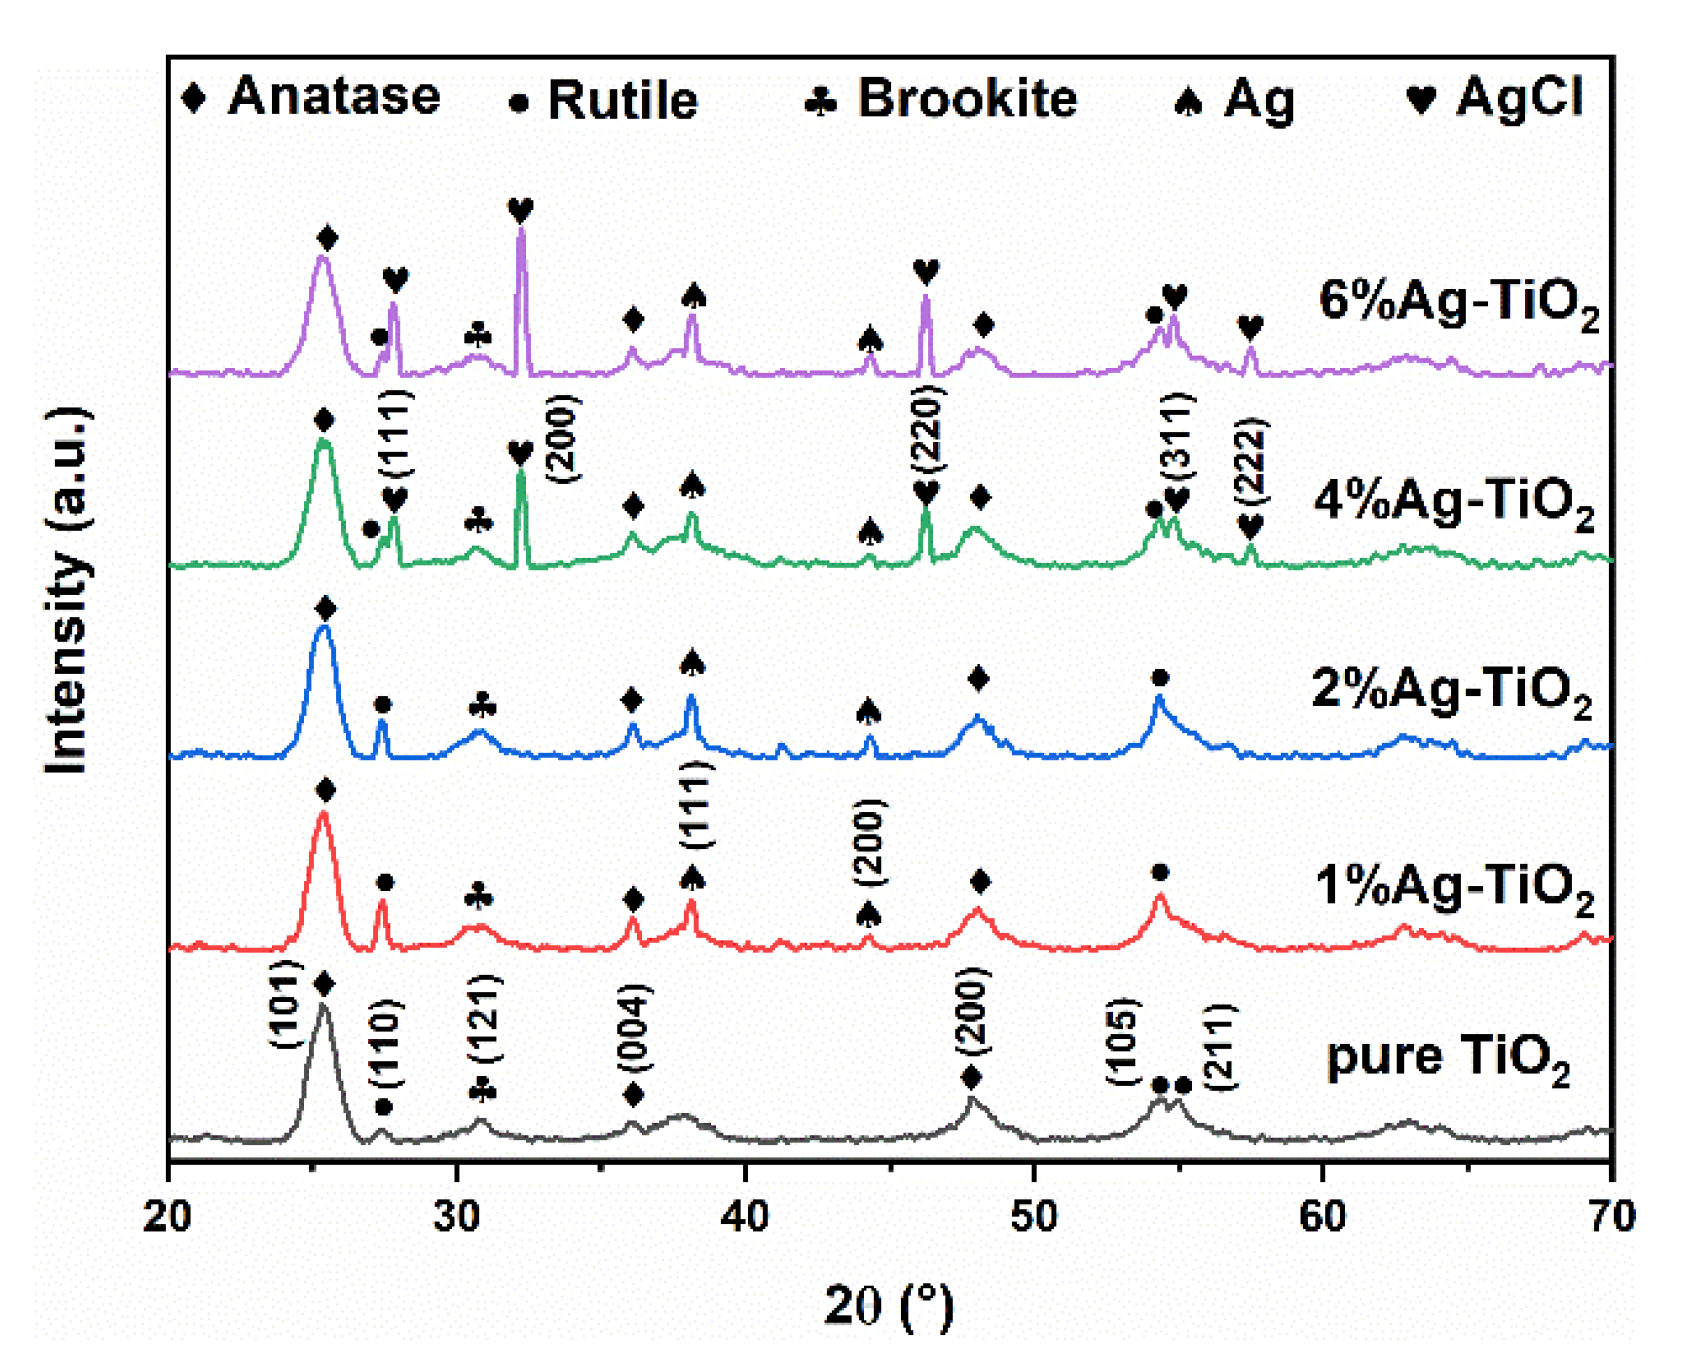
3.1. Crystal Structure
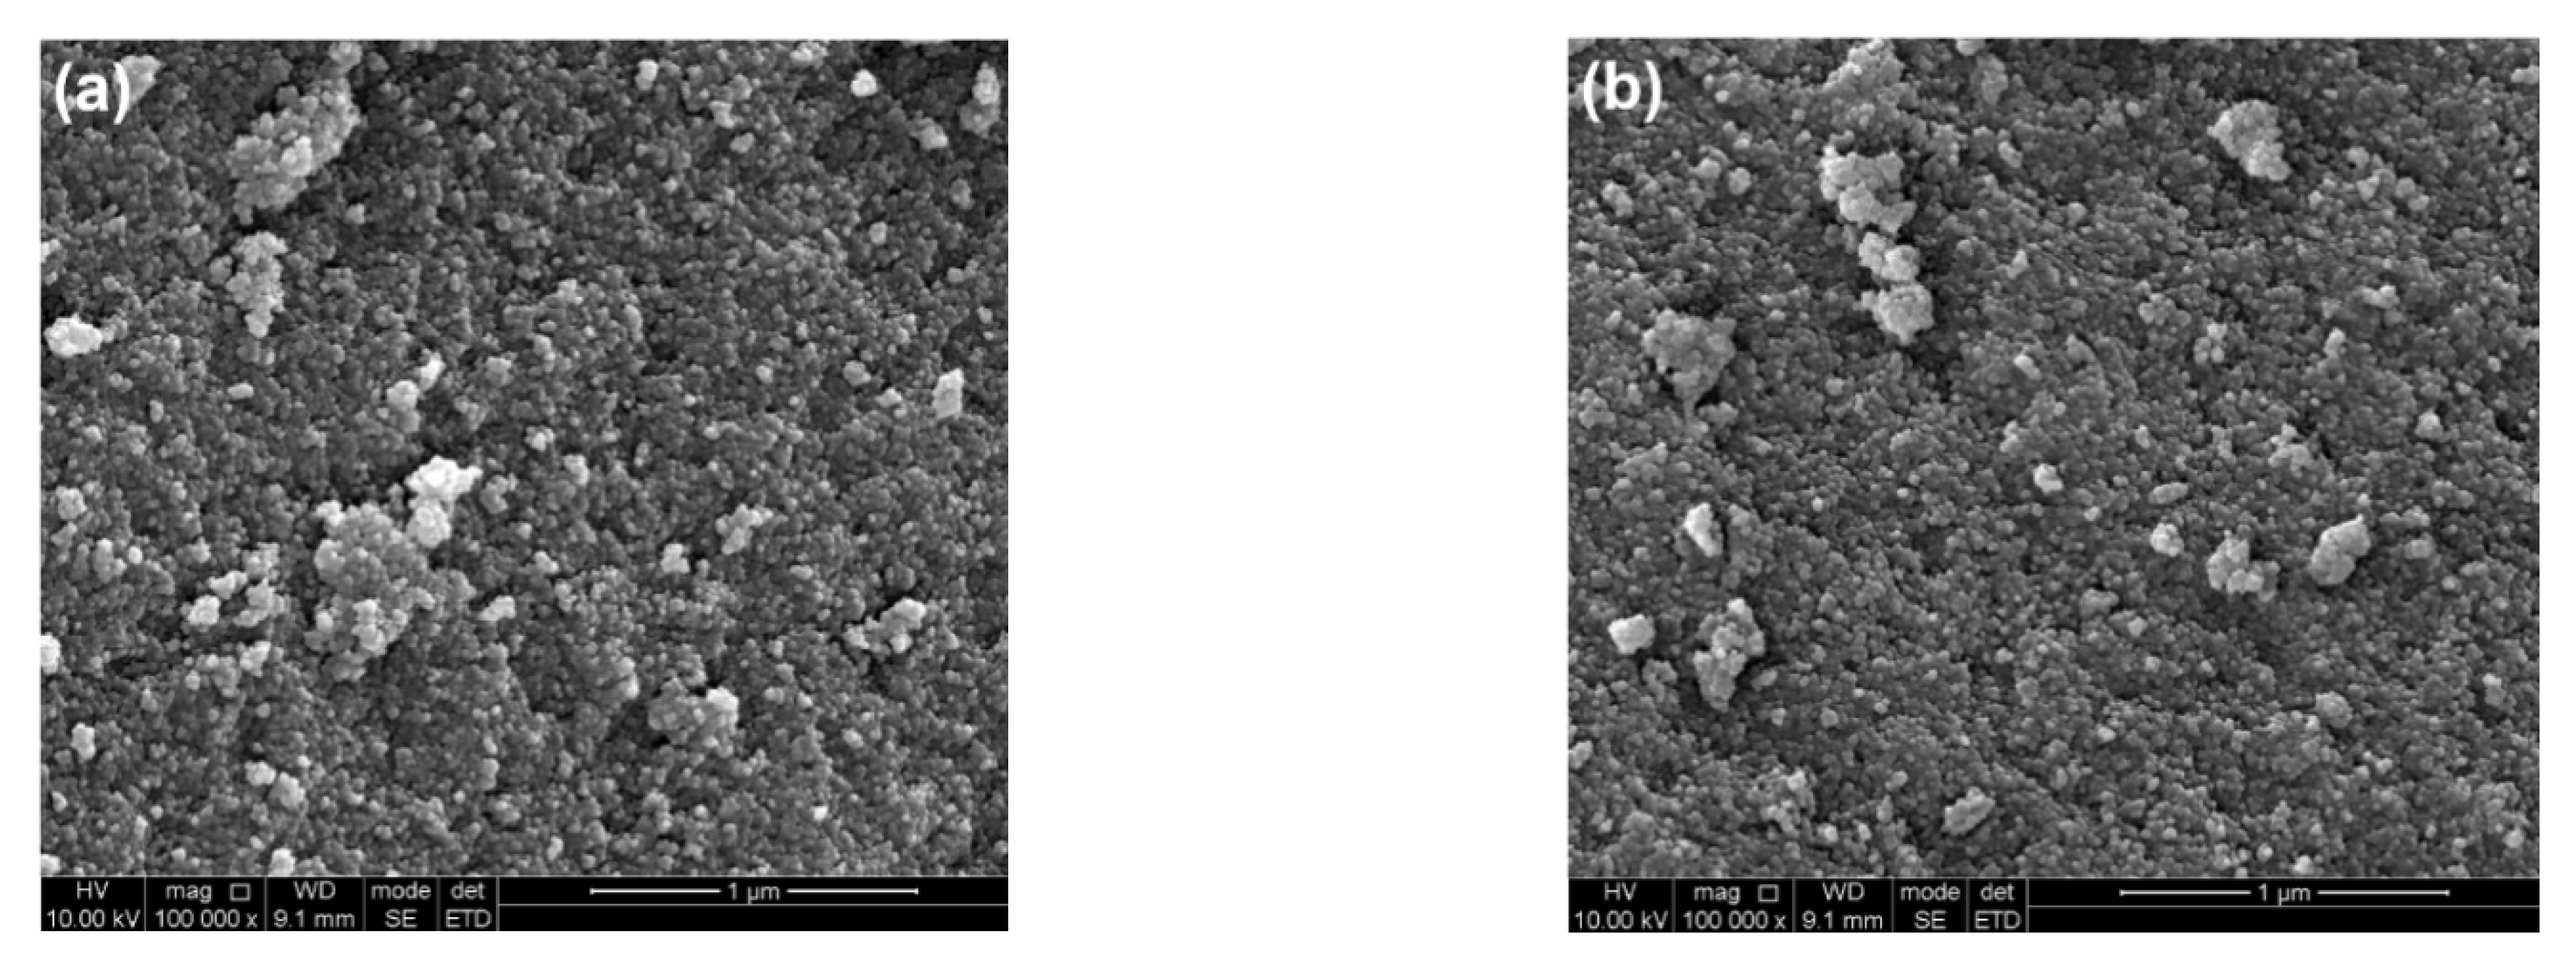
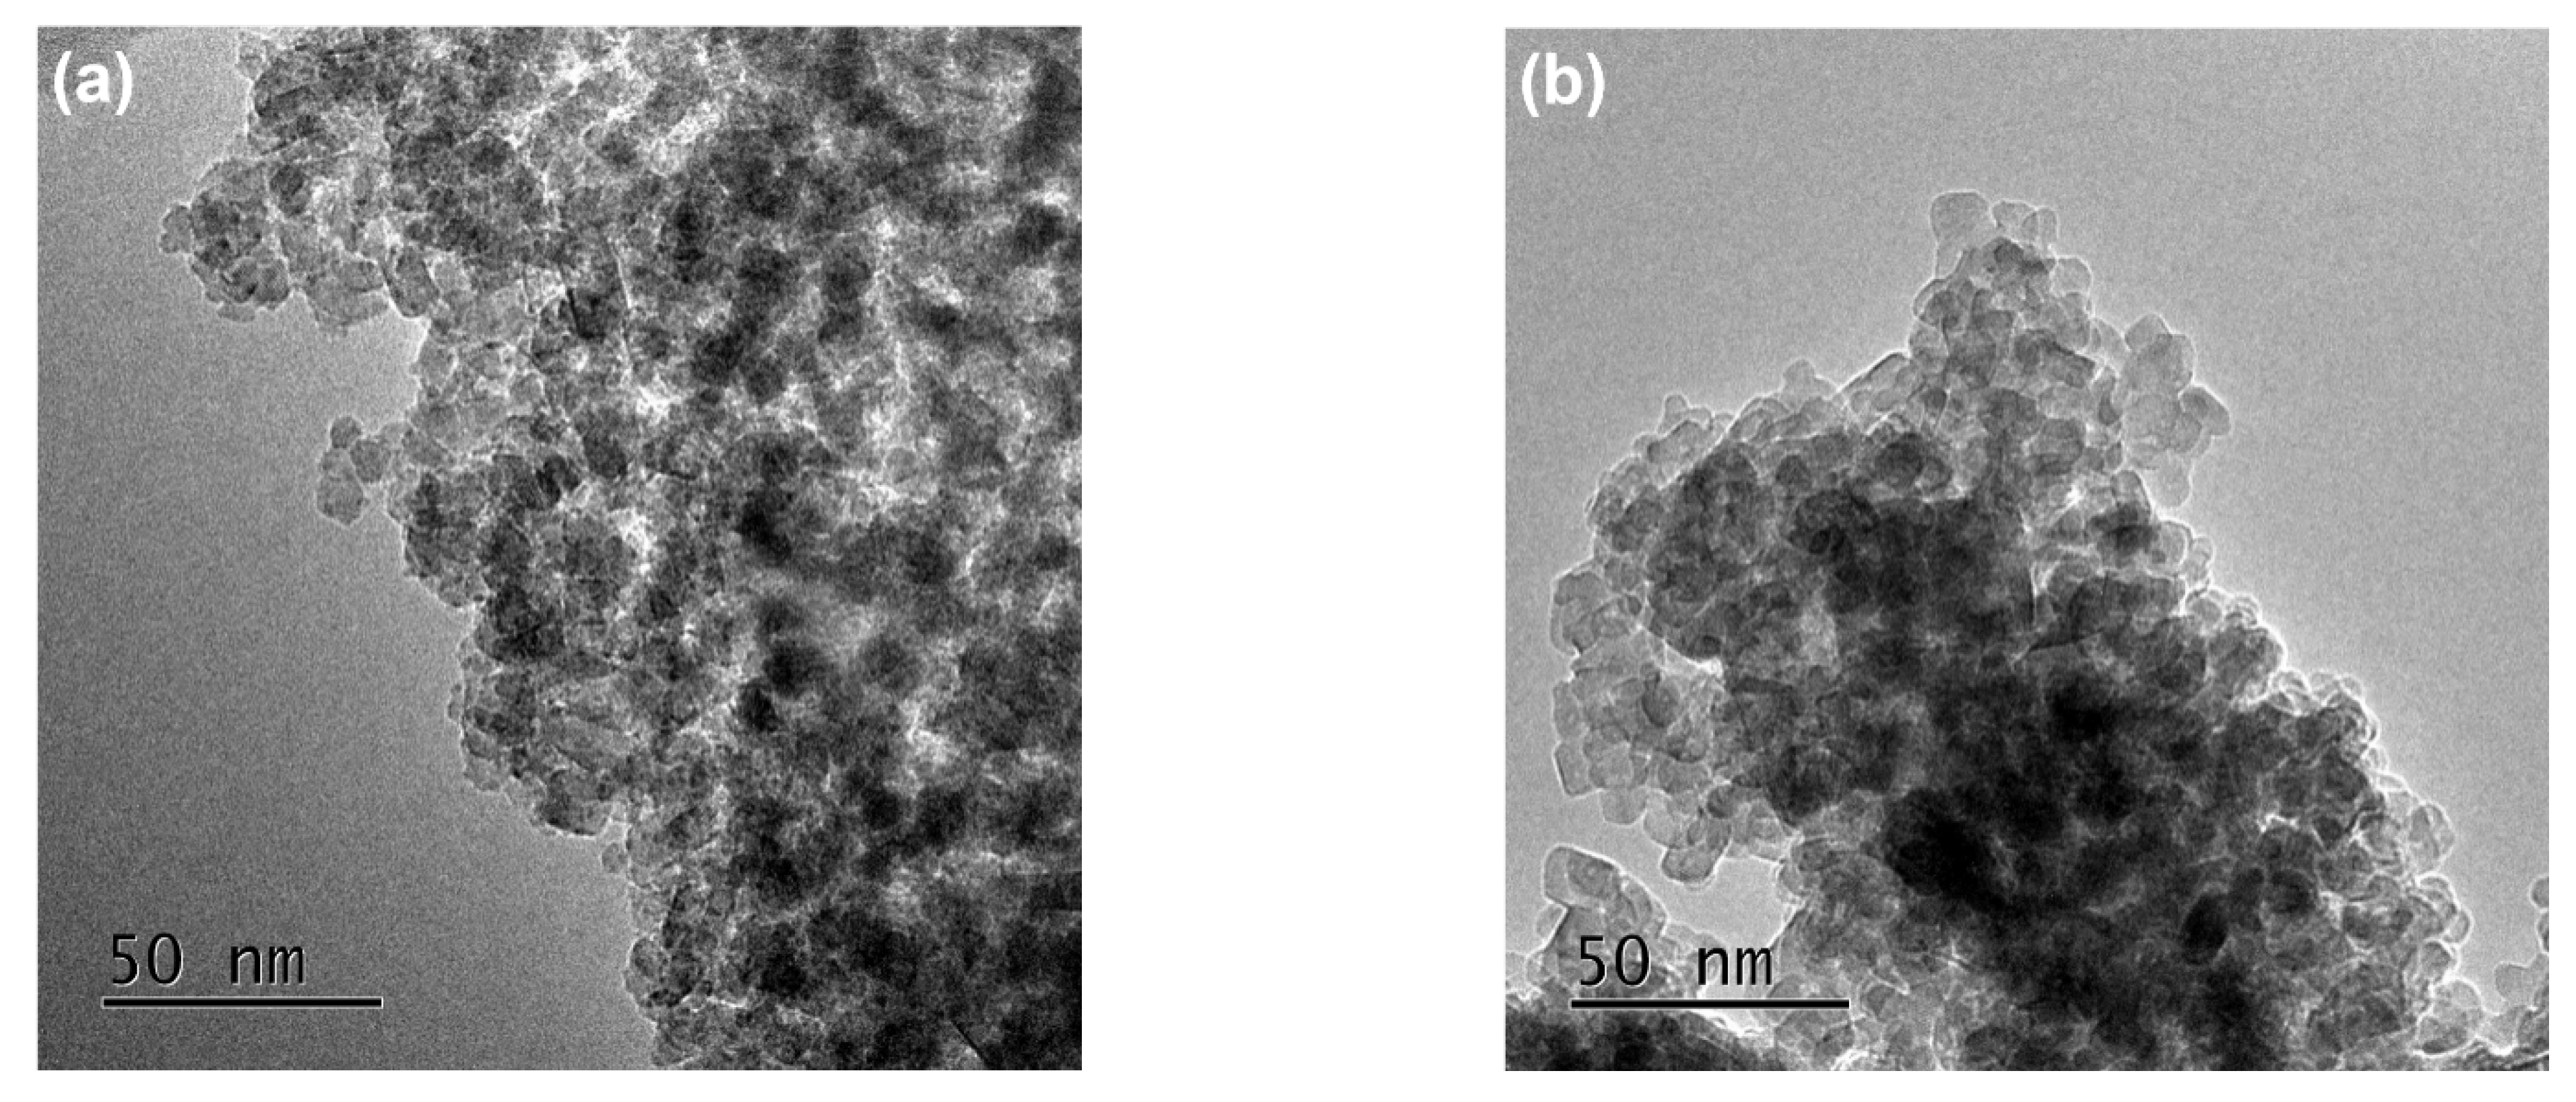
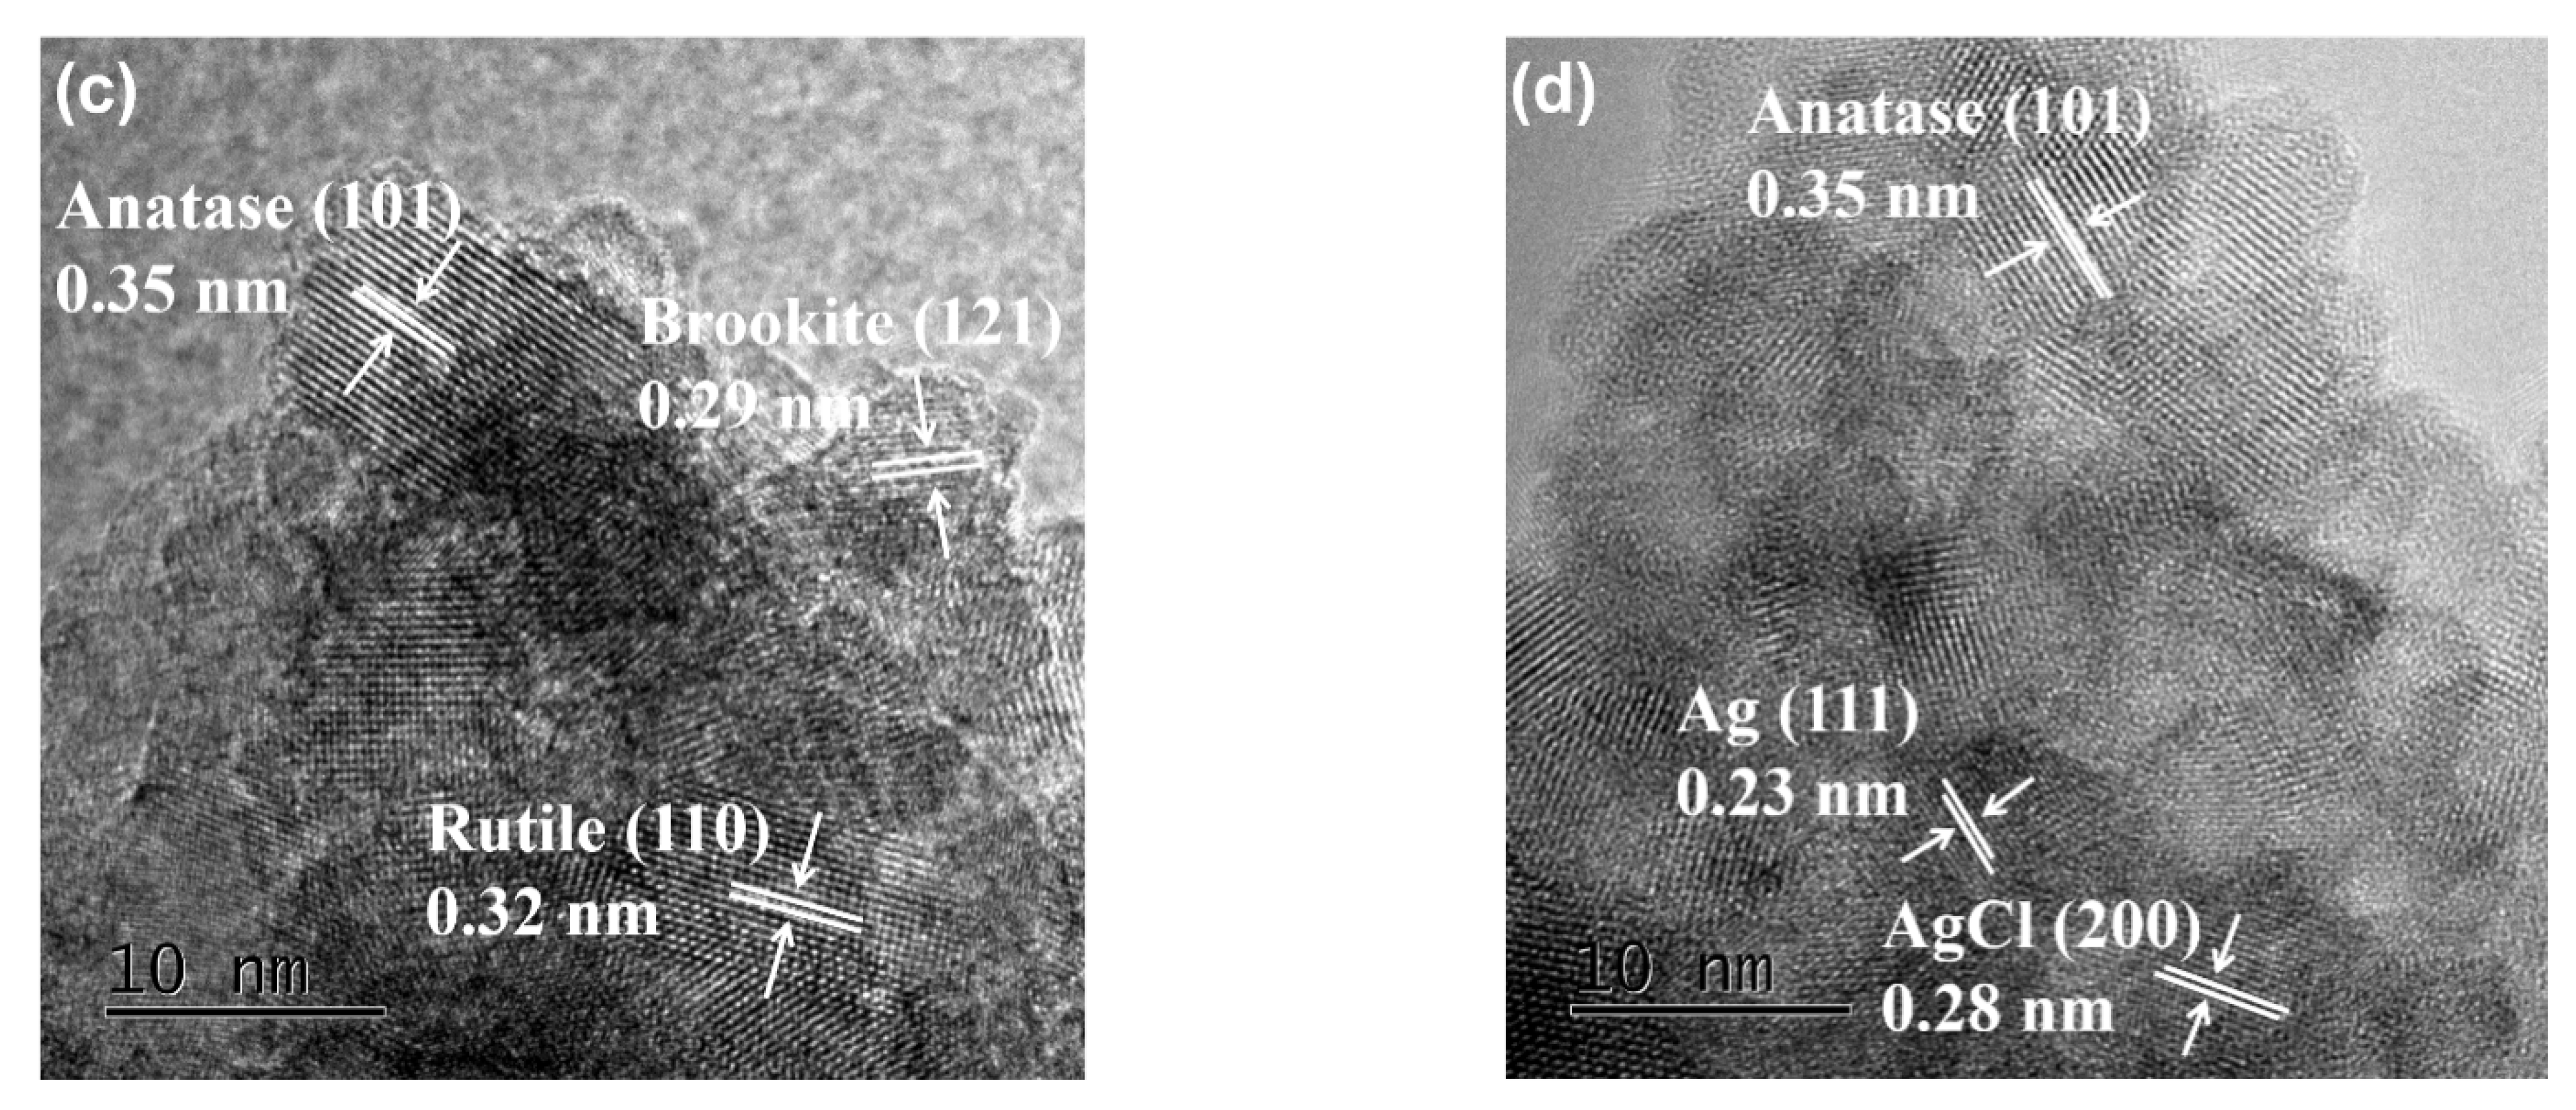
3.2. Morphology
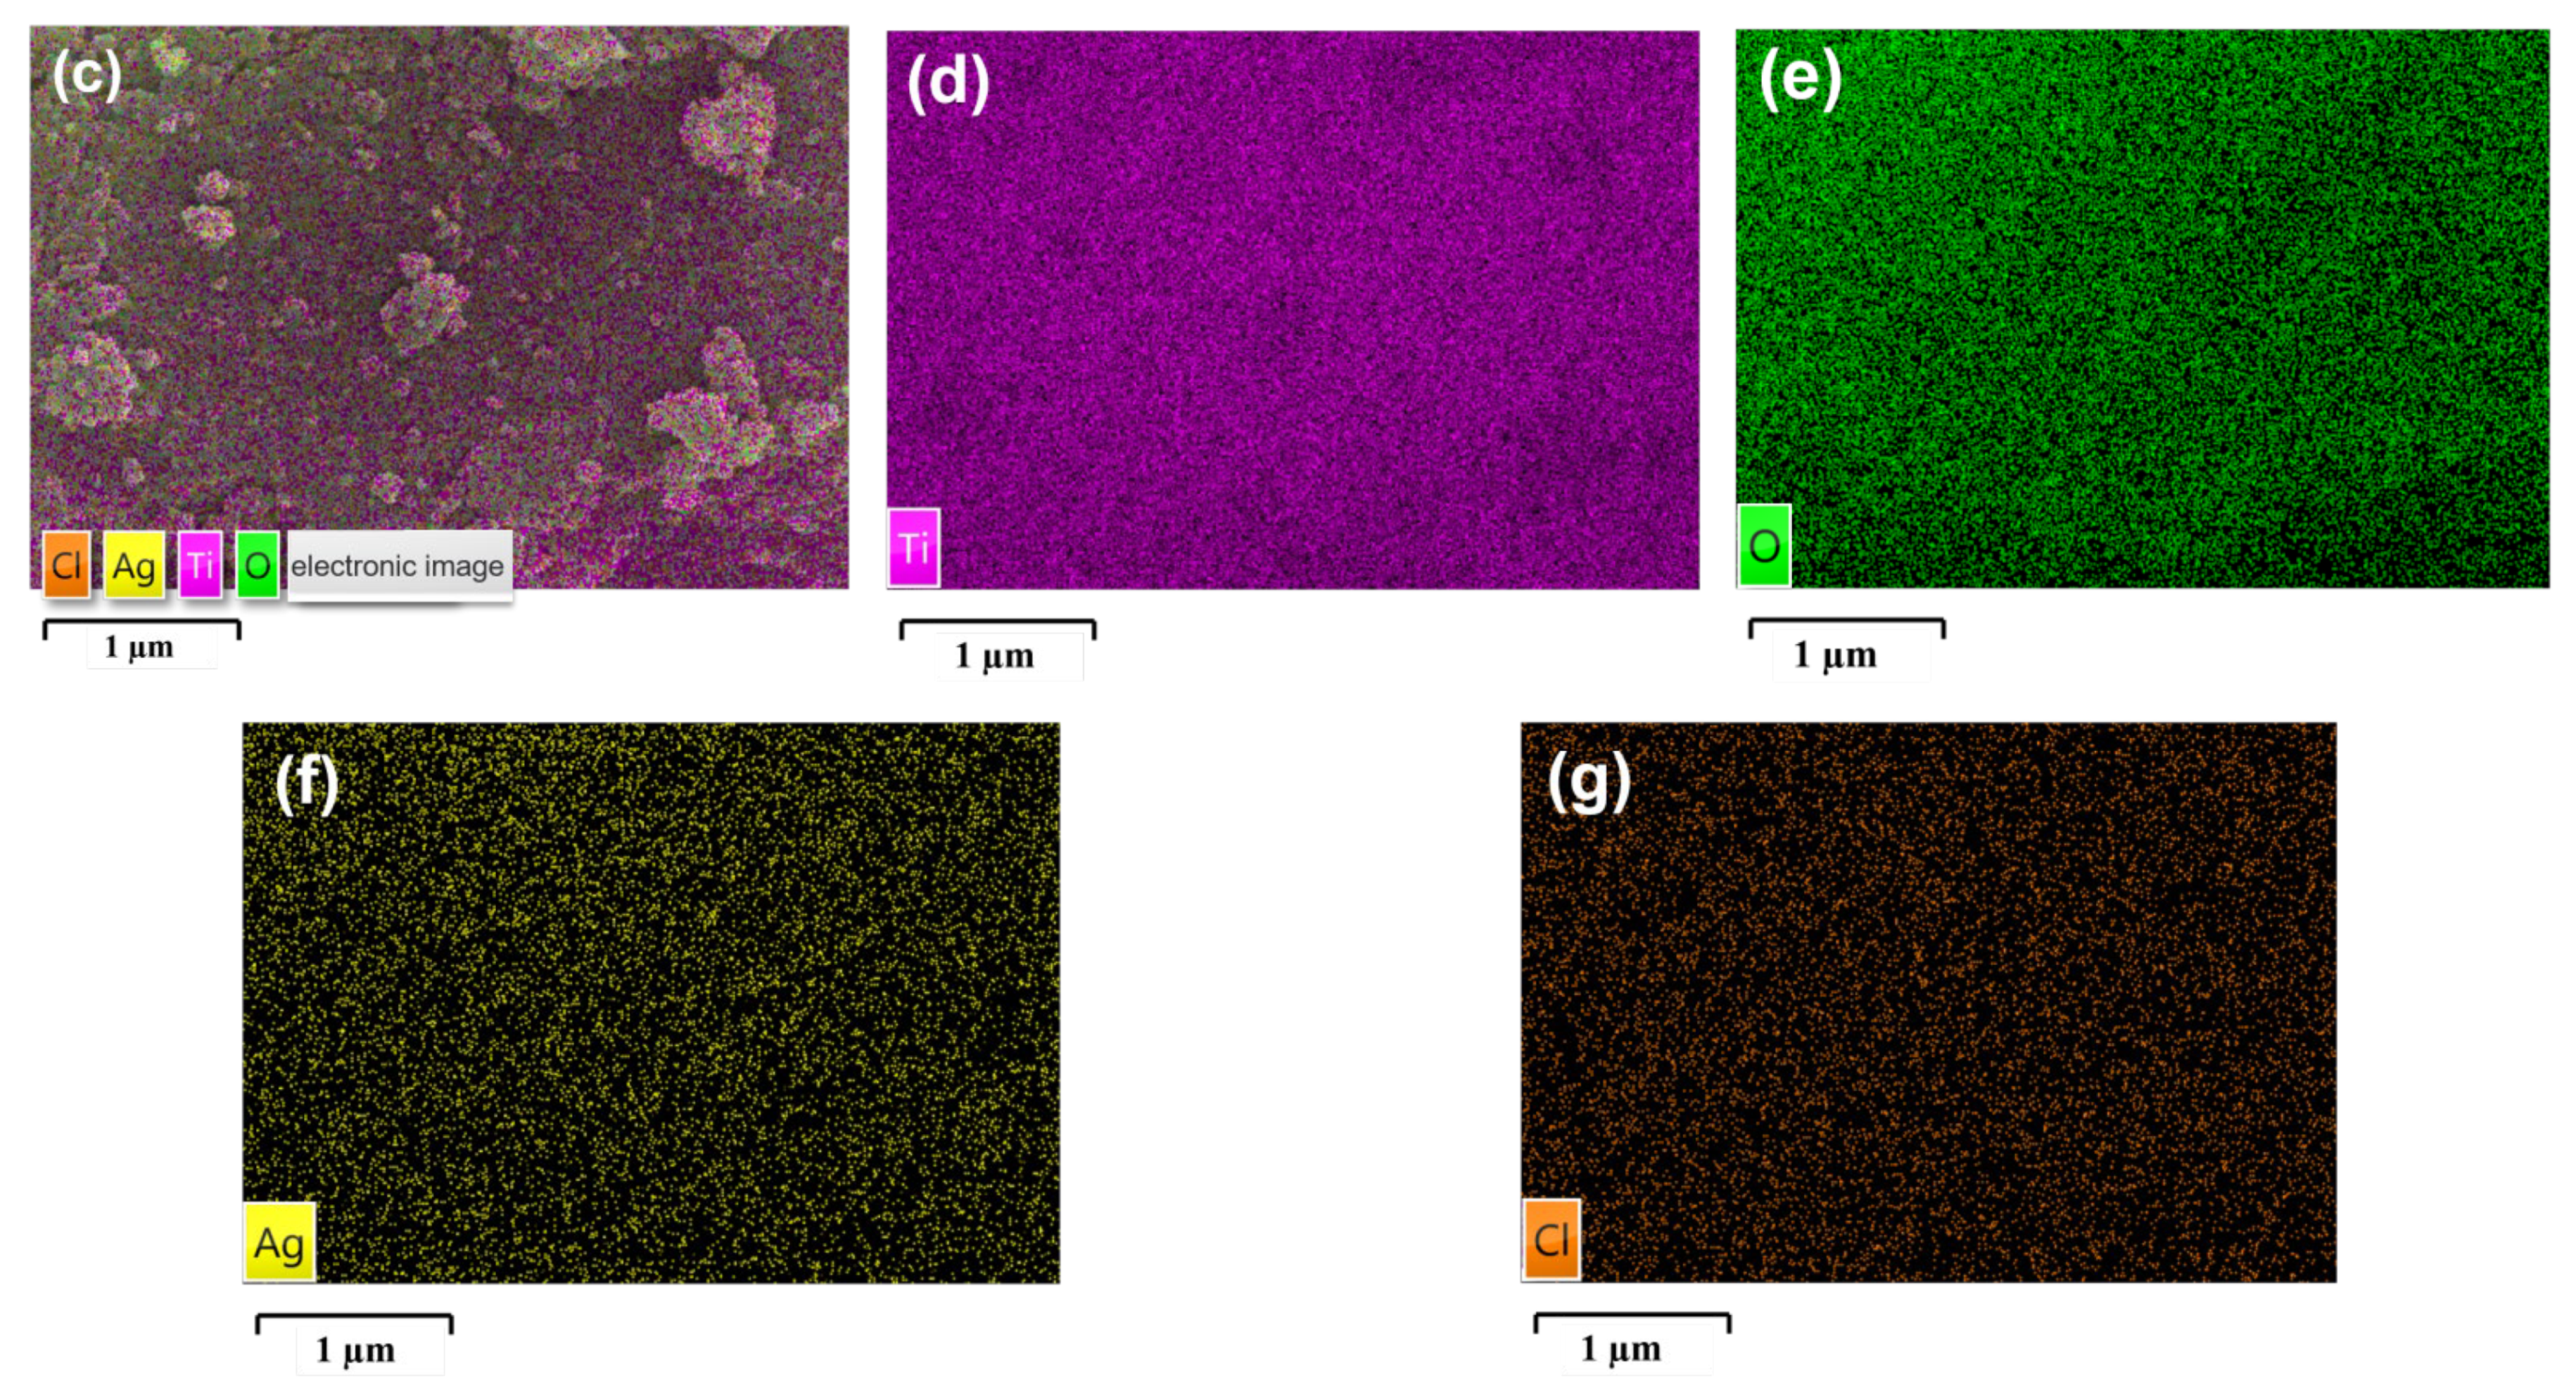
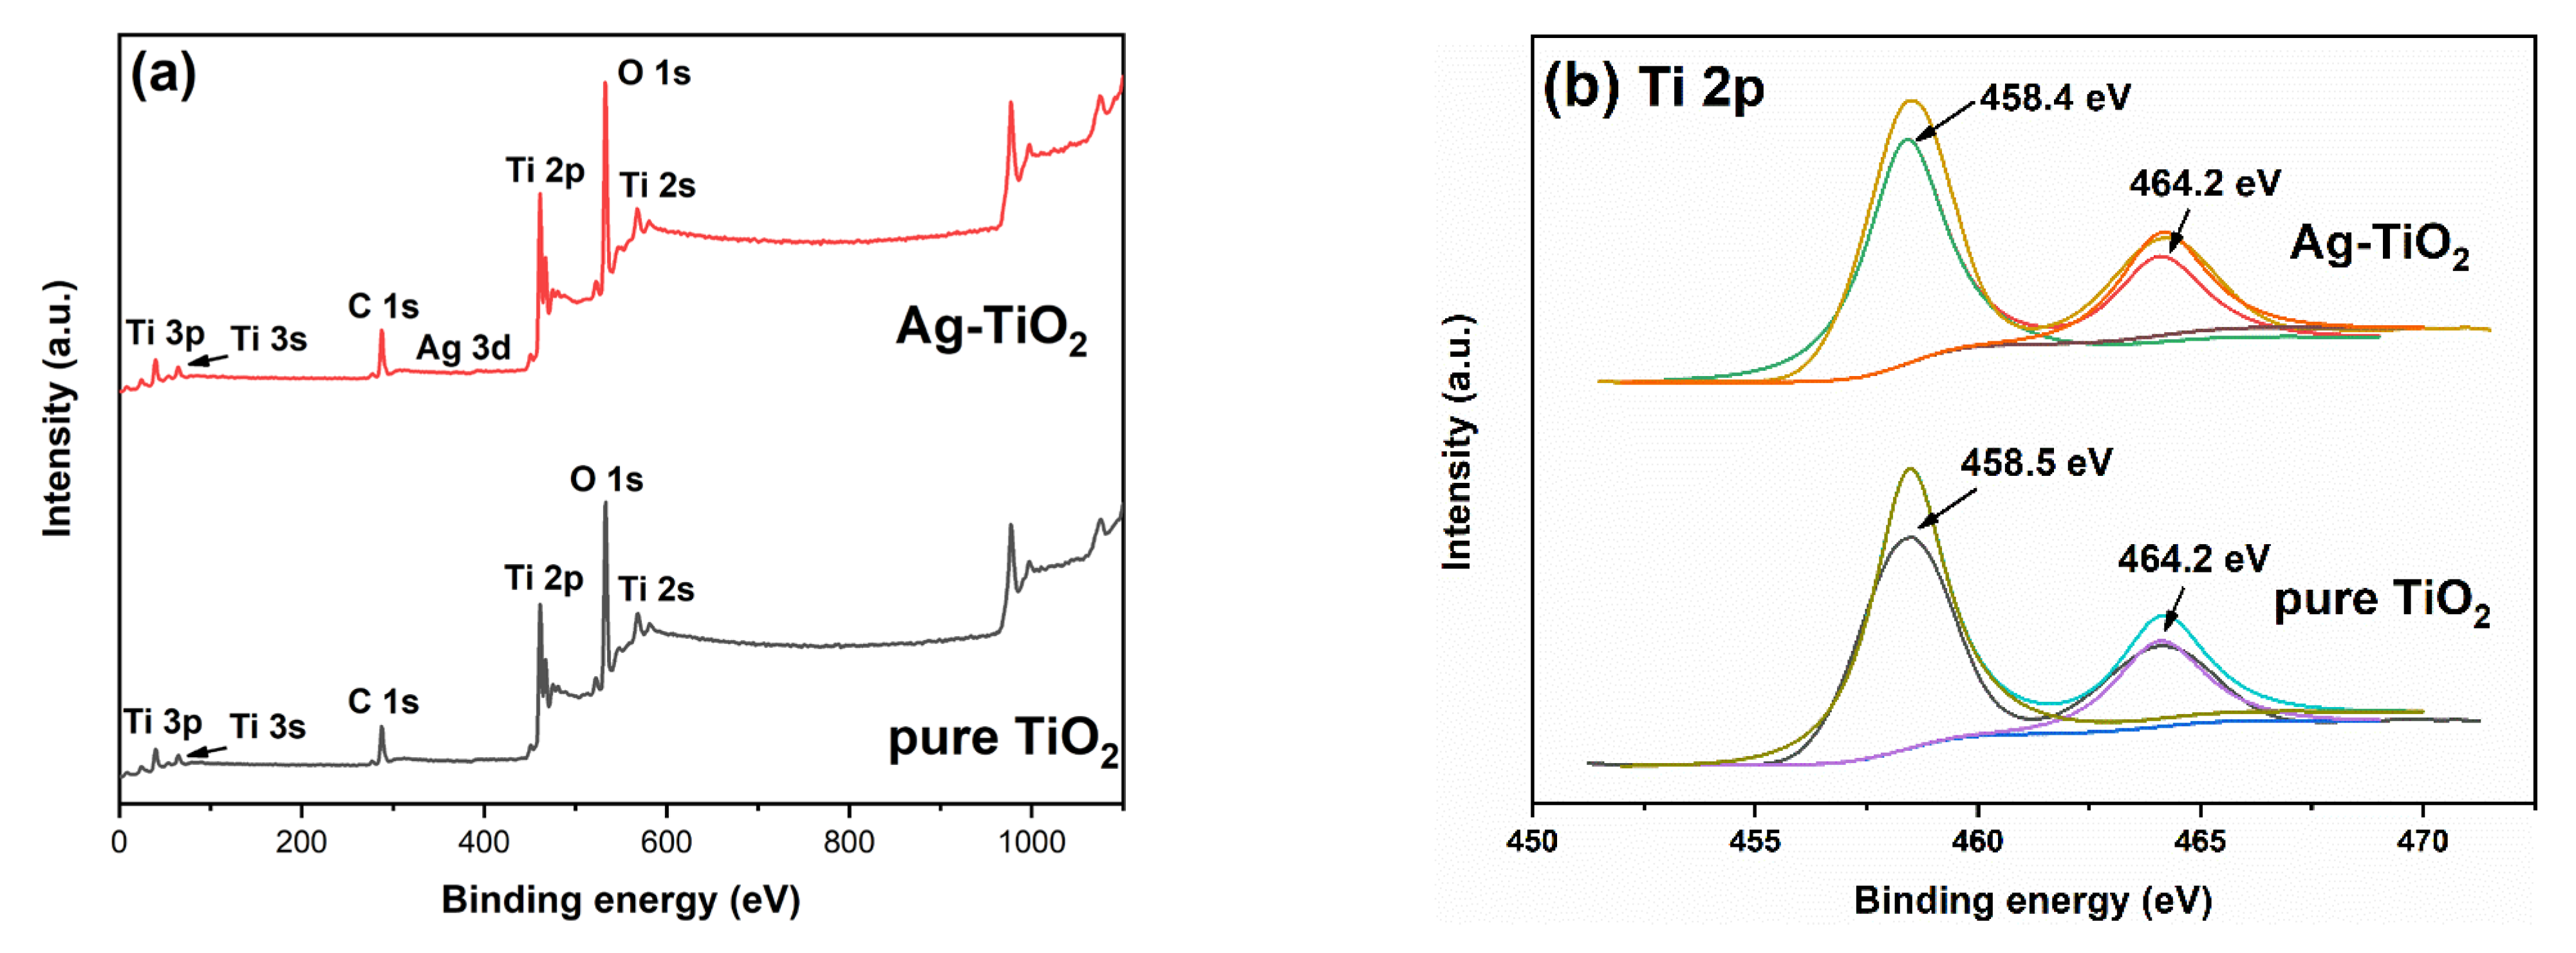
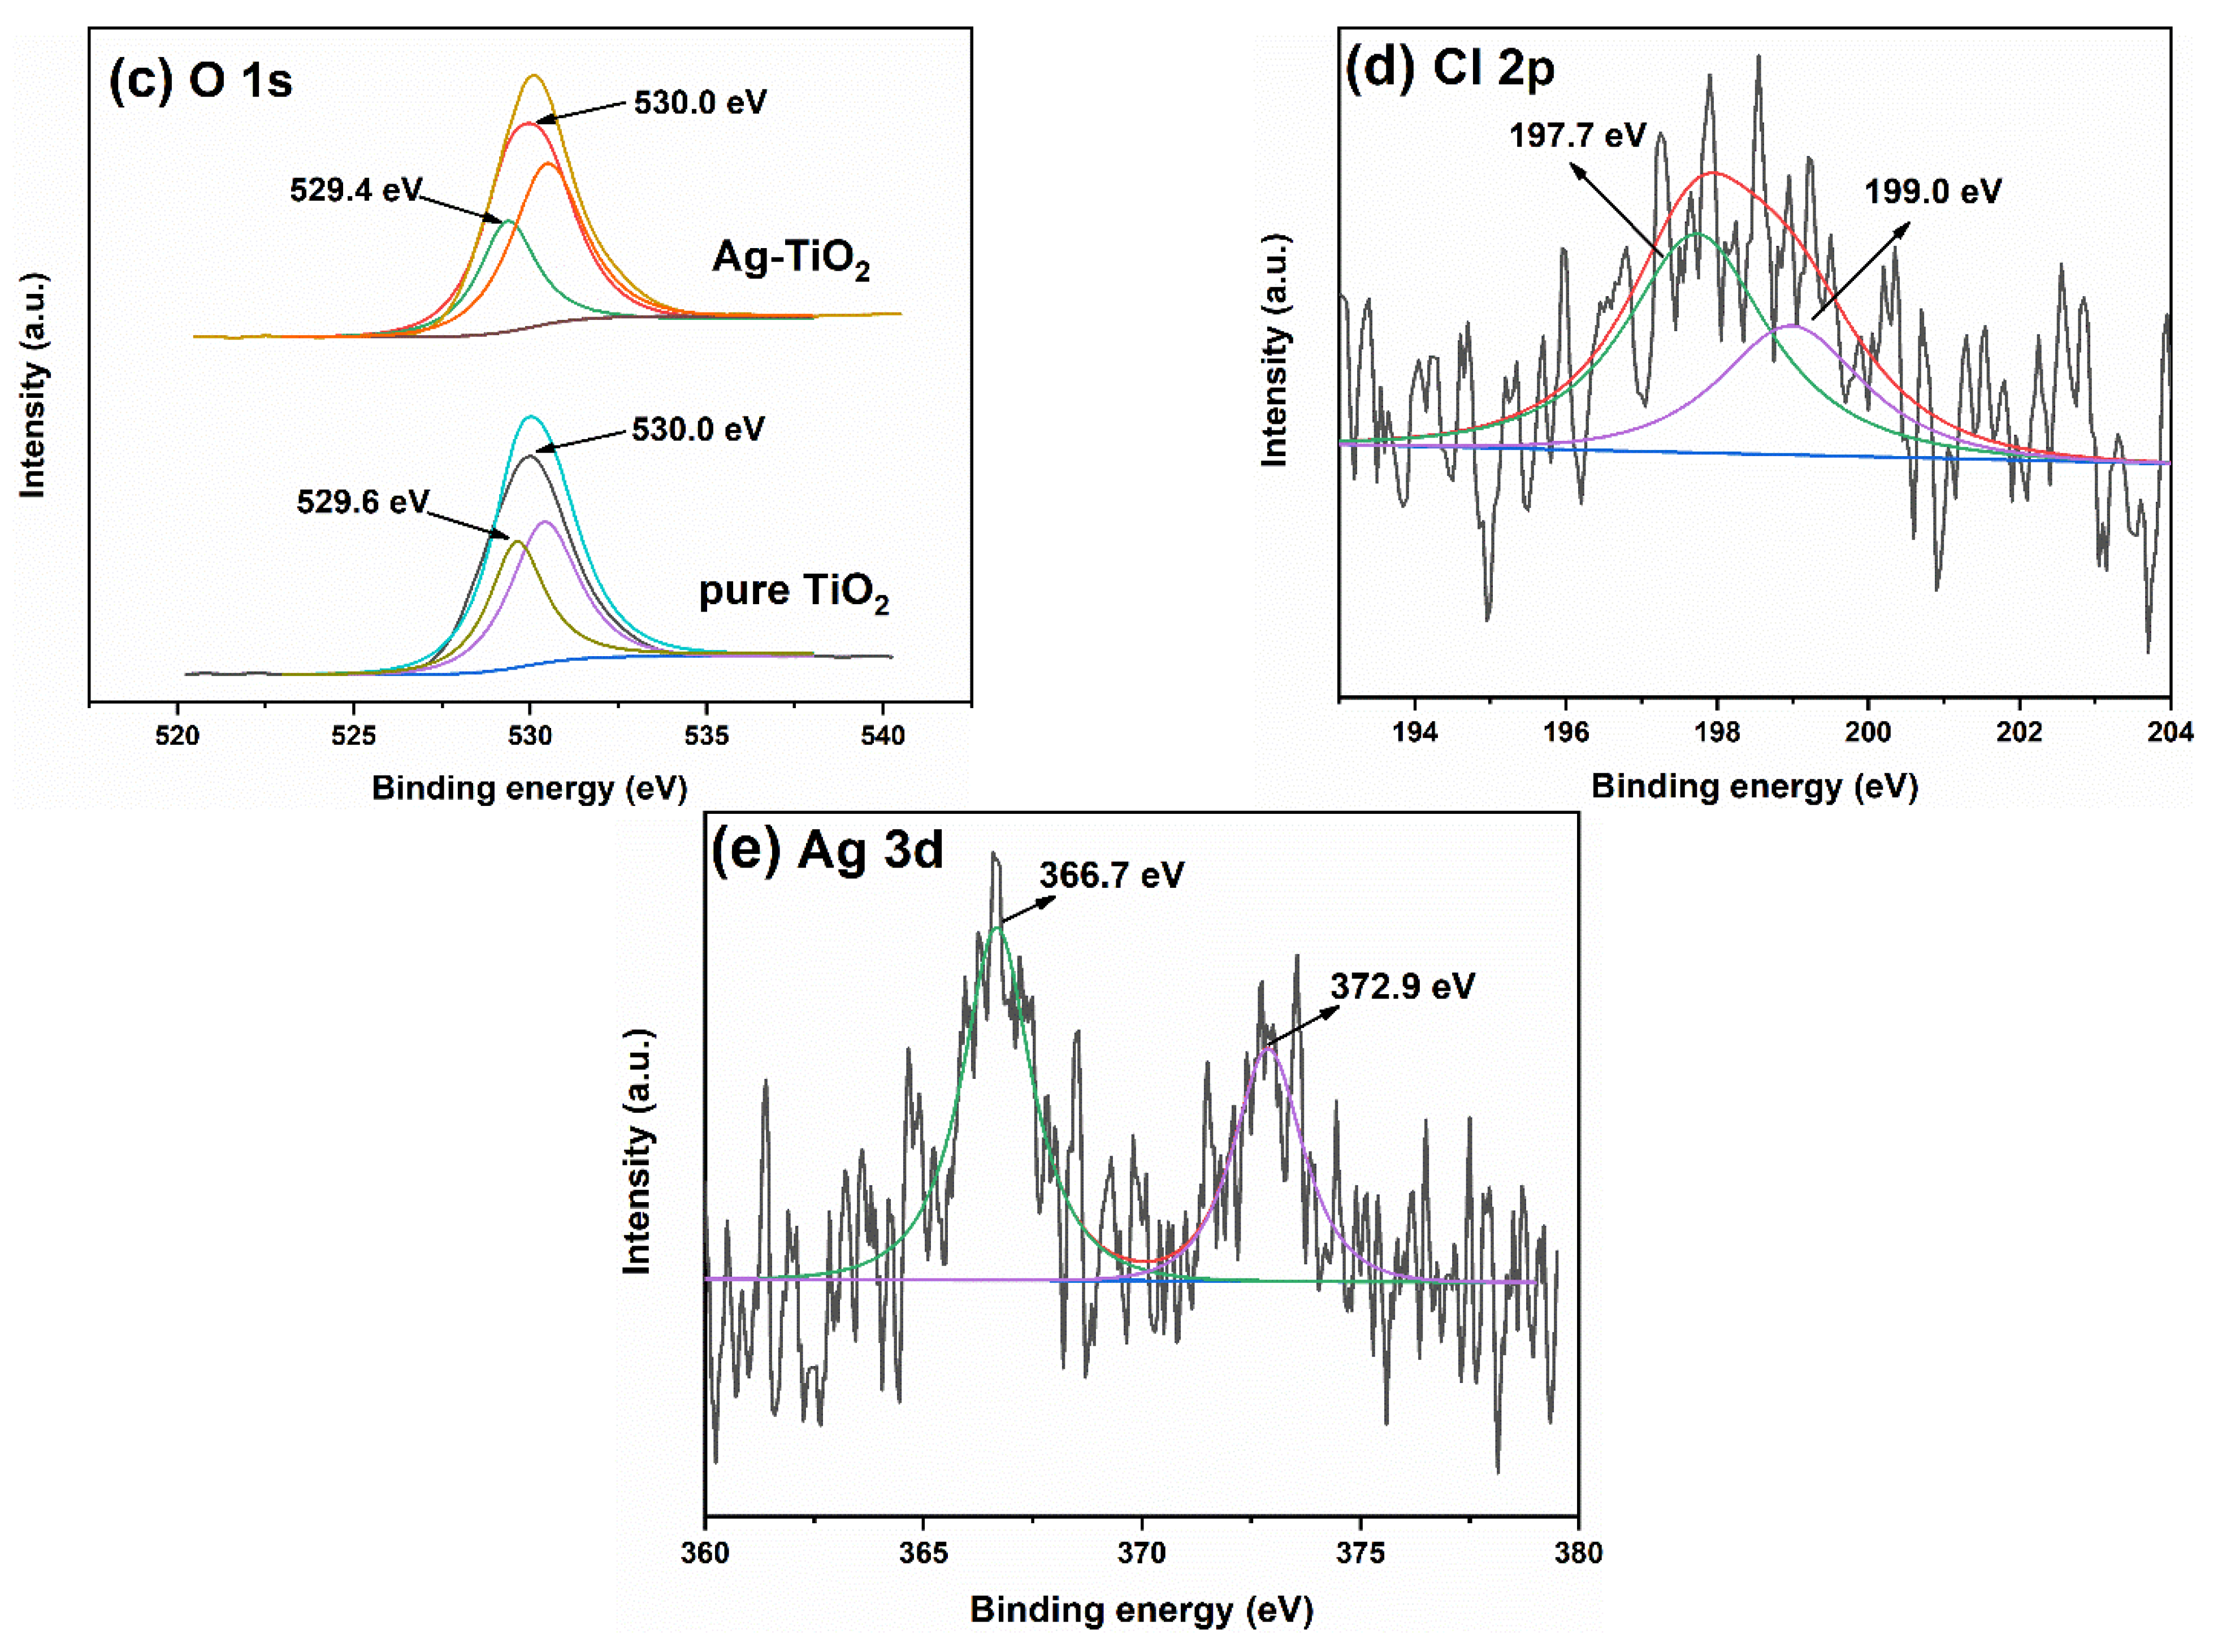
3.3. Element Composition
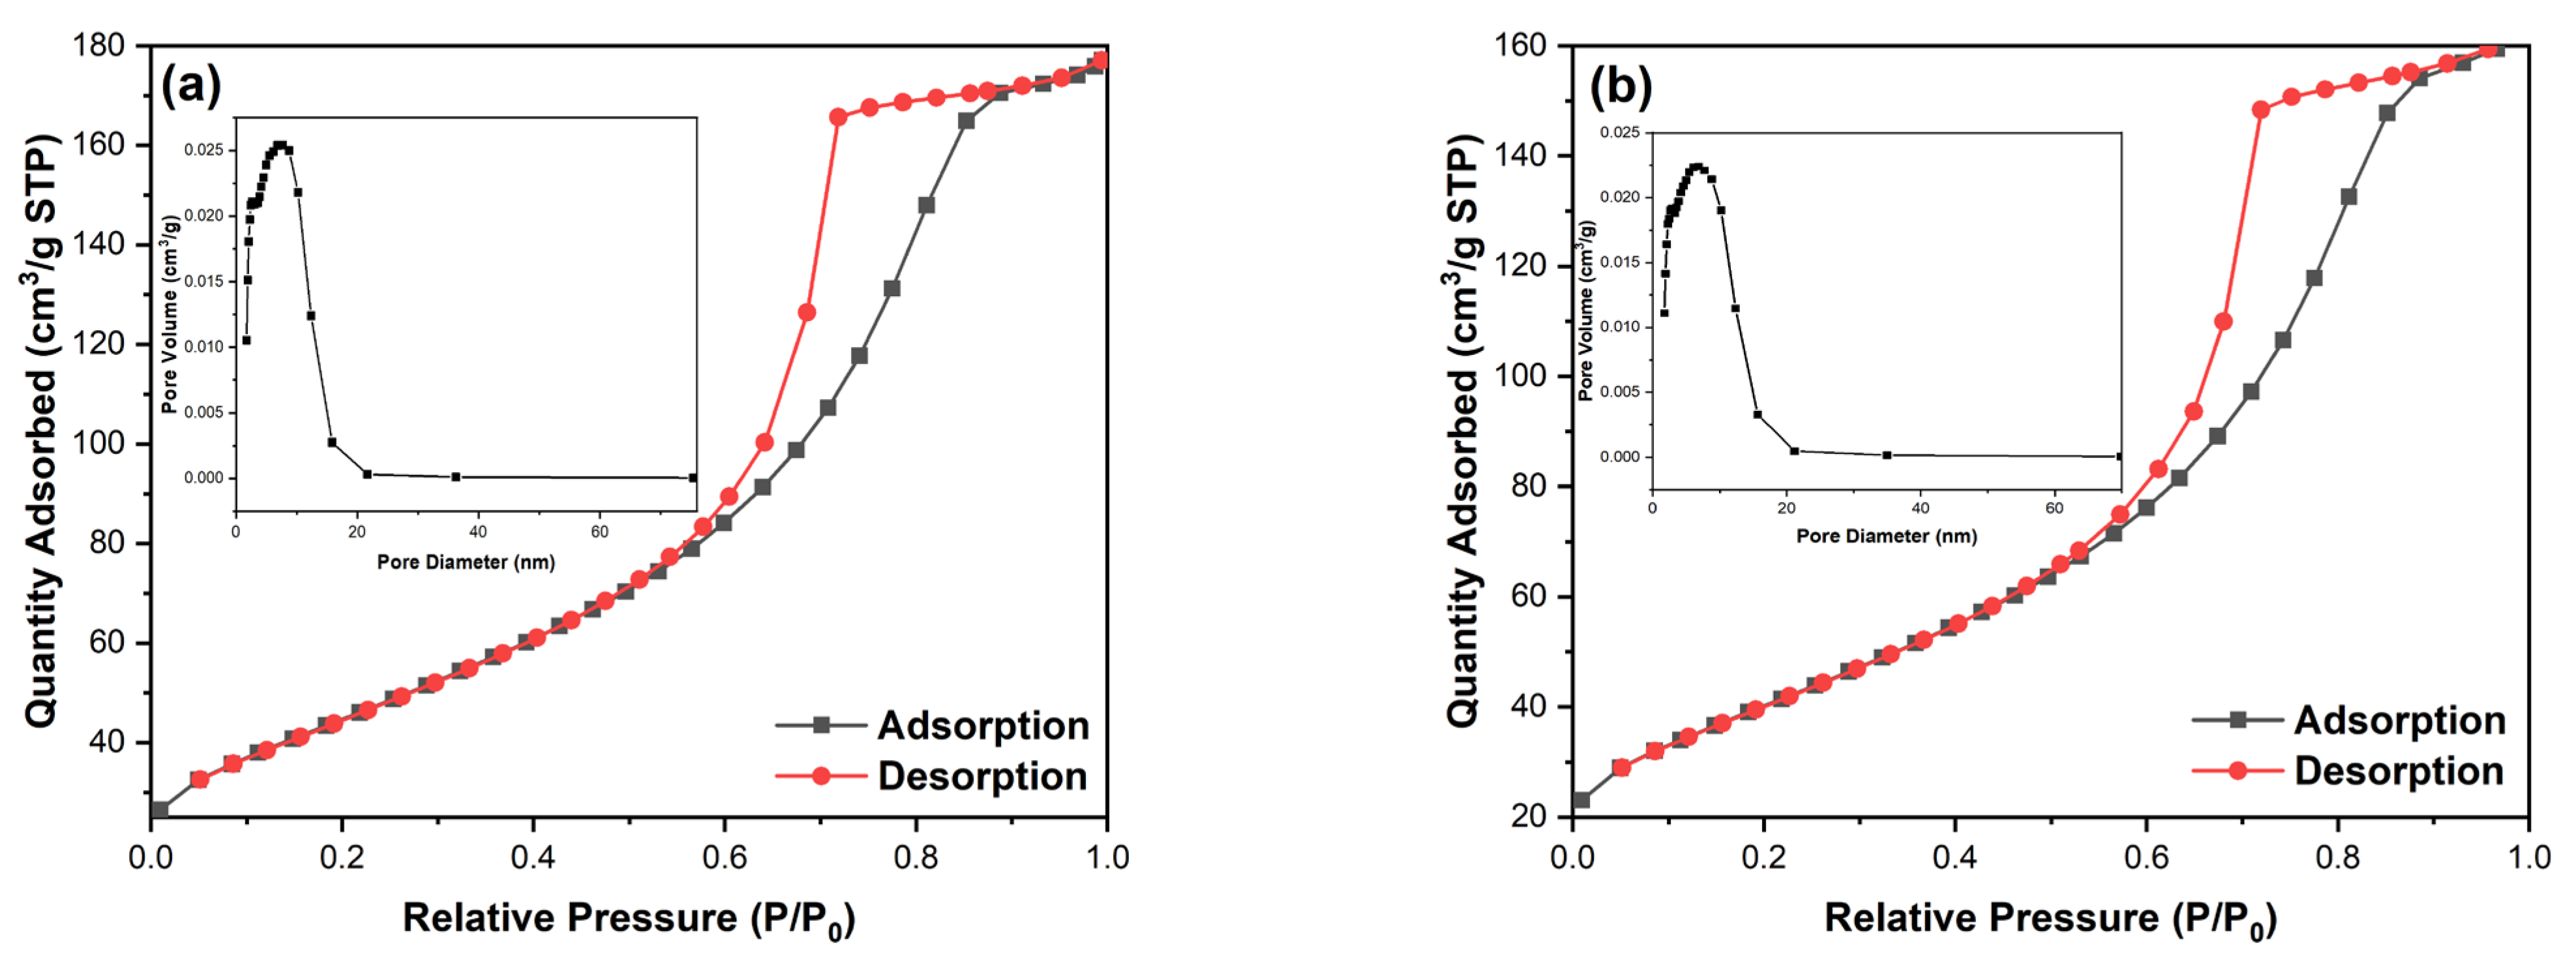
3.4. Surface Area
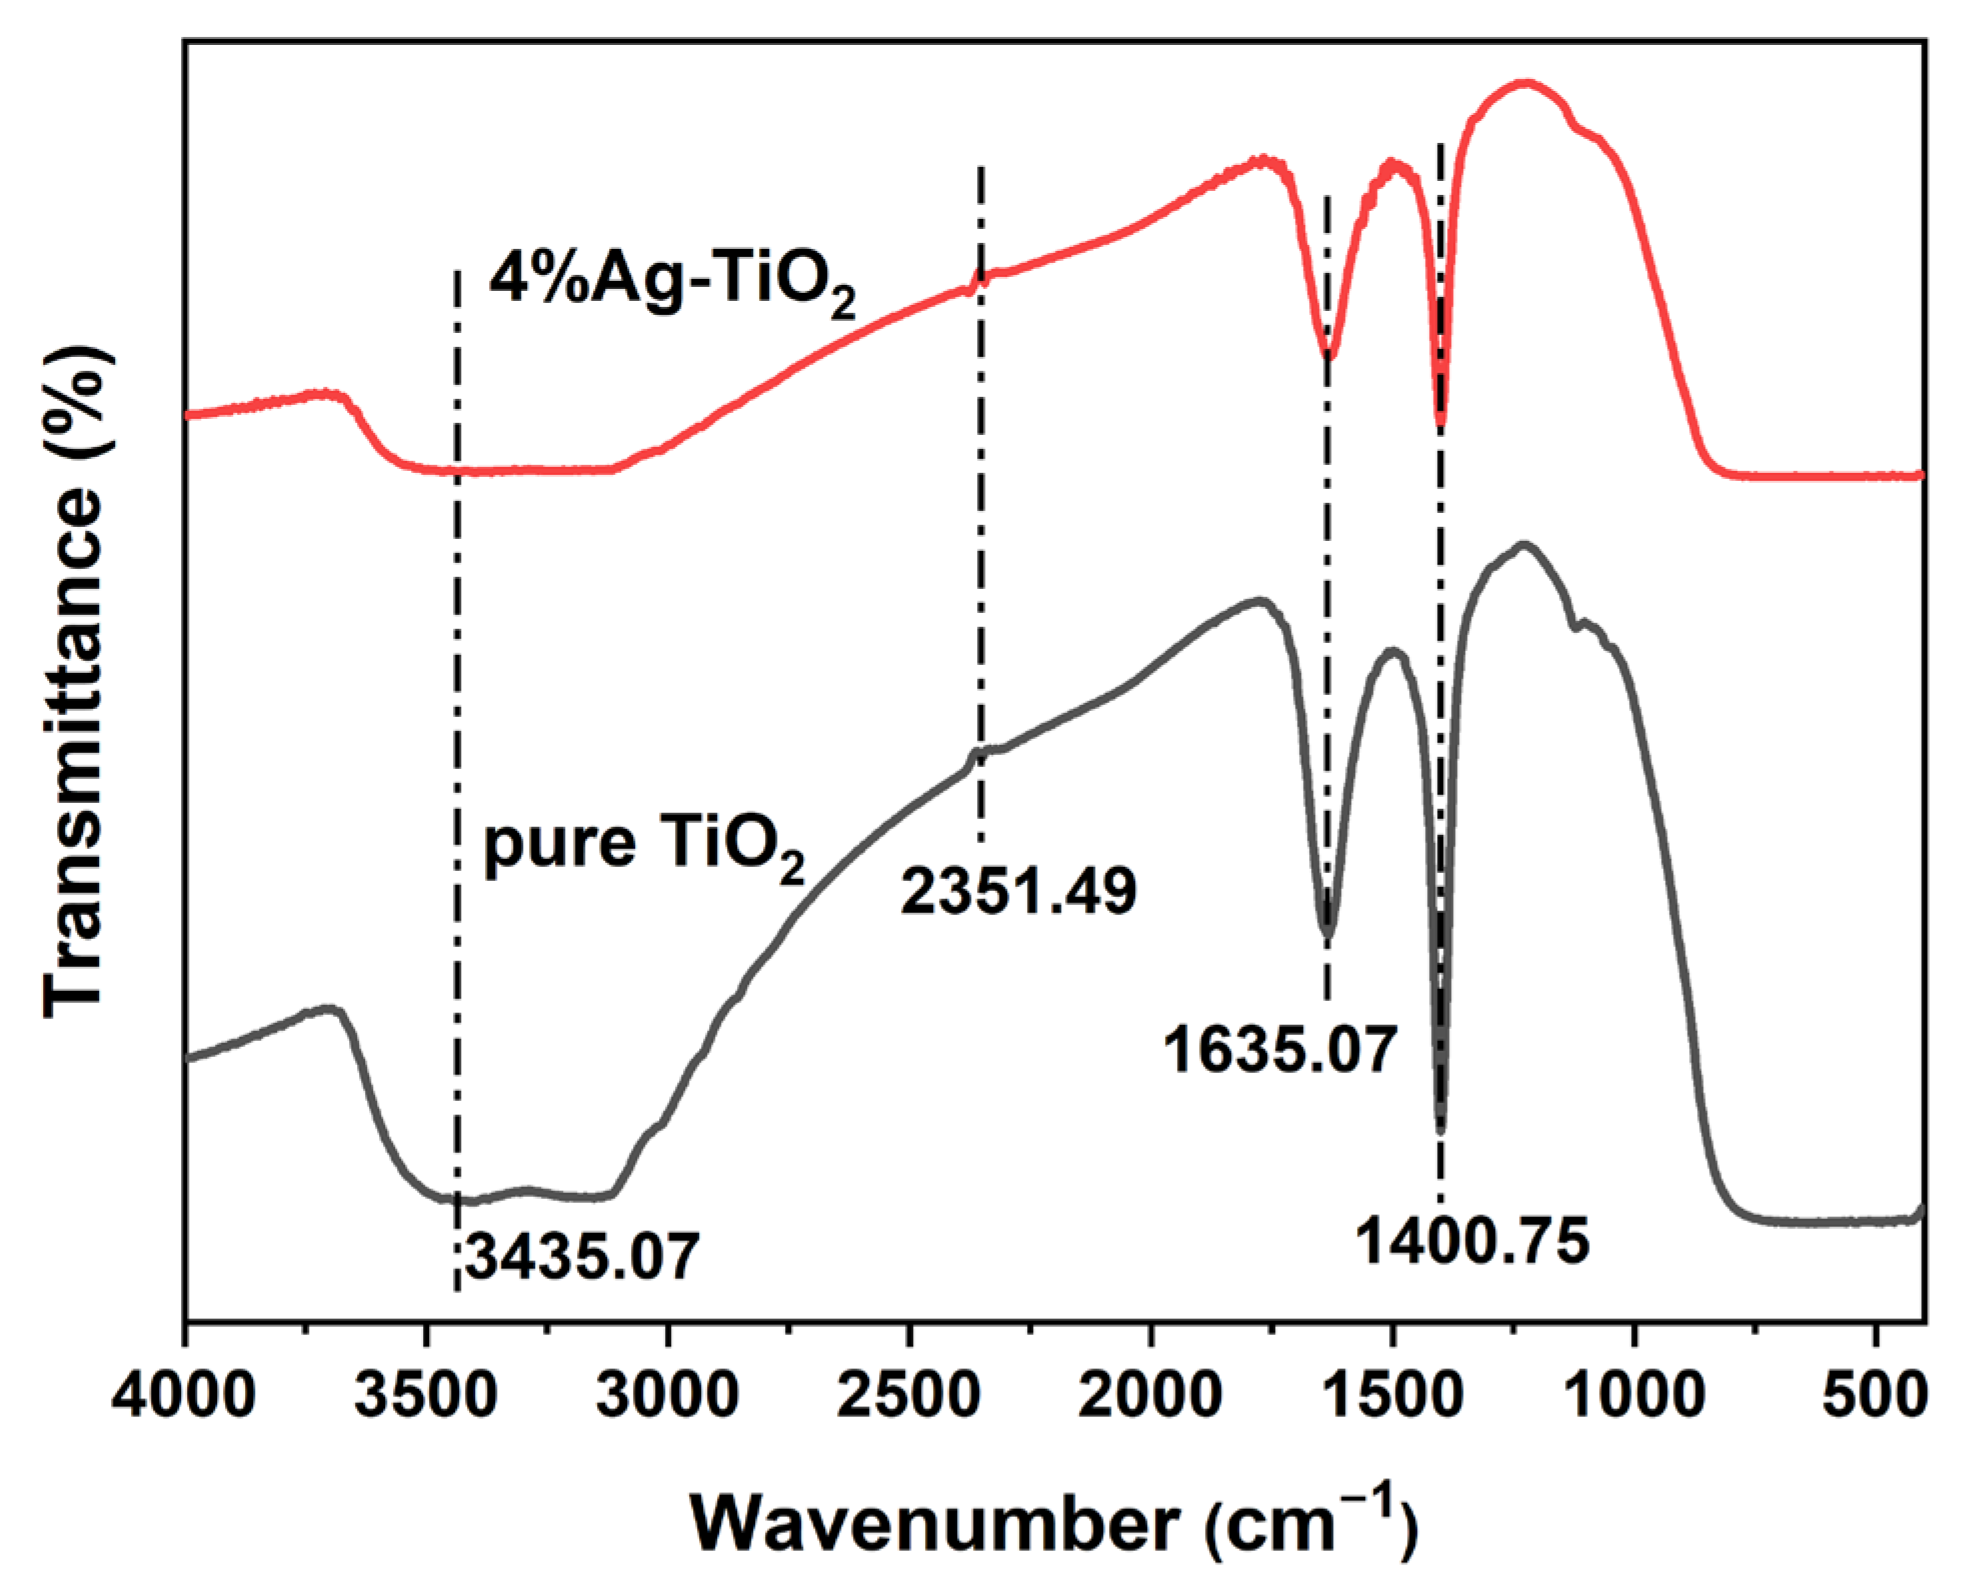
3.5. FTIR Analysis
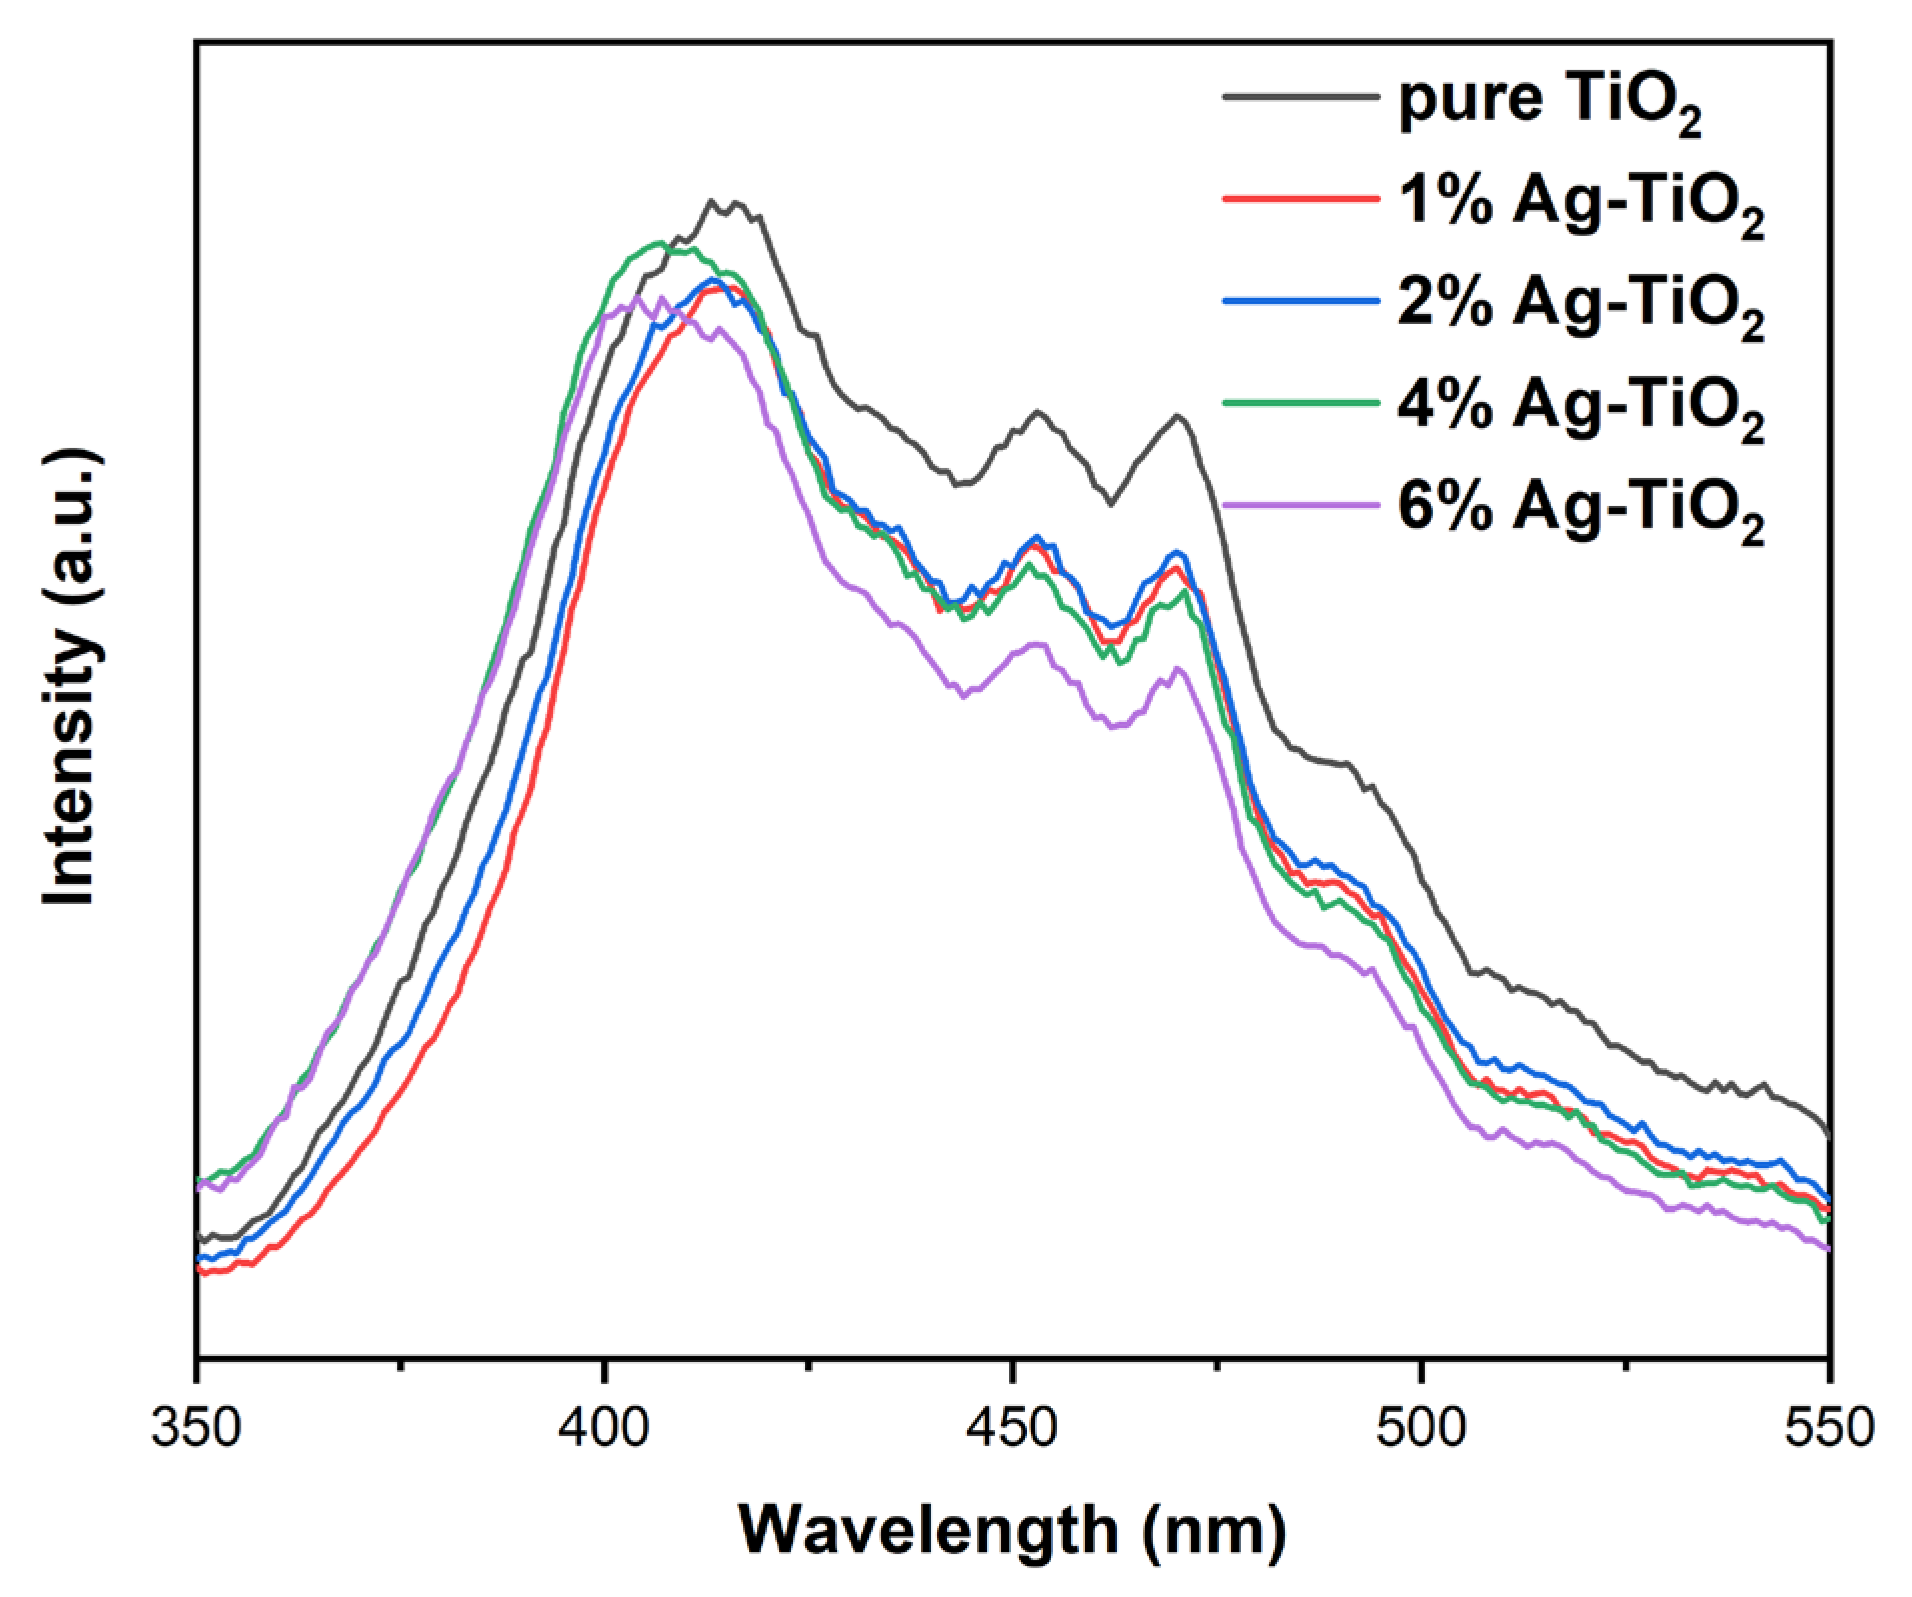
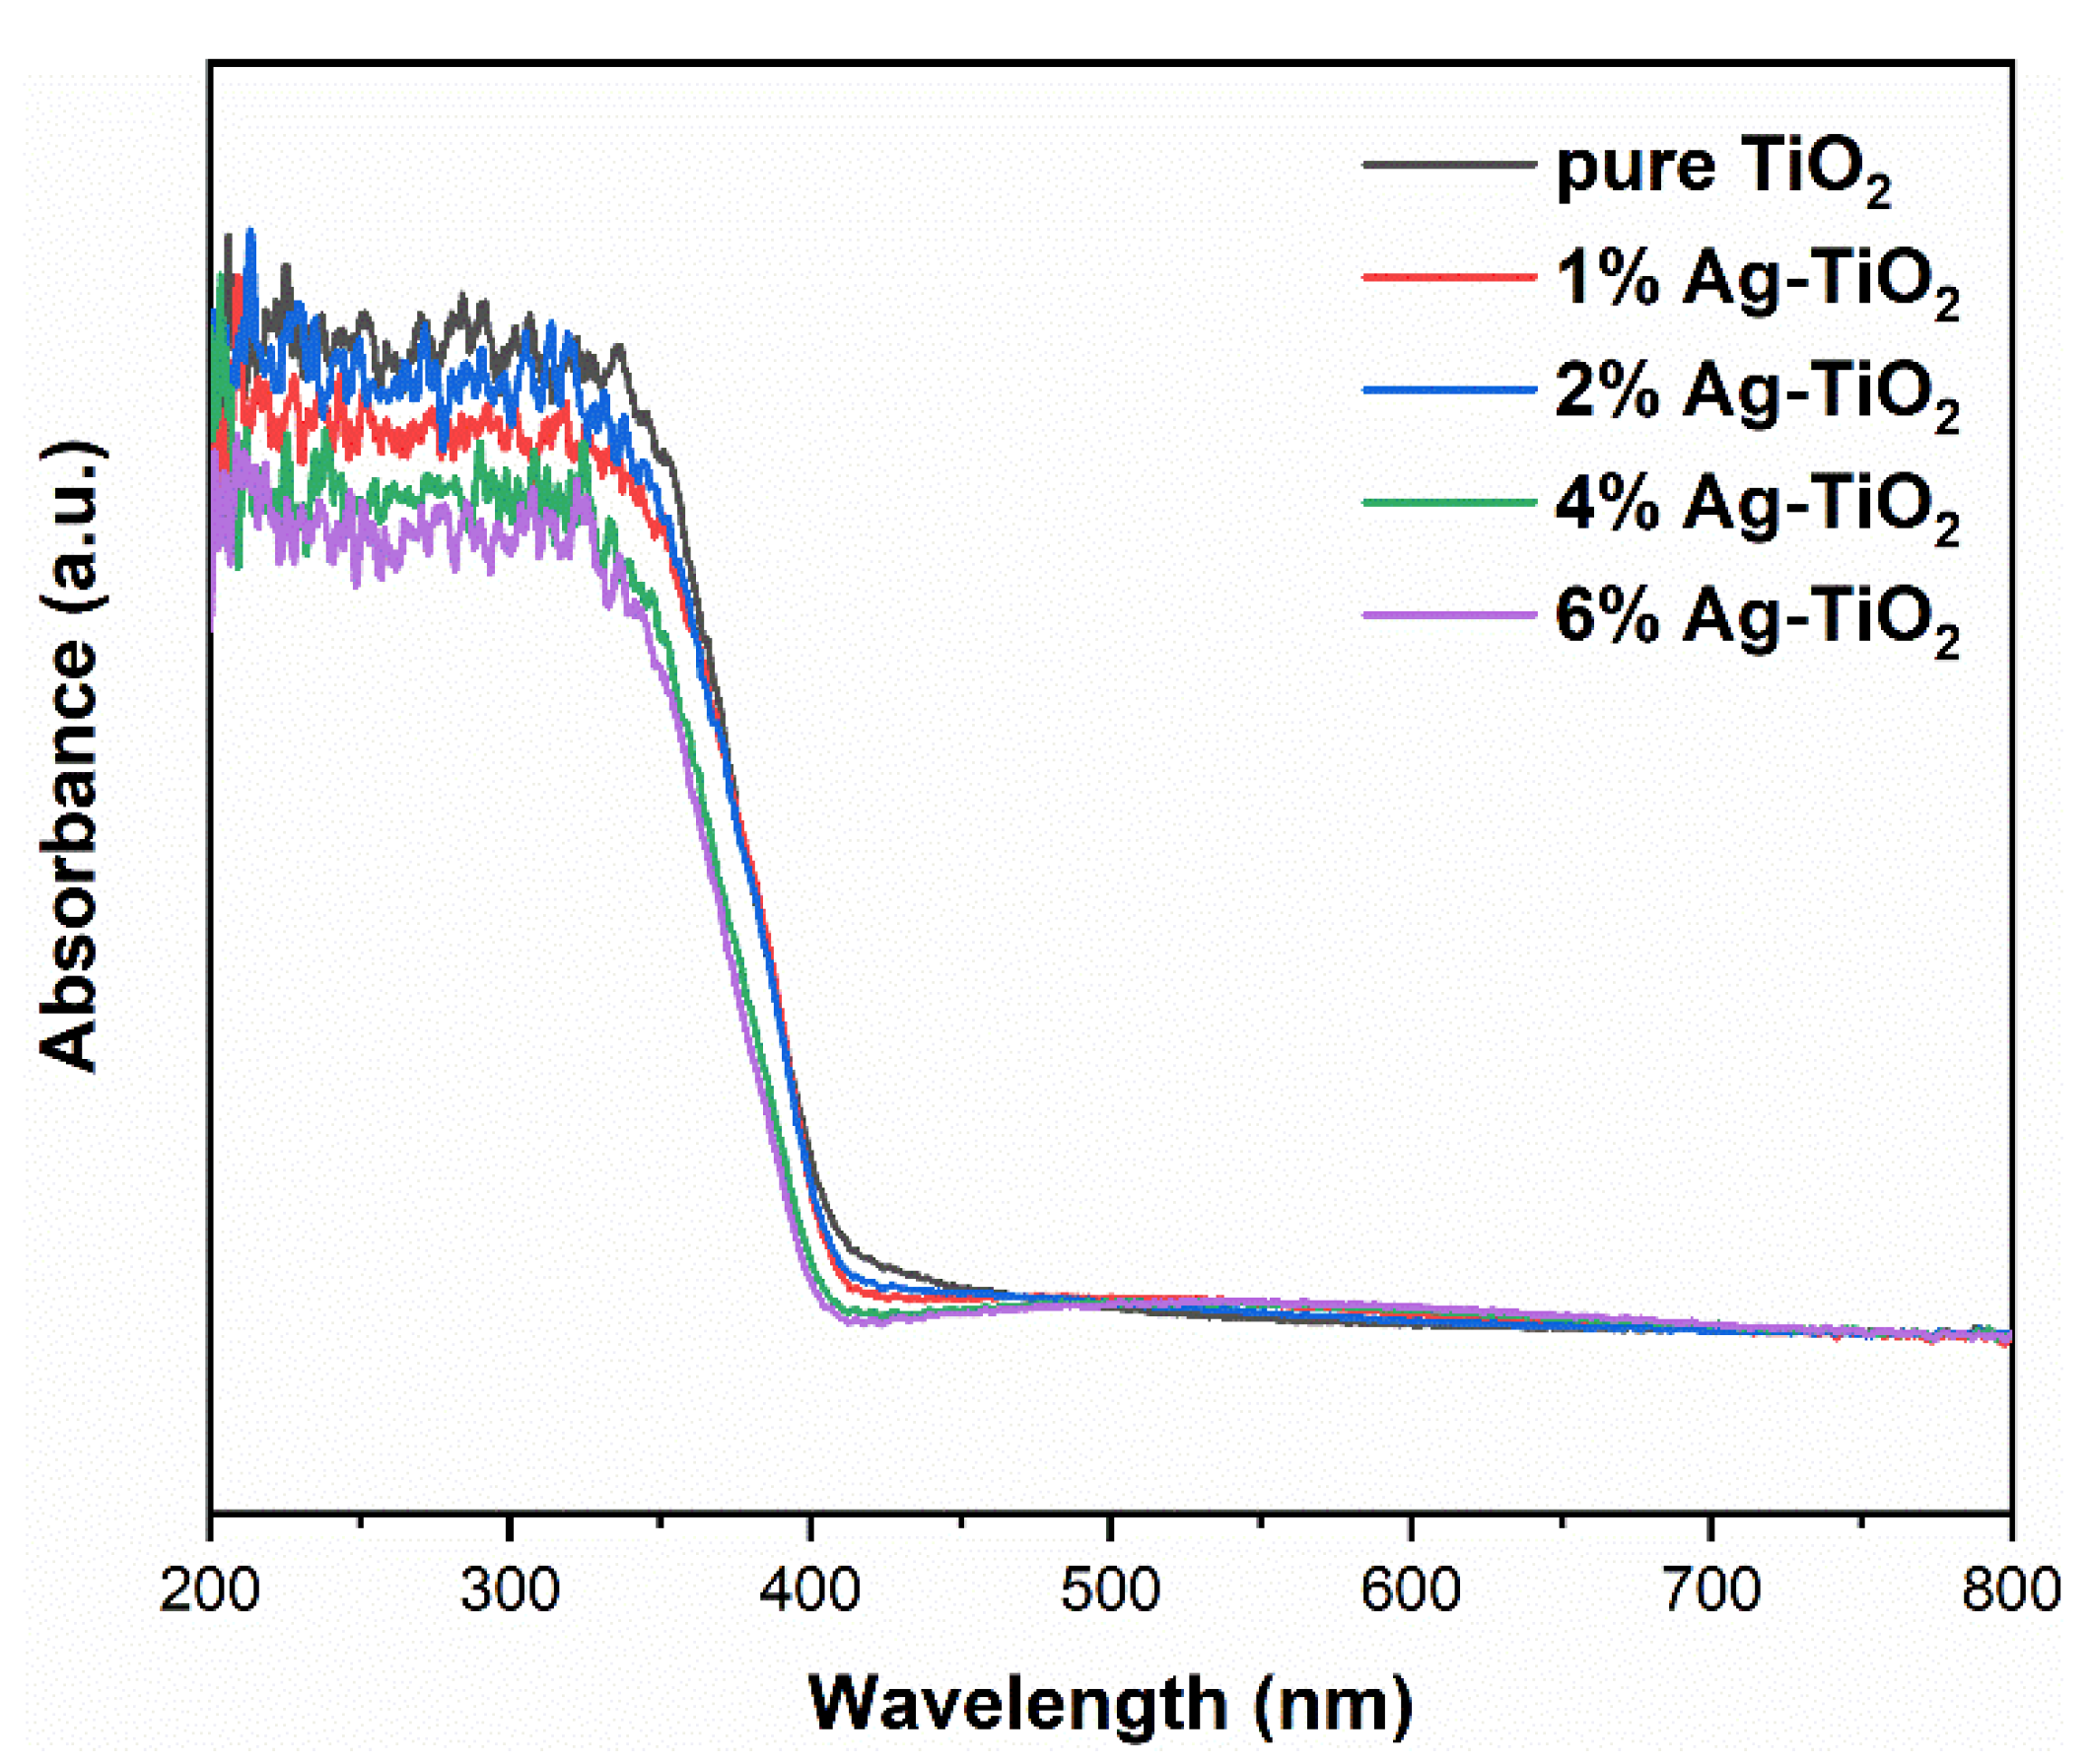
3.6. Optical Property
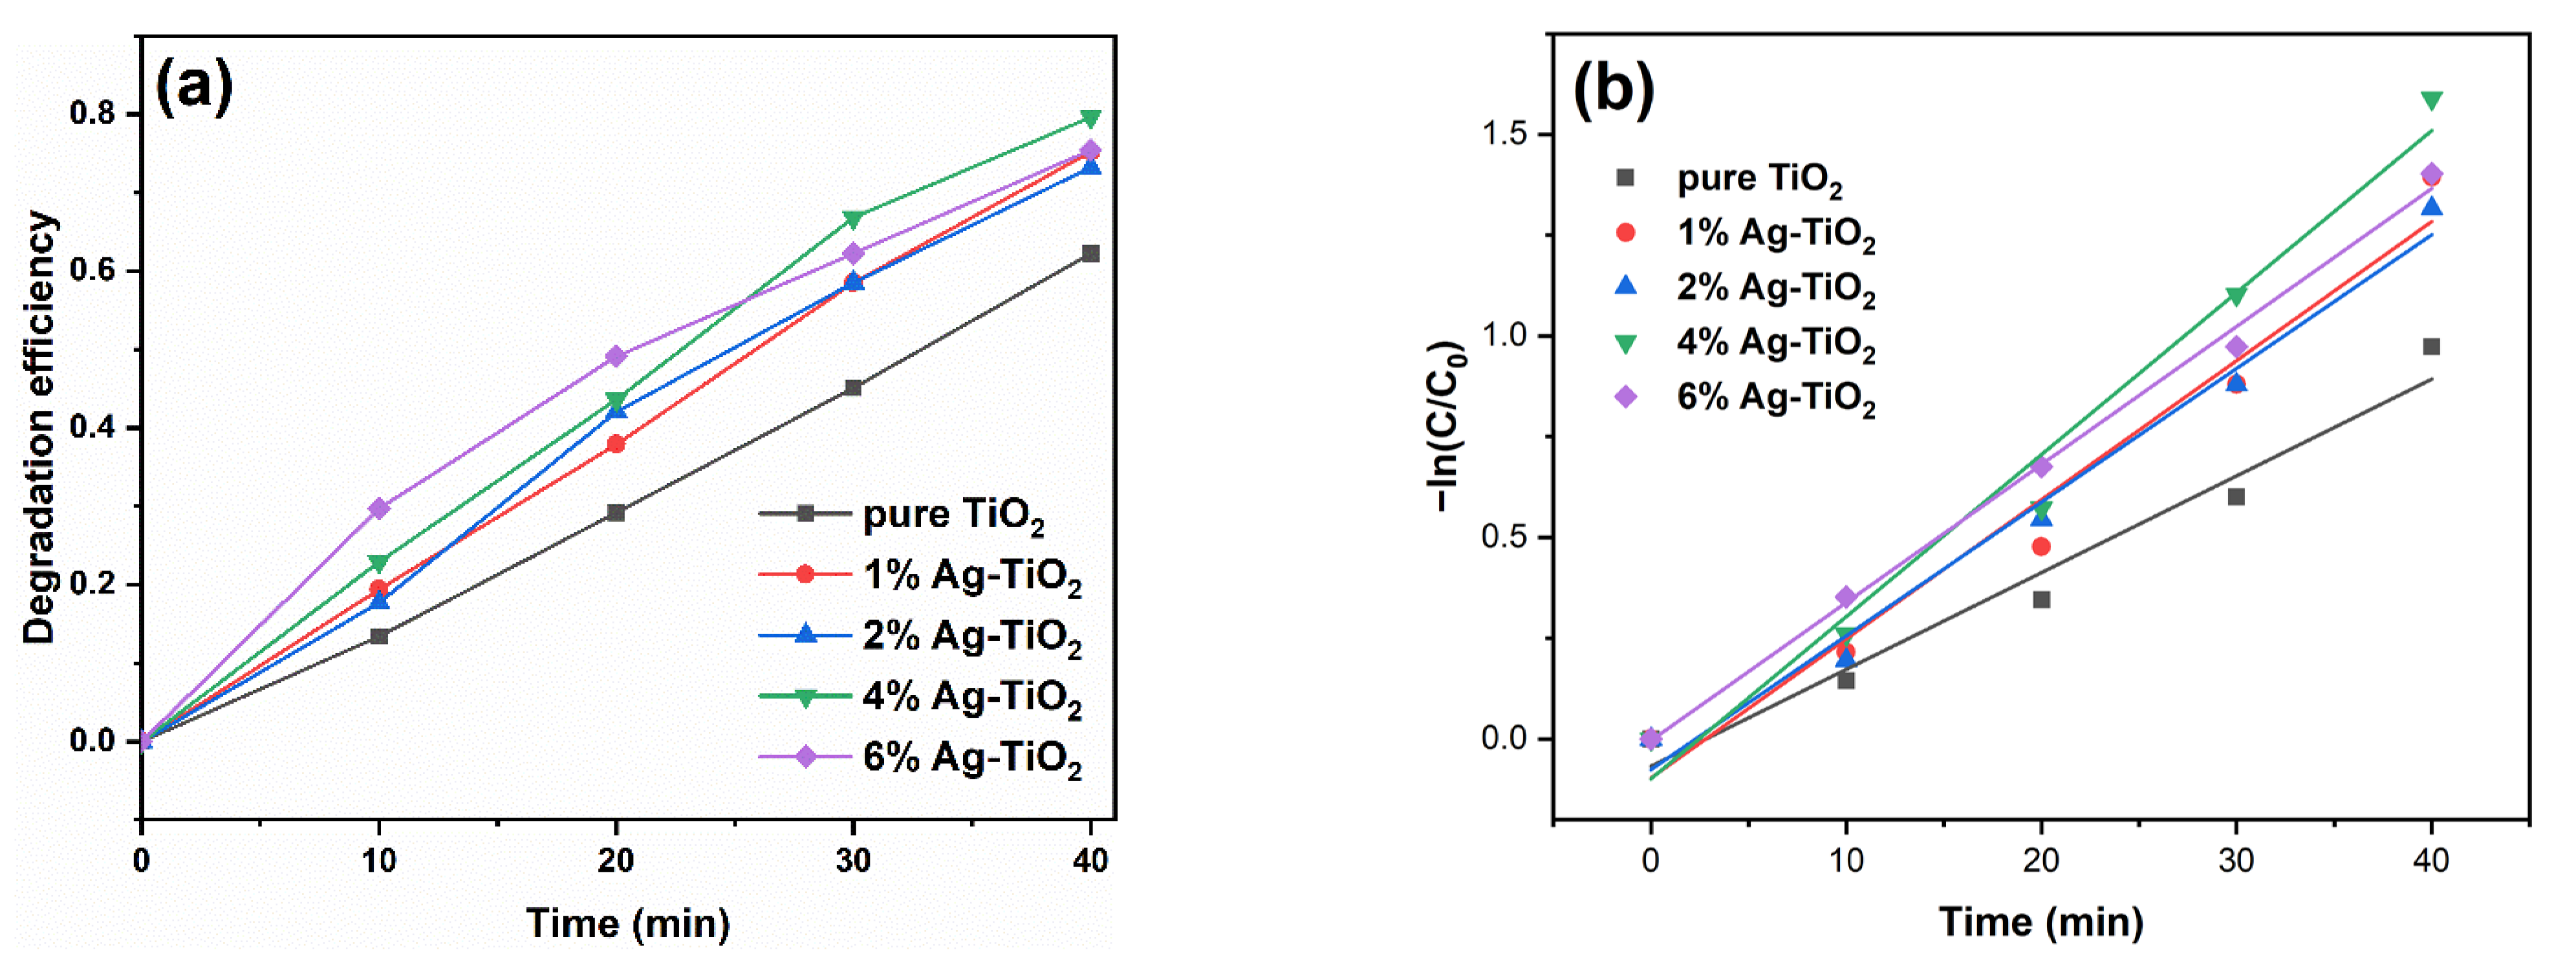
3.7. Photocatalytic Activity
4. Conclusions
Author Contributions
Funding
Institutional Review Board Statement
Informed Consent Statement
Data Availability Statement
Conflicts of Interest
References
- Mittal, D.; Chen, W.F.; Koshy, P.; Chen, H.K.; Kabir, I.; Jiang, Y.; Liu, Z.Y.; Sorrell, C.C. Intervalence charge transfer and thermodynamic effects on the photocatalytic performance of Fe/Mo single and codoped TiO2 thin films. SN Appl. Sci. 2019, 1, 234. [Google Scholar] [CrossRef] [Green Version]
- Zhu, X.D.; Liu, H.; Wang, J.; Dai, H.L.; Bai, Y.; Feng, W.; Han, S.H. The investigation of photocatalytic activity of Ag-rutile heterojunctions. Micro Nano Lett. 2020, 15, 1130–1133. [Google Scholar] [CrossRef]
- Serga, V.; Burve, R.; Krumina, A.; Romanova, M.; Kotomin, E.A.; Popov, A.I. Extraction-Pyrolytic Method for TiO2 Polymorphs Production. Crystals 2021, 11, 431. [Google Scholar] [CrossRef]
- Sun, Y.; Gao, Y.; Zhao, B.S.; Xu, S.; Luo, C.H.; Zhao, Q. One-step hydrothermal preparation and characterization of ZnO-TiO2 nanocomposites for photocatalytic activity. Mater. Res. Express 2020, 7, 085010. [Google Scholar] [CrossRef]
- Zhu, X.D.; Pei, L.X.; Zhu, R.R.; Jiao, Y.; Tang, R.Y.; Feng, W. Preparation and characterization of Sn/La co-doped TiO2 nanomaterials and their phase transformation and photocatalytic activity. Sci. Rep. 2018, 8, 12387. [Google Scholar] [CrossRef] [Green Version]
- Wu, D.; Li, C.; Zhang, D.S.; Wang, L.L.; Zhang, X.P.; Shi, Z.F.; Lin, Q. Photocatalytic improvement of Y3+ modified TiO2 prepared by a ball milling method and application in shrimp wastewater treatment. RSC Adv. 2019, 9, 14609. [Google Scholar] [CrossRef] [Green Version]
- Barrocas, B.; Monteiro, O.C.; NunesInfuence, M.R.; Silvestre, A.J. Influence of Re and Ru doping on the structural, optical and photocatalytic properties of nanocrystalline TiO2. SN Appl. Sci. 2019, 1, 566. [Google Scholar] [CrossRef] [Green Version]
- Chen, C.H.; Peng, Y.P.; Lin, M.H.; Chang, K.L.; Lin, Y.C.; Sun, J. Iron modified titanate nanotube arrays for photoelectrochemical removal of E. coli. Nanomaterials 2021, 11, 1944. [Google Scholar] [CrossRef]
- Sun, X.; Yan, X.; Su, H.; Sun, L.; Zhao, L.; Shi, J.; Wang, Z.; Niu, J.; Qian, H.; Duan, E. Non-Stacked γ-Fe2O3/C@TiO2 Double-Layer Hollow Nanoparticles for Enhanced Photocatalytic Applications under Visible Light. Nanomaterials 2022, 12, 201. [Google Scholar] [CrossRef]
- Zhu, X.D.; Zhu, R.R.; Pei, L.X.; Liu, H.; Xu, L.; Wang, J.; Feng, W.; Jiao, Y.; Zhang, W.M. Fabrication, characterization, and photocatalytic activity of anatase/rutile/SnO2 nanocomposites. J. Mater. Sci. Mater. Electron. 2019, 30, 21210–21218. [Google Scholar] [CrossRef]
- Singh, J.; Manna, A.K.; Soni, R.K. Bifunctional Au-TiO2 thin films with enhanced photocatalytic activity and SERS based multiplexed detection of organic pollutant. J. Mater. Sci. Mater. Electron. 2019, 30, 16478–16493. [Google Scholar] [CrossRef]
- Yang, X.J.; Wu, X.L.; Li, J.; Liu, Y. TiO2-Au composite nanofibers for photocatalytic hydrogen evolution. RSC Adv. 2019, 9, 29097–29104. [Google Scholar] [CrossRef] [Green Version]
- Yang, Z.L.; Lu, J.; Ye, W.C.; Yu, C.S.; Chang, Y.L. Preparation of Pt/TiO2 hollow nanofibers with highly visible light photocatalytic activity. Appl. Surf. Sci. 2017, 392, 472–480. [Google Scholar] [CrossRef]
- Sun, Y.; Gao, Y.; Zeng, J.Y.; Guo, J.; Wang, H. Enhancing visible-light photocatalytic activity of Ag-TiO2 nanowire composites by one-step hydrothermal process. Mater. Lett. 2020, 279, 128506. [Google Scholar] [CrossRef]
- Lei, X.F.; Xue, X.X.; Yang, H. Preparation and characterization of Ag-doped TiO2 nanomaterials and their photocatalytic reduction of Cr(VI) under visible light. Appl. Surf. Sci. 2014, 321, 396–403. [Google Scholar] [CrossRef]
- Gao, D.D.; Liu, W.J.; Xu, Y.; Wang, P.; Fan, J.J.; Yu, H.G. Core-shell Ag@Ni cocatalyst on the TiO2 photocatalyst: One-step photoinduced deposition and its improved H2-evolution activity. Appl. Catal. B-Environ. 2020, 260, 118190. [Google Scholar] [CrossRef]
- Ali, T.; Ahmed, A.; Alam, U.; Uddin, I.; Tripathi, P.; Muneer, M. Enhanced photocatalytic and antibacterial activities of Ag-doped TiO2 nanoparticles under visible light. Mater. Chem. Phys. 2018, 212, 325–335. [Google Scholar] [CrossRef]
- Zhu, X.D.; Xu, H.Y.; Yao, Y.; Liu, H.; Wang, J.; Pu, Y.; Feng, W.; Chen, S.H. Effects of Ag0-modification and Fe3+-doping on the structural, optical and photocatalytic properties of TiO2. RSC Adv. 2019, 9, 40003–40012. [Google Scholar] [CrossRef] [Green Version]
- Zhang, C.L.; Hua, H.; Liu, J.L.; Han, X.Y.; Liu, Q.P.; Wei, Z.D.; Shao, C.B.; Hu, C.G. Enhanced photocatalytic activity of nanoparticle-aggregated Ag-AgX(X = Cl, Br)@TiO2 microspheres under visible light. Nano-Micro Lett. 2017, 9, 49. [Google Scholar] [CrossRef] [Green Version]
- Jing, Z.H.; Liu, X.; Du, Y.; He, Y.C.; Yan, T.J.; Wang, W.L.; Li, W.J. Synthesis, characterization, antibacterial and photocatalytic performance of Ag/AgI/TiO2 hollow sphere composites. Front. Mater. Sci. 2020, 14, 1–13. [Google Scholar] [CrossRef]
- Yu, X.; Huang, J.L.; Zhao, J.J.; Liu, S.F.; Xiang, D.D.; Tang, Y.T.; Li, J.; Guo, Q.H.; Ma, X.Q.; Zhao, J.W. Efficient visible light photocatalytic antibiotic elimination performance induced by nanostructured Ag/AgCl@Ti3+-TiO2 mesocrystals. Chem. Eng. J. 2021, 403, 126359. [Google Scholar] [CrossRef]
- Ghasemi, Z.; Abdi, V.; Sourinejad, I. Green fabrication of Ag/AgCl@TiO2 superior plasmonic nanocomposite: Biosynthesis, characterization and photocatalytic activity under sunlight. J. Alloys Compd. 2020, 841, 155593. [Google Scholar] [CrossRef]
- Ibrahim, A.; Mekprasart, W.; Pecharapa, W. Anatase/Rutile TiO2 composite prepared via sonochemical process and their photocatalytic activity. Mater. Today Proc. 2017, 4, 6159–6165. [Google Scholar] [CrossRef]
- Likodimos, V.; Chrysi, A.; Calamiotou, M.; Rodríguez, C.F.; Rodríguez, J.M.D.; Dionysiou, D.D.; Falaras, P. Microstructure and charge trapping assessment in highly reactive mixed phase TiO2 photocatalysts. Appl. Catal. B-Environ. 2016, 192, 242–252. [Google Scholar] [CrossRef]
- Qin, Y.Y.; Wang, X.Y.; Qiu, P.Y.; Tian, J. Enhanced photocatalytic antibacterial properties of TiO2 nanospheres with Rutile/Anatase heterophase junctions and the archival paper protection application. Nanomaterials 2021, 11, 2585. [Google Scholar] [CrossRef] [PubMed]
- Liu, R.D.; Li, H.; Duan, L.B.; Shen, H.; Zhang, Q.; Zhao, X.R. Influences of annealing atmosphere on phase transition temperature, optical properties and photocatalytic activities of TiO2 phase-junction microspheres. J. Alloys Compd. 2019, 789, 1015–1021. [Google Scholar] [CrossRef]
- Elsellami, L.; Dappozze, F.; Fessi, N.; Houas, A.; Guillard, C. Highly photocatalytic activity of nanocrystalline TiO2 (anatase, rutile) powders prepared from TiCl4 by sol-gel method in aqueous solutions. Process Saf. Environ. 2018, 113, 109–121. [Google Scholar] [CrossRef]
- Zhu, X.D.; Zhou, Q.; Xia, Y.W.; Wang, J.; Chen, H.J.; Xu, Q.; Liu, J.W.; Feng, W.; Chen, S.H. Preparation and characterization of Cu-doped TiO2 nanomaterials with anatase/rutile/brookite triphasic structure and their photocatalytic activity. J. Mater. Sci. Mater. Electron. 2021, 32, 21511–21524. [Google Scholar] [CrossRef]
- Mutuma, B.K.; Shao, G.N.; Kim, W.D.; Kim, H.T. Sol-gel synthesis of mesoporous anatase-brookite and anatase-brookite-rutile TiO2 nanoparticles and their photocatalytic properties. J. Colloid Interface Sci. 2015, 442, 1–7. [Google Scholar] [CrossRef]
- Qian, X.; Han, H.R.; Chen, Y.L.; Yuan, Y. Sol-gel solvothermal route to synthesize anatase/brookite/rutile TiO2 nanocomposites with highly photocatalytic activity. J. Sol-Gel Sci. Technol. 2018, 85, 394–401. [Google Scholar] [CrossRef]
- Azizi-Toupkanloo, H.; Karimi-Nazarabad, M.; Amini, G.R.; Darroudi, A. Immobilization of AgCl@TiO2 on the woven wire mesh: Sunlight-responsive environmental photocatalyst with high durability. Sol. Energy 2020, 196, 653–662. [Google Scholar] [CrossRef]
- Zhang, H.Z.; Banfield, J.F. Understanding polymorphic phase transformation behavior during growth of nanocrystalline aggregates: Insights from TiO2. J. Phys. Chem. B 2000, 104, 3481–3487. [Google Scholar] [CrossRef]
- Wang, T.; Wei, J.X.; Shi, H.M.; Zhou, M.; Zhang, Y.; Chen, Q.; Zhang, Z.M. Preparation of electrospun Ag/TiO2 nanotubes with enhanced photocatalytic activity based on water/oil phase separation. Phys. E 2017, 86, 103–110. [Google Scholar] [CrossRef]
- Rabhi, S.; Belkacemi, H.; Bououdina, M.; Kerrami, A.; Brahem, L.A.; Sakher, E. Effect of Ag doping of TiO2 nanoparticles on anatase-rutile phase transformation and excellent photodegradation of amlodipine besylate. Mater. Lett. 2019, 236, 640–643. [Google Scholar] [CrossRef]
- Pazoki, M.; Parsa, M.; Farhadpour, R. Removal of the hormones dexamethasone (DXM) by Ag doped on TiO2 photocatalysis. J. Environ. Chem. Eng. 2016, 4, 4426–4434. [Google Scholar] [CrossRef]
- Chao, H.E.; Yun, Y.; Zhou, C.H.; Hu, X.F.; Andre, L. Influence of Ag additive on the microstructure of TiO2 powders Ag. J. Inorg. Mater. 2003, 18, 457–465. [Google Scholar]
- Suwannaruang, T.; Hildebrand, J.P.; Taffa, D.H.; Wark, M.; Kamonsuangkasem, K.; Chirawatkul, P.; Wantala, K. Visible light-induced degradation of antibiotic ciprofloxacin over Fe-N-TiO2 mesoporous photocatalyst with anatase/rutile/brookite nanocrystal mixture. J. Photochem. Photobiol. A 2020, 391, 112371. [Google Scholar] [CrossRef]
- Granbohm, H.; Kulmala, K.; Iyer, A.; Hannula, S.P. Preparation and photocatalytic activity of quaternary GO/TiO2/Ag/AgCl nanocomposites. Water Air Soil Pollut. 2017, 228, 127. [Google Scholar] [CrossRef]
- Wang, Y.F.; Zhang, M.; Li, J.; Yang, H.C.; Gao, J.; He, G.; Sun, Z.Q. Construction of Ag@AgCl decorated TiO2 nanorod array film with optimized photoelectrochemical and photocatalytic performance. Appl. Surf. Sci. 2019, 476, 84–93. [Google Scholar] [CrossRef]
- Zhou, J.B.; Cheng, Y.; Yu, J.G. Preparation and characterization of visible-light-driven plasmonic photocatalyst Ag/AgCl/TiO2 nanocomposite thin films. J. Photochem. Photobiol. A 2011, 223, 82–87. [Google Scholar] [CrossRef]
- Liu, S.M.; Zhu, D.L.; Zhu, J.L.; Yang, Q.; Wu, H.J. Preparation of Ag@AgCl-doped TiO2/sepiolite and its photocatalytic mechanism under visible light. J. Environ. Sci. 2017, 60, 43–52. [Google Scholar] [CrossRef] [PubMed]
- Yin, H.Y.; Wang, X.L.; Wang, L.; Nie, Q.; Zhang, Y.; Yuan, Q.L.; Wu, W.W. Ag/AgCl modified self-doped TiO2 hollow sphere with enhanced visible light photocatalytic activity. J. Alloys Compd. 2016, 657, 44–52. [Google Scholar] [CrossRef]
- Zhang, Z.; Feng, C.S.; Jiang, C.Y.; Wang, Y.P. Enhanced visible-light photocatalytic activity and mechanism of Ag@AgCl-decorated TiO2 nanotubes. J. Electron. Mater. 2021, 50, 352–363. [Google Scholar] [CrossRef]
- Zhang, Y.; Wang, T.; Zhou, M.; Wang, Y.; Zhang, Z.M. Hydrothermal preparation of Ag-TiO2 nanostructures with exposed {001}/{101} facets for enhancing visible light photocatalytic activity. Ceram. Int. 2017, 43, 3118–3126. [Google Scholar] [CrossRef]
- Ren, Y.; Xing, S.; Wang, J.; Liang, Y.; Zhao, D.; Wang, H.; Wang, N.; Jiang, W.; Wu, S.; Dong, C.; et al. Weak-light-driven Ag-TiO2 photocatalyst and bactericide prepared by coprecipitation with effective Ag doping and deposition. Opt. Mater. 2022, 124, 111993. [Google Scholar] [CrossRef]
- Dou, L.; Li, J.J.; Long, N.; Lai, C.X.; Zhong, J.B.; Li, J.Z.; Huang, S.T. Fabrication of 3D flower-like OVs-Bi2SiO5 hierarchical microstructures for visible light-driven removal of tetracycline. Surf. Interfaces 2022, 29, 101787. [Google Scholar] [CrossRef]
- Dou, L.; Jin, X.Y.; Chen, J.F.; Zhong, J.B.; Li, J.Z.; Zeng, Y.; Duan, R. One-pot solvothermal fabrication of S-scheme OVs-Bi2O3/Bi2SiO5 microsphere heterojunctions with enhanced photocatalytic performance toward decontamination of organic pollutants. Appl. Surf. Sci. 2020, 527, 146775. [Google Scholar] [CrossRef]
- Zhang, F.; Li, Y.H.; Qi, M.Y.; Tang, Z.R.; Xu, Y.J. Boosting the activity and stability of Ag-Cu2O/ZnO nanorods for photocatalytic CO2 reduction. Appl. Catal. B-Environ. 2020, 268, 118380. [Google Scholar] [CrossRef]


| Samples | Phase Composition (%)/Crystallite Size (nm) | ||
|---|---|---|---|
| Anatase/Crystallite Size | Rutile/Crystallite Size | Brookite/Crystallite Size | |
| pure TiO2 | 70.0%/9.8 ± 0.4 | 9.0%/46.2 ± 1.1 | 21.0%/11.4 ± 1.8 |
| 1%Ag-TiO2 | 53.1%/10.2 ± 0.1 | 25.4%/25.7 ± 6.4 | 21.5%/9.9 ± 1.5 |
| 2%Ag-TiO2 | 46.3%/9.6 ± 0.7 | 22.6%/29.5 ± 6.5 | 31.1%/12.4 ± 1.2 |
| 4%Ag-TiO2 | 50.0%/10.1 ± 0.2 | 24.3%/29.3 ± 6.1 | 25.7%/13.3 ± 0.7 |
| 6%Ag-TiO2 | 52.2%/9.7 ± 0.3 | 28.0%/35.3 ± 3.8 | 19.8%/14.1 ± 2.9 |
Publisher’s Note: MDPI stays neutral with regard to jurisdictional claims in published maps and institutional affiliations. |
© 2022 by the authors. Licensee MDPI, Basel, Switzerland. This article is an open access article distributed under the terms and conditions of the Creative Commons Attribution (CC BY) license (https://creativecommons.org/licenses/by/4.0/).
Share and Cite
Zhu, X.; Qin, F.; Xia, Y.; Yang, D.; Feng, W.; Jiao, Y. Three-Phase Mixed Titania Powder Modified by Silver and Silver Chloride with Enhanced Photocatalytic Activity under UV–Visible Light. Nanomaterials 2022, 12, 1599. https://doi.org/10.3390/nano12091599
Zhu X, Qin F, Xia Y, Yang D, Feng W, Jiao Y. Three-Phase Mixed Titania Powder Modified by Silver and Silver Chloride with Enhanced Photocatalytic Activity under UV–Visible Light. Nanomaterials. 2022; 12(9):1599. https://doi.org/10.3390/nano12091599
Chicago/Turabian StyleZhu, Xiaodong, Fengqiu Qin, Yangwen Xia, Daixiong Yang, Wei Feng, and Yu Jiao. 2022. "Three-Phase Mixed Titania Powder Modified by Silver and Silver Chloride with Enhanced Photocatalytic Activity under UV–Visible Light" Nanomaterials 12, no. 9: 1599. https://doi.org/10.3390/nano12091599