Article

Nanopesticide Formulation from Pyraclostrobin and Graphene Oxide as a Nanocarrier and Application in Controlling Plant Fungal Pathogens

1
Hebei Key Laboratory of Active Components and Functions in Natural Products, Hebei Normal University of Science and Technology, Qinhuangdao 066004, China
2
Analysis and Testing Center, Hebei Normal University of Science and Technology, Qinhuangdao 066000, China
3
College of Agronomy and Biotechnology, Hebei Normal University of Science and Technology, Qinhuangdao 066000, China
4
Key Laboratory of Biology and Genetic Improvement of Oil Crops of Ministry of Agriculture and Rural Affairs, Oil Crops Research Institute of the Chinese Academy of Agricultural Sciences, Wuhan 430062, China
*
Author to whom correspondence should be addressed.
These authors contributed equally to this work.
Nanomaterials 2022, 12(7), 1112; https://doi.org/10.3390/nano12071112
Submission received: 17 February 2022 / Revised: 20 March 2022 / Accepted: 22 March 2022 / Published: 28 March 2022
(This article belongs to the Topic Application of Graphene-Based Materials)

Abstract

:
Efficient and environment-friendly nanopesticide delivery systems are critical for the sustainable development of agriculture. In this study, a graphene oxide nanocomposite was developed for pesticide delivery and plant protection with pyraclostrobin as the model pesticide. First, graphene oxide–pyraclostrobin nanocomposite was prepared through fast adsorption of pyraclostrobin onto graphene oxide with a maximum loading of 87.04%. The as-prepared graphene oxide–pyraclostrobin nanocomposite exhibited high stability during two years of storage, suggesting its high potential in practical application. The graphene oxide–pyraclostrobin nanocomposite could achieve temperature (25 °C, 30 °C and 35 °C) and pH (5, 7 and 9) slow-release behavior, which overcomes the burst release of conventional pyraclostrobin formulation. Furthermore, graphene oxide–pyraclostrobin nanocomposite exhibited considerable antifungal activities against Fusarium graminearum and Sclerotinia sclerotiorum both in vitro and in vivo. The cotoxicity factor assay revealed that there was a synergistic interaction when graphene oxide and pyraclostrobin were combined at the ratio of 1:1 against the mycelial growth of Fusarium graminearum and Sclerotinia sclerotiorum with co-toxicity coefficient values exceeding 100 in vitro. The control efficacy of graphene oxide–pyraclostrobin nanocomposite was 71.35% and 62.32% against Fusarium graminearum and Sclerotinia sclerotiorum in greenhouse, respectively, which was higher than that of single graphene oxide and pyraclostrobin. In general, the present study provides a candidate nanoformulation for pathogenic fungal control in plants, and may also expand the application of graphene oxide materials in controlling plant fungal pathogens and sustainable agriculture.

Graphical Abstract

1. Introduction

Pesticides play important roles in controlling plant diseases, weeds and insects to ensure crop productivity and promote the sustainable development of agriculture [1,2,3]. It has been reported that nearly 3.5 million tons of synthetic pesticides are applied every year to control pests worldwide [4,5]. In fact, only less than 0.1% of pesticides can reach the targets, while more than 99% of them cannot exert their bioactivity since most of them are lost due to leaching, evaporation and drifting or degradation by light, heat and microorganisms [6,7,8,9]. In addition, conventional pesticide formulation involves the use of large amounts of organic solvents, posing serious threats of pollution to the environment and toxicity to non-target organisms [10,11,12]. Therefore, it is urgent to develop appropriate pesticide delivery systems and high-efficiency and green pesticide formulations, which may help to reduce the dosage of pesticides and improve their efficacy.
In recent years, smart nano-delivery systems of pesticides have attracted increasing attention [13,14]. By more scientific and rational design, the pesticide delivery system involving on-demand or site-specific release with sustained bioactivity could minimize or avoid the repeated application of pesticides [15,16]. Besides, it can also decrease the environmental risk of pesticides by reducing the application dosage and frequency of pesticides. Various nanomaterials such as graphene-based nanomaterials, mesoporous silica nanoparticles and metal-inorganic materials have been developed as vectors for pesticide delivery [17,18,19]. Among the various nanocarriers developed for pesticides, graphene oxide (GO) is considered as a robust scaffold for pesticide delivery owing to its advantages including easy surface modification, high loading rate, large surface area and good water solubility [20,21]. For example, Song et al. reported the application of GO as a carrier to deliver emamect in benzoate, which can enhance the dispersion stability of pesticides and the sustainable antipest activity [22]. Tong et al. demonstrated that polydopamine-coated GO has higher loading capacity for hymexazol with pH-controlled release [23]. It has been proved that GO can enhance the leaf affinity of pesticides as a nanocarrier to reduce the loss of applied pesticides [23,24,25]. However, in real application, the pesticide formulated with nanocarriers should have simple components, easy preparation process, multifunctionality and high bioactivity, as well as appropriate pesticide content, storage stability and sustained effects.
Pyraclostrobin (Pyr), a broad-spectrum, high-efficiency and low-toxicity novel strobilurin fungicide, has protective and curative effects on crops [26]. Herein, we combined the existing Pyr pesticide with GO to formulate new GO–Pyr nanopesticide, and tested its antifungal activity against two important plant diseases wheat scab and rape sclerotinia infected by pathogenic fungi Fusarium graminearum (FG) and Sclerotinia sclerotiorum (SS). Pyr was loaded on a GO nanocarrier through a physisorption process, forming a GO–Pyr nanocomposite with high antifungal activity. In consideration of the high efficiency, simple preparation, multifunction and high biosafety, GO holds great promise in smart pesticide delivery and plant protection.

2. Materials and Methods

2.1. Materials

Graphite was provided by Qingdao Tianhe Graphite Co. Ltd. (Qingdao, China). The average particle diameter was 4 mm (99.95% of purity). All other reagents were of HPLC grade and purchased from the Tianjin No. 3 Chemical Plant. Pyr (ACS grade) was provided by Sigma-Aldrich (Shanghai, China).

2.2. Characterization

Transmission electron microscopy (TEM) of GO was performed by Tecnai G20 microscopy (FEI, Czech, Tokyo, Japan). The size and morphology of GO were examined by atomic force microscope (AFM, Nanoscope IIIa, Veeco Instruments Inc., Plainview, NY, USA). The specific surface area of the GO was determined by a surface area analyzer (JW-K, Beijing, China) through the Brunauer–Emmett–Teller (BET) method with an adsorbent of N2. Scanning electron microscopy (SEM, Hitachi, SU8010, Tokyo, Japan) was conducted to investigate the morphology of GO and GO–Pyr nanocomposites, and the infrared absorption spectra were collected on a Fourier transform infrared (FT-IR) spectroscope (Bruker, TENSOR-27, Karlsruhe, Germany). Thermogravimetric analysis (TGA) was carried out with a STA 409 PC (Netzsch, Bavaria, Germany) from 25 °C to 700 °C at a heating rate of 10 °C min−1 under N2 atmosphere. GO–Pyr was placed on paraffin film, and the contact angle (Dataphysics, OCA20, Stuttgart, Germany) was measured.

2.3. Fungal Strains

Plant pathogenic fungus FG was obtained from the College of Plant Science and Technology of Huazhong Agricultural University. SS was obtained from Oil Crops Research Institute of the Chinese Academy of Agricultural Sciences. The fungal cultures were routinely maintained on a potato dextrose agar (PDA, Nantong Kaiheng Biotechnology Development Co., Ltd, Nantong, Jiangsu Province, China) slant at 4 °C.

2.4. Preparation of Graphene Oxide–Pyraclostrobin Nanocomposites

First, GO was prepared with the Hummer’s method [27]. Physical loading of Pyr onto the surface of GO was conducted to obtain the GO–Pyr nanocomposite [28]. For screening the optimal combination ratio between GO and Pyr, the inhibitory effects of GO–Pyr combined at different ratios (1:9, 2:8, 3:7, 6:4, 5:5, 4:6, 7:3, 8:2 and 9:1) on the mycelial growth of FG was tested. As a result, the ratio of 5:5 resulted in the best bioactivity (Figure S1). Therefore, GO–Pyr combined at 5:5 was selected as the optimal combination for subsequent preparation, characterization and bioactivity analysis. To be specific, 500 μg Pyr was dispersed in a mixture (2 mL) of methanol, Tween 20 and water (MT, 1: 1: 98, v/v). Then, 500 μg GO was added into the mixture to obtain a final GO/Pyr ratio of 1:1, which was then stirred in the dark for 24 h. The generated products were washed with deionized water and then freeze-dried for further use.

2.5. Determination of the Pesticide Loading Capacity of Graphene Oxide

The loading content (LC) of Pyr on the surface of GO was measured using HPLC (Thermo Fisher LTQ Orbitrap XL, Waltham, MS, USA). In brief, the GO–Pyr nanocomposite was dissolved in 25.0 mL of methanol with vigorous vortexing, and the clear solution was collected to perform HPLC analysis. The HPLC parameters were: ZORBAX Eclipse Plus C18 column (250 mm × 4.6 mm, 5 μm; Agilent, Palo Alto, CA, USA) with UV detection at 275 nm. A flow rate of 1 mL/min was used with a mobile phase composed of methanol and water (80:20, v/v), and the injection volume was 10 μL. The pesticide LC was obtained with the following equation [29]:
LC (%) = Wpyr/WGO × 100
where Wpyr is the weight of Pyr loaded on GO (μg), and WGO is the weight of GO (μg).

2.6. In Vitro Release Experiment

The release behavior of Pyr was studied as follows. About 5 mL dispersion of GO–Pyr nanocomposite was placed in a dialysis bag (molecular weight cutoff = 3500 Da) (Mym Biological Technology Co., Ltd, Chicago, IL, USA), which was subsequently placed in 45 mL methanol–water mixture (1:1, v/v) in a centrifuge tube. The centrifuge tube was shaken at 200 rpm and the temperature of 25 °C, 30 °C and 35 °C. At the predetermined time points, 1 mL of supernatant was collected, with the addition of 1 mL fresh medium each time. The solution was filtered with a cellulose-membrane filter (diameter, 13 mm; pore size, 0.22 μm; Dikma China Limit Technologies Inc., BeiJing, China) and then injected into the HPLC system to measure the pesticide concentration. The Korsmeyer–Peppas model Equation (2) and Higuchi model Equation (3) were employed for analysis of the Pyr release behavior from GO:
Mt/M = ktn
Mt/M = kt0.5
where Mt (mg) is the cumulative release at a certain time points, M (mg) represents the total Pyr release amount at equilibrium, k (d−n) indicates the kinetic constant, t (d) is the time point, and n stands for a constant associated with the release mechanism [30].
To investigate the pH-dependent release performance of Pyr, the pH of 30% ethanol aqueous solution was adjusted to 5.0, 7.0 and 9.0 by PBS buffer. Other operations were the same as the above process.

2.7. Stability Test

2.7.1. Storage Stability at Low or High Temperature

The solution of GO–Pyr nanocomposite (containing 1 mg/mL Pyr) was put in brown glass bottles and maintained at 0 °C for 7 d or at 54 °C for 14 d. Then, the Pyr content was determined with HPLC [31].

2.7.2. Long-Term Storage Stability

The solution of GO–Pyr nanocomposite was put into glass bottles and placed in dark, dry and ventilated places for 24 months. The Pyr content was determined every four months by HPLC [32].

2.8. Bioassay of the Antifungal Activity of Graphene Oxide–Pyraclostrobin Nanocomposite In Vitro

To test the in vitro antifungal effect, the antifungal activity of Pyr alone or combined with GO on the mycelial growth of FG and SS was determined. In brief, FG or SS was loaded onto solid PDA containing GO, Pyr or GO–Pyr at different concentrations. MT solution at an equal volume without any fungicide was also processed to serve as the control. After incubation at 24 ± 2 °C for 120 h, the mycelial growth of FG and SS was observed. The rate of mycelial growth inhibition (I, %) was calculated by using the following equation:
I = (1 − Dt/Dc) × 100%
In the equation, Dc and Dt are the mycelial diameter or biomass of the control and treatment after 120 h of incubation, respectively [33]. The antifungal activity was measured through a totally random design with four replications.

2.9. Control Efficacy of Graphene Oxide–pyraclostrobin Nanocomposite In Vivo

Greenhouse bioassays were performed to determine the antifungal activity of Pyr alone or combined with GO. The seeds of edible rape (Brassica rapa L.) Zhong Huaqing were purchased from the College of Agriculture and Biotechnology, Zhejiang University. The seeds of wheat cultivar SHILUAN02-1 were obtained from Hebei Academy of Agricultural Sciences (Shijiazhuang, China).
For measuring the antifungal activity of GO–Pyr against FG, a single floret injection was performed as described previously [34]. At the anthesis stage, point inoculation (10 μL mixture of spore suspension with 400 μg/mL GO, Pyr and GO–Pyr suspension, v:v = 1:1) was conducted on central spikelets of the selected spikes, which were then covered with small plastic bags for three days to maintain humidity for disease development. Some spikes were inoculated with MT in sterile water to be used as the negative control. In total, 90 spikes (30 for each subplot, three replicates) were evaluated. The spikelet disease was scored at 7 d after the inoculation. Quantitative infection symptoms, such as disease incidence (DI, the ratio of symptomatic spikelets to total spikelets) and disease index (DS), were visually determined based on a previously described 0–100% severity scale at 7 d after inoculation [35].
To measure the antifungal activity against SS, the Pyr and GO–Pyr solutions were diluted with MT solution to reach a final concentration of 200 μg/mL, which were then sprayed on 3-week-old oilseed rape plants. Thereafter, the SS mycelial agar/plugs (5 mm in diameter) were placed side down on oilseed rape leaves at 2 d after spraying and then incubated under light or dark conditions (25 °C and 85% humidity) [36]. The MT solution served as a control. The DI and DS were measured at 7 d after fungal challenge.

2.10. Statistical Analysis

SPSS version 11.5 (SPSS Inc., Chicago, IL, USA) was used for statistical analysis. Each treatment within a replicate was repeated for four times, with three replications. Data were presented as means ± SE and analyzed by using one-way ANOVA. Tukey’s HSD test was performed to test the significance. Statistically different from the control was considered at p < 0.05. The 50% effective concentration (EC50) was obtained by regressing of the percentage growth inhibition against the log-transformed fungicide concentration. The co-toxicity coefficient (CTC) was calculated with the equation [37]:
CTC = [EC50A/EC50(A + B)]/[(EC50A/EC50A) × Pa + (EC50A/EC50B) × Pb].
CTC significantly greater than 100 indicates synergistic interaction; that significantly lower than 100 represents antagonistic reaction; while that approximate to 100 indicates additive interaction.

3. Results and Discussion

3.1. Morphology of Formulated Graphene Oxide–Pyraclostrobin Nanocomposite Characterized by SEM

The typical morphology of GO is displayed in Figure 1a and the images of GO were obtained using AEM. Single-layer GO was about 1–60 nm thick as observed from the representative AFM images. The 2D image of GO is shown in Figure 1b. The free-standing 2D GO sheets have flake-like shapes with high transparency and some wrinkles. The specific surface area of GO was calculated by the BET method by using nitrogen gas adsorption (Figure 1c). As a result, the value was as high as 137 m2/g, which is much higher than the previously reported values [38,39]. Such a large specific surface area of GO is beneficial to promote the adsorption of pesticides. Further, to compare the structural characteristics, the morphology of GO, Pyr and GO–Pyr nanocomposite with SEM was determined [40]. As shown in Figure 1d, GO exhibited a typical wrinkled morphology, while Pyr was crystal, characterized by a rectangular parallelepiped structure, smooth surface and different sizes (Figure 1e). Pyr loading led to the emergence of large amounts crystals with rectangular parallelepiped structure on the surface of GO (Figure 1f). The emergence of such crystals can be attributed to the adsorption of Pyr on GO sheets, which would be further verified by FT-IR later.

3.2. FT-IR Characterization of Graphene Oxide–Pyraclostrobin Nanocomposite

FT-IR spectra of GO, Pyr and GO–Pyr are shown in Figure 2. For GO, the peak at 3405 cm−1 belonged to the O-H stretching vibrations, the vibrations of graphite skeleton were located at 1628 cm−1, peaks at 1720 and 1065 cm−1 were contributed to COOH stretching vibrations and C-O stretching vibrations. In the FT-IR spectra for Pyr, stretching vibration of benzene skeleton was found at 1548 and 1480 cm−1, and the carbonyl stretching vibration of the ester group was observed at 1716 cm−1 [41,42]. Evidently, the spectra of GO–Pyr included all characteristic peaks of both GO and Pyr without a new peak, indicating physical loading of Pyr onto GO, which did not alter its chemical properties [43].

3.3. Thermal Stability Analysis of Graphene Oxide–Pyraclostrobin Nanocomposite

Thermal stability was analyzed by a comparison of the TGA curve between GO, Pyr and GO–Pyr nanocomposite (Figure 3). It can be observed that the weight loss of GO at 200 °C was 19.43%; the weight loss of Pyr at 200 °C was 2.87%; while that of GO–Pyr was only about 5%, suggesting that GO–Pyr nanocomposite had a higher thermal stability than GO while lower thermal stability than Pyr [44]. This phenomenon can be attributed to the weight loss of oxygen-containing functional groups in GO. According to the structure of Pyr, there was almost no loss of functional groups; while GO–Pyr nanocomposite had less weight loss than GO due to the occupation of part of the oxygen-containing functional groups by the H-bond interaction between Pyr and GO.

3.4. Loading Performance of Graphene Oxide for Pyraclostrobin

GO has various functional groups such as hydroxyl groups, which may be responsible for the heterogeneous adsorption of pesticides through the van der Waals force, hydrogen bonding and π–π interaction [45,46]. In the present work, the loading rate of Pyr at different Pyr:GO ratios was studied through centrifugation. The HPLC method was employed to determine the LC of Pyr on GO. Standard curves were obtained for Pyr at concentrations from 12.5 to 500 μg/mL, and the correlation coefficients were higher than 0.999 (Figure S2). The LC data are shown in Figure S3. At 50 μg/mL, the LC of Pyr on GO was 24.89%, and increased with increasing Pyr concentration. The LC tended to reach equilibrium at 250 μg/mL at the Pyr: GO ratio of 1:1, at which the LC was calculated to be 87.04%. The superior pesticide loading capacity of GO may be ascribed to the large surface and abundant functional groups on its surface, which can provide abundant adsorption sites for pesticide to realize efficient pesticide delivery and improve its bioavailability [23,47]. Moreover, a preliminary test to screen the optimal combined ratio of GO and Pyr revealed that the optimal ratio of GO and Pyr at 5:5 (equal to 1:1) can achieve the highest antifungal activity (Figure S1), which can be ascribed to the high LC of Pyr onto GO. A higher pesticide loading onto GO will bring about a higher antifungal activity of the nanocomposite. Therefore, the optimal GO: Pyr ratio was determined to be 1:1.

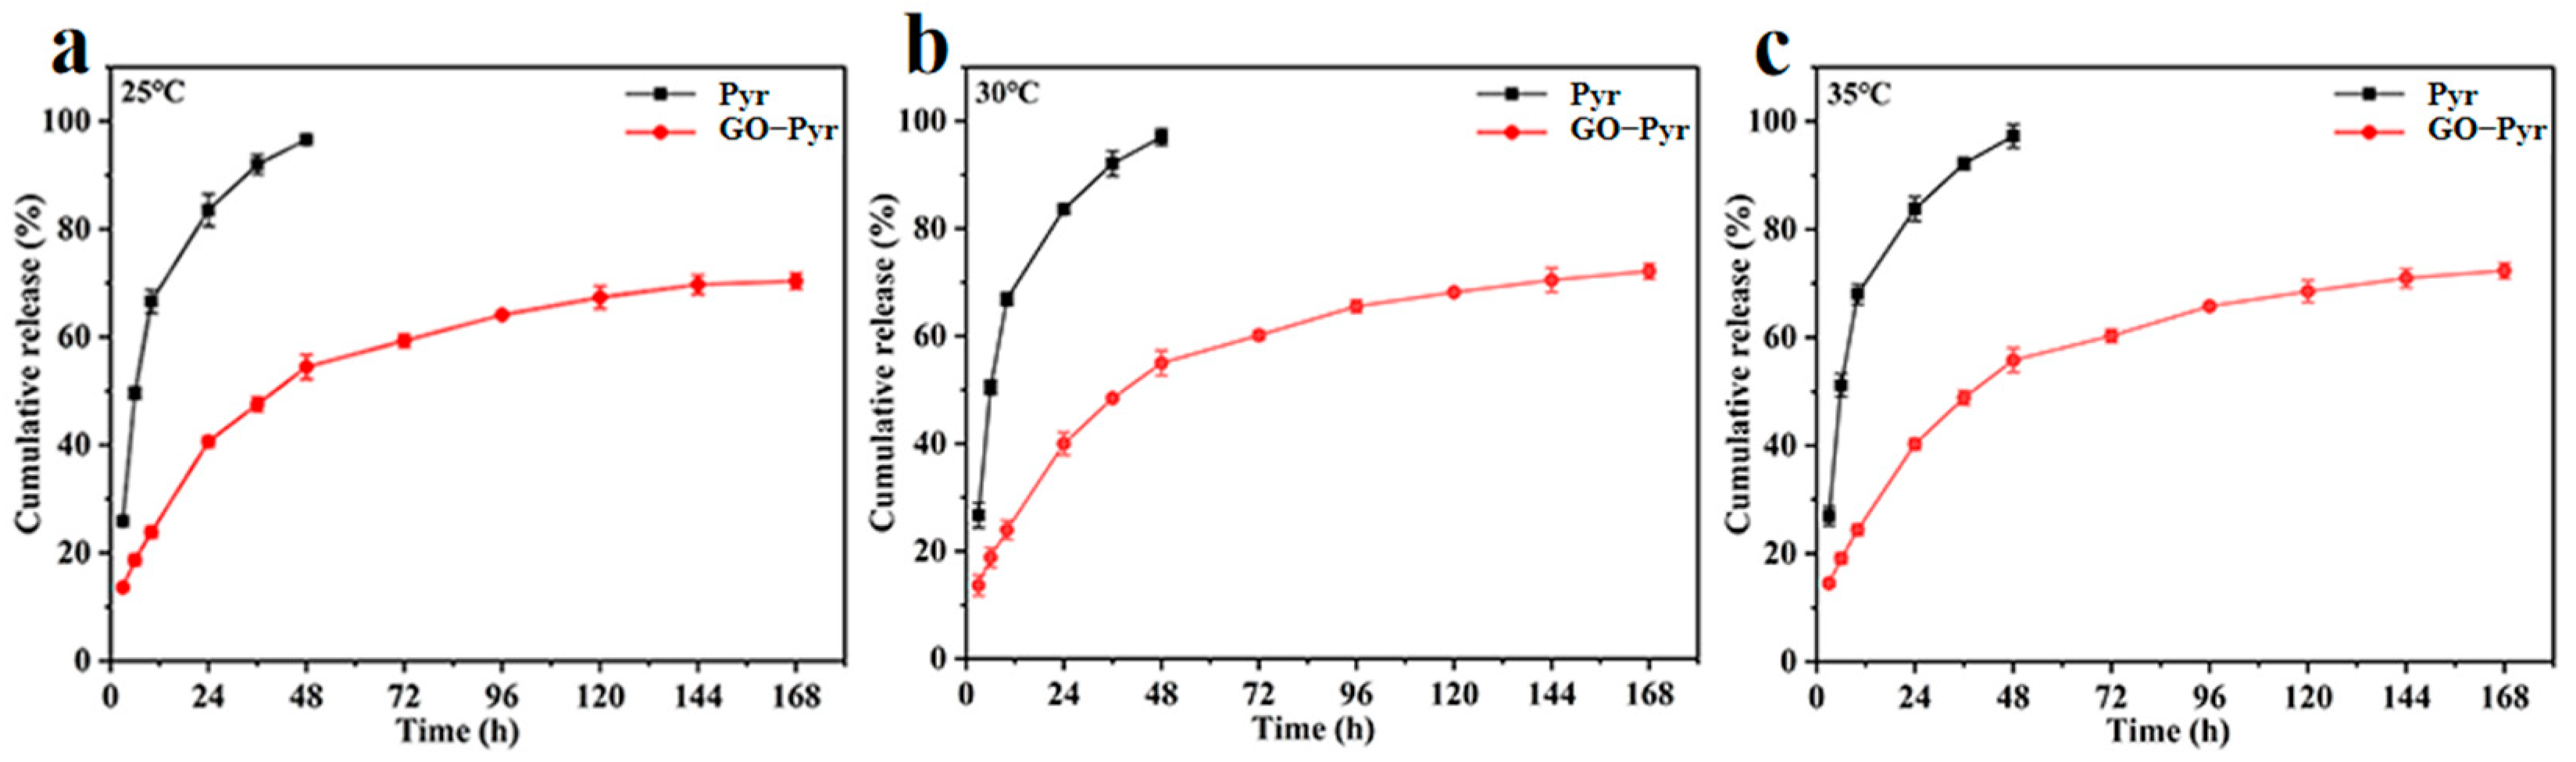
3.5. Release Behavior of Graphene Oxide–Pyraclostrobin Nanocomposite at Different Temperatures

Relative to traditional pesticide formulation, the nano-formulation of pesticide with smart vector can better control the release behavior and promote the bioavailability. To investigate the Pyr release behavior in vitro at different temperatures, Pyr and GO–Pyr nanocomposite were placed in a methanol–water mixture (1:1, v/v) at 25 °C, 30 °C and 35 °C for a week. The supernatant was collected at different time points to determine the amount of cumulative release by HPLC. The release behaviors of Pyr and GO–Pyr nanocomposite are presented in Figure 4 and Table S1. At the temperature of 25 °C, 30 °C and 35 °C, Pyr was released into the medium solution at a fast rate, with cumulative release rates of 96.58%, 97.00% and 97.26% in 48 h, respectively. In contrast, GO–Pyr displayed excellent sustained release of Pyr, which could still be observed even after 168 h. At the temperature of 25 °C, 30 °C and 35 °C, the release of Pyr from GO–Pyr was relatively fast in the first 48 h, with cumulative release rates of 54.47%, 54.99% and 55.81%, respectively; then, the release tended to be slow, with cumulative release of 70.38%, 72.09% and 72.35% after 168 h. The sustained release is consistent with the typical release pattern of controlled drug delivery systems. The first burst release and then slow release can maintain an effective concentration and high activities of the pesticide for a long time [48].
The Korsmeyer–Peppas model and Higuchi model, two classical kinetic models, were used to further investigate the sustained release of Pyr from the nanocomposite. The results are presented in Table 1. The Korsmeyer–Peppas model could provide better fitting of the data as indicated by its higher regression coefficients (R2) than the Higuchi model. The value of n was 0.32, 0.30 and 0.38, respectively, which were all lower than 0.43, indicating that the release of Pyr from the GO–Pyr nanocomposite follows the Fickian diffusion mechanism (n < 0.43), and the diffusion effect is the main factor for this release process [30].

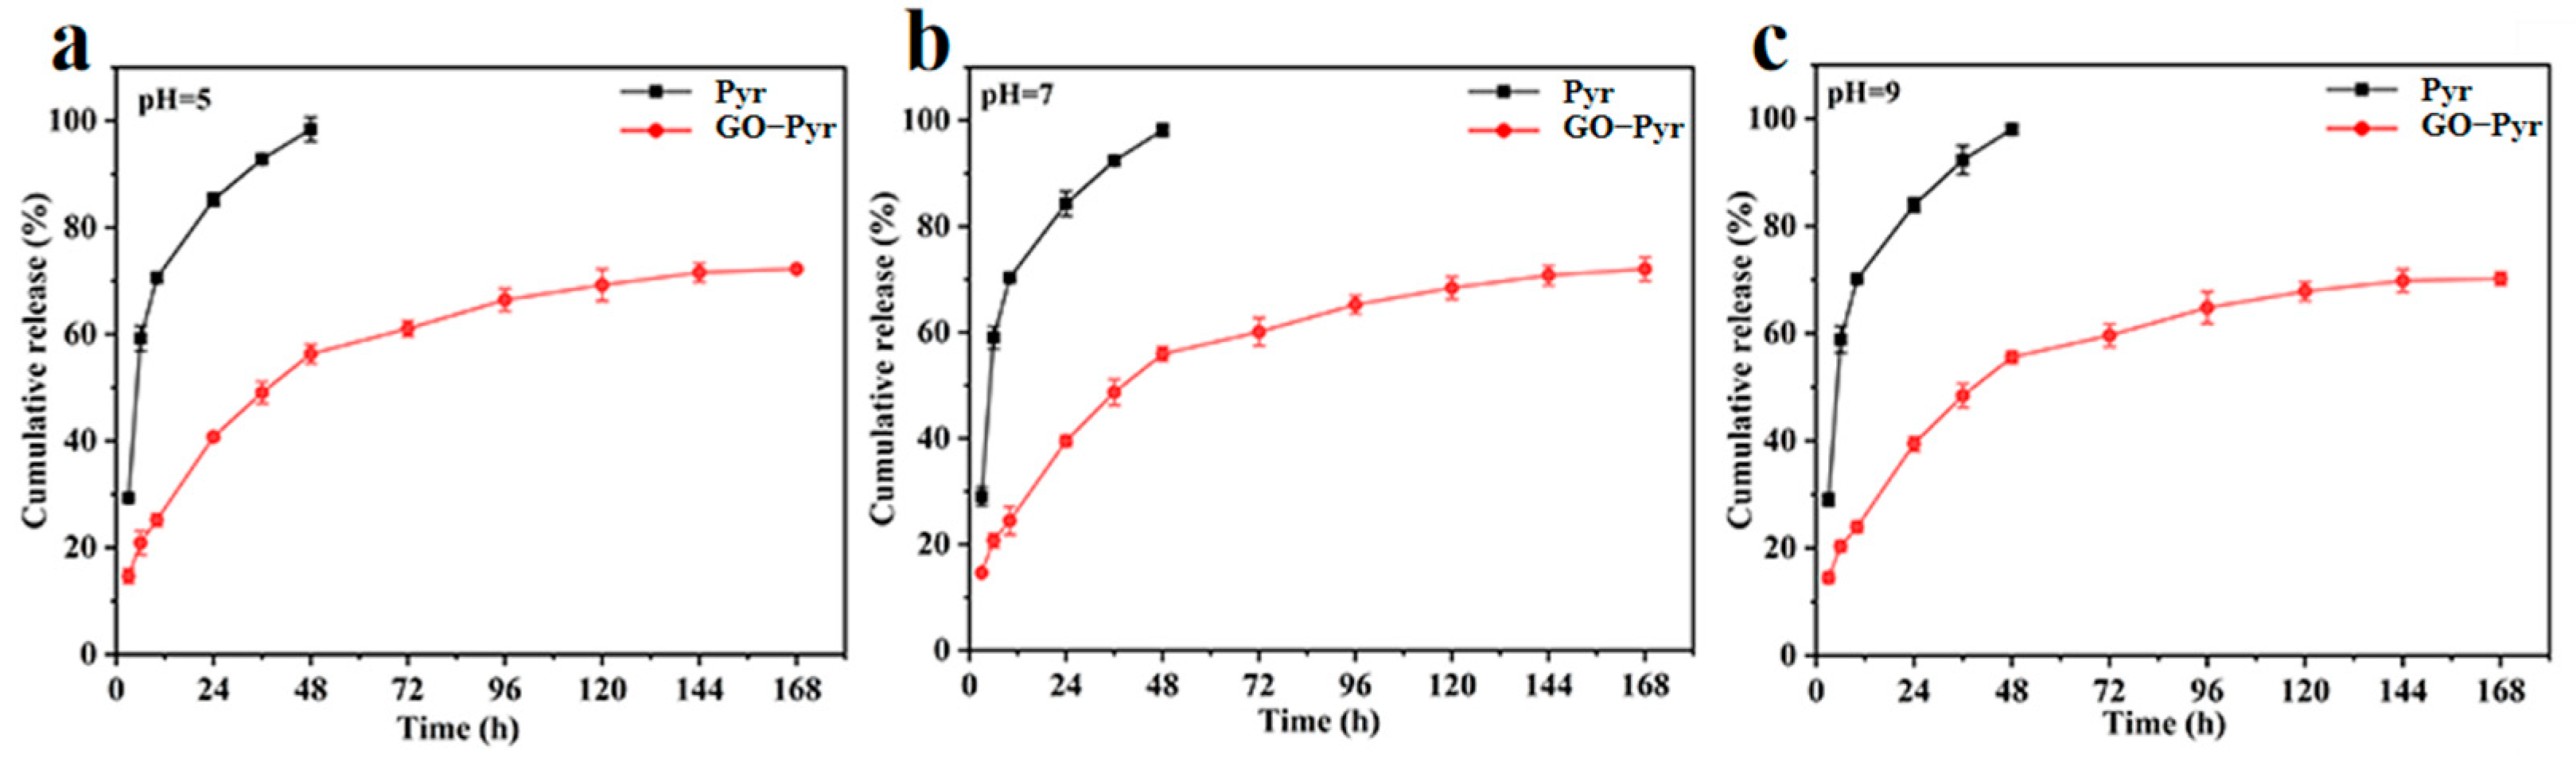
3.6. Release Behavior of GO–Pyr Nanocomposite at Different pH

The release behavior of Pyr from GO–Pyr nanocomposite in 30% ethanol aqueous solution under different pH (5.0, 7.0, and 9.0) at room temperature (25 ± 2 °C) was investigated. As shown in Figure 5 and Table S2, at 48 h, the cumulative release amount of Pyr from GO–Pyr nanocomposite was 56.33% (Figure 5a, pH 5.0), 55.94% (Figure 5b, pH 7.0), and 55.59% (Figure 5c, pH 9.0), respectively. At 168 h, the cumulative release amount was 72.24% (pH 5.0), 71.95% (pH 7.0), and 70.22% (pH 9.0), respectively. In contrast, at 48 h, the cumulative release amount of Pyr was 98.42% (pH 5.0), 98.17% (pH 7.0) and 98.03% (pH 9.0), respectively. The initial burst release and subsequent slow release of GO–Pyr nanocomposite may contribute to sustaining an effective concentration for a long time, which is conducive to the maintenance of high antifungal activity.
Similarly, the release kinetics of Pyr from GO–Pyr nanocomposite was analyzed using the Higuchi and Korsmeyer–Peppas model. The values of related parameters and regression coefficients (R2) are presented in Table 2. The Korsmeyer–Peppas model could achieve better fitting of the data with higher R2 than the Higuchi model. Moreover, the values of relevant indices (n = 0.3271, 0.307 and 0.3873) were all lower than 0.43 at pH 5.0, 7.0 and 9.0, indicating that Pyr release from the nanocomposite under these conditions can be attributed to the Fickian diffusion mechanism. In other words, Pyr is released mainly through the diffusion effect [30].

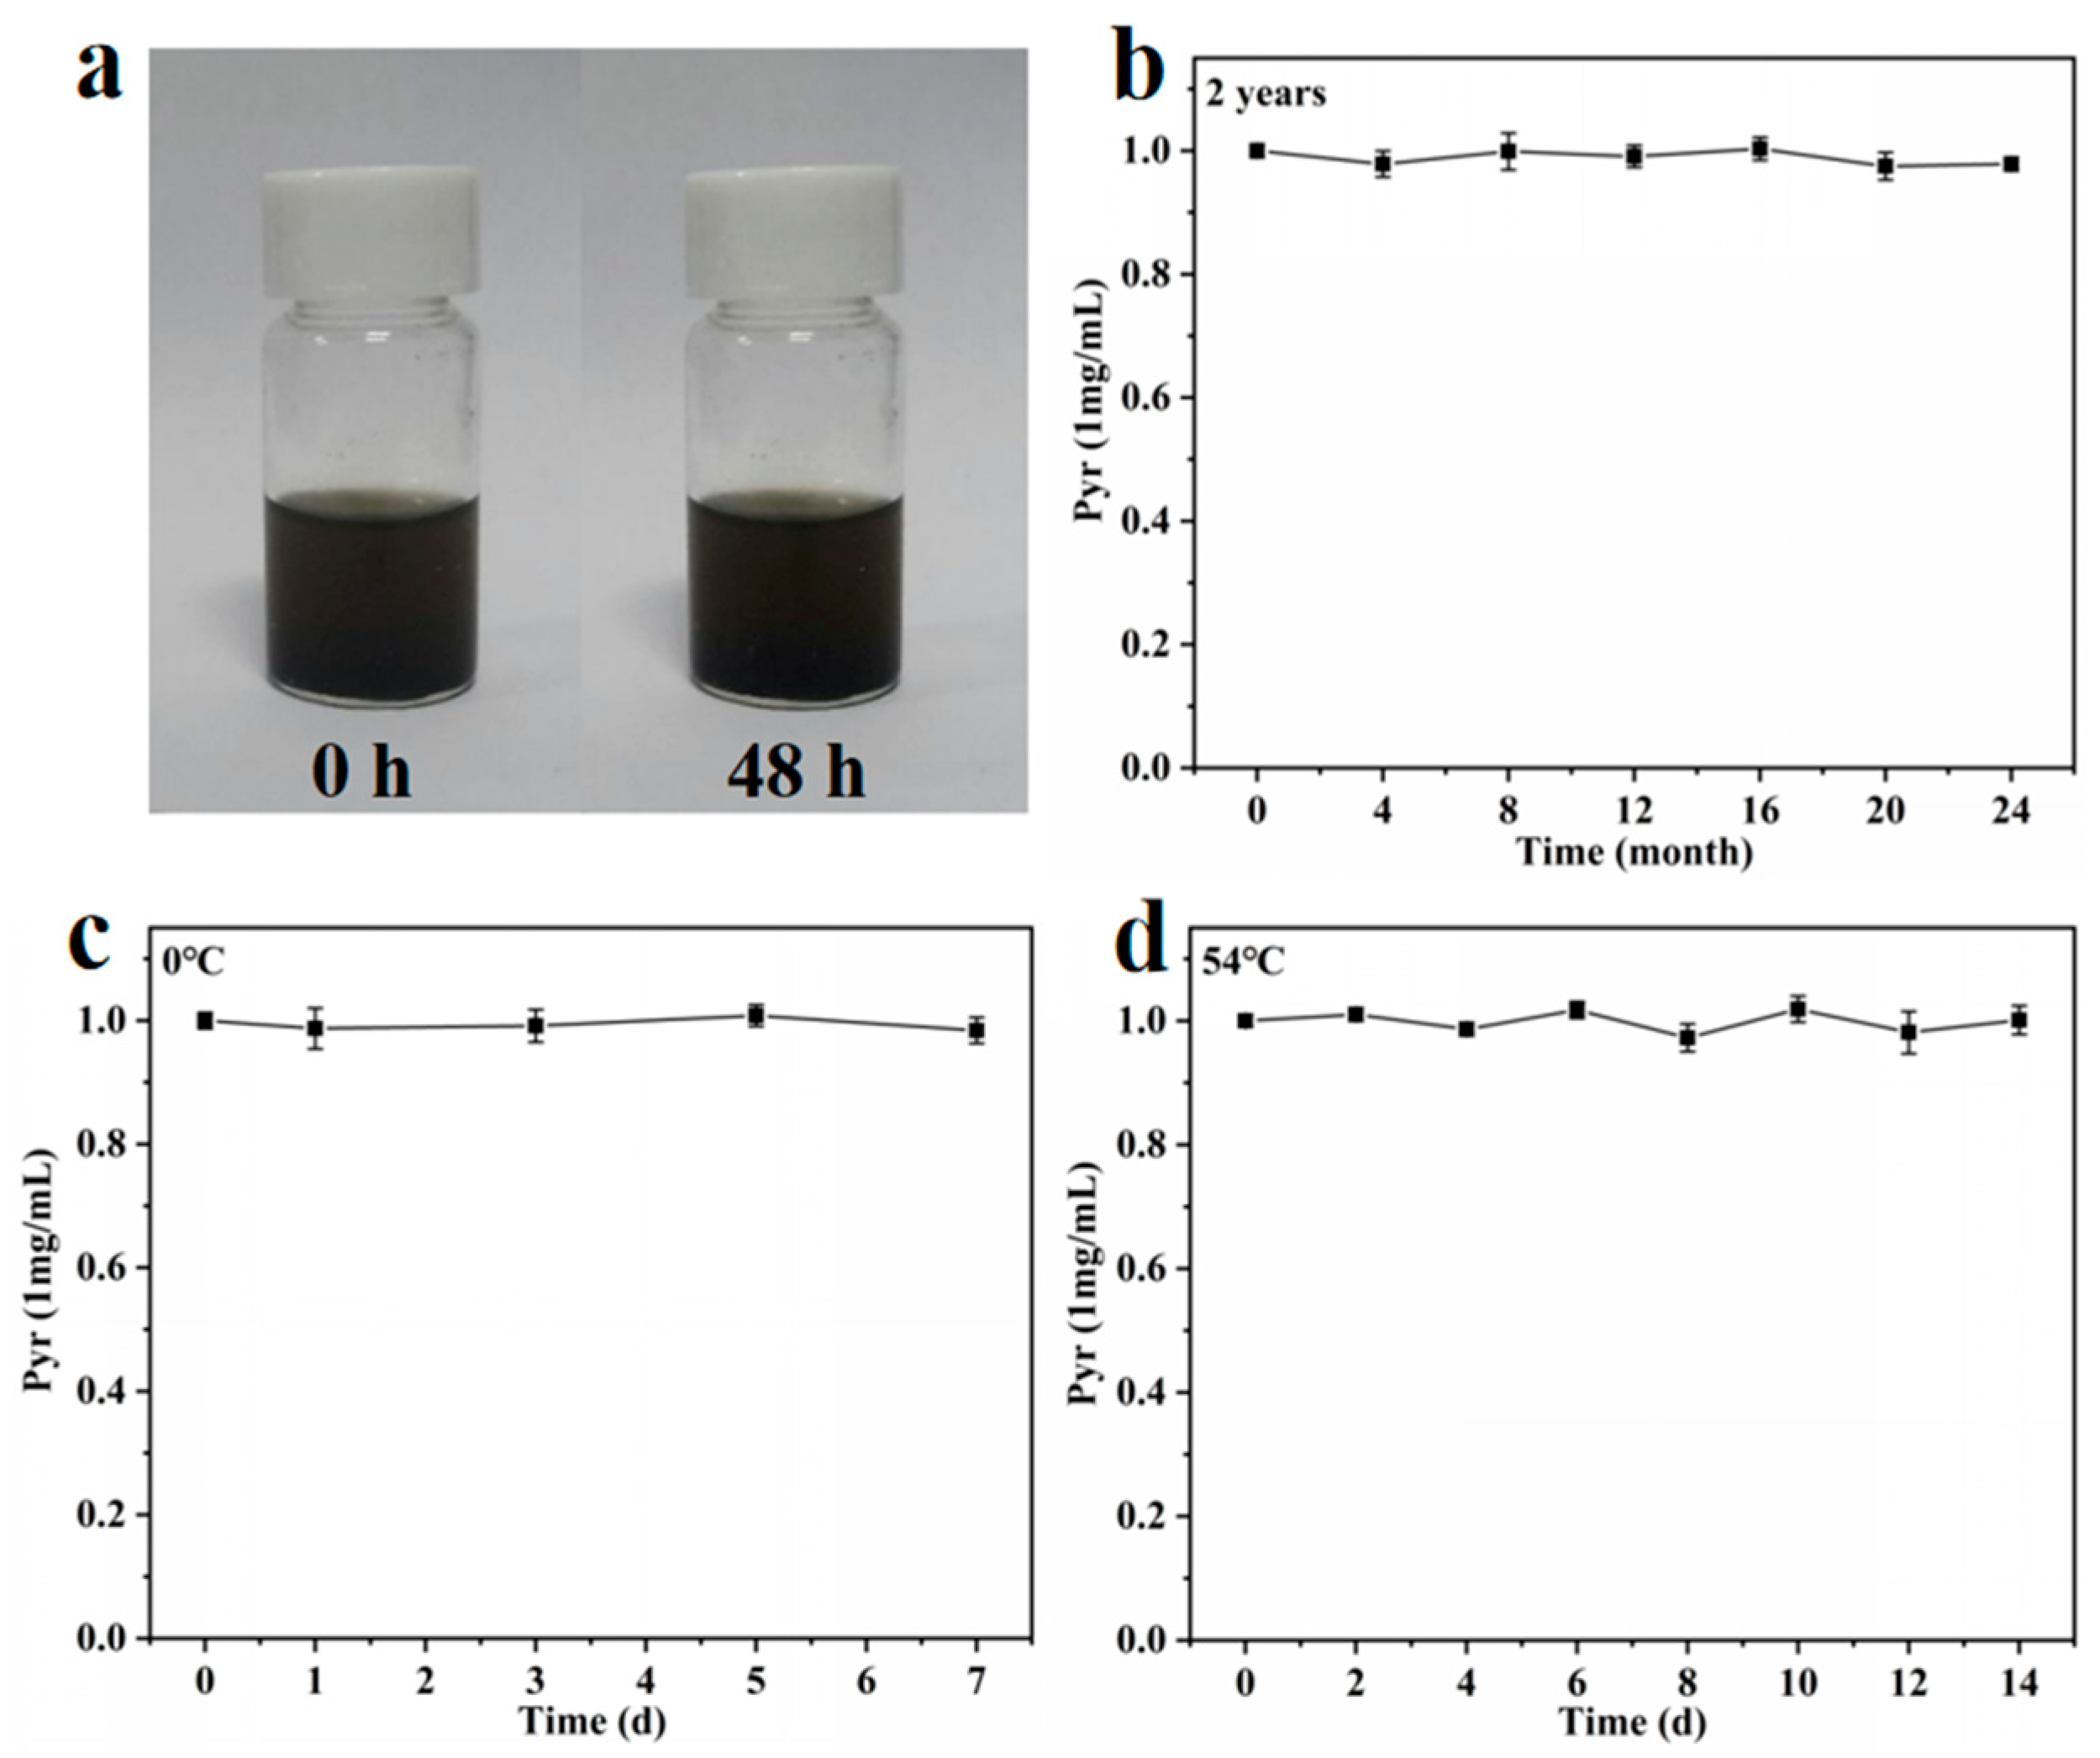
3.7. Storage Stability of Graphene Oxide–Pyraclostrobin Nanocomposite

The storage stability is a main indicator to evaluate the quality of pesticide formulation, which is critical for the effective application after storage and during the spraying process [22,49]. Hence, the stability of the GO–Pyr nanocomposite was assessed by monitoring the contents of effective Pyr components during two-year storage as well as under low- or high-temperature storage.
The colloidal stability of GO–Pyr nanocomposite was studied by standing at room temperature for 0 and 48 h. As shown in Figure 6a, the as-prepared GO–Pyr nanocomposite presented a clear and uniform black solution without flocculation or precipitation. In addition, the content of Pyr showed nearly negligible changes during the two-year storage (Figure 6b). The images of GO–Pyr nanocomposite after low- and high-temperature storage are shown in Figure S4. It can be seen that all the GO–Pyr nanocomposite stayed stable with no precipitation or stratification during storage (Figure 6c,d), which confirms the stability of the GO–Pyr nanocomposite. Moreover, after two years of storage, despite of slight precipitation, the nanocomposite could still be evenly dispersed after shaking, which meets the requirements of real production and application (Figure S5).

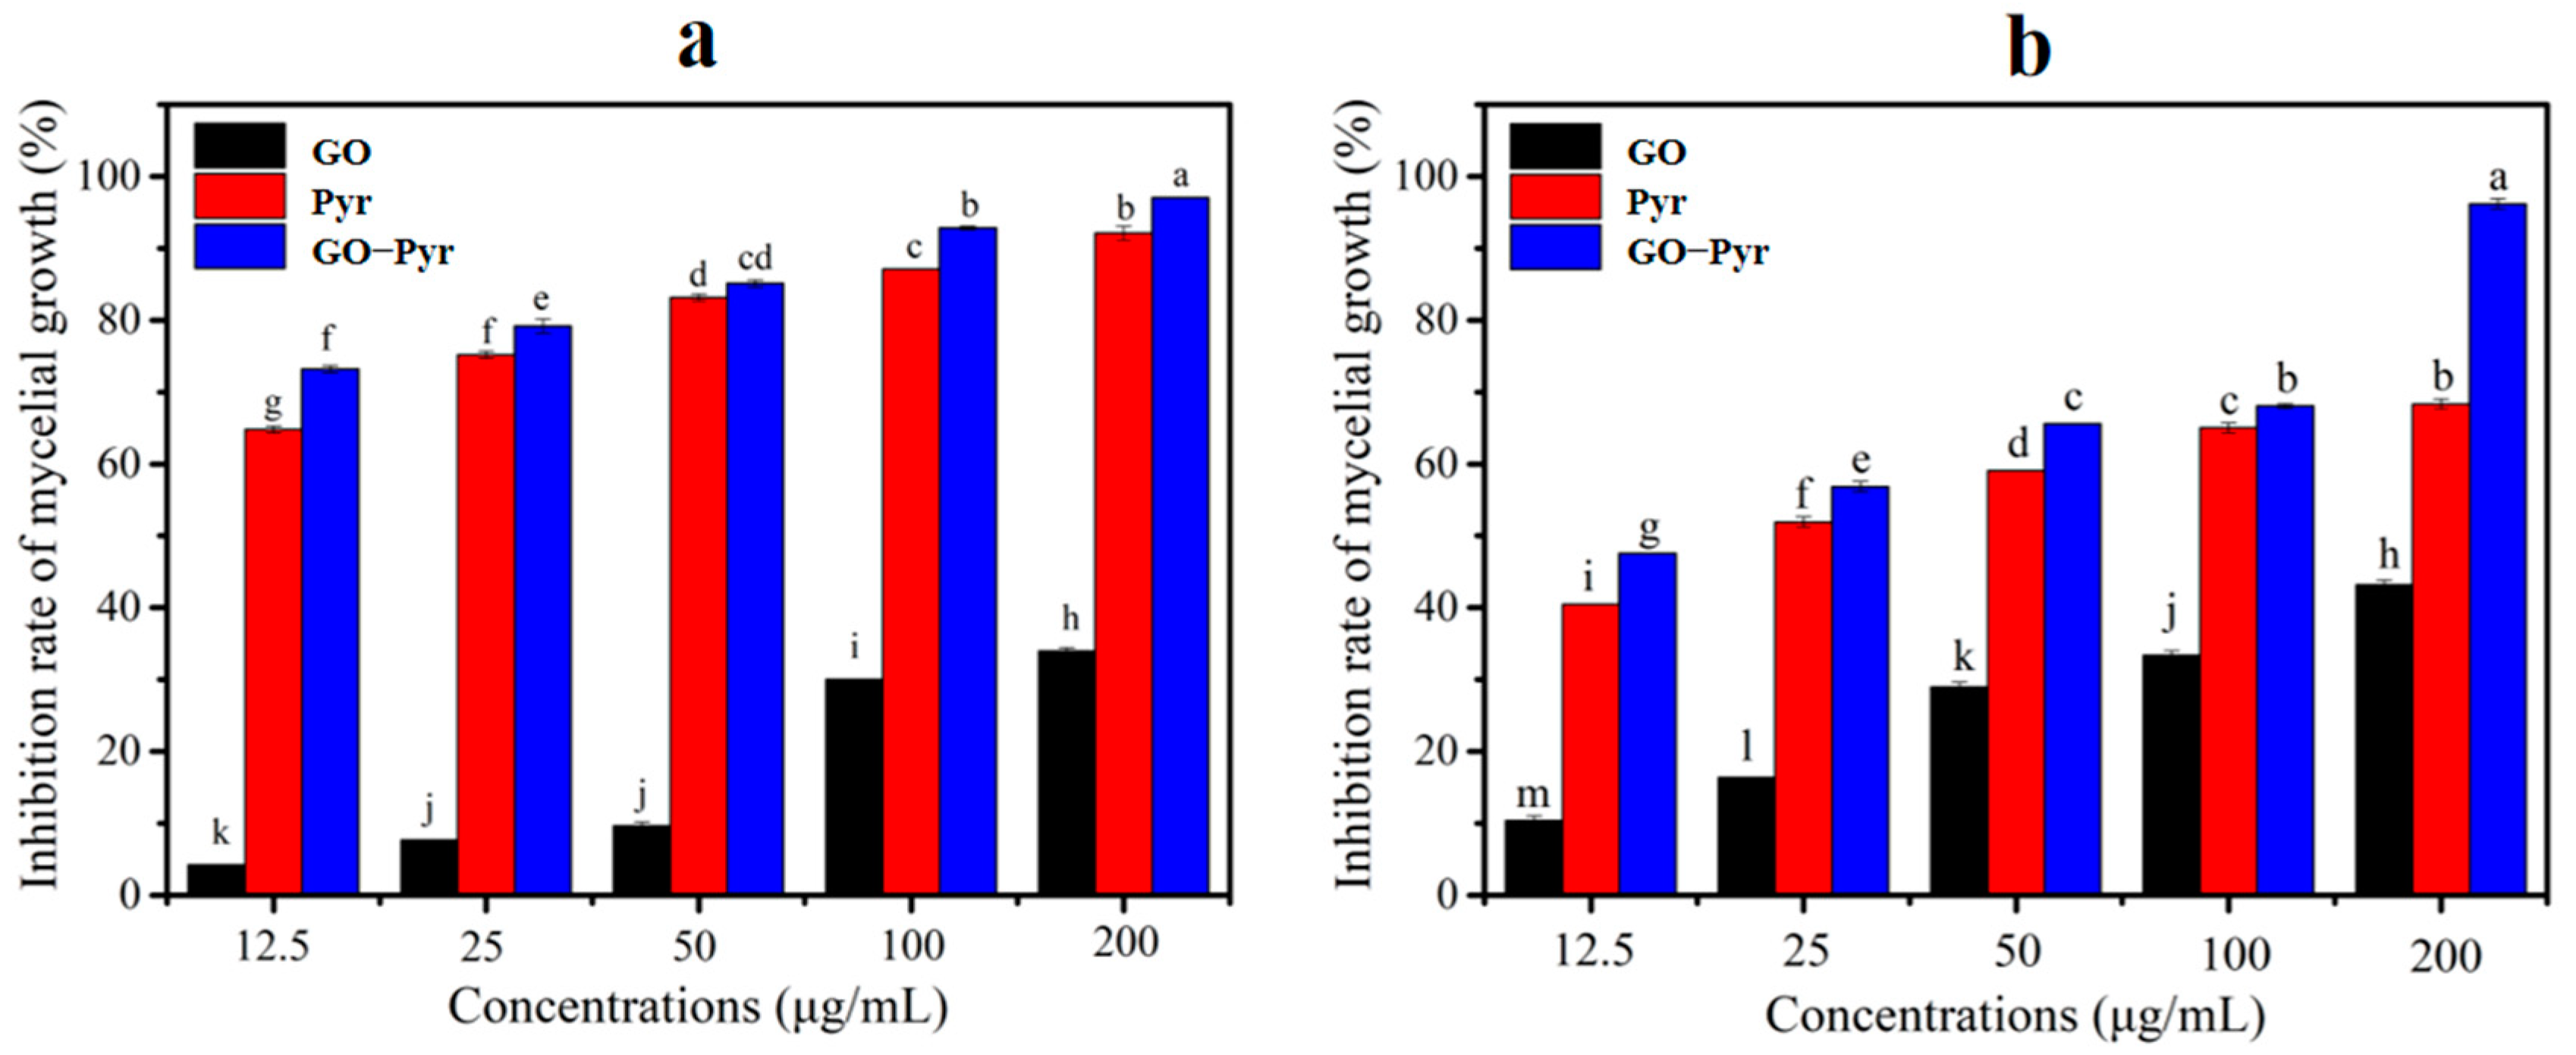
3.8. Bioactivity Assay of Graphene Oxide–Pyraclostrobin Nanocomposite In Vitro

Figure 7 presents the inhibitory effects of GO, Pyr and GO–Pyr nanocomposite on the mycelial growth of FG and SS at different concentrations. Figure 7a shows that at 12.5–200 μg/mL, GO could have 4.22–34% inhibition rates on the mycelial growth of FG; while Pyr could achieve inhibition rates of 64.76–92.06%. Notably, the efficacy of controlling the mycelial growth of FG of GO–Pyr nanocomposite was much higher than that of GO and Pyr alone. It could inhibit the mycelial growth by 73.20% at 12.5 μg/mL, and the inhibition rate could even reach 97.03% at the 200 μg/mL, confirming that the nanocomposite has a much stronger antifungal effect than Pyr and GO alone. Similar results could be observed in Figure 7b. The GO–Pyr nanocomposite also showed higher antifungal activity than GO and Pyr against the mycelial growth of SS. In addition, all GO, Pyr and GO–Pyr nanocomposites had certain inhibitory effects on the mycelial growth in a dose-dependent manner.
Table 3 shows the EC50 values of Pyr and GO–Pyr nanocomposite against the mycelial growth of FG and SS obtained from a probit analysis with a 95% confidence limit. The results indicated that the combination of GO and Pyr (1:1) resulted in a synergistic antifungal effect on both the mycelial growth of FG and SS, with the CTC value exceeding 100.

3.9. Control Efficacy of Graphene Oxide–Pyraclostrobin Nanocomposite on FG and SS in the Greenhouse

As shown in Table 4, the GO–Pyr nanocomposite can significantly decrease the DI and DS of FG and SS in the greenhouse. The GO–Pyr nanocomposite could significantly reduce the DI relative to the MT in sterile water (CK). The GO–Pyr nanocomposite showed significant control efficacy of 71.35% and 62.32% for FG and SS (p < 0.05), respectively. Particularly, the GO–Pyr nanocomposite could remarkably decrease the infection of FG and SS, demonstrating a higher antifungal activity than single Pyr. Therefore, GO may be a promising synergist to be used for Pyr in controlling plant fungal pathogens.

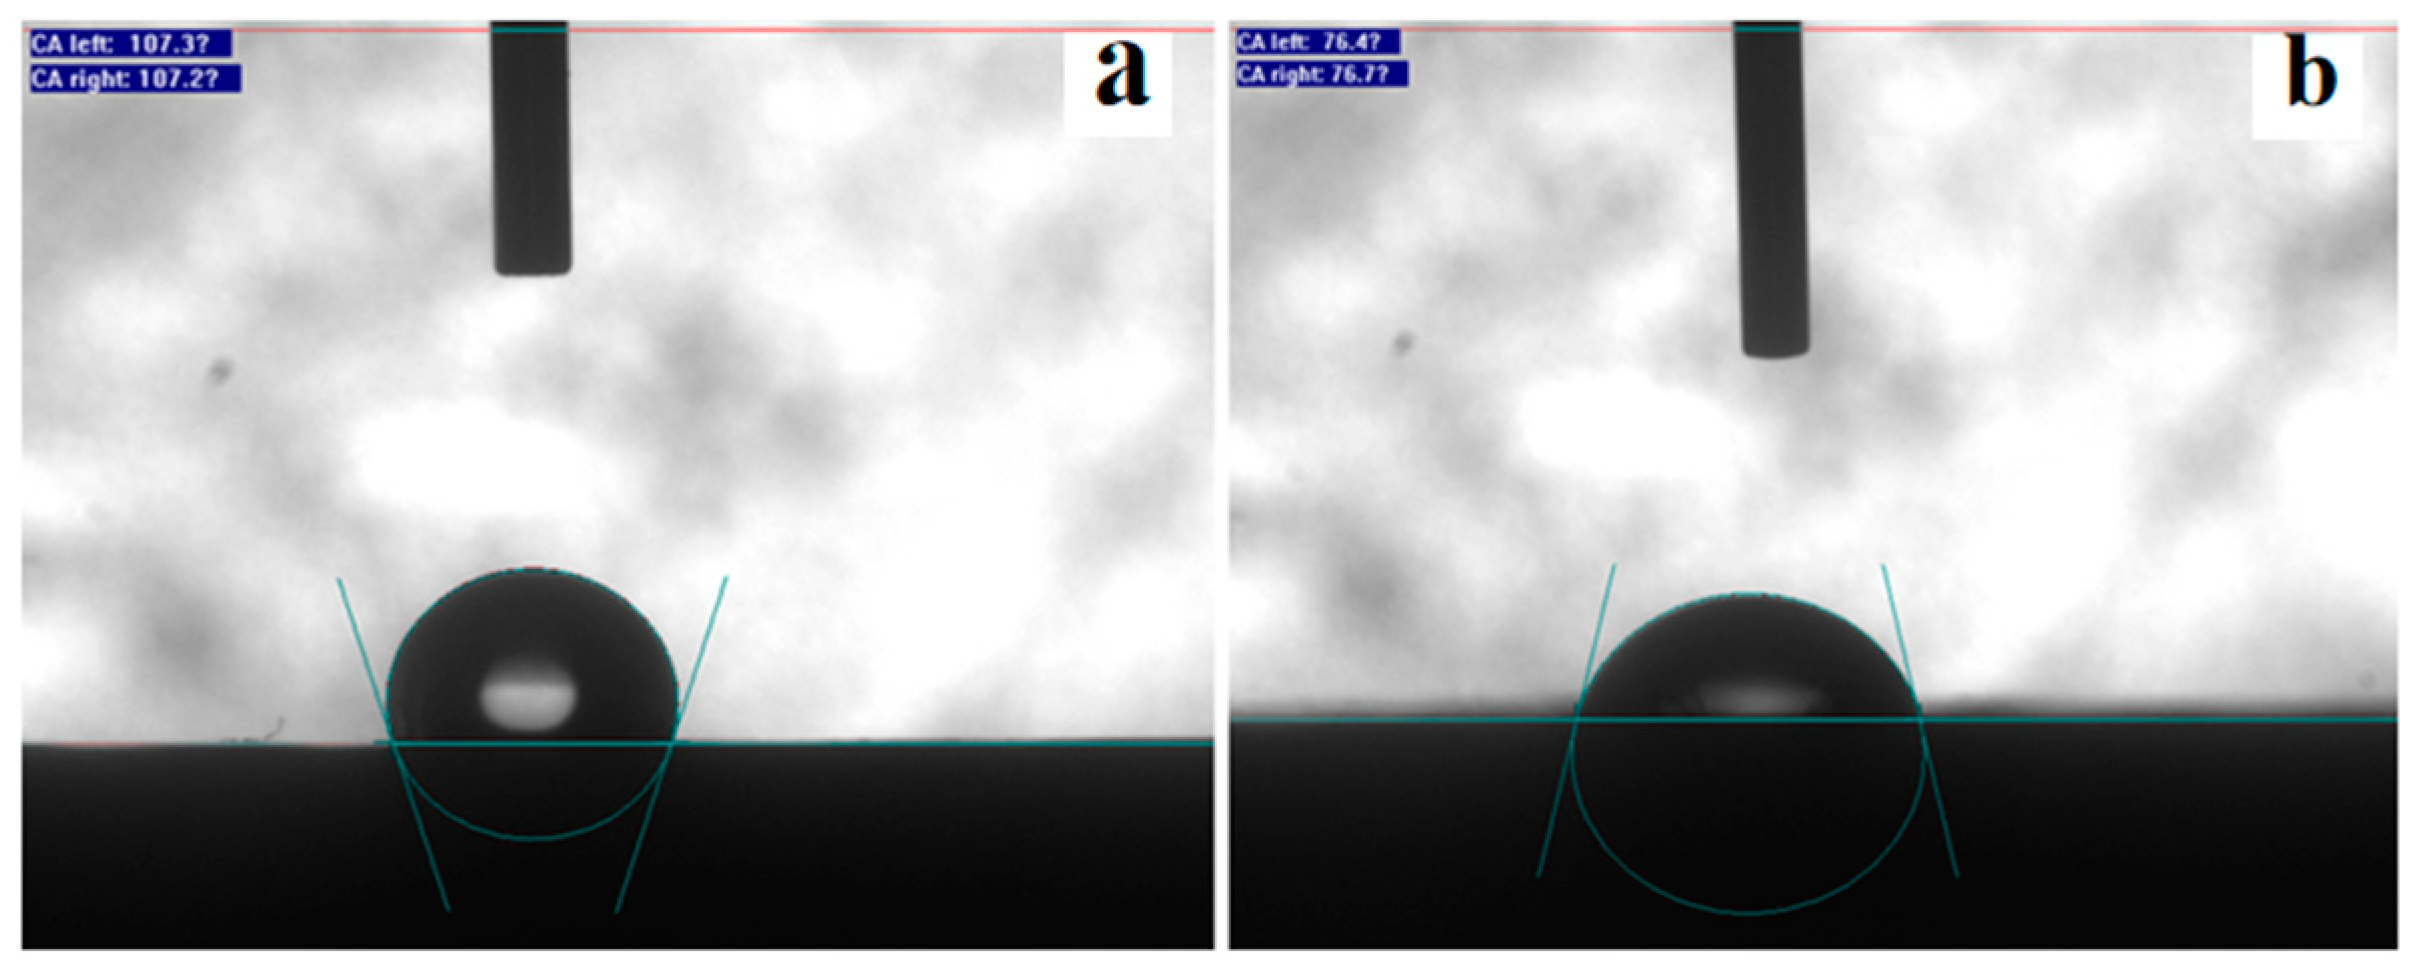
3.10. Adhesion Ability of Graphene Oxide–Pyraclostrobin Nanocomposite

Wettability and retention on leaf surface after spraying are important factors affecting the utilization rate of pesticide [49]. Hence, the wetting characteristics and adhesion ability of GO–Pyr nanocomposite by measuring the contact angle were evaluated. The contact angles of water and GO–Pyr nanocomposite on the surface of paraffin film were about 107° and 74°, respectively (Figure 8). The low contact angle demonstrated that the GO–Pyr nanocomposite has strong adhesion ability and spreadability on paraffin film surface, which can facilitate the adsorption and deposition of the pesticide.

4. Conclusions

This study develops a GO-based nanocarrier for pesticide delivery and pest control. The prepared GO–Pyr nanocomposite showed high solubility and stability in aqueous solutions, which is conducive to the dispersion and utilization of the pesticide. In addition, GO–Pyr exhibited a good release behavior, indicating a sustained release of Pyr from the nanocomposite. Due to the above improvement of properties, the GO–Pyr nanocomposite has satisfactory antifungal activity against FG and SS. Considering the simple preparation, high antifungal activity and avoidance of toxic organic solvents and additives, the pesticide delivery system formulated with GO as the nanocarrier may hold a great promise in future plant protection and sustainable agriculture.

Supplementary Materials

The following supporting information can be downloaded at: https://www.mdpi.com/article/10.3390/nano12071112/s1, Table S1: Release kinetics of Pyr and GO-Pyr nanocomposite at 25 °C, 30 °C and 35 °C. Data are mean of cumulative release rates ± stand error (SE). Error bars represent the SE (N = 3); Table S2: Release kinetics of Pyr and GO-Pyr nanocomposite at pH 5, pH 7 and pH 9. Data are mean of cumulative release rates ± SE. Error bars represent the SE (N = 3); Figure S1: Inhibitory activities of single fungicides or in combination with GO at different mass ratios against mycelial growth of F. graminearum. Data are mean ± stand error (SE). Error bars represent the SE (N = 3). Different lower case letters indicate significant differences between treatments (p < 0.05); Figure S2: HPLC standard curves of Pyr; Figure S3: Loading capacity of Pyr on GO at different concentration ratio; Figure S4: Images of GO-Pyr under storage of 0 °C and 54 °C; Figure S5: Images of GO-Pyr in 2 years of storage.

Author Contributions

Conceptualization, F.P. and X.W.; methodology, W.Z., C.C.; software, X.S., C.C.; validation, C.C. and W.H.; formal analysis, W.Z. and X.S.; investigation, X.X. and X.L.; resources, J.L. and X.W.; data curation, X.X. and X.L.; writing-original draft preparation, F.P. and X.W.; writing-review and editing, X.W. and C.C.; visualization, J.L.; supervision, X.W.; project administration, J.L.; funding acquisition, J.L. and X.W. All authors have read and agreed to the published version of the manuscript.

Funding

This work was supported by National Key Research and Development Program (2020YFD1000901), Key Research and Development Program of Hebei Province (21326507D), the Research Foundation of Education Bureau of Hebei Province (ZD2021051).

Data Availability Statement

Data presented in this article are available at request from the corresponding author.

Conflicts of Interest

The authors declare no conflict of interest.

References

  1. Leong, W.-H.; Teh, S.-Y.; Hossain, M.M.; Nadarajaw, T.; Zabidi-Hussin, Z.; Chin, S.-Y.; Lai, K.-S.; Lim, S.-H.E. Application, monitoring and adverse effects in pesticide use: The importance of reinforcement of Good Agricultural Practices (GAPs). J. Environ. Manag. 2020, 260, 109987. [Google Scholar] [CrossRef] [PubMed]
  2. Foong, S.Y.; Ma, N.L.; Su, S.L.; Peng, W.; Sonne, C. A recent global review of hazardous chlorpyrifos pesticide in fruit and vegetables: Prevalence, remediation and actions needed. J. Hazard. Mater. 2020, 400, 123006. [Google Scholar] [CrossRef] [PubMed]
  3. Xiao, S.; Gong, Y.; Li, Z.; Fantke, P. Improving Pesticide Uptake Modeling into Potatoes: Considering Tuber Growth Dynamics. J. Agric. Food Chem. 2021, 69, 3607–3616. [Google Scholar] [CrossRef] [PubMed]
  4. Smith, H.H.; Idris, O.A.; Maboeta, M.S. Global Trends of Green Pesticide Research from 1994 to 2019: A Bibliometric Analysis. J. Toxicol. 2021, 2021, 6637516. [Google Scholar] [CrossRef]
  5. Khodabandeh, Z.; Etebari, M.; Aliomrani, M. Study of the probable genotoxic effects of Zolone (Phosalone) exposure in mice bone marrow derived cells. Genes Environ. 2021, 43, 18. [Google Scholar] [CrossRef]
  6. Spielman-Sun, E.; Avllan, A.; Bland, G.D.; Clement, E.T.; Tappero, R.V.; Acerbo, A.S.; Lowry, G.V. Protein coating composition targets nanoparticles to leaf stomata and trichomes. Nanoscale 2020, 12, 3630–3636. [Google Scholar] [CrossRef]
  7. Zhao, M.; Zhou, H.; Hao, L.; Chen, H.; Zhou, X. Natural rosin modified carboxymethyl cellulose delivery system with lowered toxicity for long-term pest control. Carbohydr. Polym. 2021, 259, 117749. [Google Scholar] [CrossRef]
  8. Willkommen, S.; Lange, J.; Ulrich, U.; Pfannerstill, M.; Fohrer, N. Field insights into leaching and transformation of pesticides and fluorescent tracers in agricultural soil. Sci. Total Environ. 2021, 751, 141658. [Google Scholar] [CrossRef]
  9. Oginawati, K.; Susetyo, S.H.; Rahmawati, S.I.; Kurniawan, S.B.; Abdullah, S. Distribution of organochlorine pesticide pollution in water, sediment, mollusk, and fish at Saguling Dam, West Java, Indonesia. Toxicol. Res. 2021, 1–4, 1–9. [Google Scholar] [CrossRef]
  10. Gentil, C.; Fantke, P.; Mottes, C.; Basset-Mens, C. Challenges and ways forward in pesticide emission and toxicity characterization modeling for tropical conditions. Int. J. Life Cycle Assess. 2020, 25, 1290–1306. [Google Scholar] [CrossRef]
  11. Lykogianni, M.; Bempelou, E.; Karamaouna, F.; Aliferis, K.A. Do pesticides promote or hinder sustainability in agriculture? The challenge of sustainable use of pesticides in modern agriculture. Sci. Total Environ. 2021, 795, 148625. [Google Scholar] [CrossRef] [PubMed]
  12. Isah, H.M.; Raimi, M.O.; Sawyerr, H.O. Patterns of Chemical Pesticide Use and Determinants of Self-Reported Symptoms on Farmers Health: A Case Study in Kano State for Kura Local Government Area of Nigeria. Soc. Sci. Electron. Publ. 2021, 2, 12. [Google Scholar]
  13. Xu, C.L.; Cao, L.D.; Bilal, M.; Cao, C.; Zhao, P.Y.; Zhang, H.J.; Huang, Q.L. Multifunctional Manganese-Based Carboxymethyl Chitosan Hydrogels for pH-Triggered Pesticide Release and Enhanced Fungicidal Activity. Carbohydr. Polym. 2021, 262, 117933. [Google Scholar] [CrossRef] [PubMed]
  14. Xin, X.P.; Judy, J.D.; Sumerlin, B.B.; He, Z.L. Nano-enabled agriculture: From nanoparticles to smart nanodelivery systems. Environ. Chem. 2020, 17, 413–425. [Google Scholar] [CrossRef]
  15. Singh, A.; Dhiman, N.; Kar, A.K.; Singh, D.; Patnaik, S. Advances in Controlled Release Pesticide Formulations: Prospects to Safer Integrated Pest Management and Sustainable Agriculture. J. Hazard. Mater. 2019, 385, 121525. [Google Scholar] [CrossRef] [PubMed]
  16. Dangi, K.; Verma, A.K. Efficient & eco-friendly smart nano-pesticides: Emerging prospects for agriculture. Mater. Today Proc. 2021, 45, 3819–3824. [Google Scholar]
  17. Wang, Y.; Li, C.N.; Wang, T.; Li, X.G. Polylactic Acid–Graphene Oxide-based Materials for Loading and Sustained Release of Poorly Soluble Pesticides. Langmuir 2020, 36, 12336–12345. [Google Scholar] [CrossRef]
  18. Xu, C.L.; Shan, Y.P.; Bilal, M.; Xu, B.; Cao, L.D.; Huang, Q.L. Copper Ions Chelated Mesoporous Silica Nanoparticles via Dopamine Chemistry for Controlled Pesticide Release Regulated by Coordination Bonding. Chem. Eng. J. 2020, 395, 125093. [Google Scholar] [CrossRef]
  19. Dong, J.T.; Chen, W.; Feng, J.G.; Liu, X.Q.; Xu, Y.; Wang, C.; Yang, W.C.; Du, X.Z. Facile, Smart, and Degradable Metal-Organic Framework Nanopesticides Gated with FeIII-Tannic Acid Networks in Response to Seven Biological and Environmental Stimuli. ACS Appl. Mater. Interfaces 2021, 13, 19507–19520. [Google Scholar] [CrossRef]
  20. Zhu, X.Q.; Zhang, J.Y.; Xie, Q.; Hou, Z.L. High Sensitivity and Ultrafast Response Ethanol Sensors Based on Graphene Oxide. ACS Appl. Mater. Interfaces 2020, 12, 38708–38713. [Google Scholar] [CrossRef]
  21. Chaudhary, K.; Kumar, K.; Venkatesu, P.; Masram, D.T. Protein immobilization on graphene oxide or reduced graphene oxide surface and their applications: Influence over activity, structural and thermal stability of protein. Adv. Colloid Interfacs 2021, 289, 102367. [Google Scholar] [CrossRef] [PubMed]
  22. Song, S.J.; Wang, Y.L.; Xie, J.; Sun, B.H.; Zhou, N.L.; Shen, H.; Shen, J. Carboxymethyl Chitosan Modified Carbon Nanoparticle for Controlled Emamectin Benzoate Delivery: Improved Solubility, pH-Responsive Release, and Sustainable Pest Control. ACS Appl. Mater. Interfaces 2019, 11, 34258–34267. [Google Scholar] [CrossRef] [PubMed]
  23. Tong, Y.J.; Shao, L.H.; Li, X.L.; Lu, J.Q.; Sun, H.L.; Xiang, S.; Zhang, Z.H.; Wu, Y.; Wu, X.M. Adhesive and Stimulus-Responsive Polydopamine-Coated Graphene Oxide System for Pesticide-Loss Control. J. Agric. Food Chem. 2018, 66, 2616–2622. [Google Scholar] [CrossRef] [PubMed]
  24. Muda, M.S.; Kamari, A.; Bakar, S.A.; Yusoff, S.N.M.; Fatimah, I.; Phillip, E.; Din, S.M. Chitosan-graphene oxide nanocomposites as water-solubilising agents for rotenone pesticide. J. Mol. Liq. 2020, 318, 114066. [Google Scholar] [CrossRef]
  25. Gao, X.D.; Shi, F.Y.; Peng, F.; Shi, X.J.; Cheng, C.H.; Hou, W.L.; Xie, H.C.; Lin, X.H.; Wang, X.P. Formulation of nanopesticide with graphene oxide as the nanocarrier of pyrethroid pesticide and its application in spider mite control. RSC Adv. 2021, 11, 36089–36097. [Google Scholar] [CrossRef]
  26. Dominguez, A.N.; Emmert, G.E.; Gil, D.M.; Alvarez, R.M.S. Experimental and theoretical vibrational study of the fungicide pyraclostrobin. Spectrochim. Acta A 2021, 259, 119888. [Google Scholar] [CrossRef]
  27. Hummers, W.S.; Offeman, R.E. Preparation of graphitic oxide. J. Am. Chem. Soc. 1958, 80, 1339. [Google Scholar] [CrossRef]
  28. Wang, X.P.; Peng, F.; Cheng, C.H.; Chen, L.N.; Shi, X.J.; Gao, X.D.; Li, J. Synergistic Antifungal Activity of Graphene Oxide and Fungicides against Fusarium Head Blight In Vitro and In Vivo. Nanomaterials 2021, 11, 2393. [Google Scholar] [CrossRef]
  29. Wu, W.N.; Wan, M.H.; Fei, Q.; Tian, Y.; Song, S.J.; Shen, H.; Shen, J. PDA@Ti3C2Tx as a Novel Carrier for Pesticide Delivery and its Application in Plant Protection: NIR-Responsive Controlled Release and Sustained Antipest Activity. Pest Manag. Sci. 2021, 77, 4960–4970. [Google Scholar] [CrossRef]
  30. Xiang, Y.B.; Zhang, G.L.; Chen, C.E.; Liu, B.; Cai, D.Q.; Wu, Z.Y. Fabrication a pH-responsively controlled-release pesticide using an attapulgite-based hydrogel. ACS Sustain. Chem. Eng. 2018, 6, 1192–1201. [Google Scholar] [CrossRef]
  31. Wang, C.X.; Guo, L.; Yao, J.W.; Wang, A.Q.; Gao, F.; Zhao, X.; Zeng, Z.H.; Wang, Y.; Sun, C.J.; Cui, H.X.; et al. Preparation, characterization and antifungal activity of pyraclostrobin solid nanodispersion by self-emulsifying technique. Pest Manag. Sci. 2019, 75, 2785–2793. [Google Scholar] [CrossRef] [PubMed]
  32. Song, S.J.; Wan, M.H.; Feng, W.L.; Zhang, J.; Mo, H.; Jiang, X.F.; Shen, H.; Shen, J. Graphene Oxide as the Potential Vector of Hydrophobic Pesticides: Ultrahigh Pesticide Loading Capacity and Improved Antipest Activity. ACS Agric. Sci. Technol. 2021, 1, 182–191. [Google Scholar] [CrossRef]
  33. Shao, J.J.; Pei, Z.J.; Jing, H.J.; Wang, L.; Jiang, C.Y.; Du, X.J.; Jiang, C.; Lou, Z.X.; Wang, H.X. Antifungal activity of myriocin against Fusarium graminearum and its inhibitory effect on deoxynivalenol production in wheat grains. Physiol. Mol. Plant Pathol. 2021, 114, 101635. [Google Scholar] [CrossRef]
  34. Xu, Y.B.; Li, H.P.; Zhang, J.B.; Song, B.; Chen, F.F.; Duan, X.J.; Xu, H.Q.; Liao, Y.C. Disruption of the chitin synthase gene CHS1 from Fusariumasiaticum results in an altered structure of cell walls and reduced virulence. Fungal Genet. Biol. 2010, 47, 205–215. [Google Scholar] [CrossRef] [PubMed]
  35. Stack, R.W.; Mcmullen, M.P. A Visual Scale to Estimate Severity of Fusarium Head Blight in Wheat; NDSU Extension Service: Cass County, ND, USA, 1998; Volume 701, p. 1095. [Google Scholar]
  36. Liang, W.L.; Xie, Z.G.; Cheng, J.L.; Xiao, D.X.; Xiong, Q.Y.; Wang, Q.W.; Zhao, J.H.; Gui, W.J. A Light-Triggered pH-Responsive Metal—Organic Framework for Smart Delivery of Fungicide to Control Sclerotinia Diseases of Oilseed Rape. ACS Nano 2021, 15, 6987–6997. [Google Scholar] [CrossRef]
  37. Sun, Y. Analysis of joint action of insecticides against house flies. J. Econ. Entomol. 1960, 53, 887–892. [Google Scholar] [CrossRef]
  38. Zhang, S.D.; Wang, H.H.; Liu, J.P.; Bao, C.L. Measuring the specific surface area of monolayer graphene oxide in water. Mater. Lett. 2020, 15, 127098. [Google Scholar] [CrossRef]
  39. Esmaeili, A.; Entezari, M.H. Facile and fast synthesis of graphene oxide nanosheets via bath ultrasonic irradiation. J. Colloid Interface Sci. 2014, 432, 19–25. [Google Scholar] [CrossRef]
  40. Ganya, E.S.; Moloi, S.J.; Ray, S.C.; Pong, W.F. Tuning the electronic and magnetic properties of PEDOT-PSS-coated graphene oxide nanocomposites for biomedical applications. J. Mater. Res. 2020, 35, 2478–2490. [Google Scholar] [CrossRef]
  41. Kamal, M.A.; Bibi, S.; Bokhari, S.W.; Siddique, A.H.; Yasin, T. Synthesis and adsorptive characteristics of novel chitosan/graphene oxide nanocomposite for dye uptake. React. Funct. Polym. 2016, 110, 21–29. [Google Scholar] [CrossRef]
  42. Deng, C.H.; Gong, J.L.; Zeng, G.M.; Niu, C.G.; Niu, Q.Y.; Zhang, W.; Liu, H.Y. Inactivation performance and mechanism of Escherichia coli in aqueous system exposed to iron oxide loaded graphene nanocomposites. J. Hazard. Mater. 2014, 276, 66–76. [Google Scholar] [CrossRef] [PubMed]
  43. Qin, H.; Zhang, H.; Li, L.X.; Zhou, X.T.; Li, J.P.; Kan, C.Y. Preparation and properties of lambda-cyhalothrin/polyurethane drug-loaded nanoemulsions. RSC Adv. 2017, 7, 52684–52693. [Google Scholar] [CrossRef] [Green Version]
  44. Singh, A.; Kar, A.K.; Singh, D.; Verma, R.; Shraogi, N.; Zehra, A.; Gautam, K.; Anbumani, S.; Ghosh, D.; Patnaik, S. pH-responsive eco-friendly chitosan modified cenosphere/alginate composite hydrogel beads as carrier for controlled release of Imidacloprid towards sustainable pest control. Chem. Eng. J. 2022, 427, 131215. [Google Scholar] [CrossRef]
  45. Huong, P.T.L.; Tu, N.; Lan, H.; Thang, L.H.; Quy, N.V.; Tuan, P.A.; Dinh, N.X.; Phan, V.N.; Le, A.T. Functional manganese ferrite/graphene oxide nanocomposites: Effects of grapheme oxide on the adsorption mechanisms of organic MB dye and inorganic As(V) ions from aqueous solution. Rsc Adv. 2018, 8, 12376–12389. [Google Scholar] [CrossRef] [Green Version]
  46. Foschi, M.; Capasso, P.; Maggi, M.A.; Ruggieri, F.; Fioravanti, G. Experimental design and response surface methodology applied to graphene oxide reduction for adsorption of triazine herbicides. ACS Omega 2021, 6, 16943–16954. [Google Scholar] [CrossRef]
  47. Song, S.J.; Jiang, X.F.; Shen, H.; Wu, W.N.; Shi, Q.Q.; Wan, M.H.; Zhang, J.; Mo, H.; Shen, J. MXene (Ti3C2) Based Pesticide Delivery System for Sustained Release and Enhanced Pest Control. ACS Appl. Bio Mater. 2021, 4, 6912–6923. [Google Scholar] [CrossRef]
  48. Kumar, A.; Kanwar, R.; Mehta, S.K. Eucalyptus Oil-Based Nanoemulsion: A Potent Green Nanowagon for Controlled Delivery of Emamectin Benzoate. ACS Agric. Sci. Technol. 2021, 1, 76–88. [Google Scholar] [CrossRef]
  49. Wang, Y.L.; Song, S.J.; Chu, X.H.; Feng, W.L.; Li, J.; Huang, X.R.; Zhou, N.L.; Shen, J. A new temperature-responsive controlled-release pesticide formulation–poly(N-isopropyl acrylamide) modified graphene oxide as the nanocarrier for lambda-cyhalothrin delivery and their application in pesticide transportation. Colloids Surf. A Physiochem. Eng. Asp. 2021, 612, 125987. [Google Scholar] [CrossRef]
Figure 1. Morphological characterization of GO and formulated GO–Pyr nanocomposite. AFM images of GO (a), TEM images of GO (b), BET specific surface area of GO (c), SEM images of GO (d), Pyr (e), and GO–Pyr (f) at a mass ratio of 1:1.
Nanomaterials 12 01112 g001
Figure 2. FT–IR spectra of GO, Pyr and GO–Pyr.
Nanomaterials 12 01112 g002
Figure 3. TGA curves of GO and GO–Pyr nanocomposite.
Nanomaterials 12 01112 g003
Figure 4. Release kinetics of Pyr and GO–Pyr nanocomposite at 25 °C (a), 30 °C (b) and 35 °C (c). Data are mean of cumulative release rate ± SE (N = 3).
Nanomaterials 12 01112 g004
Figure 5. Release kinetics of Pyr and GO–Pyr nanocomposite at pH 5 (a), pH 7 (b) and pH 9 (c). Data are mean of cumulative release rate ± SE (N = 3).
Nanomaterials 12 01112 g005
Figure 6. Storage stability of GO–Pyr nanocomposite. (a) Photos of GO–Pyr at 0 and 48 h, (b) stability of long-term storage, (c) storage stability under low temperature, and (d) storage stability under high temperature.
Nanomaterials 12 01112 g006
Figure 7. Synergistic effects of GO, Pyr and GO–Pyr nanocomposite on the mycelial growth rate of FG (a) and SS (b). Different lower case letters indicate significant differences between treatments (p < 0.05).
Nanomaterials 12 01112 g007
Figure 8. Contact angles of (a) water and (b) GO–Pyr nanocomposite on the surface of paraffin film.
Nanomaterials 12 01112 g008
Table 1. Kinetic parameters of Pyr release from GO–Pyr nanocomposite at 25 °C, 30 °C and 35 °C.
ConditionsHiguchi ModelKorsmeyer-Peppas Model
K (d−0.5)R2K (d−n)nR2
25 °CPyr13.97180.994716.12470.46250.9956
GO–Pyr7.61280.586114.25890.32710.9561
30 °CPyr16.66620.709529.71820.31950.9157
GO–Pyr6.77790.677615.78710.30730.9645
35 °CPyr15.75560.861325.29320.36140.9242
GO–Pyr6.66890.938410.98600.38730.9772
Table 2. Kinetic parameters of Pyr release from GO–Pyr nanocomposite at pH 5.0, 6.0 and 7.0.
ConditionsHiguchi ModelKorsmeyer-Peppas Model
K (d−0.5)R2K (d−n)nR2
pH 5.0Pyr16.12240.947019.96610.43320.9527
GO–Pyr5.59890.873714.69240.31100.9833
pH 7.0Pyr18.67390.852339.87910.23850.8612
GO–Pyr7.09090.92579.62020.41540.9792
pH 9.0Pyr20.34560.894638.35650.25530.9741
GO–Pyr6.39010.873411.82480.36190.9566
Table 3. Synergistic effects of GO–Pyr nanocomposite on the mycelial growth of FG and SS.
FungiTreatmentSlop ± SE aEC50(μg/mL)(95% CL) bCTC c
FGGO1.17 ± 0.19
0.83 ± 0.04
415.19(200.41 ~ 860.14)-
-
Pyr4.07(2.37 ~ 6.96)
GO–Pyr1.08 ± 0.114.03(3.11 ~ 5.24)196.65
SSGO0.90 ± 0.08
0.59 ± 0.06
281.57(195.44 ~ 405.66)-
-
Pyr24.82(18.80 ~ 32.78)
GO–Pyr1.32 ± 0.4119.10(8.18 ~ 44.58)238.92
a Slope of the probit mortality line. b EC50 values and data in brackets are 95% confidence limits (CL). c According to the CTF formula, CTC significantly greater than 100 indicates synergistic interaction; that significantly lower than 100 represents antagonistic interaction; and that approximate to 100 indicates additive interaction.
Table 4. Control efficacy of GO, Pyr and GO–Pyr nanocomposite on FG and SS under greenhouse conditions (25 °C and 85% humidity).
FungiTreatment
(200 μg/mL)
Disease Incidence (%) (7d)Disease Severity (%) (7d)Control Efficacy (%)
FGCK82.67 ± 0.71a33.62 ± 1.21a-
GO48.67 ± 2.12b27.44 ± 2.79a15.66c
Pyr30.33 ± 0.71c17.98 ± 2.02b43.71b
GO–Pyr24.67 ± 2.83c8.66 ± 0.57c71.35a
SSCK89.00 ± 1.41a27.92 ± 1.47a-
GO74.33 ± 2.12ab19.17 ± 1.05b27.77c
Pyr54.67 ± 0.71bc16.43 ± 1.76b37.58b
GO–Pyr36.67 ± 9.89c9.52 ± 0.18c62.32a
Different lower case letters indicate significant differences between treatments (p < 0.05).
Publisher’s Note: MDPI stays neutral with regard to jurisdictional claims in published maps and institutional affiliations.

