
Simultaneously Enhancing the Strength, Plasticity, and Conductivity of Copper Matrix Composites with Graphene-Coated Submicron Spherical Copper

Abstract
:1. Introduction
2. Experimental
2.1. Materials
2.2. Powder Preparation and Molding
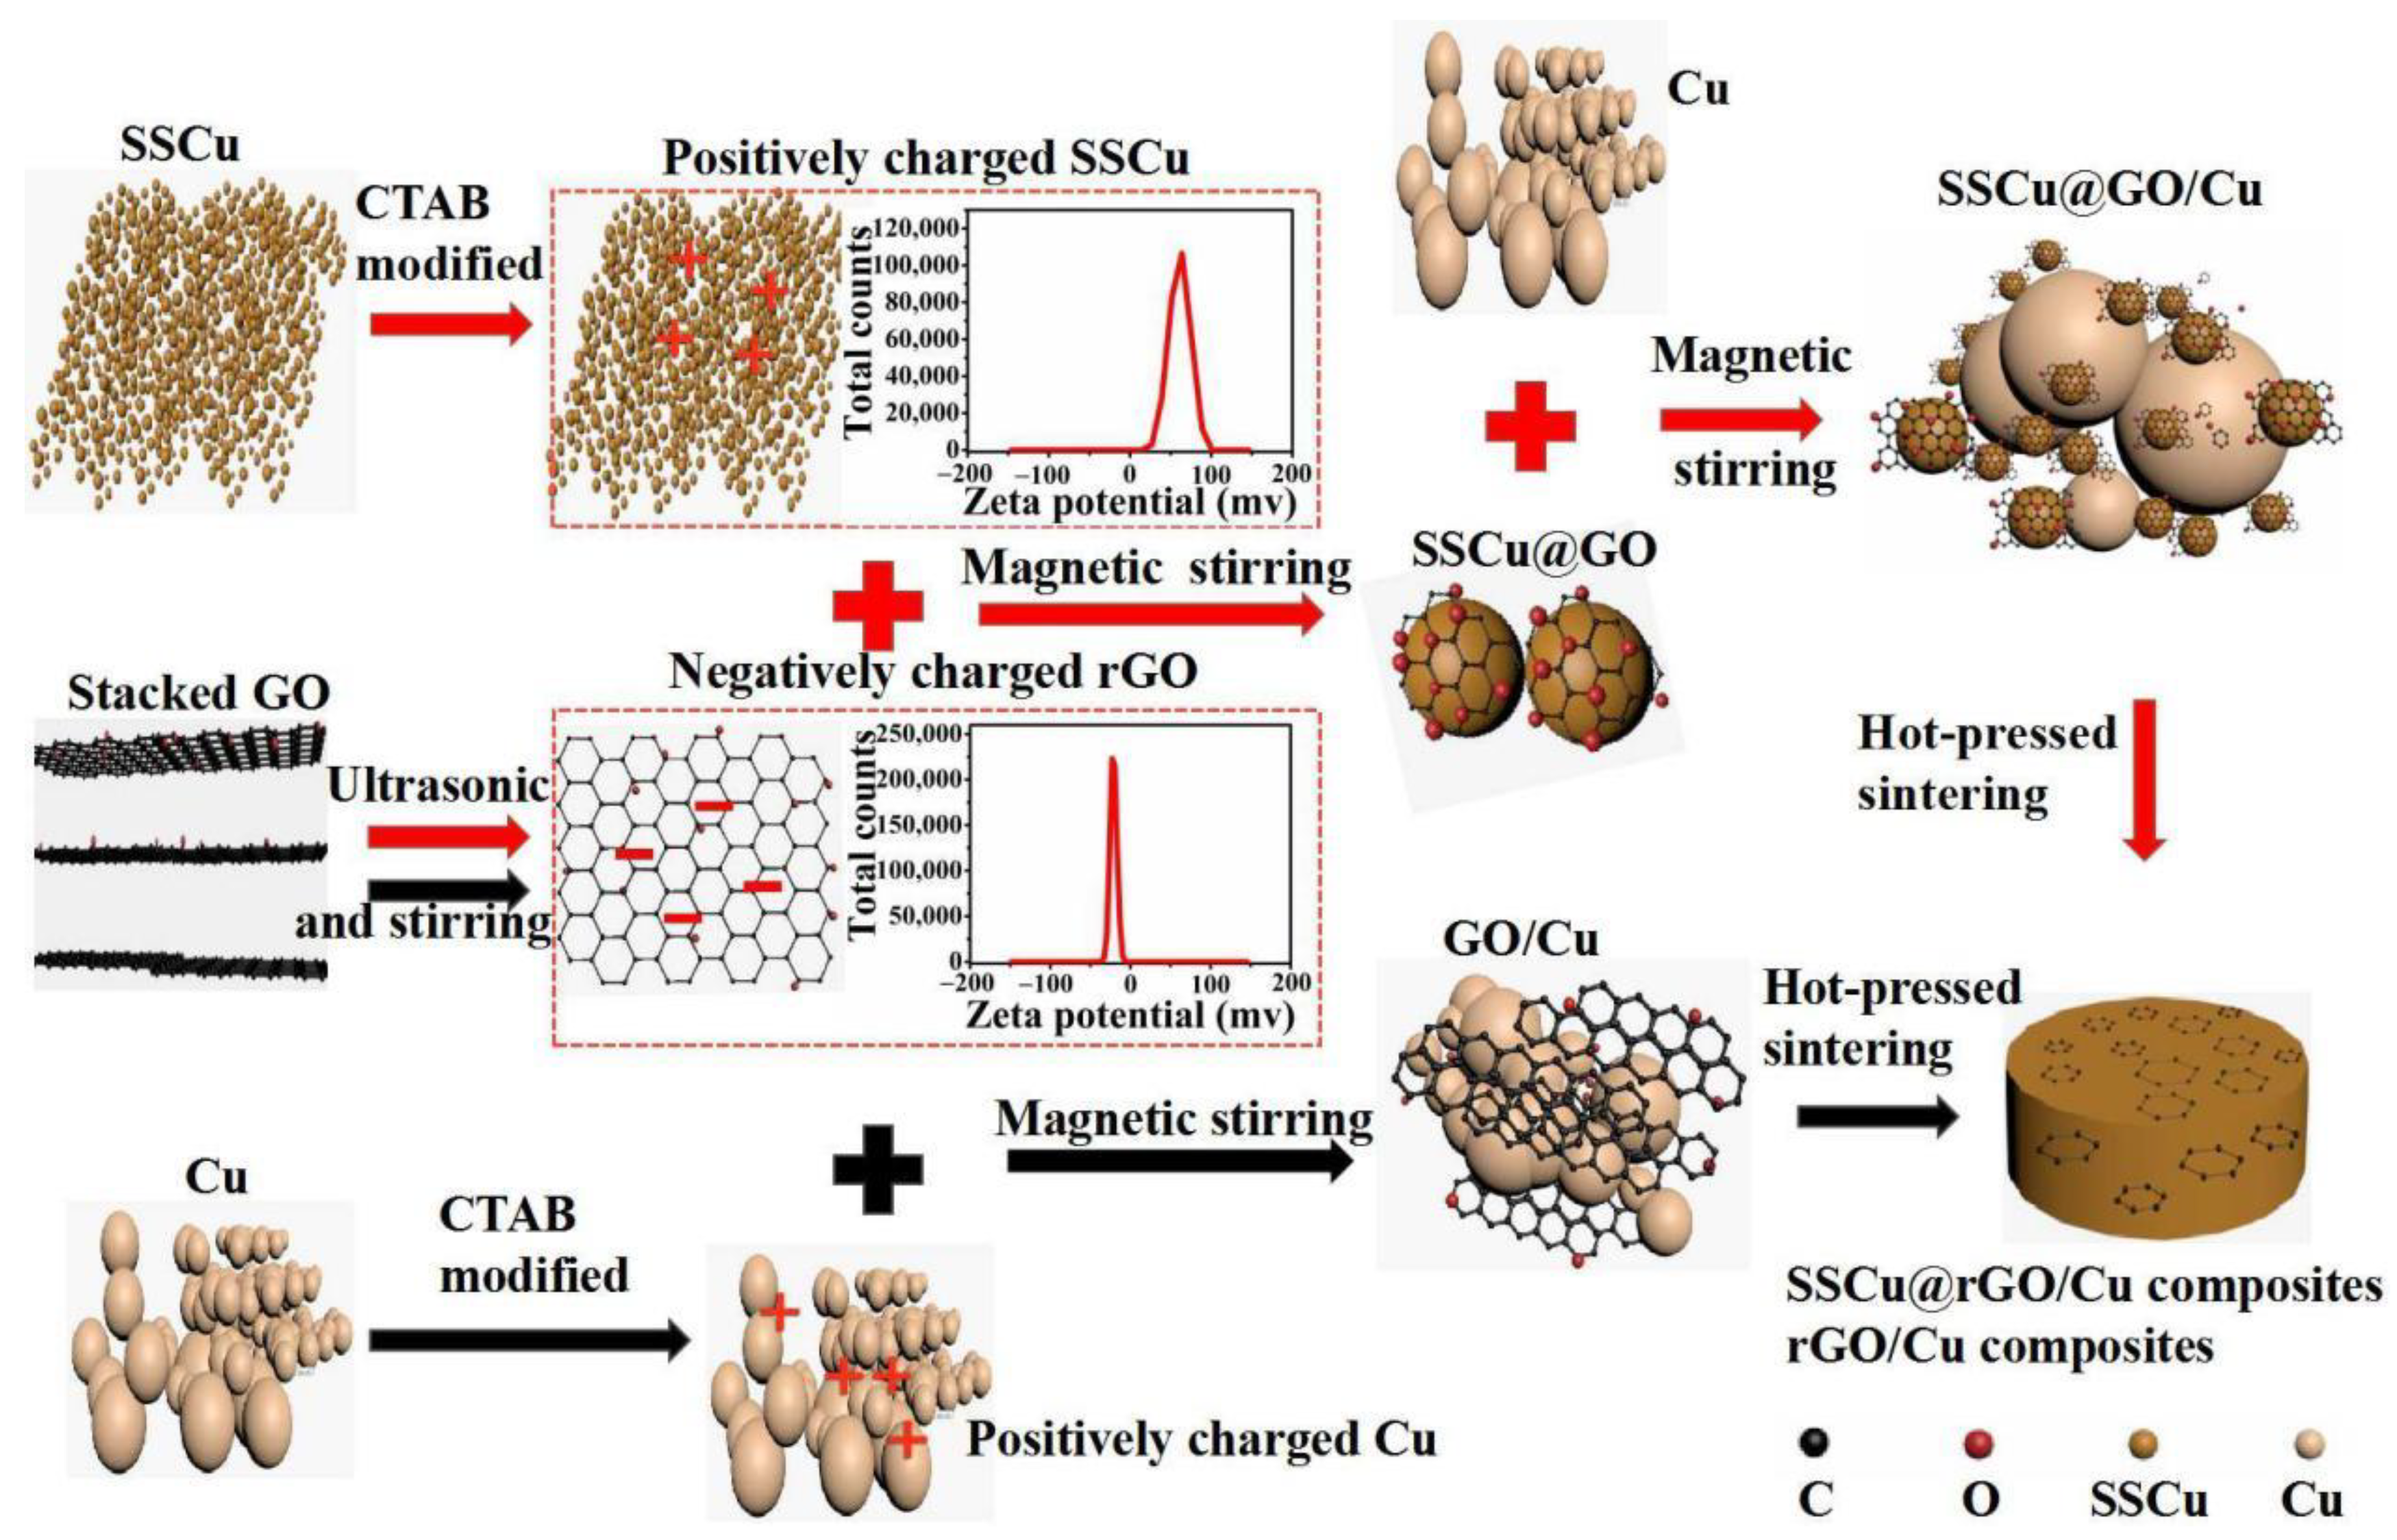
2.2.1. Preparation of the SSCu@GO/Cu Composite Powder
2.2.2. Preparation of the GO/Cu Composite Powder
2.2.3. Preparation of the SSCu@rGO/Cu and rGO/Cu Composites
2.3. Characterization
3. Results and Discussion
3.1. Phase Analysis
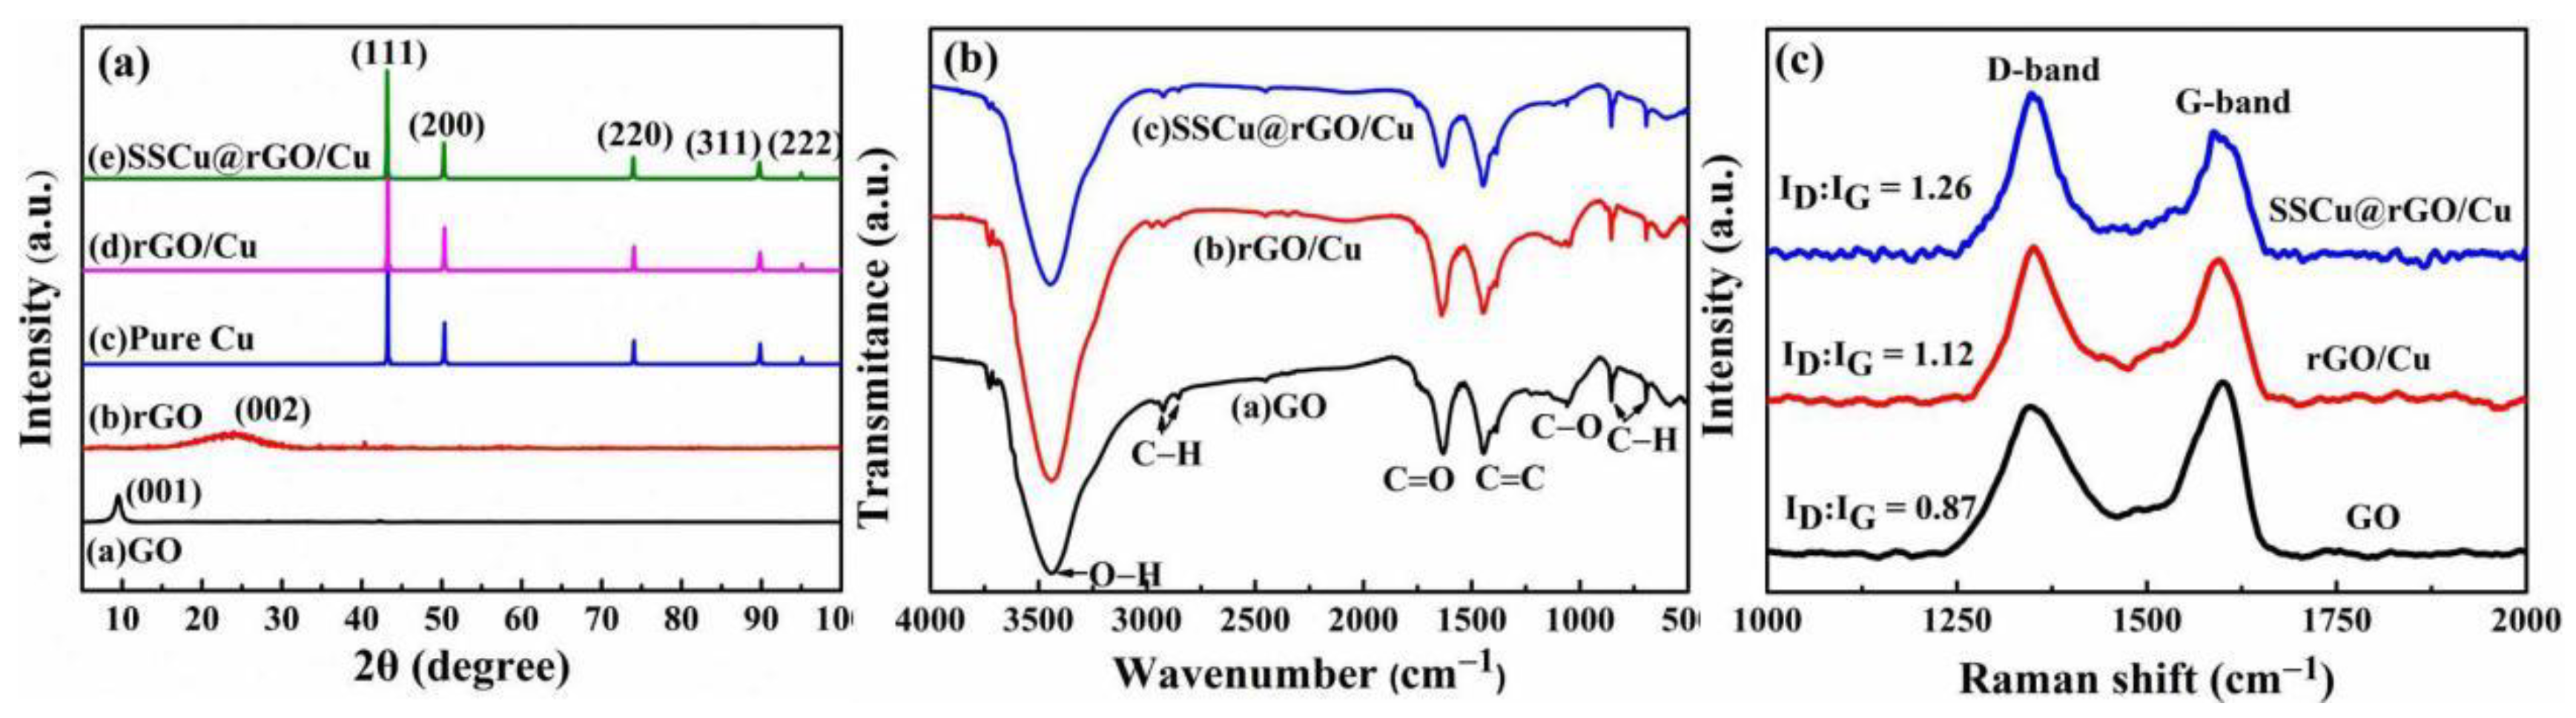
3.1.1. XRD Analysis
3.1.2. FT-IR Analysis
3.1.3. Raman Analysis
3.2. Microstructural Analysis
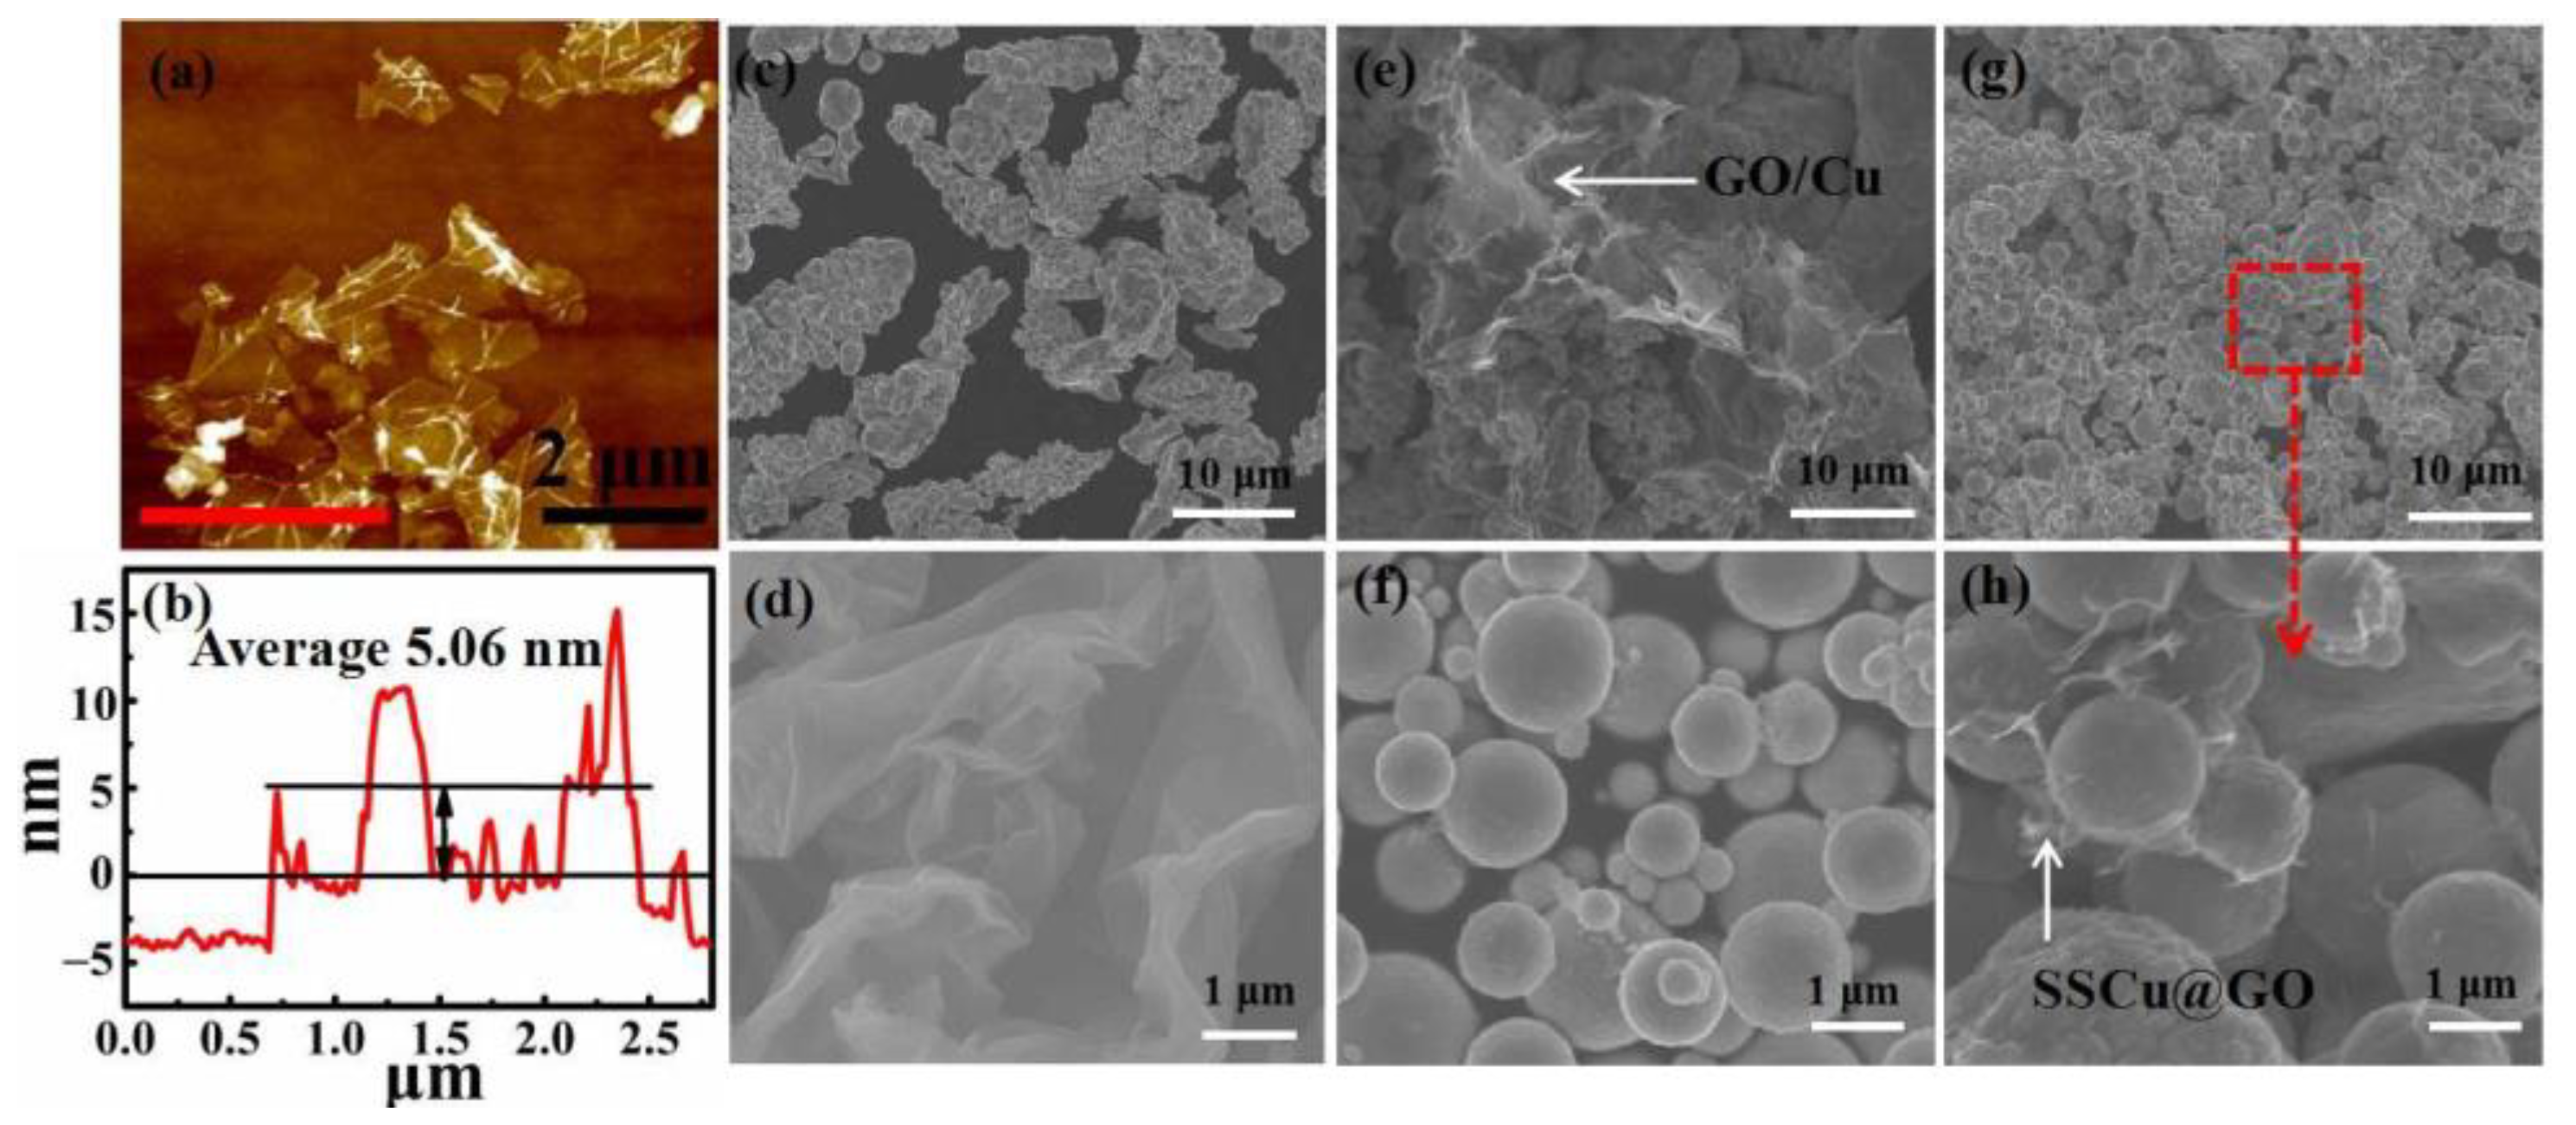
3.2.1. Powder Microstructure
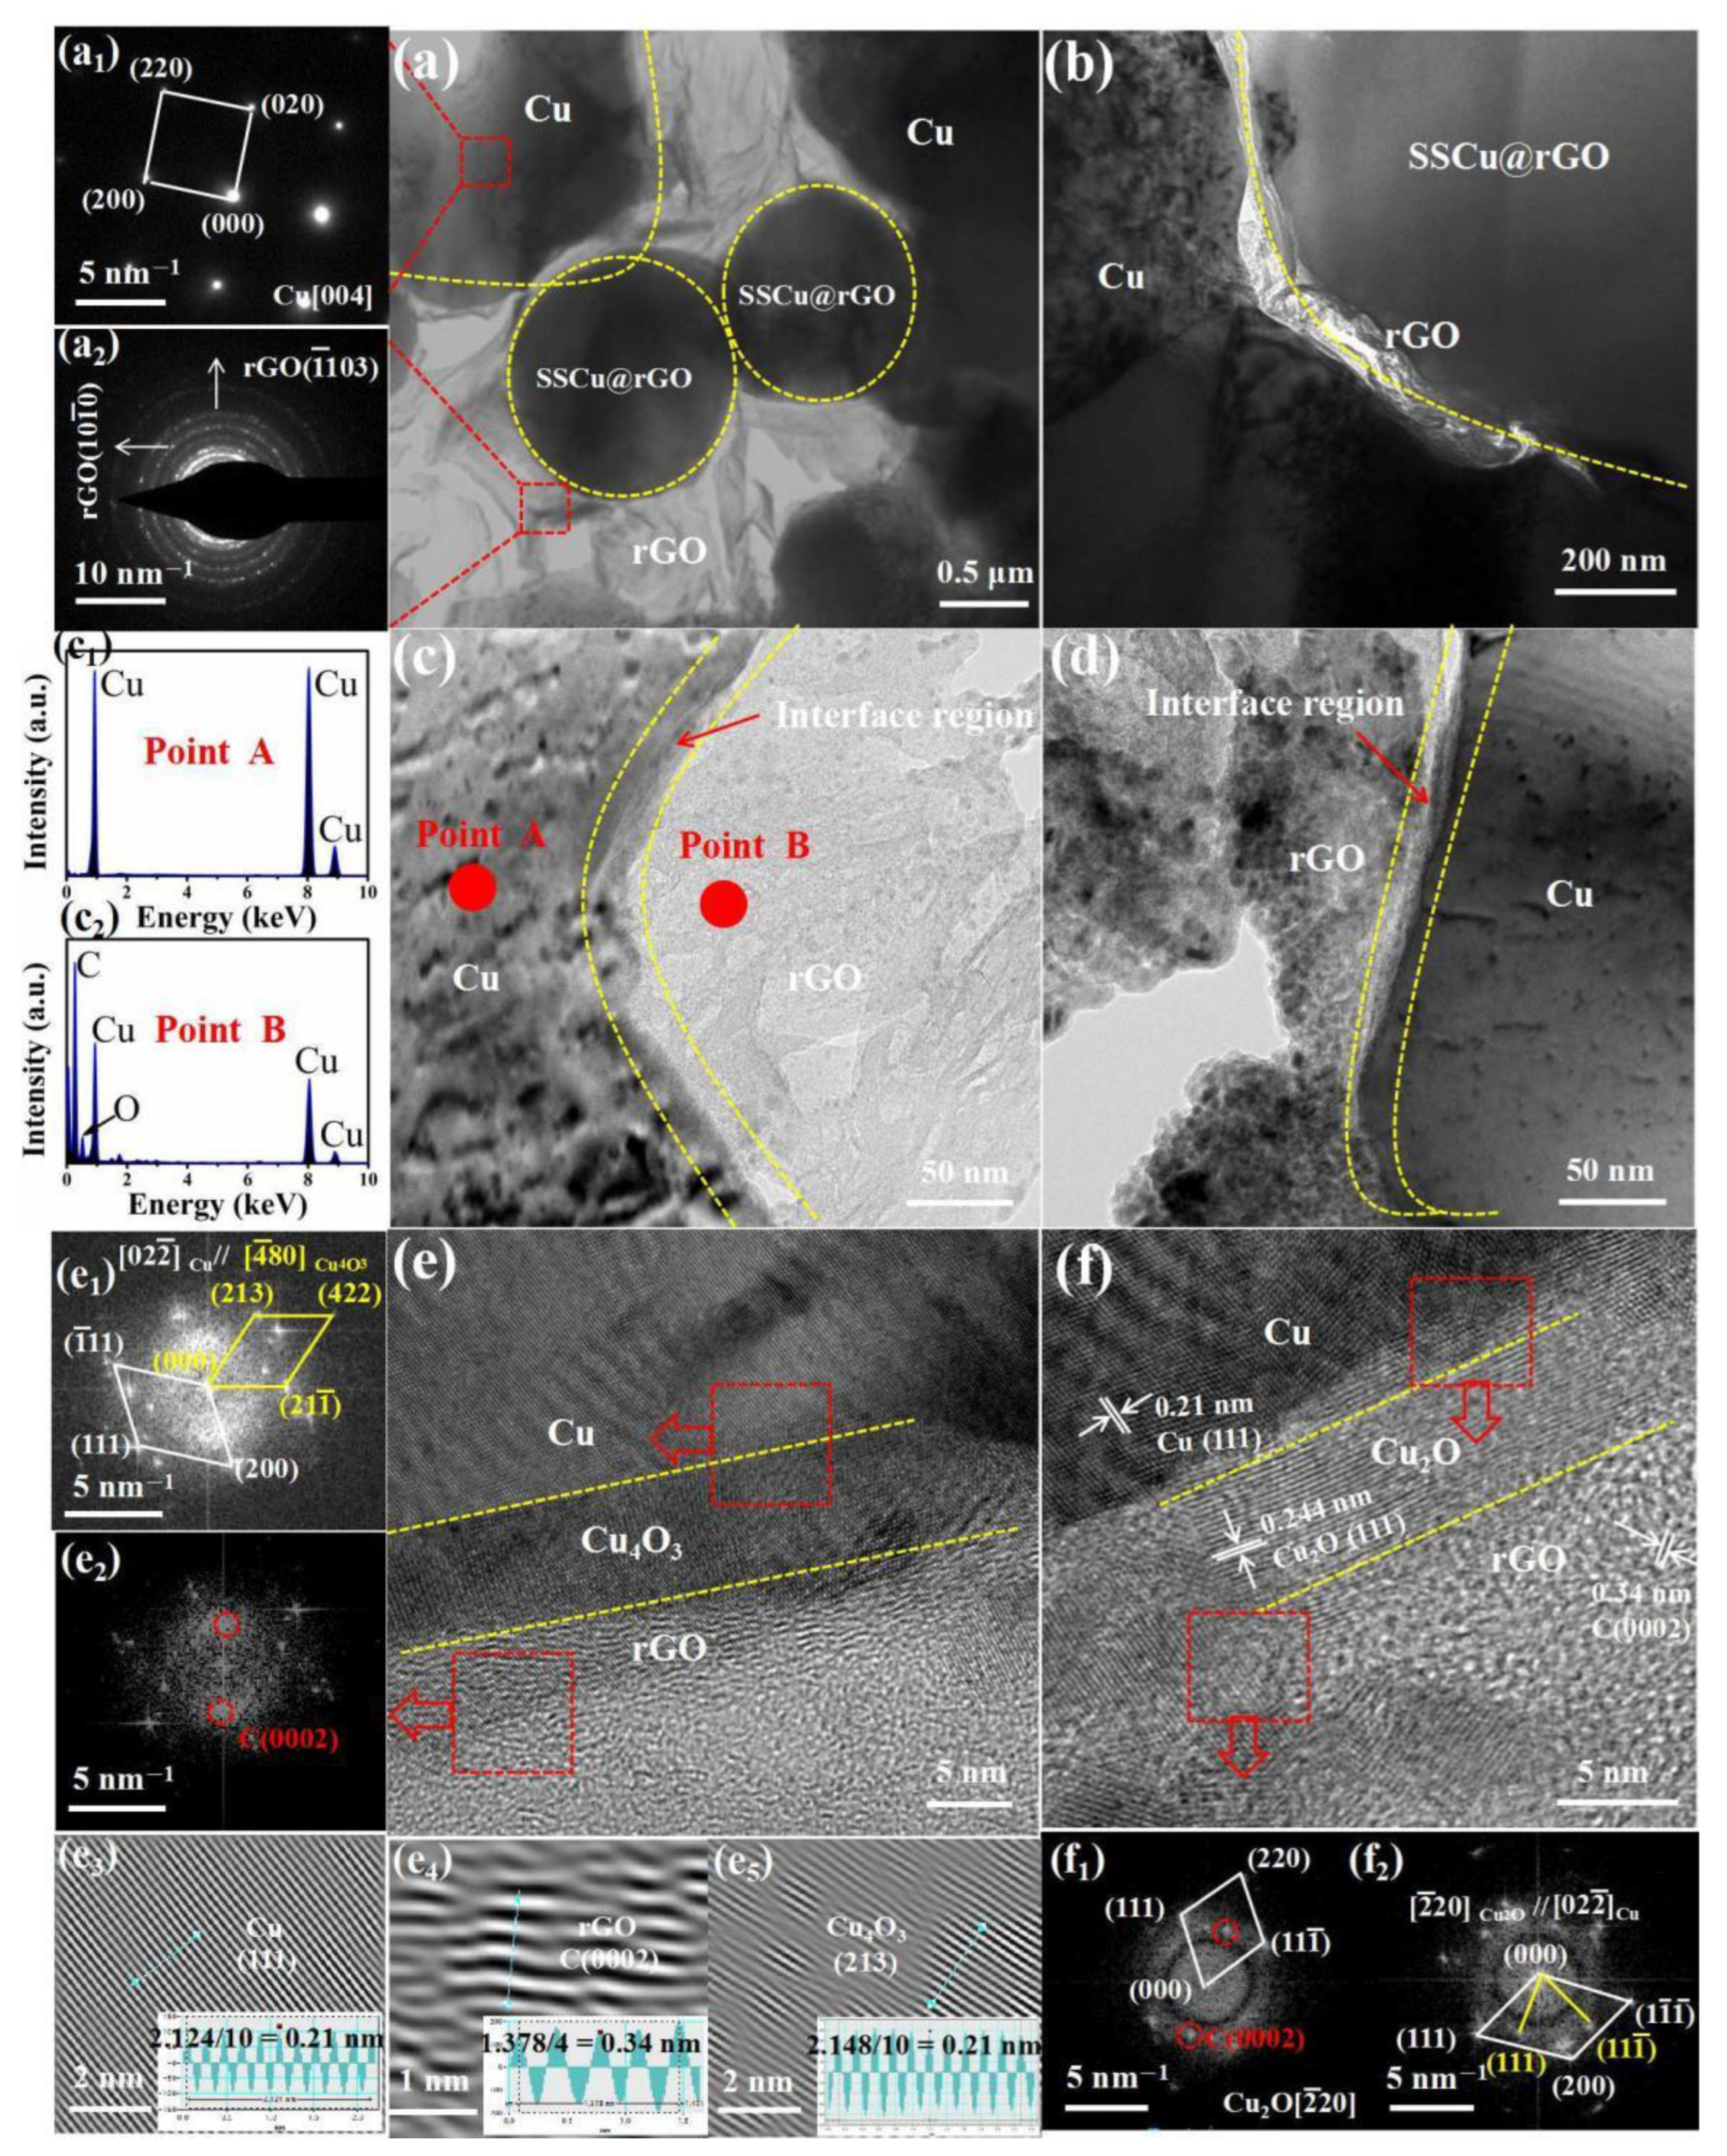
3.2.2. Interface Microstructure
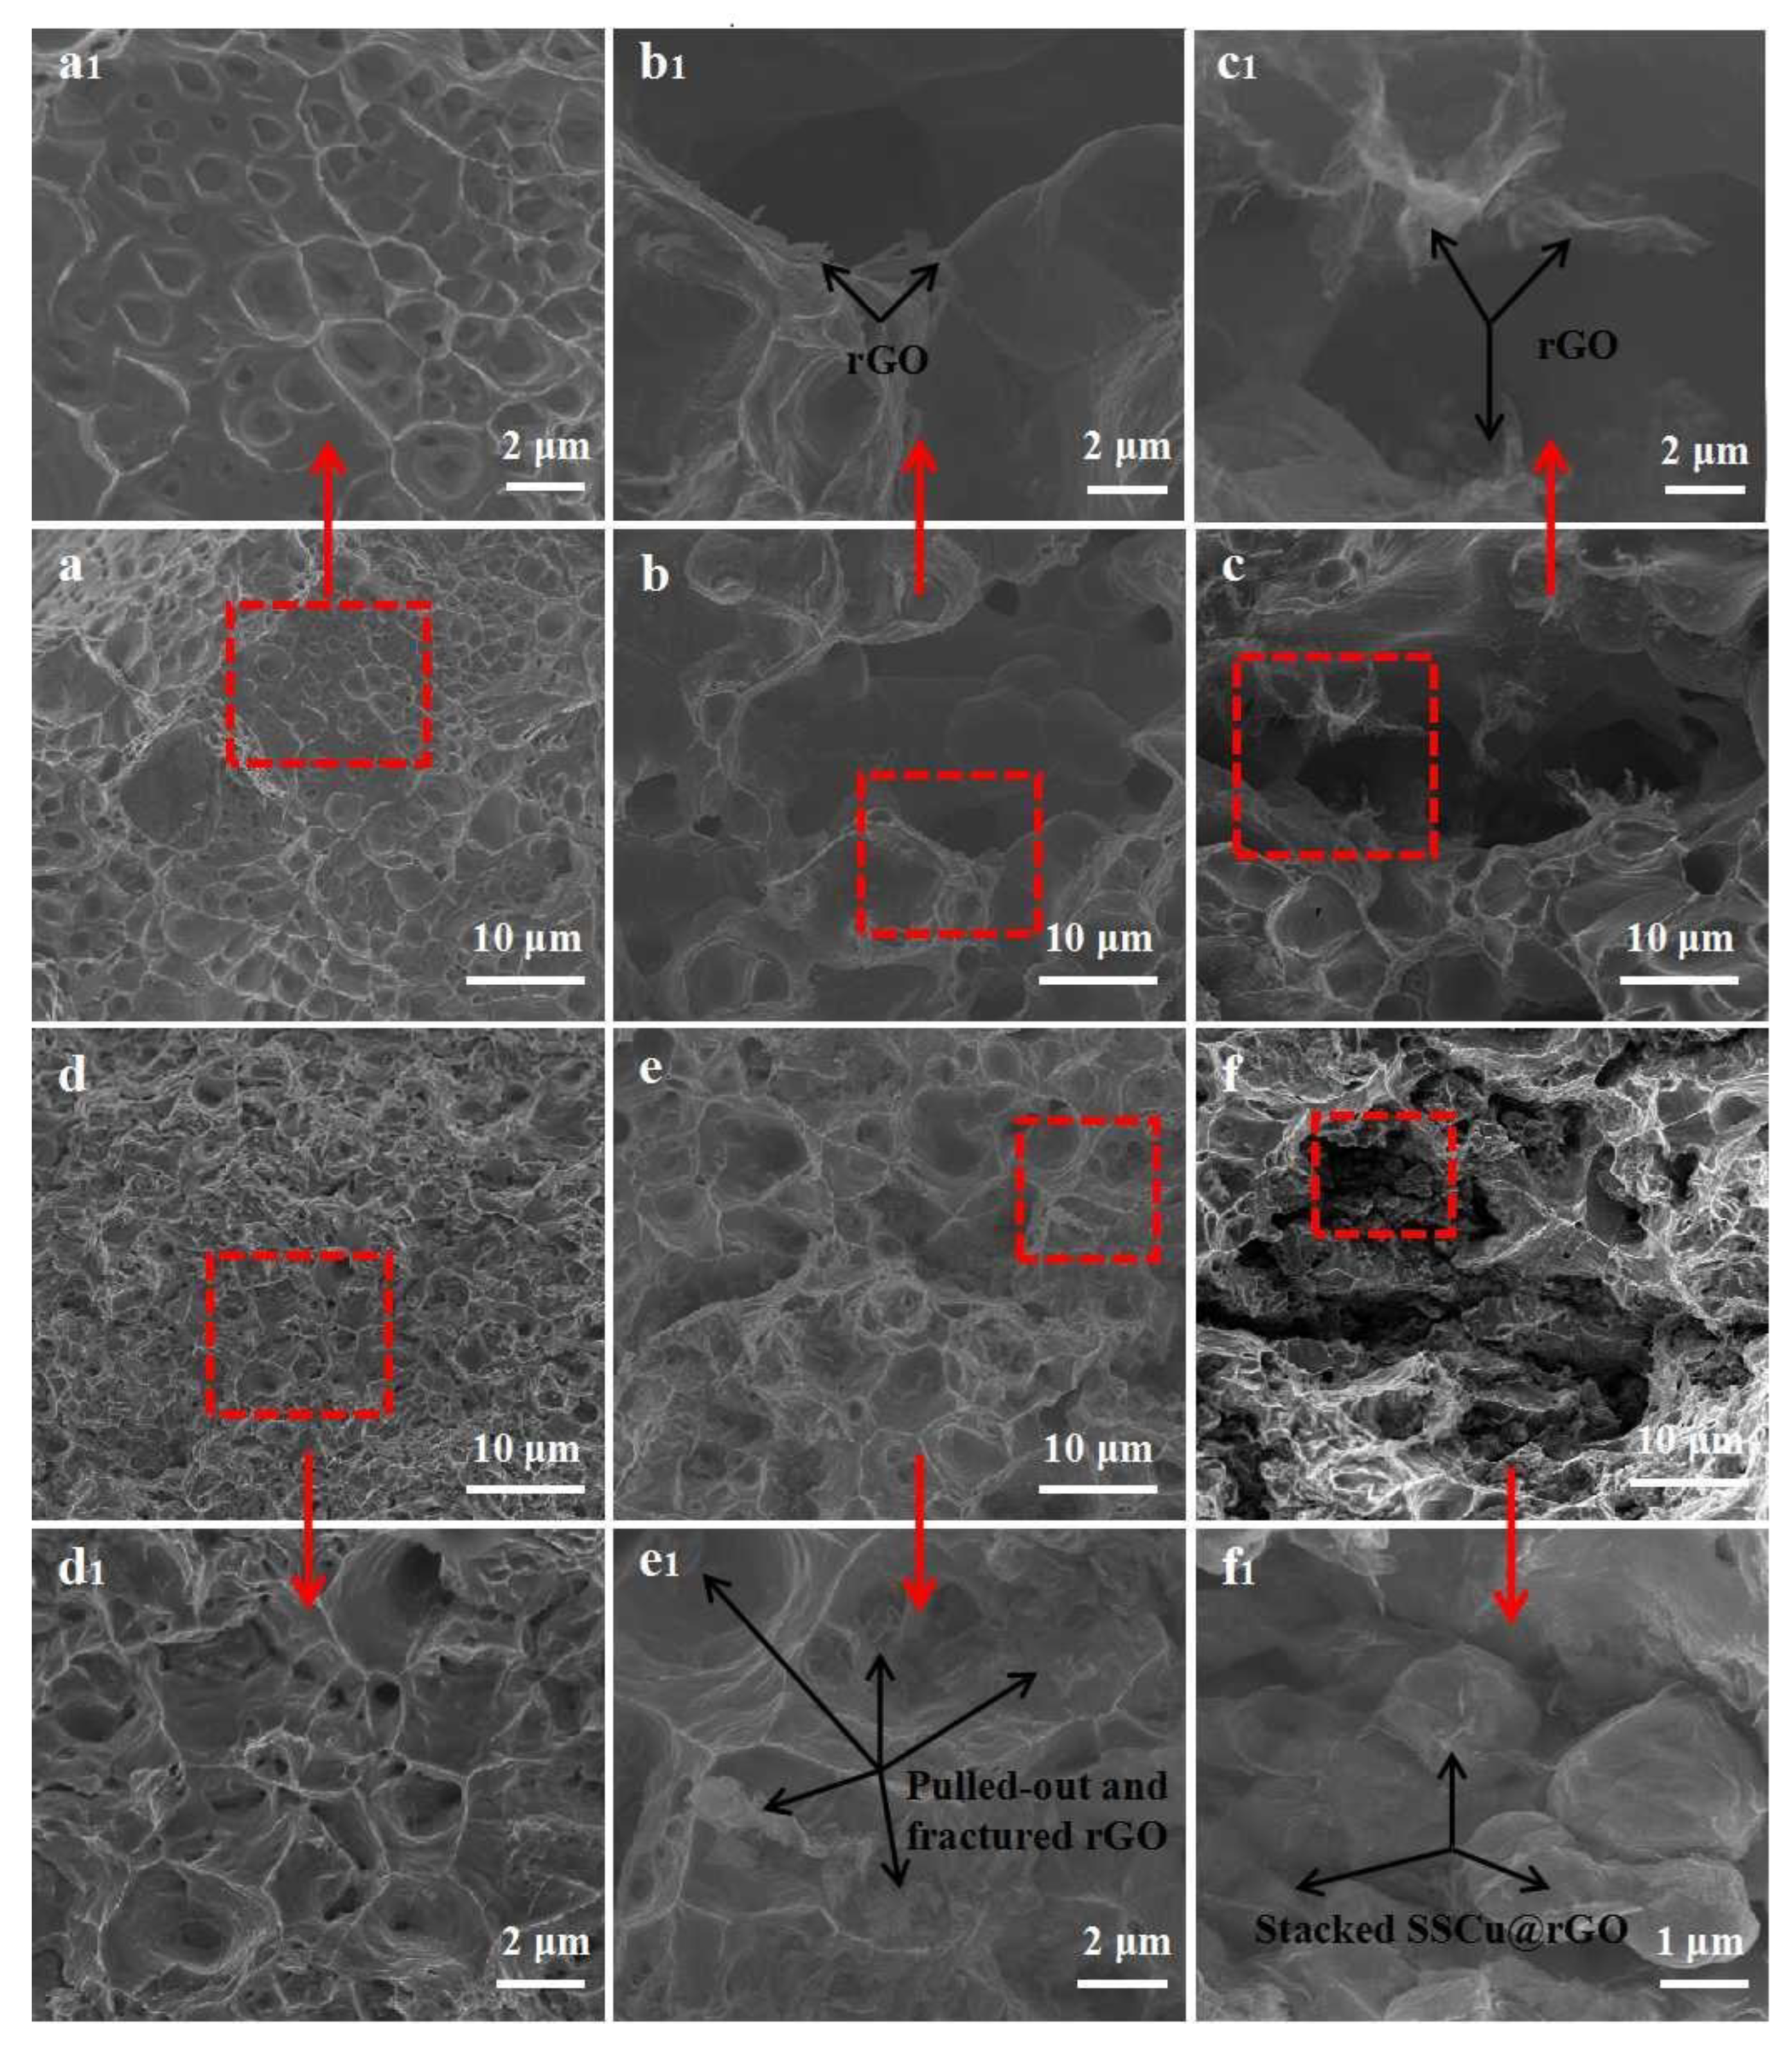
3.2.3. Fracture Microstructure
3.3. Mechanical Properties and Electrical Conductivity
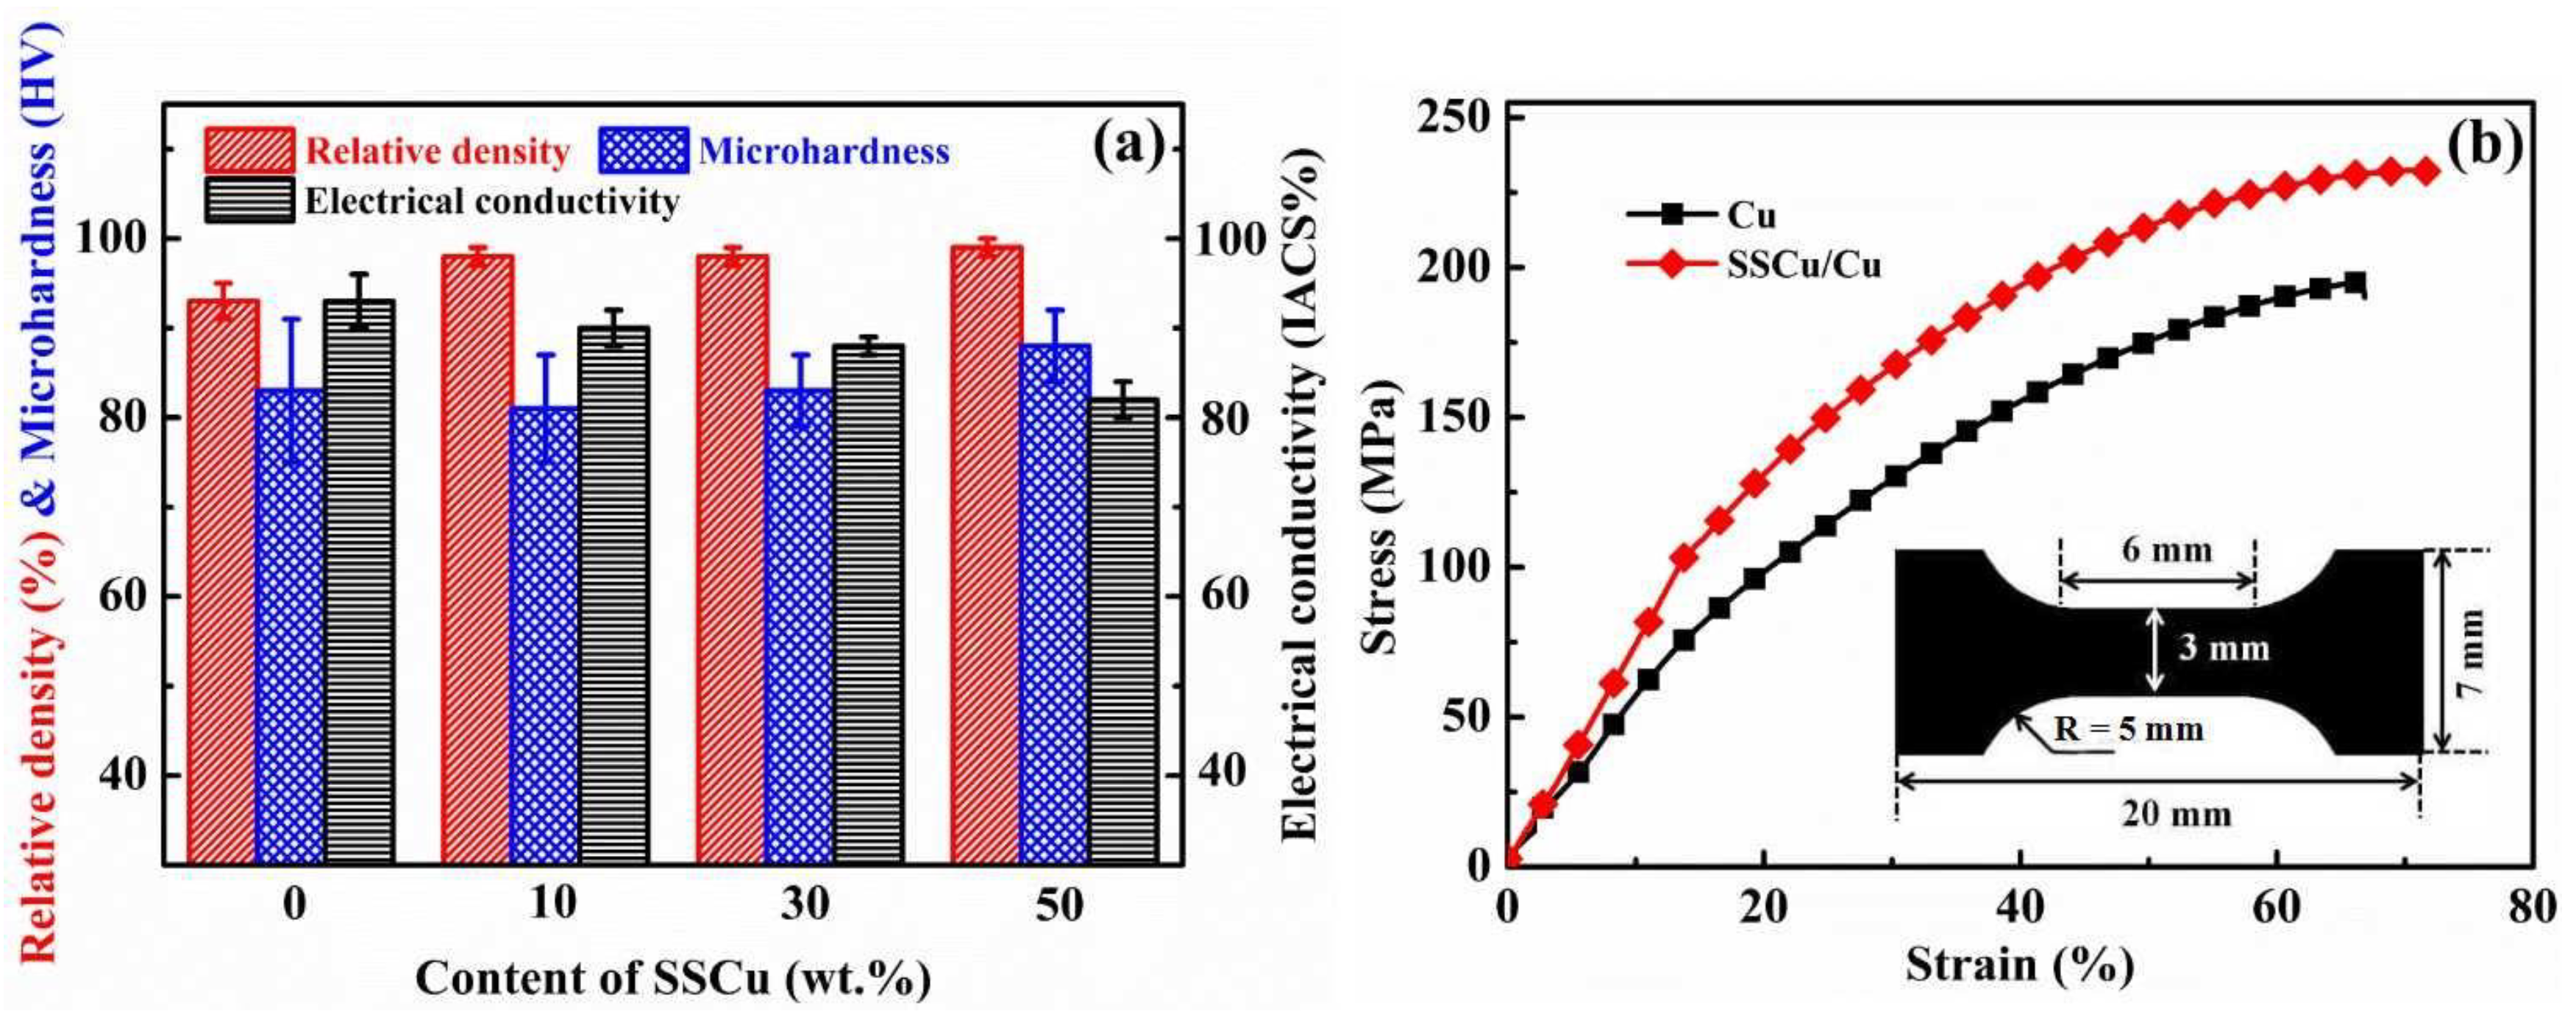
3.3.1. Effect of Different SSCu Contents on the Properties of the Composites
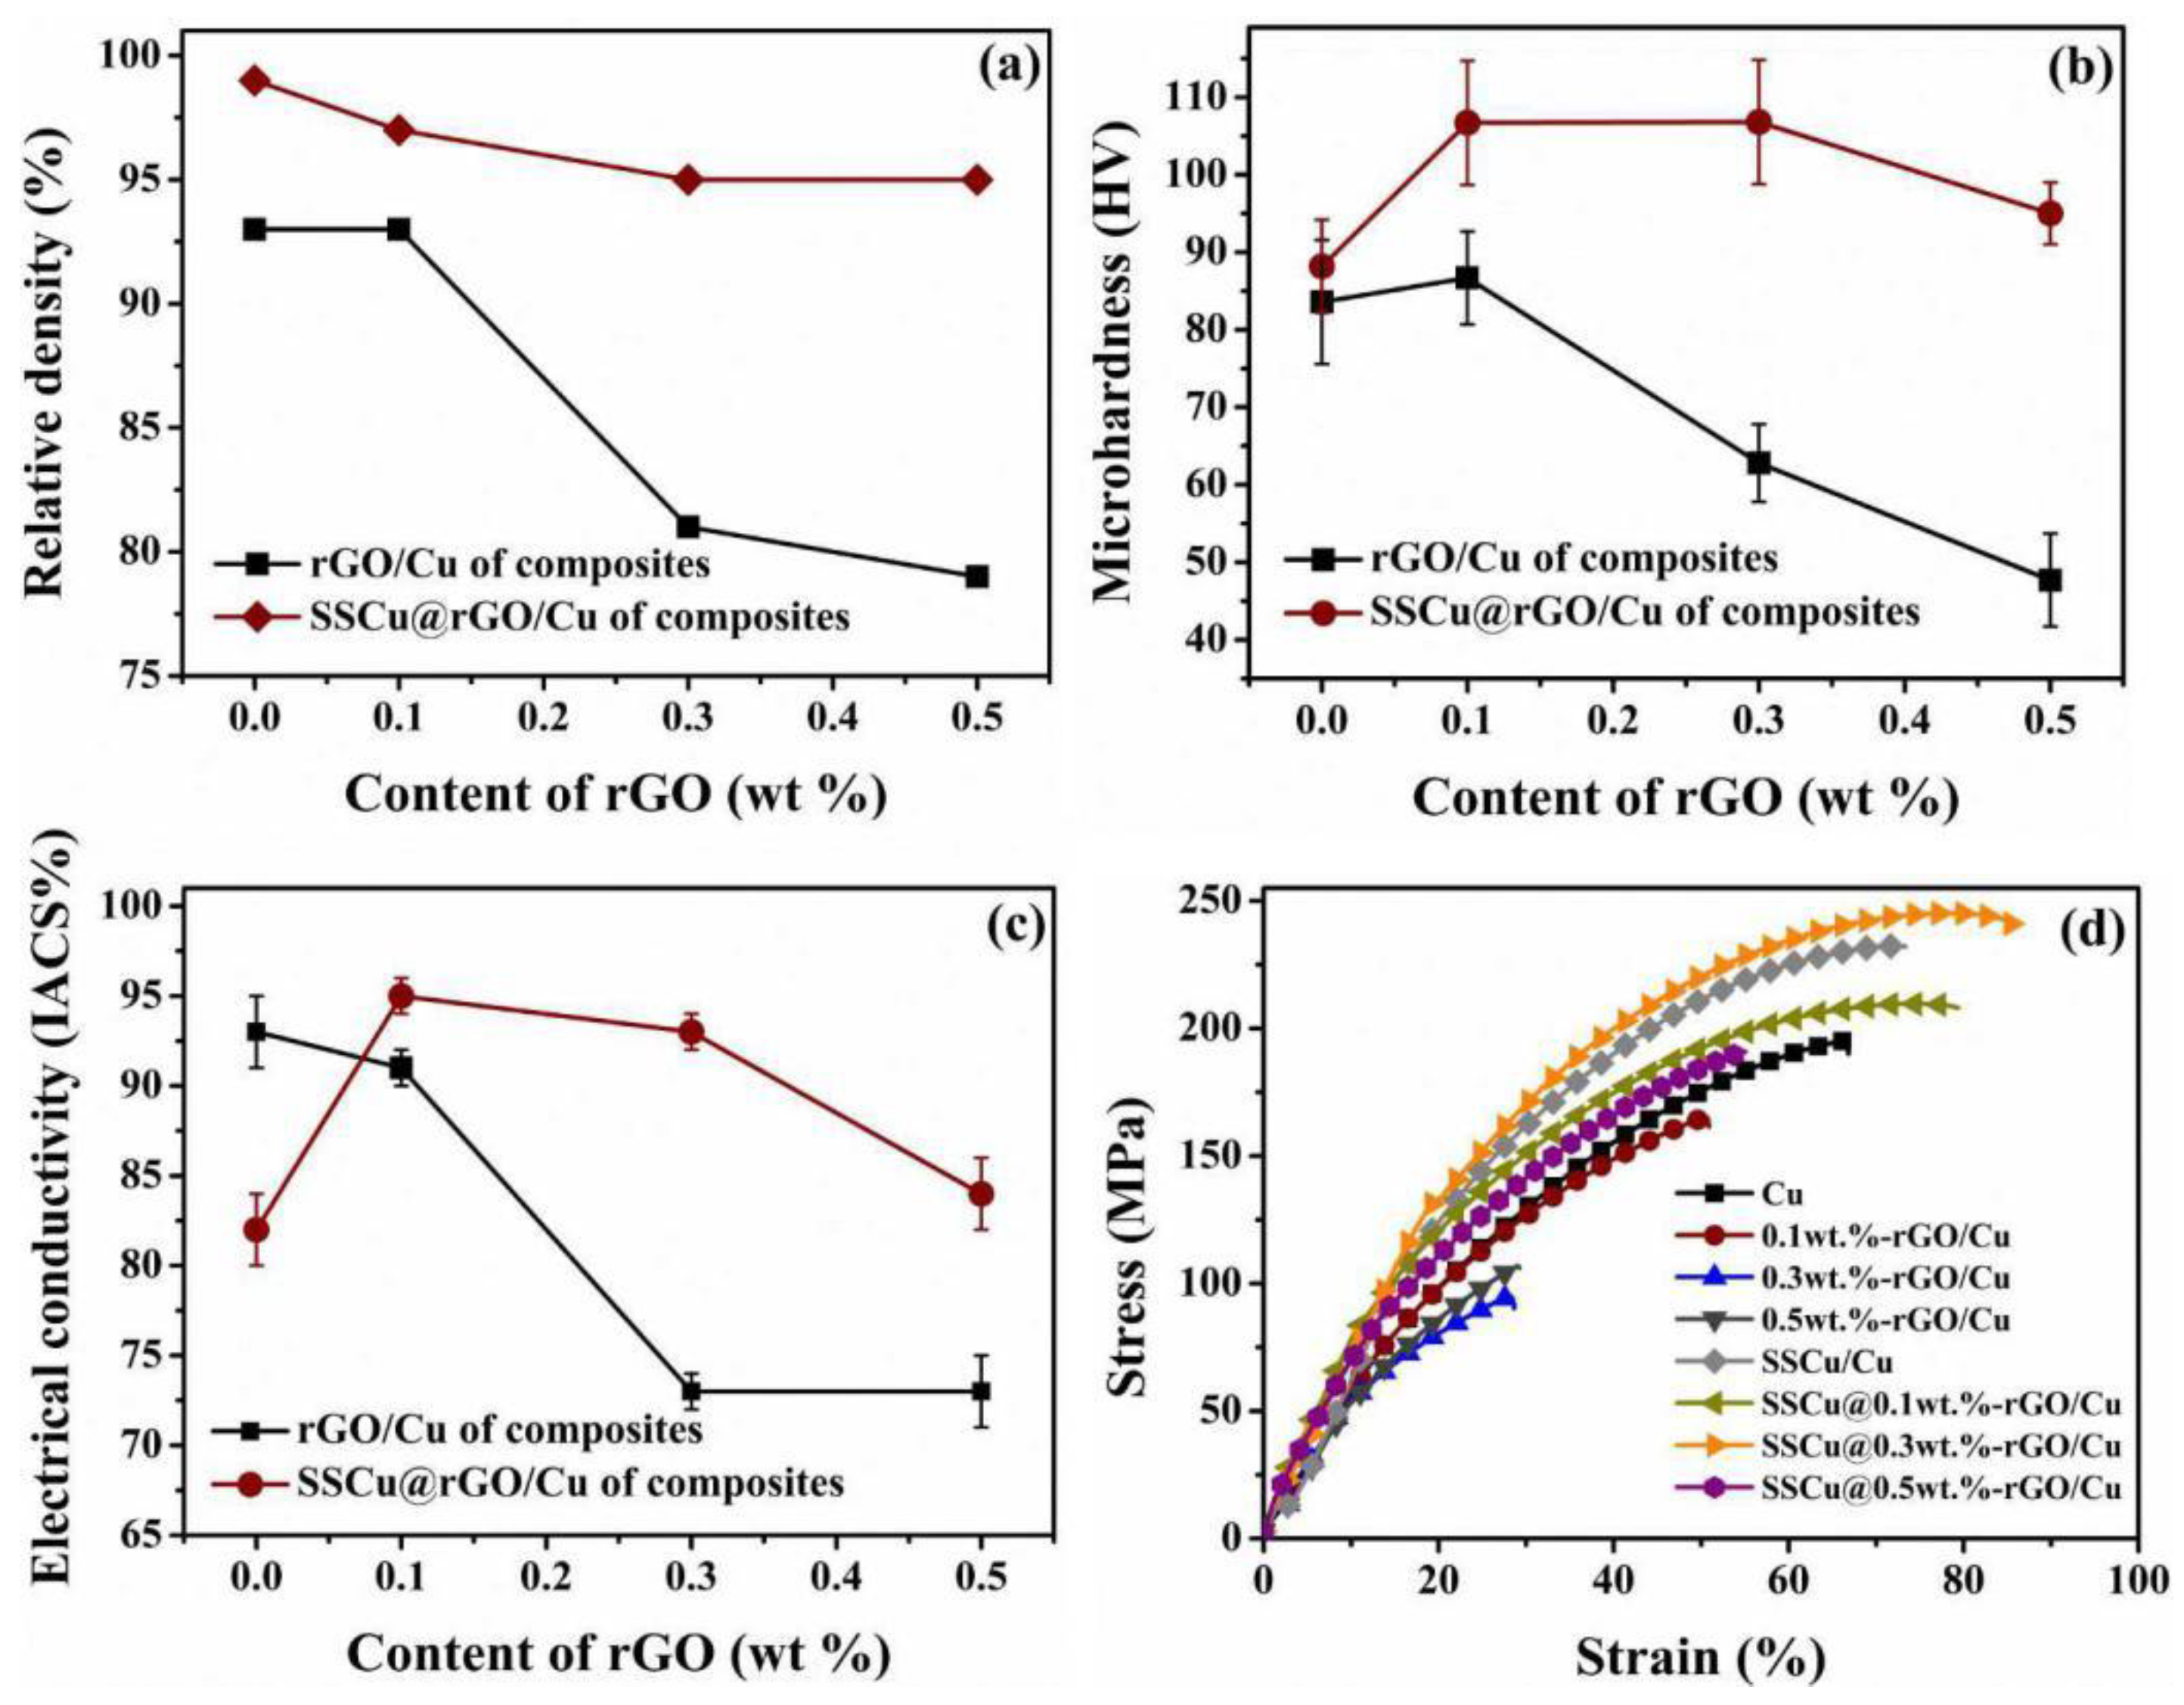
3.3.2. Comparison of the Performance between the rGO/Cu and SSCu@rGO/Cu Composites
3.4. Strengthening Mechanism
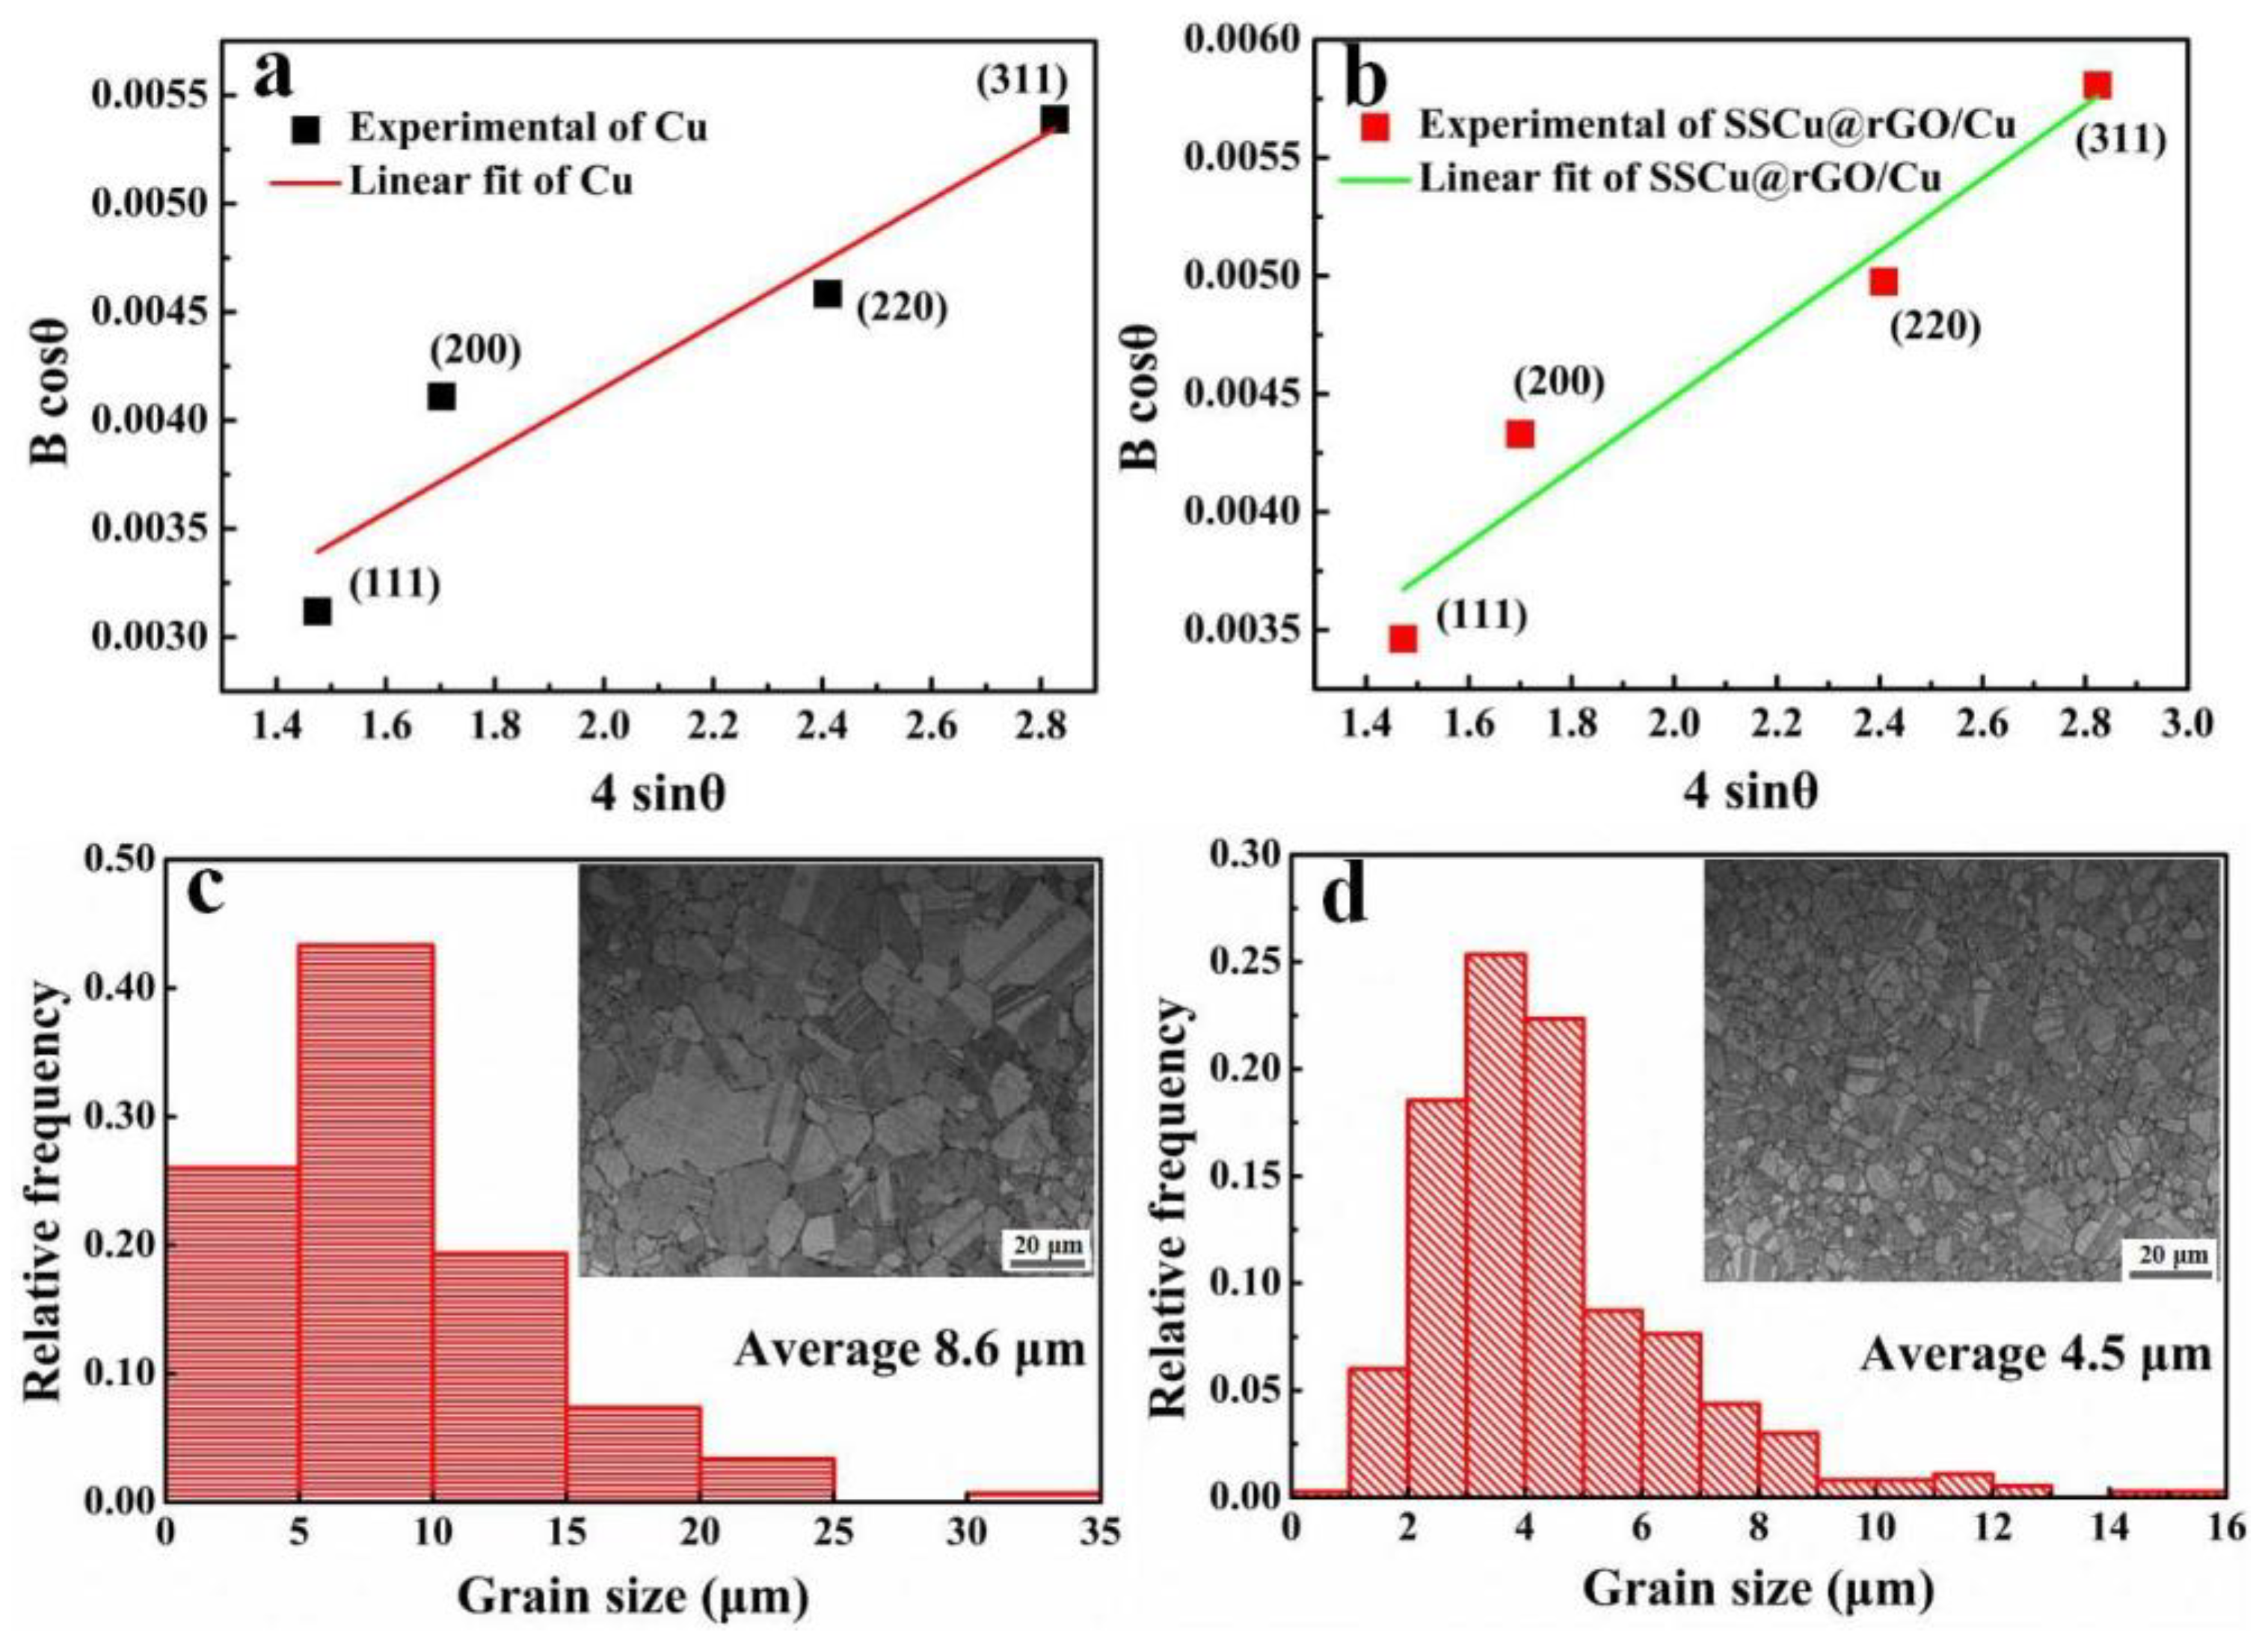
3.4.1. Strength
3.4.2. Plasticity
3.4.3. Electrical Conductivity
4. Conclusions
- (1)
- The combination of SSCu and Cu can improve the sintering RD and mechanical properties, but the EC value is reduced.
- (2)
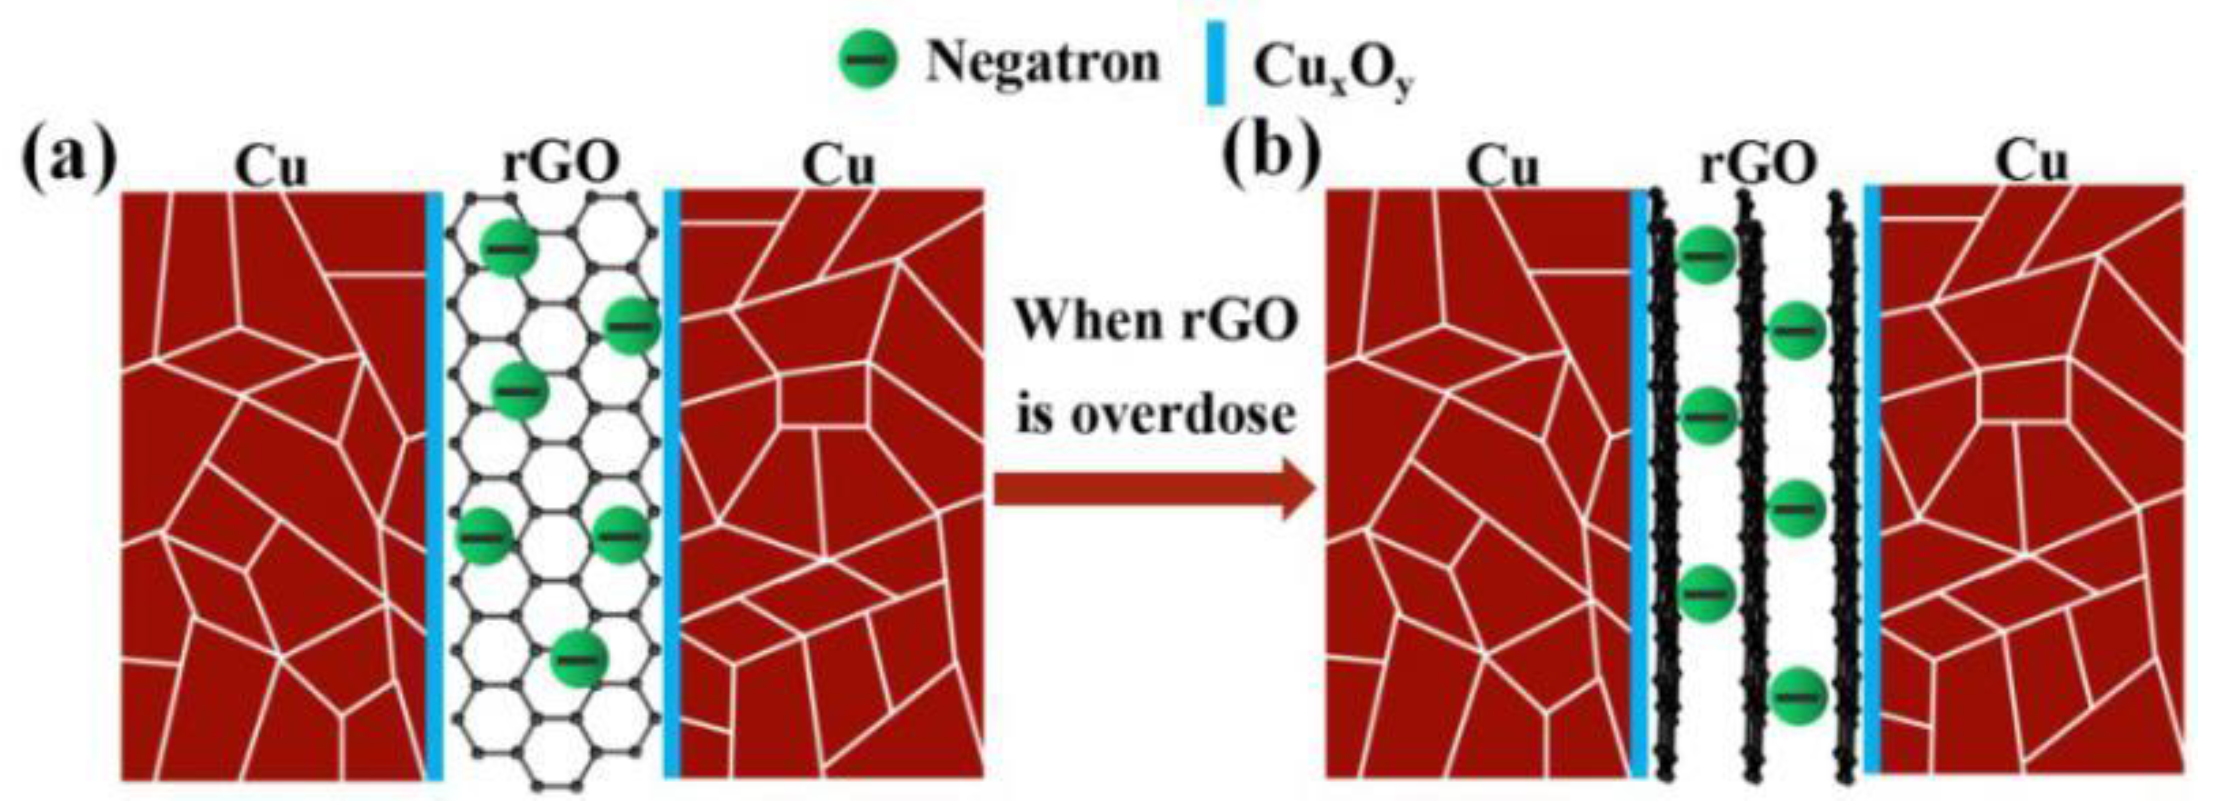
- The rGO/Cu composites cannot provide an effective coating structure, resulting in a large amount of rGO agglomeration. The agglomerates are sintered to form pores and defects, which reduce the RD, mechanical properties, and EC.
- (3)
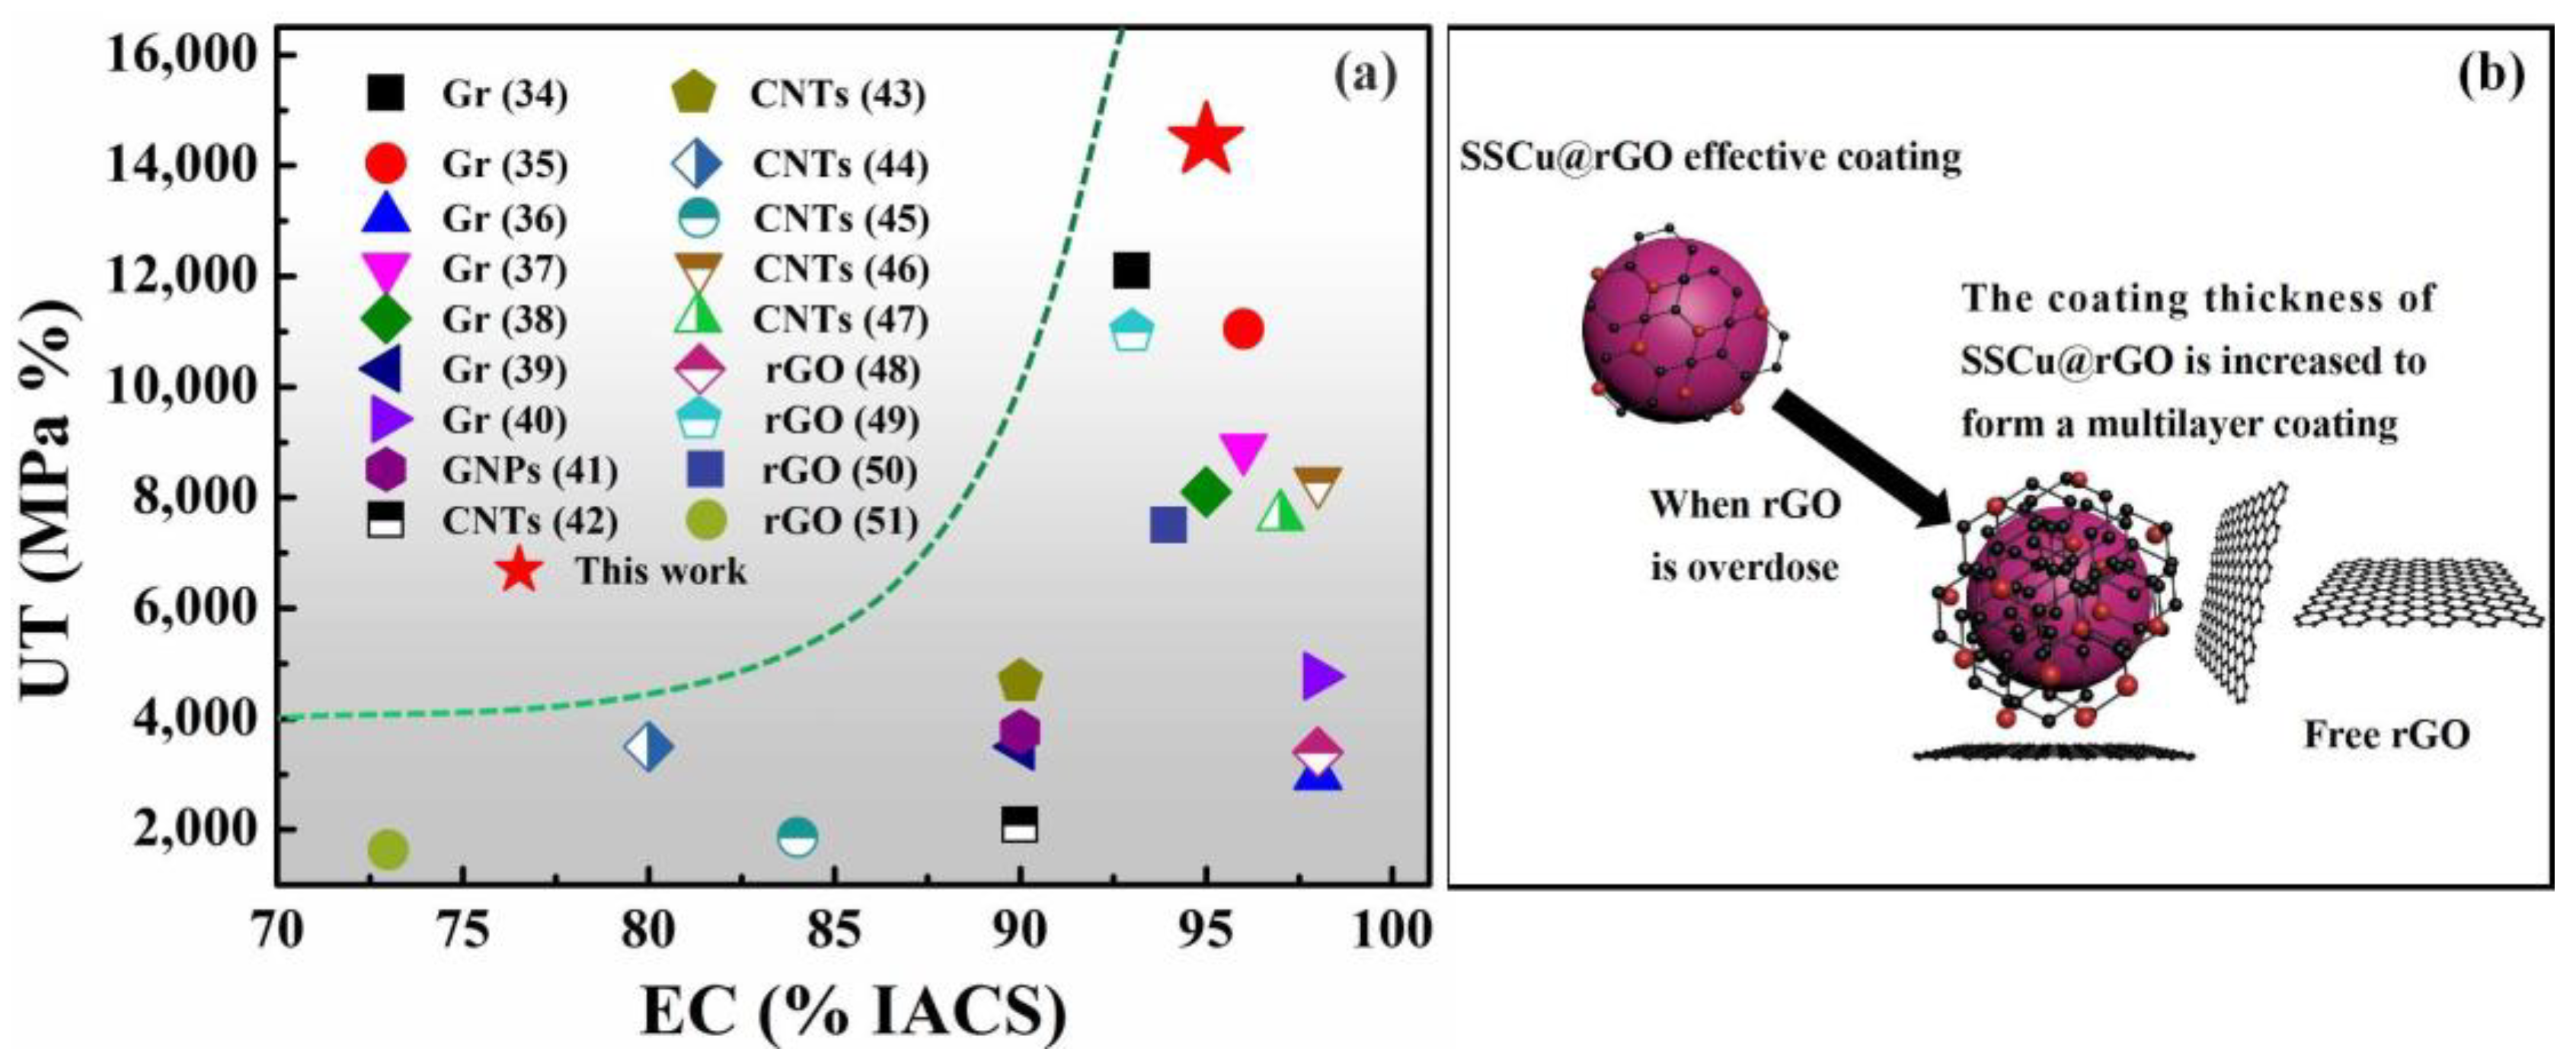
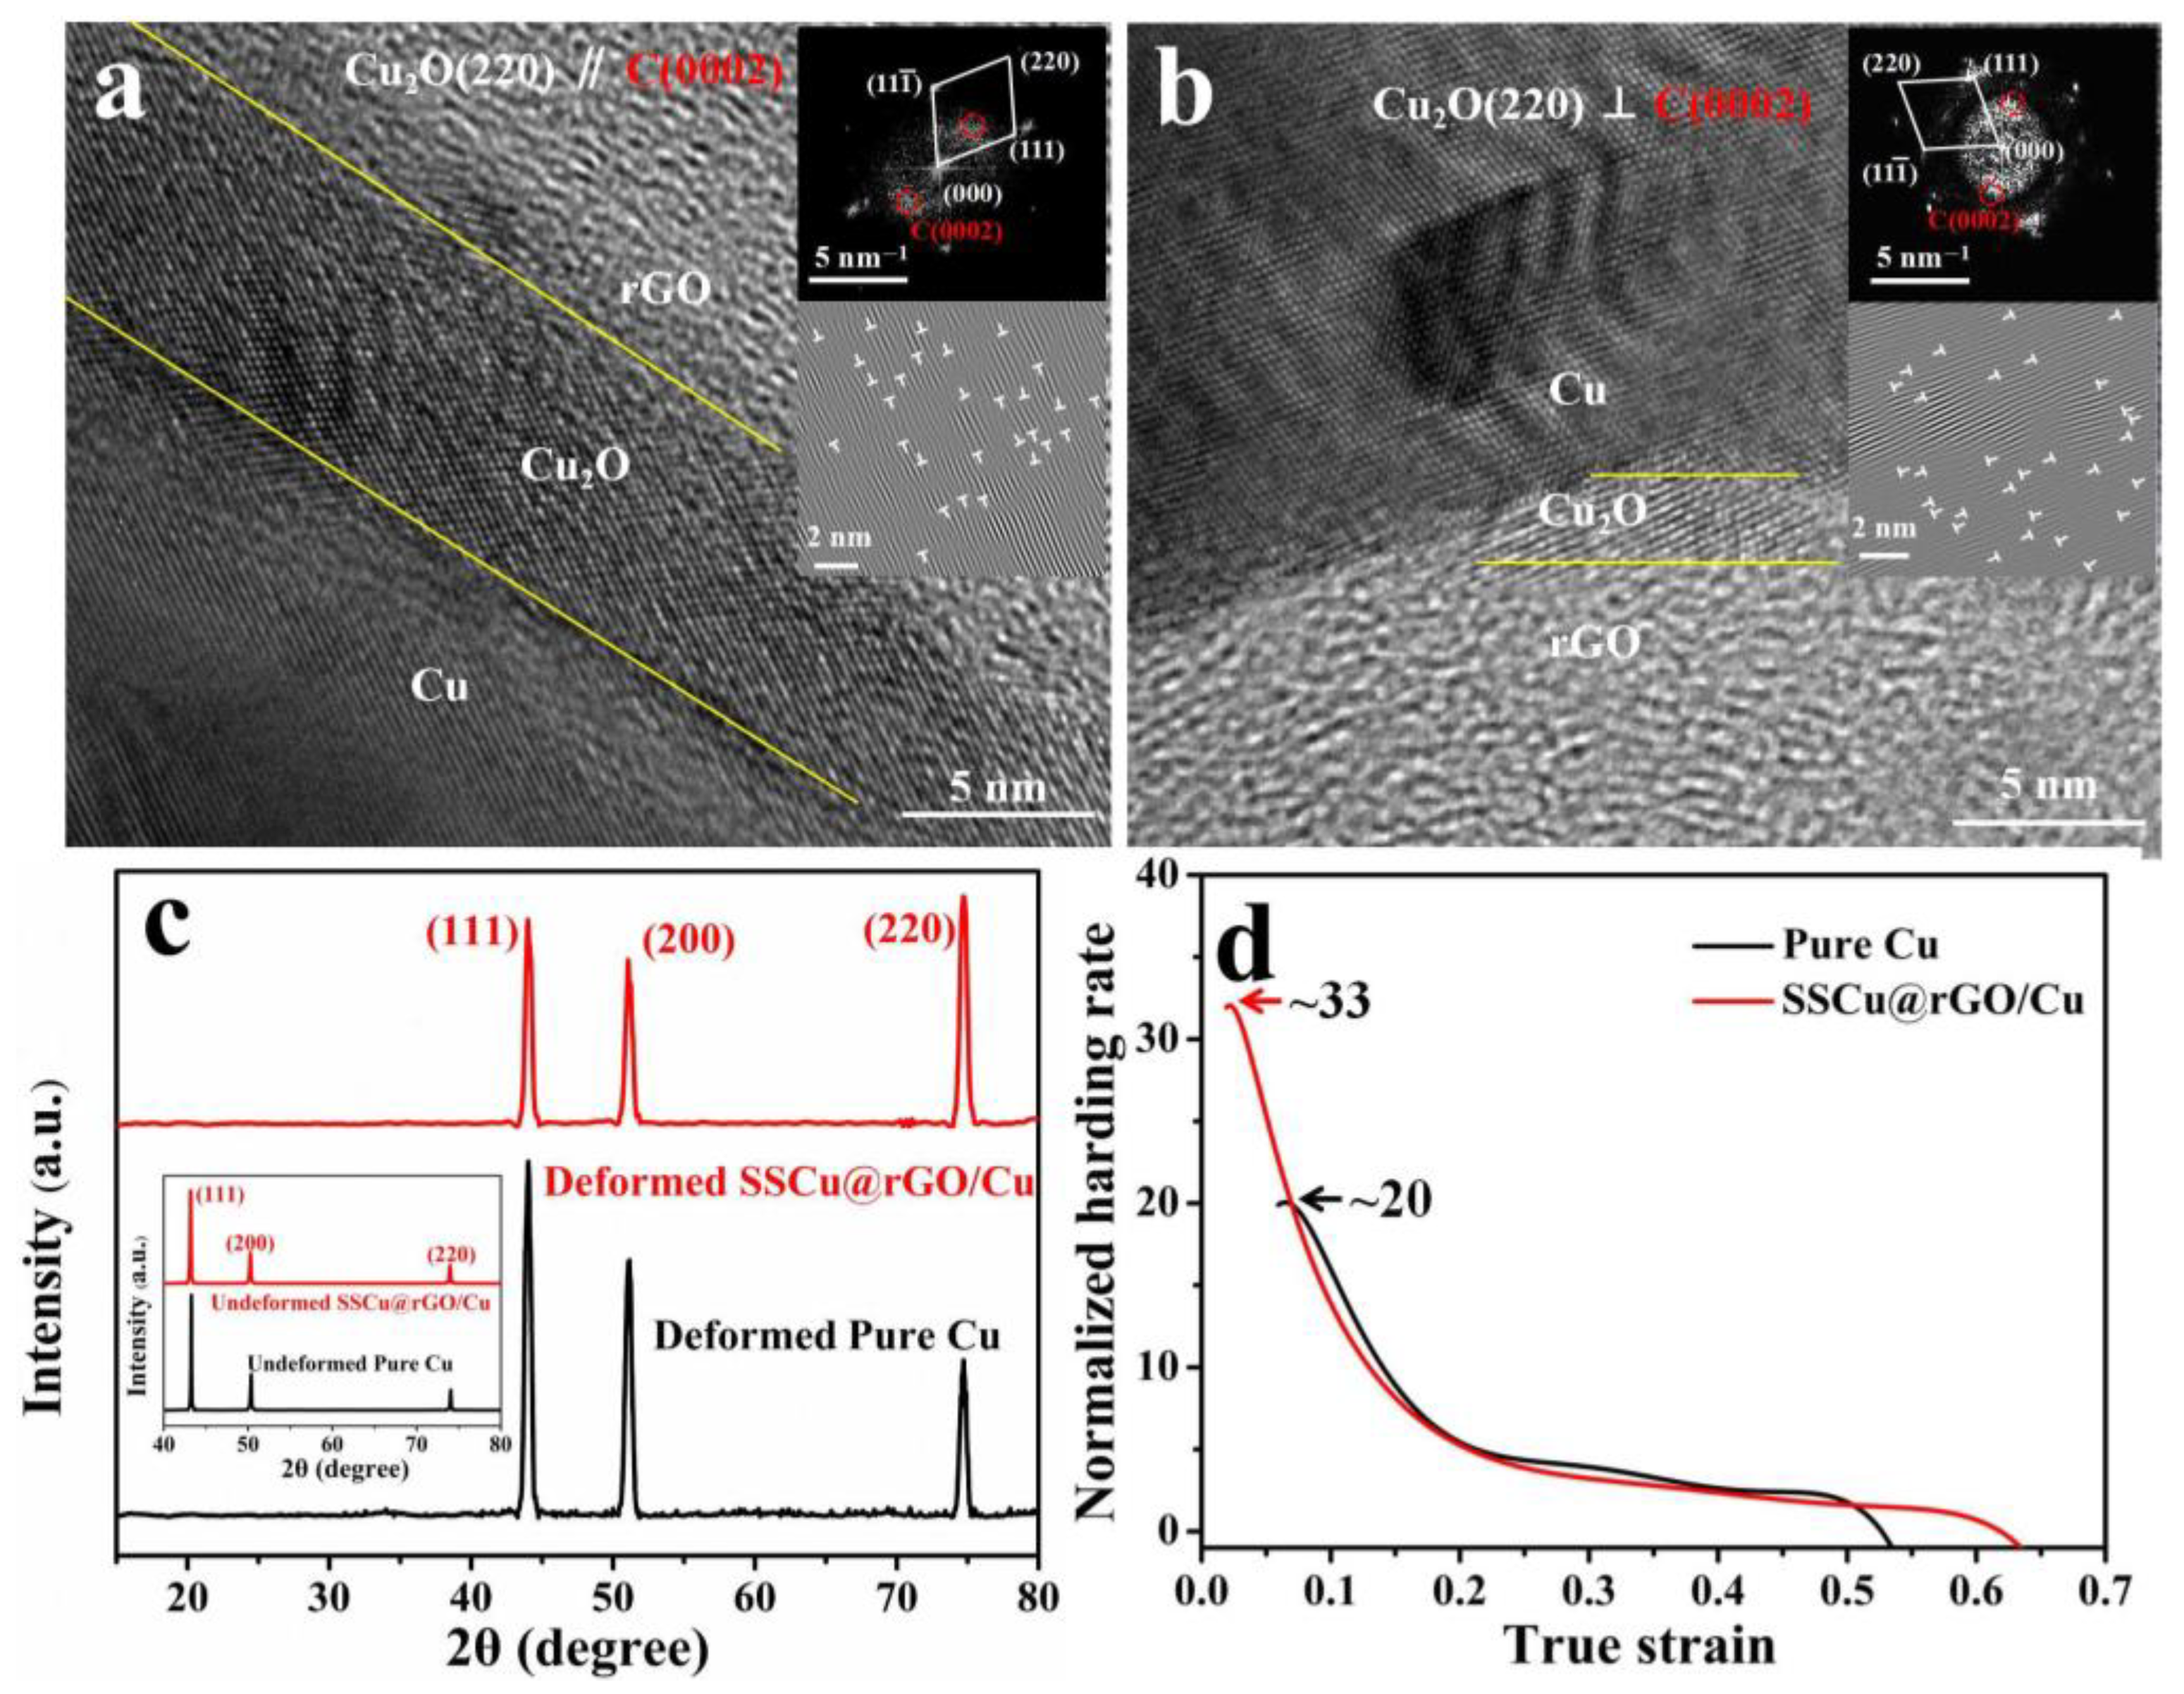
- SSCu@rGO increases the sintering RD, uniformly disperses the graphene, and promotes the interface reaction between rGO and Cu to form Cu4O3 and Cu2O, which strengthen the interfacial bonding. The large mismatch between Cu4O3, Cu2O, and the interface weakens the interfacial bond. It is the balance between these strengthening and weakening effects that optimizes the interface, which can simultaneously achieve good strength and plastic coordination.
- (4)
- The RD of the SSCu@rGO/Cu composites exceeds 95%. Hardness, TS, EL, and YS can reach 106.8 HV, 245 MPa, 59%, and 119 MPa respectively, which are greatly improved compared with those of Cu. The EC value of 95% IACS is also higher than that of Cu.
- (5)
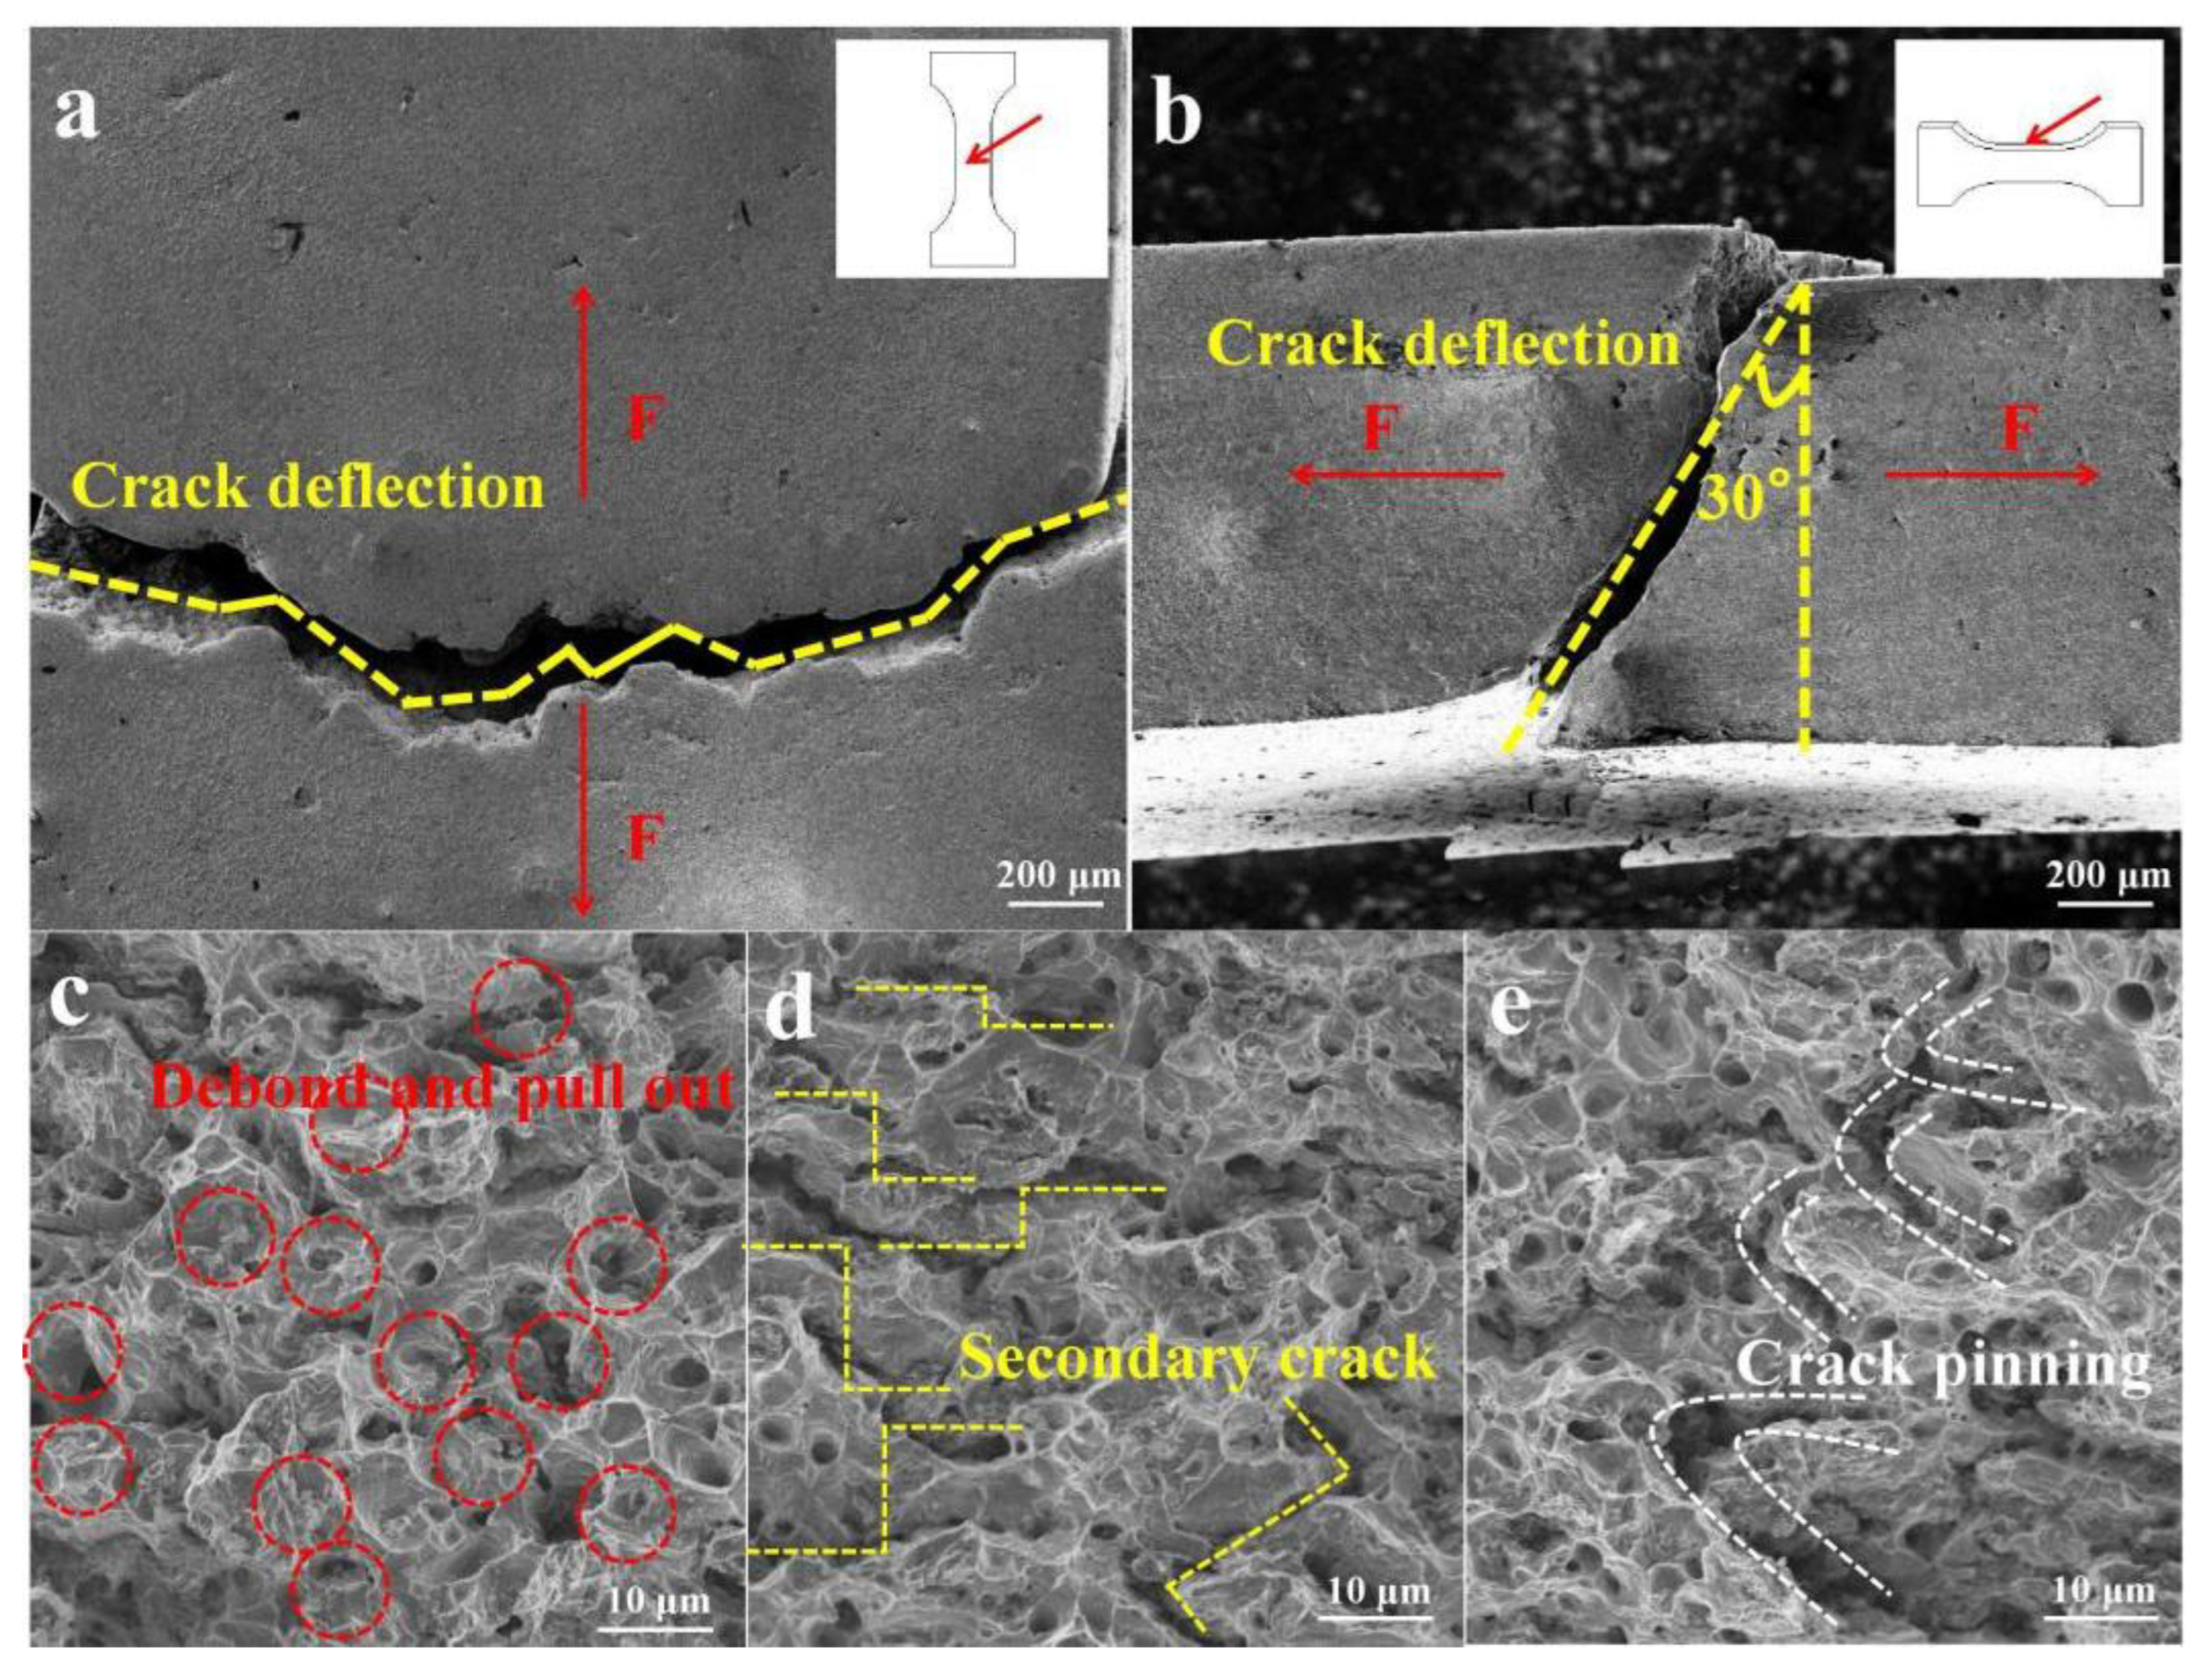
- The SSCu@rGO/Cu composites exhibit an improved strength due to dislocation strengthening, grain refinement strengthening, and load transfer strengthening. The Cu4O3 and Cu2O nanotransition layers possess a coordinated deformation ability during the deformation process. Furthermore, rGO increases the fracture energy during deformation via rGO debonding and pulling out, crack deflection, the formation of secondary cracks, and crack pinning, which enhance the plasticity. SSCu@rGO builds bridges between large-size Cu grains, and rGO on its surface provides a fast path for electron conduction, which restores the EC value.
Supplementary Materials
Author Contributions
Funding
Data Availability Statement
Conflicts of Interest
References
- Novoselov, K.S.; Geim, A.K.; Morozov, S.V.; Jiang, D.; Katsnelson, M.I.; Grigorieva, I.V.; Dubonos, S.V.; Firsov, A.A. Two-dimensional gas of massless Dirac fermions in graphene. Nature 2005, 438, 197–200. [Google Scholar] [CrossRef] [PubMed]
- Cao, M.; Xiong, D.B.; Yang, L.; Li, S.; Xie, Y.; Guo, Q.; Li, Z.; Adams, H.; Gu, J.; Fan, T.; et al. Ultrahigh electrical conductivity of graphene embedded in metals. Adv. Funct. Mater. 2019, 29, 1806792. [Google Scholar] [CrossRef]
- Lin, G.; Peng, Y.; Li, Y.; Liang, H.; Zhang, D. Remarkable anisotropic wear resistance with 100-fold discrepancy in a copper matrix laminated composite with only 0.2 vol% graphene. Acta Mater. 2021, 215, 117092. [Google Scholar] [CrossRef]
- Han, T.L.; Li, J.J.; Zhao, N.Q.; He, C.N. Microstructure and properties of copper coated graphene nanoplates reinforced Al matrix composites developed by low temperature ball milling. Carbon 2020, 159, 311–323. [Google Scholar] [CrossRef]
- Song, G.S.; Sun, L.; Li, S.S.; Sun, Y.F.; Fu, Q.; Pan, C.X. Synergistic effect of Gr and CNTs on preparing ultrathin Cu-(CNTs+Gr) composite foil via electrodeposition. Compos. Part B Eng. 2020, 187, 107841. [Google Scholar] [CrossRef]
- Liang, J.Z. Effects of tension rates and filler size on tensile properties of polypropylene/graphene nano-platelets composites. Compos. Part B Eng. 2019, 167, 241–249. [Google Scholar] [CrossRef]
- Dang, C.Y.; Shen, X.J.; Nie, H.J.; Yang, S.; Shen, J.X.; Yang, X.H.; Fu, S.Y. Enhanced interlaminar shear strength of ramie fiber/polypropylene composites by optimal combination of graphene oxide size and content. Compos. Part B Eng. 2019, 168, 488–495. [Google Scholar] [CrossRef]
- Wang, X.C.; Zhao, J.; Cui, E.Z.; Sun, Z.F.; Yu, H. Nano/microstructures and mechanical properties of Al2O3-WC-TiC ceramic composites incorporating graphene with different sizes. Mater. Sci. Eng. A 2021, 812, 141132. [Google Scholar] [CrossRef]
- Llorente, J.; Belmonte, M. Rolled and twisted graphene flakes as self-lubricant and wear protecting fillers into ceramic composites. Carbon 2020, 159, 45–50. [Google Scholar] [CrossRef]
- Tabandeh-Khorshid, M.; Kumar, A.; Omrani, E.; Kim, C.; Rohatgi, P. Synthesis, characterization, and properties of graphene reinforced metal-matrix nanocomposites. Compos. Part B Eng. 2020, 183, 107664. [Google Scholar] [CrossRef]
- Mao, Q.Z.; Wang, L.; Nie, J.F.; Zhao, Y.H. Enhancing strength and electrical conductivity of Cu–Cr composite wire by two-stage rotary swaging and aging treatments. Compos. Part B Eng. 2022, 231, 109567. [Google Scholar] [CrossRef]
- Wei, K.X.; Zhou, H.R.; Jia, F.L.; Zhang, K.; Wei, W.; Chu, F.Q.; Wang, D.D.; Alexandrov, I.V. Mechanical behaviors of graphene/copper matrix composite foils fabricated by pulse electrodeposition. Surf. Interfaces 2021, 24, 101142. [Google Scholar] [CrossRef]
- Zhan, K.; Li, F.; Wang, W.; Xu, Y.; Zhao, R.; Yang, Z.; Wang, Z.; Zhao, B. Preparation and mechanism of Cu/GO/Cu laminated composite foils with improved thermal conductivity and mechanical property by architectural design. J. Alloys Compd. 2022, 904, 164085. [Google Scholar] [CrossRef]
- Chen, F.; Mei, Q.S.; Li, J.Y.; Li, C.L.; Wan, L.; Zhang, G.D.; Mei, X.M.; Chen, Z.H.; Xu, T.; Wang, Y.C. Fabrication of graphene/copper nanocomposites via in-situ delamination of graphite in copper by accumulative roll-compositing. Compos. Part B Eng. 2021, 216, 108850. [Google Scholar] [CrossRef]
- Naik, R.B.; Reddy, K.V.; Reddy, G.M.; Kumar, R.A. Development of high strength and high electrical conductivity Cu/Gr composites through friction stir processing. Mater. Lett. 2020, 265, 127437. [Google Scholar] [CrossRef]
- Shi, L.; Liu, M.; Yang, Y.; Liu, R.; Zhang, W.; Zheng, Q.; Ren, Z. Achieving high strength and ductility in copper matrix composites with graphene network. Mater. Sci. Eng. A 2021, 828, 142107. [Google Scholar] [CrossRef]
- Guo, S.; Zhang, X.; Shi, C.; Zhao, D.; Liu, E.; He, C.; Zhao, N. Comprehensive performance regulation of Cu matrix composites with graphene nanoplatelets in situ encapsulated Al2O3 nanoparticles as reinforcement. Carbon 2022, 188, 81–94. [Google Scholar] [CrossRef]
- Yang, Z.; Wang, L.; Li, J.; Shi, Z.; Wang, M.; Sheng, J.; Fei, W. Lateral size effect of reduced graphene oxide on properties of copper matrix composites. Mater. Sci. Eng. A 2021, 820, 141579. [Google Scholar] [CrossRef]
- Yang, Z.Y.; Wang, L.D.; Shi, Z.D.; Wang, M.; Cui, Y.; Wei, B.; Xu, S.C.; Zhu, Y.P.; Fei, W.D. Preparation mechanism of hierarchical layered structure of graphene/copper composite with ultrahigh tensile strength. Carbon 2018, 127, 329–339. [Google Scholar] [CrossRef]
- Yang, T.; Chen, W.G.; Zhang, H.; Ma, L.H.; Fu, Y.Q. In-situ generated graphene from wheat flour for enhancing mechanical and electrical properties of copper matrix composites. Mater. Sci. Eng. A 2022, 835, 142662. [Google Scholar] [CrossRef]
- Mathew, R.T.; Singam, S.; Kollu, P.; Bohm, S.; Prasad, M.J.N.V. Achieving exceptional tensile strength in electrodeposited copper through grain refinement and reinforcement effect by co-deposition of few layered graphene. J. Alloys Compd. 2020, 840, 155725. [Google Scholar] [CrossRef]
- Behera, A.K.; Chandran, R.; Sarkar, S.; Mallik, A. An exploration on the use of in-house synthesized reduced few layer graphene particles as a reinforcement during sono-electroplating of Cu matrix composite films. J. Alloys Compd. 2020, 817, 152713. [Google Scholar] [CrossRef]
- Wang, T.; Zhao, R.; Zhan, K.; Bao, L.; Zhang, Y.; Yang, Z.; Yan, Y.; Zhao, B.; Yang, J. Preparation of electro-reduced graphene oxide/copper composite foils with simultaneously enhanced thermal and mechanical properties by DC electro-deposition method. Mater. Sci. Eng. A 2021, 805, 140574. [Google Scholar] [CrossRef]
- Shao, G.S.; Liu, P.; Zhang, K.; Li, W.; Chen, X.H.; Ma, F. Mechanical properties of graphene nanoplates reinforced copper matrix composites prepared by electrostatic self-assembly and spark plasma sintering. Mater. Sci. Eng. A 2019, 739, 329–334. [Google Scholar] [CrossRef]
- Glover, R.D.; Miller, J.M.; Hutchison, J.E. Generation of metal nanoparticles from silver and copper objects: Nanoparticle dynamics on surfaces and potential sources of nanoparticles in the environment. ACS Nano 2011, 5, 8950–8957. [Google Scholar] [CrossRef]
- Hwang, J.; Yoon, T.; Jin, S.H.; Lee, J.; Kim, T.-S.; Hong, S.H.; Jeon, S. Enhanced mechanical properties of graphene/copper nanocomposites using a molecular-level mixing process. Adv. Mater. 2013, 25, 6724–6729. [Google Scholar] [CrossRef]
- Jiang, L.; Wen, H.M.; Yang, H.; Hu, T.; Topping, T.; Zhang, D.L.; Lavernia, E.J.; Schoenung, J.M. Influence of length-scales on spatial distribution and interfacial characteristics of B4C in a nanostructured Al matrix. Acta Mater. 2015, 89, 327–343. [Google Scholar] [CrossRef]
- Chen, X.F.; Tao, J.M.; Liu, Y.C.; Bao, R.; Li, F.X.; Li, C.J.; Yi, J.H. Interface interaction and synergistic strengthening behavior in pure copper matrix composites reinforced with functionalized carbon nanotube-graphene hybrids. Carbon 2019, 146, 736–755. [Google Scholar] [CrossRef]
- Yang, M.; Weng, L.; Zhu, H.X.; Fan, T.X.; Zhang, D. Simultaneously enhancing the strength, ductility and conductivity of copper matrix composites with graphene nanoribbons. Carbon 2017, 118, 250–260. [Google Scholar] [CrossRef]
- Xu, Z.; Shi, X.; Zhai, W.; Yao, J.; Song, S.; Zhang, Q. Preparation and tribological properties of TiAl matrix composites reinforced by multilayer graphene. Carbon 2014, 67, 168–177. [Google Scholar] [CrossRef]
- Salvo, C.; Mangalaraja, R.V.; Udayabashkar, R.; Lopez, M.; Aguilar, C. Enhanced mechanical and electrical properties of novel graphene reinforced copper matrix composites. J. Alloys Compd. 2019, 777, 309–316. [Google Scholar] [CrossRef]
- Varol, T.; Canakci, A. Microstructure, electrical conductivity and hardness of multilayer graphene/copper nanocomposites synthesized by flake powder metallurgy. Met. Mater. Int. 2015, 21, 704–712. [Google Scholar] [CrossRef]
- Ponraj, N.V.; Vettivel, S.C.; Azhagurajan, A.; Nabhiraj, P.Y.; Theivasanthi, T.; Selvakumar, P.; Lenin, A.H. Effect of milling on dispersion of graphene nanosheet reinforcement in different morphology copper powder matrix. Surf. Interfaces 2017, 9, 260–265. [Google Scholar] [CrossRef] [Green Version]
- Cao, M.; Xiong, D.B.; Tan, Z.Q.; Ji, G.; Amin-Ahmadi, B.; Guo, Q.; Fan, G.L.; Guo, C.P.; Li, Z.Q.; Zhang, D. Aligning graphene in bulk copper: Nacre-inspired nanolaminated architecture coupled with in-situ processing for enhanced mechanical properties and high electrical conductivity. Carbon 2017, 117, 65–74. [Google Scholar] [CrossRef]
- Chen, Y.; Zhang, X.; Liu, E.; He, C.; Shi, C.; Li, J.; Nash, P.; Zhao, N. Fabrication of in-situ grown graphene reinforced Cu matrix composites. Sci. Rep. 2016, 6, 19363. [Google Scholar] [CrossRef]
- Li, T.j.; Wang, Y.Q.; Yang, M.; Hou, H.L.; Wu, S.J. High strength and conductivity copper matrix composites reinforced by in-situ graphene through severe plastic deformation processes. J. Alloys Compd. 2021, 851, 156703. [Google Scholar] [CrossRef]
- Li, X.H.; Yan, S.J.; Chen, X.; Hong, Q.H.; Wang, N. Microstructure and mechanical properties of graphene-reinforced copper matrix composites prepared by in-situ CVD, ball-milling, and spark plasma sintering. J. Alloys Compd. 2020, 834, 155182. [Google Scholar] [CrossRef]
- Wang, J.; Guo, L.N.; Lin, W.M.; Chen, J.; Zhang, S.; Chen, S.D.; Zhen, T.T.; Zhang, Y.Y. The effects of graphene content on the corrosion resistance, and electrical, thermal and mechanical properties of graphene/copper composites. New Carbon Mater 2019, 34, 161–169. [Google Scholar] [CrossRef]
- FChen, Y.; Ying, J.M.; Wang, Y.F.; Du, S.Y.; Liu, Z.P.; Huang, Q. Effects of graphene content on the microstructure and properties of copper matrix composites. Carbon 2016, 96, 836–842. [Google Scholar]
- Qiao, Z.; Zhou, T.; Kang, J.; Yu, Z.; Zhang, G.; Li, M.; Lu, H.; Li, Y.; Huang, Q.; Wang, L.; et al. Three-dimensional interpenetrating network graphene/copper composites with simultaneously enhanced strength, ductility and conductivity. Mater Lett. 2018, 224, 37–41. [Google Scholar] [CrossRef]
- Dong, L.L.; Fu, Y.Q.; Liu, Y.; Lu, J.W.; Zhang, W.; Huo, W.T.; Jin, L.H.; Zhang, Y.S. Interface engineering of graphene/copper matrix composites decorated with tungsten carbide for enhanced physico-mechanical properties. Carbon 2021, 173, 41–53. [Google Scholar] [CrossRef]
- Wang, Z.Y.; Cai, X.L.; Yang, C.J.; Zhou, L.; Hu, C. An electrodeposition approach to obtaining carbon nanotubes embedded copper powders for the synthesis of copper matrix composites. J. Alloys Compd. 2018, 735, 1357–1362. [Google Scholar] [CrossRef]
- Zhang, X.; Shi, C.; Liu, E.; He, F.; Ma, L.; Li, Q.; Li, J.; Zhao, N.; He, C. In-situ space-confined synthesis of well-dispersed three-dimensional graphene/carbon nanotube hybrid reinforced copper nanocomposites with balanced strength and ductility. Compos. Part A 2017, 103, 178–187. [Google Scholar] [CrossRef]
- Daoush, W.M.; Lim, B.K.; Mo, C.B.; Nam, D.H.; Hong, S.H. Electrical and mechanical properties of carbon nanotube reinforced copper nanocomposites fabricated by electroless deposition process. Mater. Sci. Eng. A 2009, 513–514, 247–253. [Google Scholar] [CrossRef]
- Zhao, S.; Zheng, Z.; Huang, Z.X.; Dong, S.J.; Luo, P.; Zhang, Z.; Wang, Y.W. Cu matrix composites reinforced with aligned carbon nanotubes: Mechanical, electrical and thermal properties. Mater. Sci. Eng. A 2016, 675, 82–91. [Google Scholar] [CrossRef]
- Duan, B.; Zhou, Y.; Wang, D.Z.; Zhao, Y.R. Effect of CNTs content on the microstructures and properties of CNTs/Cu composite by microwave sintering. J. Alloys Compd. 2019, 771, 498–504. [Google Scholar] [CrossRef]
- Wang, H.; Zhang, Z.H.; Hu, Z.Y.; Song, Q.; Yin, S.P.; Kang, Z.; Li, S.L. Improvement of interfacial interaction and mechanical properties in copper matrix composites reinforced with copper coated carbon nanotubes. Mater. Sci. Eng. A 2018, 715, 163–173. [Google Scholar] [CrossRef]
- Asgharzadeh, H.; Eslami, S. Effect of reduced graphene oxide nanoplatelets content on the mechanical and electrical properties of copper matrix composite. J. Alloys Compd. 2019, 806, 553–565. [Google Scholar] [CrossRef]
- Luo, H.B.; Sui, Y.W.; Qi, J.Q.; Meng, Q.K.; Wei, F.X.; He, Y.Z. Mechanical enhancement of copper matrix composites with homogeneously dispersed graphene modified by silver nanoparticles. J. Alloys Compd. 2017, 729, 293–302. [Google Scholar] [CrossRef]
- Xiong, D.B.; Cao, M.; Guo, Q.; Tan, Z.; Fan, G.; Li, Z.; Zhang, D. Graphene-and-Copper artificial nacre fabricated by a preform impregnation process: Bioinspired strategy for strengthening-toughening of metal matrix composite. ACS Nano 2015, 9, 6934–6943. [Google Scholar] [CrossRef]
- Jiang, R.R.; Zhou, X.F.; Fang, Q.; Liu, Z.P. Copper–graphene bulk composites with homogeneous graphene dispersion and enhanced mechanical properties. Mater. Sci. Eng. A 2016, 654, 124–130. [Google Scholar] [CrossRef]
- Williamson, G.K.; Smallman, R.E., III. Dislocation densities in some annealed and cold-worked metals from measurements on the X-ray debye-scherrer spectrum. Philos. Mag. 1956, 1, 34–46. [Google Scholar] [CrossRef]
- Shin, S.E.; Bae, D.H. Deformation behavior of aluminum alloy matrix composites reinforced with few-layer graphene. Compos. Part A 2015, 78, 42–47. [Google Scholar] [CrossRef]
- Arsenault, R.J.; Shi, N. Dislocation generation due to differences between the coefficients of thermal expansion. Mater. Sci. Eng. 1986, 81, 175–187. [Google Scholar] [CrossRef]
- Kim, W.J.; Lee, T.J.; Han, S.H. Multi-layer graphene/copper composites: Preparation using high-ratio differential speed rolling, microstructure and mechanical properties. Carbon 2014, 69, 55–65. [Google Scholar] [CrossRef]
- Hansen, N. Hall–Petch relation and boundary strengthening. Scr. Mater. 2004, 51, 801–806. [Google Scholar] [CrossRef]
- Zhang, D.D.; Zhan, Z.J. Strengthening effect of graphene derivatives in copper matrix composites. J. Alloys Compd. 2016, 654, 226–233. [Google Scholar] [CrossRef]
- Yan, S.J.; Dai, S.L.; Zhang, X.Y.; Yang, C.; Hong, Q.H.; Chen, J.Z.; Lin, Z.M. Investigating aluminum alloy reinforced by graphene nanoflakes. Mater. Sci. Eng. A 2014, 612, 440–444. [Google Scholar] [CrossRef]
- Miller, W.S.; Humphreys, F.J. Strengthening mechanisms in particulate metal matrix composites. Scr. Metall. Mater. 1991, 25, 33–38. [Google Scholar] [CrossRef]
- Wei, H.; Li, Z.; Xiong, D.B.; Tan, Z.; Fan, G.; Qin, Z.; Zhang, D. Towards strong and stiff carbon nanotube-reinforced high-strength aluminum alloy composites through a microlaminated architecture design. Scr. Mater. 2014, 75, 30–33. [Google Scholar] [CrossRef]
- Feng, B.; Kong, X.G.; Hao, S.J.; Liu, Y.N.; Yang, Y.; Yang, H.; Guo, F.; Jiang, D.; Wang, T.; Ren, Y.; et al. In-situ synchrotron high energy X-ray diffraction study of micro-mechanical behaviour of R phase reorientation in nanocrystalline NiTi alloy. Acta Mater. 2020, 194, 565–576. [Google Scholar] [CrossRef]
- Zhao, Y.H.; Bingert, J.F.; Liao, X.Z.; Cui, B.Z.; Han, K.; Sergueeva, A.V.; Mukherjee, A.K.; Valiev, R.Z.; Langdon, T.G.; Zhu, Y.T. Simultaneously increasing the ductility and strength of ultra-fine-grained pure copper. Adv. Mater. 2006, 18, 2949–2953. [Google Scholar] [CrossRef]
- Zhao, Y.H.; Bingert, J.F.; Zhu, Y.T.; Liao, X.Z.; Valiev, R.Z.; Horita, Z.; Langdon, T.G.; Zhou, Y.Z.; Lavernia, E.J. Tougher ultrafine grain Cu via high-angle grain boundaries and low dislocation density. Appl. Phys. Lett. 2008, 92, 081903. [Google Scholar] [CrossRef] [Green Version]
- Faber, K.T.; Evans, A.G. Crack deflection processes-I theory. Acta Metall. 1983, 31, 565–576. [Google Scholar] [CrossRef]
- Lange, F.F. The interaction of a crack front with a second-phase dispersion. Philos. Mag. 1970, 22, 983–992. [Google Scholar] [CrossRef]
- Hashin, Z.; Shtrikman, S. A variational approach to the theory of the effective magnetic permeability of multiphase materials. J. Appl. Phys. 1962, 33, 3125–3131. [Google Scholar] [CrossRef]
- Cheng, H.; Ren, W.; Wu, Z.; Gao, L.; Liu, B. Method for Preparing High-Quality Graphene with Controllable Layer Number. CN Patent 101993061 A, 30 March 2011. [Google Scholar]


| Product | Size (μm) | Chemical Composition (%) | ||||||
|---|---|---|---|---|---|---|---|---|
| Cu | Zn | Pb | Sb | Fe | Ni | S | ||
| SSCu | 0.5–1 | 99.95 | 0.001 | 0.001 | 0.001 | 0.042 | 0.005 | - |
| Cu | ~12 | 99.98 | 0.005 | 0.006 | 0.003 | 0.004 | - | 0.002 |
| Product | Purity | Peelable Rate | Diameter (μm) | C (%) | O (%) | S (%) |
|---|---|---|---|---|---|---|
| GO | 99% | >96% | 2–5 | <45% | >50% | <1.5% |
| Samples | Tensile Strength TS (MPa) | Elongation EL (%) | Streng Plastic Product UT (MPa %) | Yield Strength YS (MPa) |
|---|---|---|---|---|
| Cu | 195 | 43 | 8385 | 60 |
| 0.1%rGO/Cu | 165 | 30 | 4950 | 70 |
| 0.3%rGO/Cu | 95 | 16 | 1520 | 50 |
| 0.5%rGO/Cu | 107 | 18 | 1926 | 56 |
| SSCu/Cu | 232 | 50 | 11,600 | 106 |
| SSCu@0.1%rGO/Cu | 210 | 59 | 12,390 | 81 |
| SSCu@0.3%rGO/Cu | 245 | 59 | 14,455 | 119 |
| SSCu@0.5%rGO/Cu | 191 | 31 | 5921 | 52 |
Publisher’s Note: MDPI stays neutral with regard to jurisdictional claims in published maps and institutional affiliations. |
© 2022 by the authors. Licensee MDPI, Basel, Switzerland. This article is an open access article distributed under the terms and conditions of the Creative Commons Attribution (CC BY) license (https://creativecommons.org/licenses/by/4.0/).
Share and Cite
Yang, Y.; Liang, Y.; He, G.; Luo, P. Simultaneously Enhancing the Strength, Plasticity, and Conductivity of Copper Matrix Composites with Graphene-Coated Submicron Spherical Copper. Nanomaterials 2022, 12, 1025. https://doi.org/10.3390/nano12061025
Yang Y, Liang Y, He G, Luo P. Simultaneously Enhancing the Strength, Plasticity, and Conductivity of Copper Matrix Composites with Graphene-Coated Submicron Spherical Copper. Nanomaterials. 2022; 12(6):1025. https://doi.org/10.3390/nano12061025
Chicago/Turabian StyleYang, Yulong, Yilong Liang, Guanyu He, and Pingxi Luo. 2022. "Simultaneously Enhancing the Strength, Plasticity, and Conductivity of Copper Matrix Composites with Graphene-Coated Submicron Spherical Copper" Nanomaterials 12, no. 6: 1025. https://doi.org/10.3390/nano12061025