Article

Majorana Anyon Composites in Magneto-Photoluminescence Spectra of Natural Quantum Hall Puddles

by
Alexander M. Mintairov
1,2,*,
Dmitrii V. Lebedev
1,
Alexey S. Vlasov
1 and
Steven A. Blundell
3
1
Ioffe Institute, 194021 Saint Petersburg, Russia
2
Electrical Engineering, University of Notre Dame, Notre Dame, IN 46556, USA
3
SyMMES, IRIG, CNRS, CEA, University Grenoble Alpes, F-38000 Grenoble, France
*
Author to whom correspondence should be addressed.
Nanomaterials 2022, 12(6), 1016; https://doi.org/10.3390/nano12061016
Submission received: 22 February 2022 / Revised: 10 March 2022 / Accepted: 17 March 2022 / Published: 20 March 2022
(This article belongs to the Special Issue Quantum Dots)

Abstract

:
In magneto-photoluminescence (magneto-PL) spectra of quasi two-dimensional islands (quantum dots) having seven electrons and Wigner–Seitz radius rs~1.5, we revealed a suppression of magnetic field (B) dispersion, paramagnetic shifts, and jumps of the energy of the emission components for filling factors ν > 1 (B < 10 T). Additionally, we observed B-hysteresis of the jumps and a dependence of all these anomalous features on rs. Using a theoretical description of the magneto-PL spectra and an analysis of the electronic structure of these dots based on the single-particle Fock–Darwin spectrum and many-particle configuration-interaction calculations, we show that these observations can be described by the rs-dependent formation of the anyon (magneto-electron) composites (ACs) involving single-particle states having non-zero angular momentum and that the anyon states observed involve Majorana modes (MMs), including zero-B modes having an equal number of vortexes and anti-vortexes, which can be considered as Majorana anyons. We show that the paramagnetic shift corresponds to a destruction of the equilibrium self-formed ν~5/2 AC by the external magnetic field and that the jumps and their hysteresis can be described in terms of Majorana qubit states controlled by B and rs. Our results show a critical role of quantum confinement in the formation of magneto-electrons and implies the liquid-crystal nature of fractional quantum Hall effect states, the Majorana anyon origin of the states having even ν, i.e., composite fermions, which provide new opportunities for topological quantum computing.

1. Introduction

Superconducting (dissipationless) transport corresponding to zero electrical resistance of the materials, discovered in 1913 [1], gave a quantum mechanical illustration of Newton’s first law of motion, which states that moving material objects will conserve a constant velocity if no external force acts on them, and which represents an obvious paradox for our imagination, since natural movements observed in everyday life are subject to a frictional force and are slowed down. Thus, in superconducting materials, the persistent currents loops (PCLs) can be thought to be perpetual and laboratory measurements show their life-time to be at least 100,000 years [2]. In an external magnetic field (Be), the persistent vortex currents induce a perfect diamagnetism, i.e., the expulsion of Be from the superconductor (SC), known as the Meissner effect [3]. PCLs in SCs provide the quantization of the magnetic flux [4] in multiples of ϕ0* = h/2e0, where e0 is the electron charge, which was documented in the measurements of the magnetization of micrometer size SC cylinders [5,6]. Single ϕ0* vortexes, also called Abrikosov vortexes or fluxons, arranged in regular lattices, are generated in major SCs above the critical field Be1 [7,8]. The vortexes consist PCLs tens of nanometers in size, whose density is proportional to Be, and they merge at a critical field Be2 > Be1, transferring the material into a resistive state. Thus, the existence of ϕ0* is directly related to the existence of systems having SC-type dissipationless transport. Such transport corresponds to a suppression of the scattering (“friction”) of charged carriers and exists in systems having a gap in the density of conducting states, which in conventional SCs arises from the formation of the bound electron pair state known as a Cooper pair [9].
While it is commonly accepted to associate superconductivity with Cooper-type electron pairing, a zero electrical resistance, i.e., SC-type dissipationless transport, is observed in two-dimensional (2D) electron (e) gas semiconductor structures in the quantum Hall effect, i.e., at high perpendicular Be, at integer (IQHE) [10] and fractional (FQHE) [11] Landau level (LL) filling factors ν = nϕ0/Be, where ϕ0 = 2ϕ0* and n is the electron density. This transport is provided by a skipping-type edge current [12], which for the FQHE involves composite quasi-particles, called composite fermions (CFs) [13], consisting of e with 1/ν ϕ0 magnetic-flux-quanta vortexes (Vs) attached, resulting in a fractional charge equal to νe0. The presence of the Vs and SC-type gapped state, however, implies PCLs generated by CF e. While the necessity of such intrinsic sub-e PCLs was not considered in the commonly used description of the FQHE states, which is based on Laughlin’s approach [14], their existence was revealed in our recent observation of FQHE-type states for single [15] and five [16] electrons confined in quasi-2D InP/GaInP2 islands-quantum dots (QDs) having dimensionless Wigner–Seitz radius rs~4 and ~2, respectively, where rs = 1/[aB*(πn)0.5] and aB* is a Bohr radius.
The FQHE-type states have been observed in these QDs at zero Be using high-spatial-resolution magneto-photoluminescence (magneto-PL) spectroscopy in the measurements of the Be-dispersion of PL spectral components and their spatial localization. The appearance of these states results in a built-in magnetic field Bν~6–15 T and a dependence of the ground-state, equilibrium fractional charge ν0e0 on the dot size D, for which ν0 decreases with D. These observations imply a self-generation of Vs in a quantum state | i occupied by a single e, and a fixed size of the V (at zero external field Be) equal to 2aB*. The e, thus, can move without dissipation within a distance rsaB* and for rs > 1 can be considered as nano-superconducting puddle, having charge-density distribution ρ ( r ) = | ψ i ( r ) | 2 , where ψ i   is the wave-function of the state | i . Thus, ψ i   can be formally considered to be a complex SC order parameter of the linearized Ginzburg–Landau equation [17] used for the description of mesoscopic SC structures [18,19]. This single-e-puddle can support ~rs sub-e PCLs generating 1/ν0 Vs. This reduces the Coulomb interaction energy of es and, thus, the state having 1/ν0 sub-e PCLs and charge ν0e0 is self-formed [16]. The ν0 and corresponding Bν = n2ϕ0ν0 are directly determined by the dot size (D) and the number of es (N), i.e., rs. We called such a state a magneto-electron (em) and denoted it eν, where the em composition ν = n/k, with n (k) the number of es (Vs), is the quantity that substitutes the LL filling factor of the FQHE for quantum confined es. We observed ems having ν < 1, n = 1–4, k = 1–9 and molecular structures   6 e 1 / 4 , 5 e 1 / 4 , 3 e 2 / 7 , and 3 e 1 / 3 + e 4 / 15 , having eν size ~40 nm and bond length ~60 nm for N = 5 and 6. The last two structures are transformed into one another by photoexcitation involving the braiding and fusion of eνs, which are the elementary topological quantum computing (TQC) operations [20].
We should point out that our observations of the fractional charge and the self-formation of Vs of a single e at zero magnetic field sound like a paradox (similar to the perpetual persistent current in SC) or an artifact, not taking into account the quantum nature of single e states, for which non-zero angular momentum states consist of “fractional charge” parts, and relying on the famous experiment of Millikan demonstrating a “fixed” e0 value in charged oil droplets [21]. However, at the same time, in parallel experiments made by Ehrenhaft, much smaller charges, i.e., sub-es, have been revealed in metal (Au, Pt, …) particles (see description of Millikan-Ehrenhaft dispute on sub-e in Ref. [22]). Moreover, much later, a transfer of 1/3e0 charge from tungsten to Nb balls has been detected in experiments on superconducting magnetic levitation [23]. We can suppose that these observations can be connected to our observation of em.
Nevertheless, since we observed eν ems in QDs having ν < 1, one can expect their formation in QDs having ν > 1, as for FQHE states [24]. These states correspond to partial (total) filling of the highest (lower) LLs and involve CFs, which are anyons [16], in the highest LL and IQHE es in the lower one.
A much investigated ν > 1 FQHE state is the ν = 5/2 state, which, according to the conventional description, corresponds to the half-filled second LL and fully filled lowest one. The CFs in the second LL show non-Abelian anyon properties [25], which implies that they have half-flux Vs with a zero-energy excited state, known as a Majorana zero mode or simply a Majorana mode (MM) [26,27,28,29], and thus are a perspective for the realization of TQC [30,31].
In em, the MM is a particle-antiparticle pair, consisting of Vs having an opposite, anti-parallel direction/orientation. It can be naturally generated in a state having non-zero angular momentum lz, for which the e-wave-function has “anti-phase spatial splitting”. In such states, only half of the ψ i can generate V along the Be direction, which thus is a half-V having a MM excited state. For the em the MM adds two more Vs resulting in a two-times smaller charge, the signature of which was observed for the 5/2 state [32]. Moreover, since a MM adds zero magnetic flux, it can possibly be generated at zero Be.
A realization of self-formed ν0 > 1 ems/anyons in general and ν0 = 5/2 in particular requires a decrease of rs. In our earlier studies [33], we have measured a quantum Hall-type InP/GaInP2 QD having N~9, rs~1.5 and Bν~2 T, which approximately matches that expected for ν0 = 5/2.
Here, we analyze a few such dots in detail using measurements of the Be-dispersion of their PL spectra components. In the measurements, we have revealed several anomalies, which include suppression of the dispersion, paramagnetic shifts, jumps (up to ~2 meV), and their hysteresis. We found that the appearance of these anomalies depends on the dot size and the direction of change of Be. We analyzed the experimental data using a theoretical description of PL spectra and the electronic structure of such dots based on single-particle Fock–Darwin (FD) states and a many-particle configuration-interaction (CI) approach, which allows one to explain the observed anomalies by the self-formation of em-MM-anyon composites corresponding to ν0~5/2, their collapse and the emergence of the anti-em-MM composites induced by the magnetic field. Our analysis has shown that the formation of the ems corresponds to the generation of Vs by single and pair non-interacting es occupying quantum-confined states. This allows one to describe the FQHE in terms of liquid-crystal states involving Majorana anyons and opens new routes for the realization of topological quantum computing.

2. Materials and Methods

2.1. Natural Quantum Hall Puddles

The details of the growth procedure and structural and emission properties of the InP/GaInP2 QDs were described previously [34]. The dots have a flat lens shape (aspect ratio 10) and a lateral size D~50-180 nm. Their shape reveals a small elongation and asymmetry, which in most cases can be described as a combination of a ∼5% elliptical distortion (D/D = 1.05) and a 10% change of R. The specific structural property of this QD system [35] is an atomic ordering of the GaInP2 matrix material, which results in composite core-shell structure consisting of InP QD having zinc blende crystal structure surrounded by a few atomically ordered GaInP2 domains having rhombohedral crystal structure and size 10-50 nm. In this composite, the domains generate strong piezo-electric fields resulting in e doping (up to 20) and Bν (up to 15 T) forming natural quantum Hall puddles.
Here, we studied three of such puddles denoted D01m, D07m and D09m. They have a number of electrons N = 6 and 7 and D~75 nm resulted in the electron density n~3 × 10¹¹ and rs~1.3, which corresponds to a weak Wigner localization regime.

2.2. Single Dot Magneto-Photoluminescence Spectroscopy Measurements

We measured magneto-PL spectra of single puddles using a home-made near-field scanning optical microscope (NSOM) having spatial resolution up to 25 nm operating at 10 K and magnetic fields of up to 10 T. We used home-made tapered fiber probes coated with Al, having an aperture size of 50–300 nm in a collection-illumination mode. The spectra were excited by the 514.5 nm Ar-laser line (Edmundoptics, Cherry Hill, NJ, USA) and measured using a CCD (multi-channel) detector (Horiba, Piscataway, NJ, USA) together with a 280 mm focal length monochromator (Horiba, Piscataway, NJ, USA. The excitation power measured before fiber coupler was ~5 μW, which provided a power density of ~0.5 W/cm2. The spectral resolution of the system is 0.2–0.4 meV. σ+ and σ circular polarization were measured using λ/4 plate (Newport, Irvine, CA, USA) and linear polarizer (Newport, Irvine, CA, USA). In the spectra, we measured the shifts of PL peaks related to occupied e-shells versus Be, which were compared with the theoretical calculations and used to extract the charge of single particle states of the puddles.

2.3. Analysis of the Data

The shape of the PL spectra, i.e., the number of spectral components, their position and full-width-at-half-maxima, were analyzed using a multi-peak fitting procedure from graphic software OriginPro (version 20.0, Northampton, MA, USA)
The values of effective (screened) quantum confinement ħω0* (see Appendix A.3) and N were measured from the splitting and the number of anti-Stokes peaks in the PL spectra, respectively. For N, the measurements of the shifts of anti-Stokes components in magnetic field were used as well. The D values were estimated from the charge density distributions (CDD) calculated from the unscreened quantum confinement value ħω0 = ħω0*/0.7 and N values using CI approach [16,34] and from NSOM scanning experiments. Using N and D values we calculate n and rs. Note that these values are related to the photo-excited state having N* = N + 1 electrons.

2.4. Theory and Calculations

The theoretical description of the PL spectra of quantum Hall puddles in a magnetic field based on the Fock–Darwin (FD) spectrum is presented in Appendix A. The description involves a general model (Appendix A.1), an analysis of the single-particle states of InP/GaInP2 QDs involved in PL transitions using the 8 band k ¯ · p ¯ method, i.e., non-interacting electrons and holes (Appendix A.2), and the analysis of the effect of the Coulomb interaction on single-particle states using the Hartree–Fock (HF) method (Appendix A.3). The resulting formulas of the model, i.e., Be–dispersion of PL peaks, are Equations (A4c) and (A5) in Appendix A.4.
The ground states (GSs) of the puddles in a magnetic field are analyzed in Appendix B. Total energy and total angular momentum values were calculated using the multi-particle CI method (Appendix B.1) and the single-particle FD spectrum, including the vortex contribution (Appendix B.2). Both methods revealed GSs having fractional ν, suggesting em-composite (em-C) formation.
The parameters of em-Cs, which are composition νn+(νn)S, where n is number and S is a total spin, and charge eN* are specified in Appendix C.1 (see Equations (A6)–(A8)). There, a mismatch of the emission energy of em-Cs is analyzed and corresponding quantities, which are Δν jumps and related PL shift (Esem-C), are described (Equations (A9) and (A10)).
The fitting of the Fock–Darwin spectrum for the measurements of ν and details of the construction of the V structure of em-Cs are described in Appendix C.2 and Appendix C.3, respectively.

2.5. Summary of Measured Parameters

In Table 1, we summarize the initial zero-field parameters of the puddles, which are the number of the electrons in photo-excited state N* = N + 1, D, rs, ħω0*/ħω0, and the final parameters of em-Cs formed in these puddles obtained from the measurements and the analysis of the data, which are two intrinsic magnetic fields Bec and Bν (see below), and ν0(ν0+)S and νn(νn+)S values of the equilibrium and Be-induced em-Cs, respectively. In the notation of the compositions in Table 1, we include reduced charge value eN* as a superscript.

3. Experimental Results

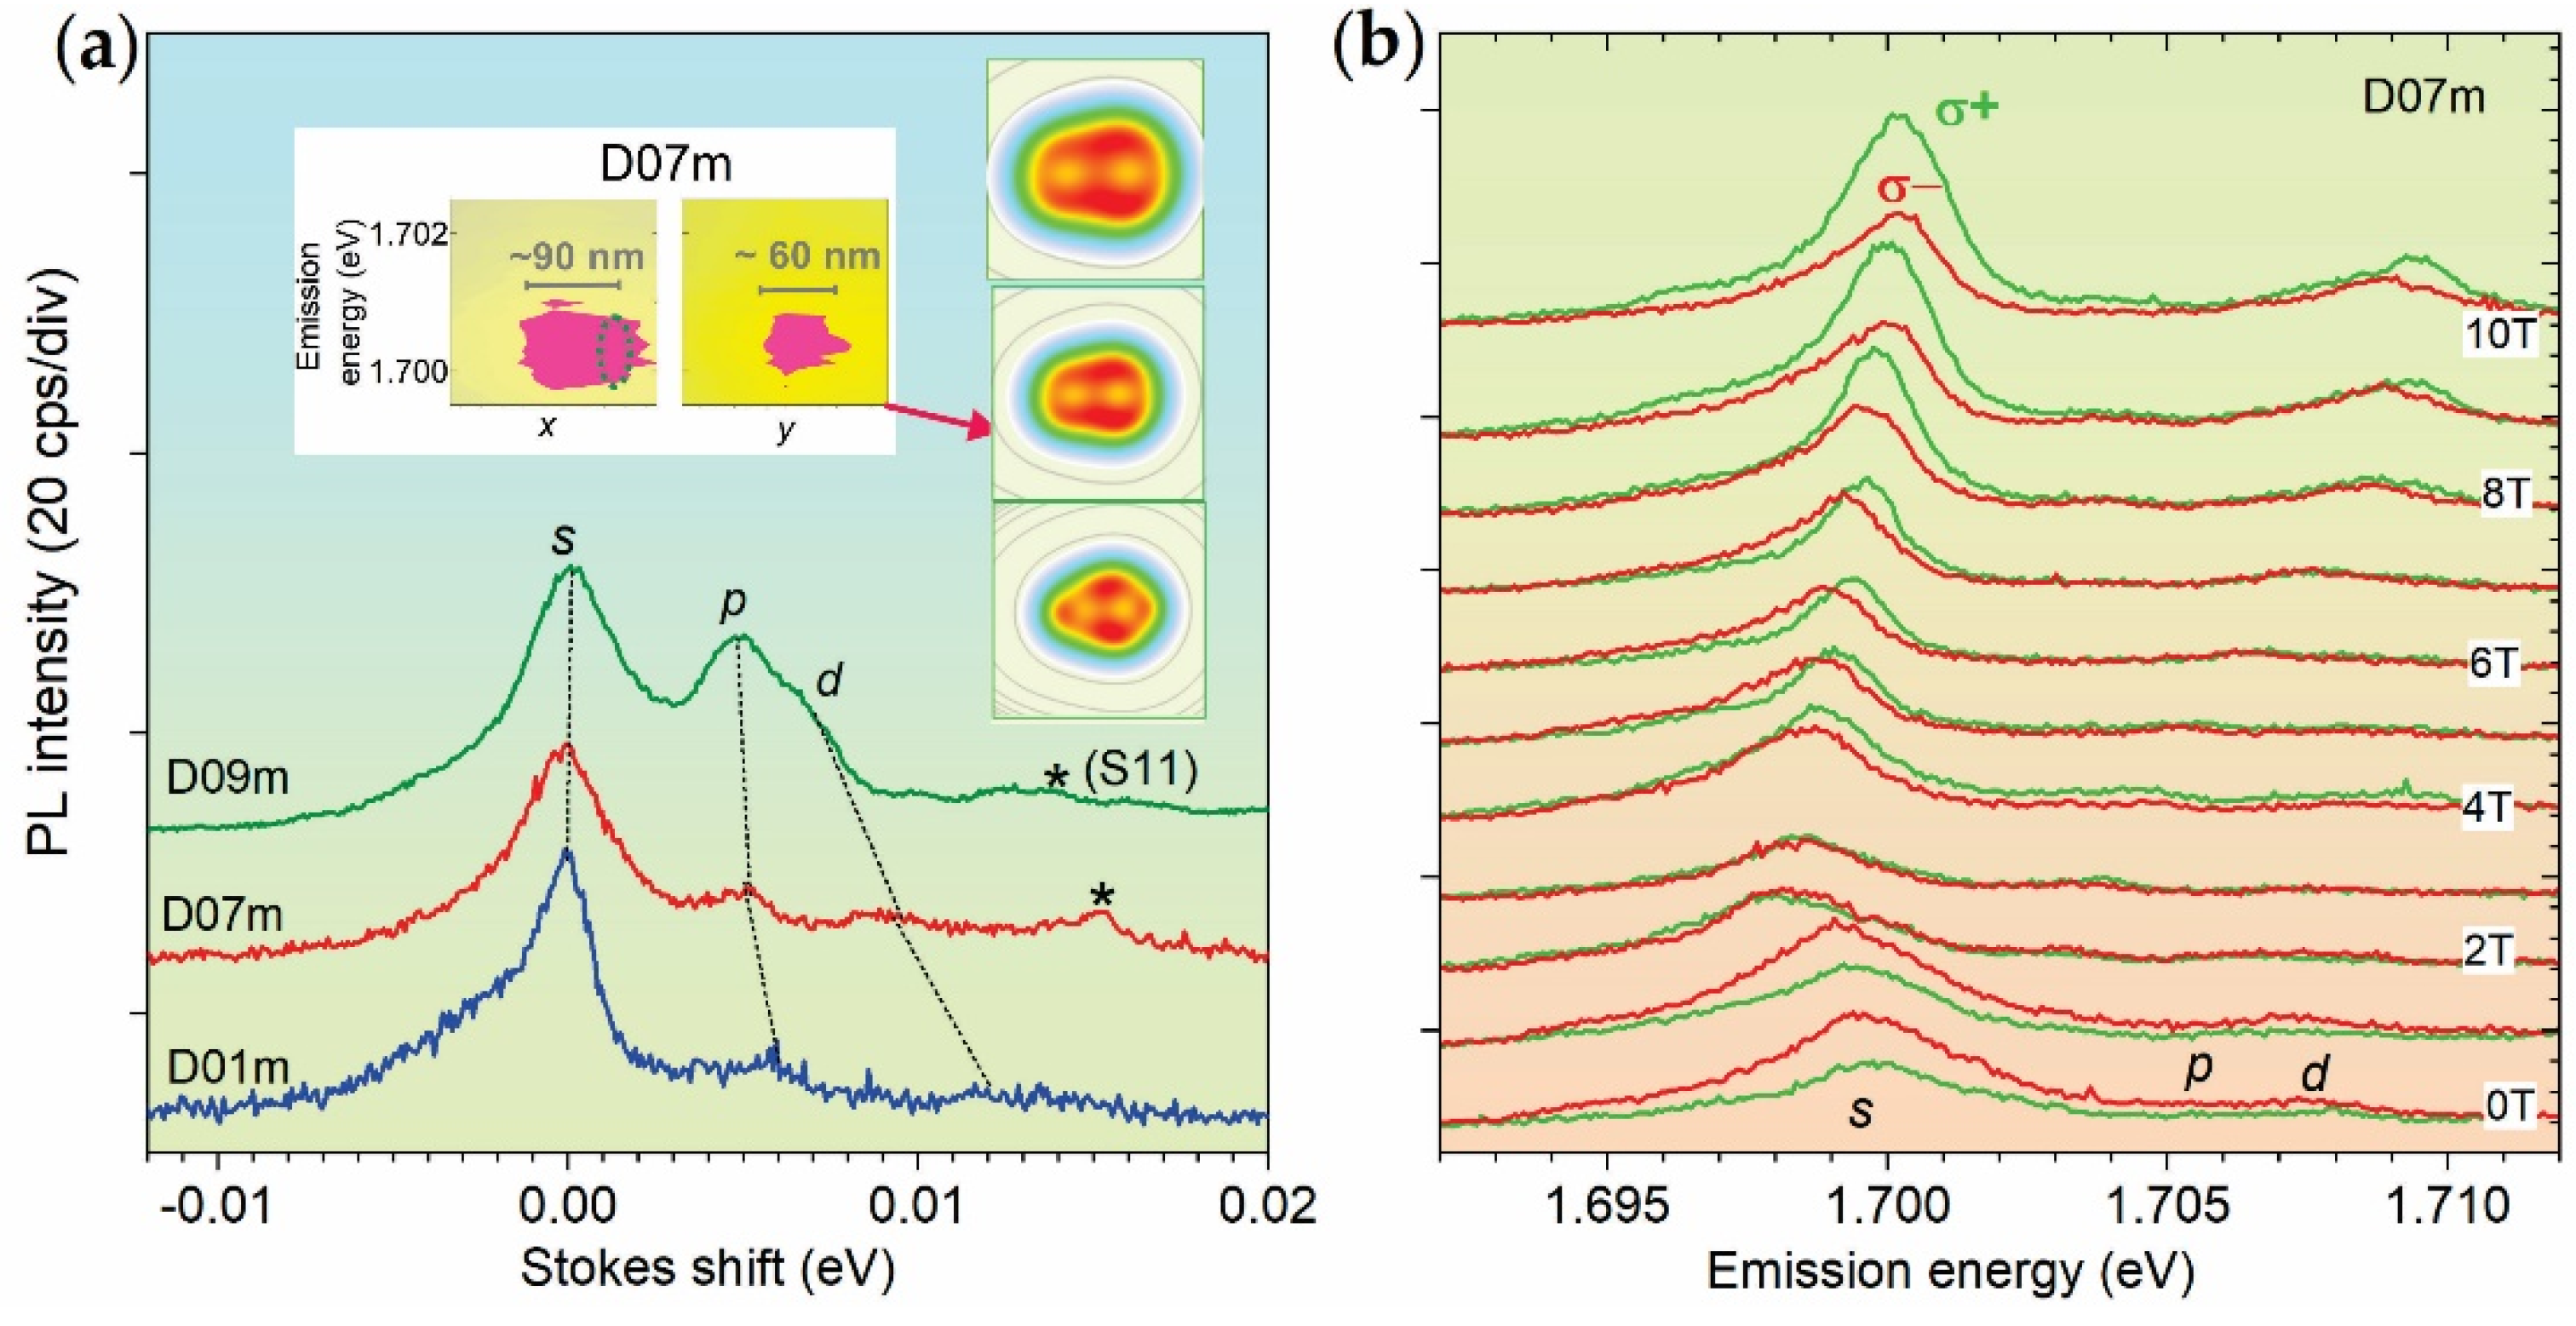
3.1. Shell Structure and Built-In Magnetic Field of Quantum Hall Puddles

Figure 1a compares the PL spectra of the dots/puddles studied at zero internal field B (see below), plotted in Stokes energy units. The inserts show CI CDDs of the dots and a contour plot of spatially resolved PL spectra near the center of D07m dot. Figure 1b shows circularly polarized spectra of the D07m dot measured at Be = 0, 1, 2, …, 10 T.
CDDs show a decrease of the size related to a decrease/increase of D/ħω0 (see Table 1). The CDDs are elongated along x and their landscape has the same topology consisting from two minima of ~D/6 size separated along x by ~D/3, which indicates molecular structure (see Appendix B.1). The left insert shows the measured size of the emission area of the D07m dot of ~90 × 60 nm (average size of 75 nm), in agreement with the corre sponding CDD size.
In Figure 1a, it is seen that the spectra of the dots studied consist of the main peak denoted by s and two weaker anti-Stokes ones denoted by p and d. These three peaks are related to three occupied e-shells of the QD in the photo-excited state, as described in Appendix A.1. The peaks have a full-width-at-half-maximum ~3 meV and varying splitting corresponding to ħω0* (see Table 1), related to the size variation. The D09m dot also has a few times larger relative intensity of p- and d-components. There is an increase of the ratio of the s-p to p-d splitting related to the size increase.
In Figure 1b, the PL spectra of the D07m dot at zero Be reveals nearly a two-times stronger intensity of the σ- component, i.e., they are σ-polarized, which indicates Bν. At Bec = 3 T, the σ-polarization disappears and the spectra acquire a σ+-polarization at larger Be. This indicates Bν~−Bec (see Table 1), where Bec is a compensating field and Bν has a direction opposite to Be. Thus, in the range from 0 T to Bec, the internal field B = Be + Bν is negative and decreases from Bν to zero. In this range, which we denote B↓ or Bea, Be < |Bν| and the PL spectra have an anomalous Be-shift (see below). Such an anomalous shift is a direct signature of Bν, which allows one to detect it independently from polarization measurements. For larger fields, i.e., Be > |Bν|, B becomes positive and increases versus Be. In this range, which we denote by B+↑ or Ben, normal Be-shifts are observed, but B is lower Be on Bec.
There is an anomalous Bea-range, indicating Bν in D01m and D09m dots too.

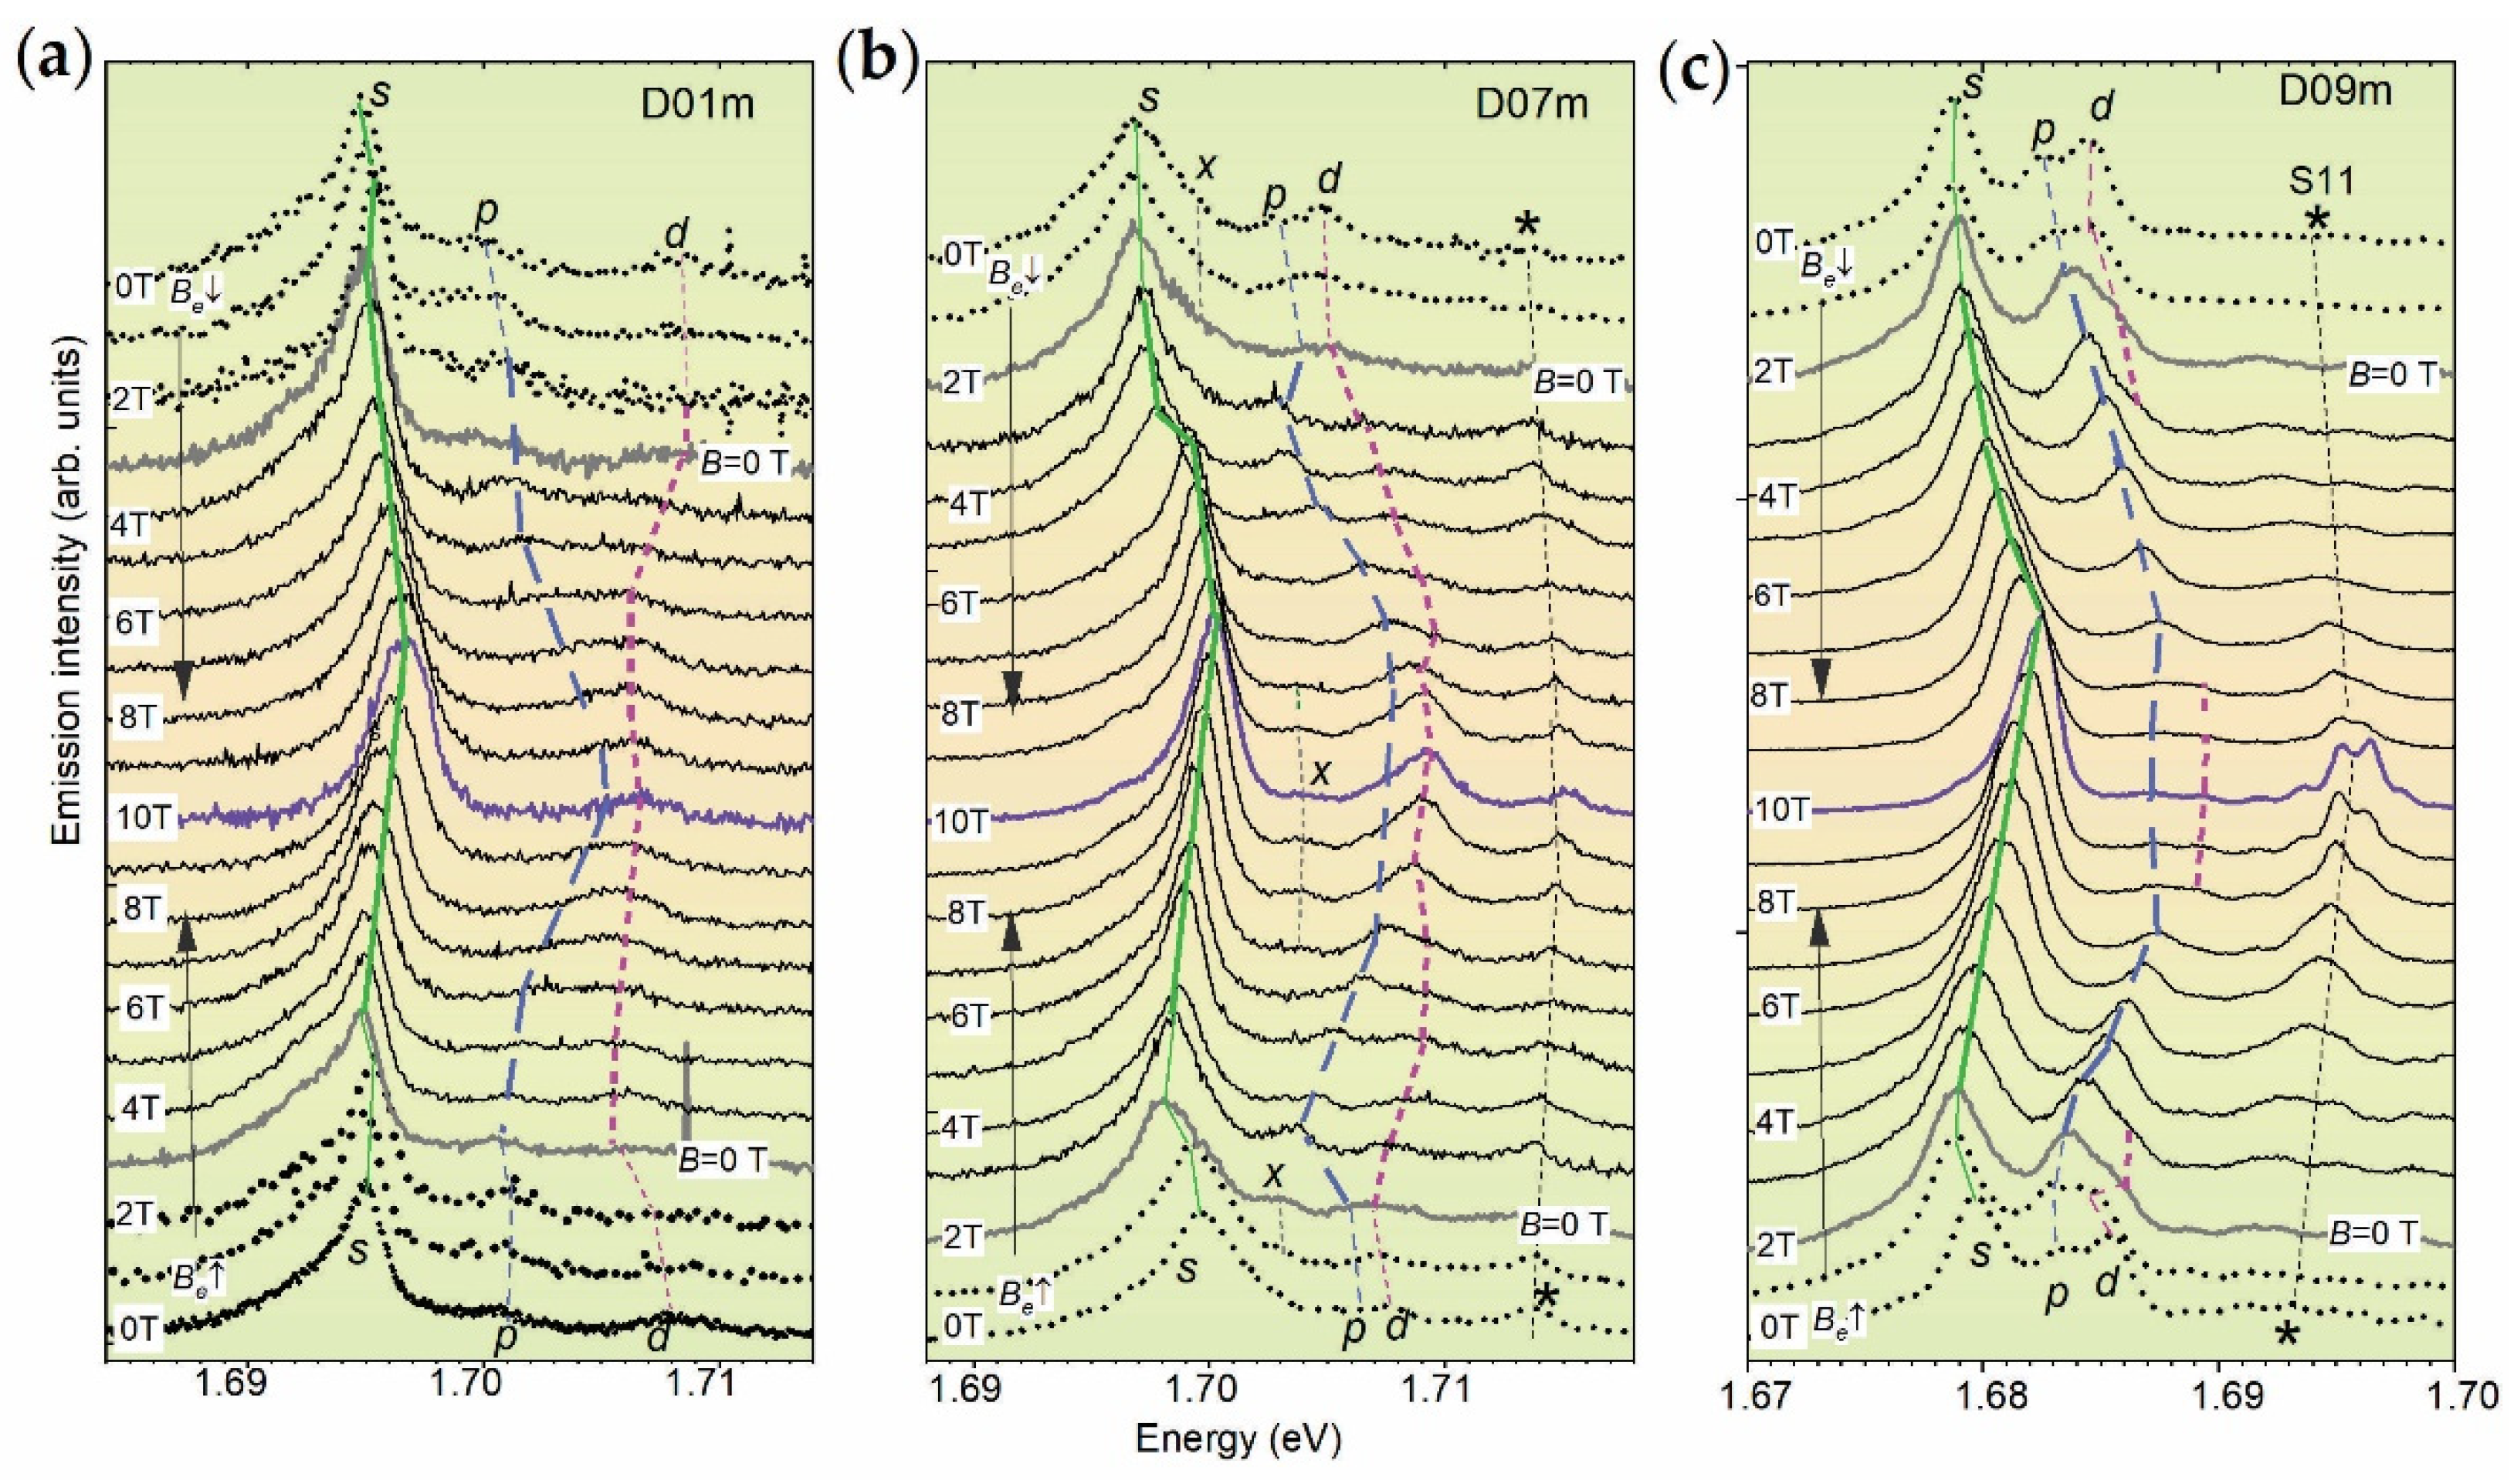
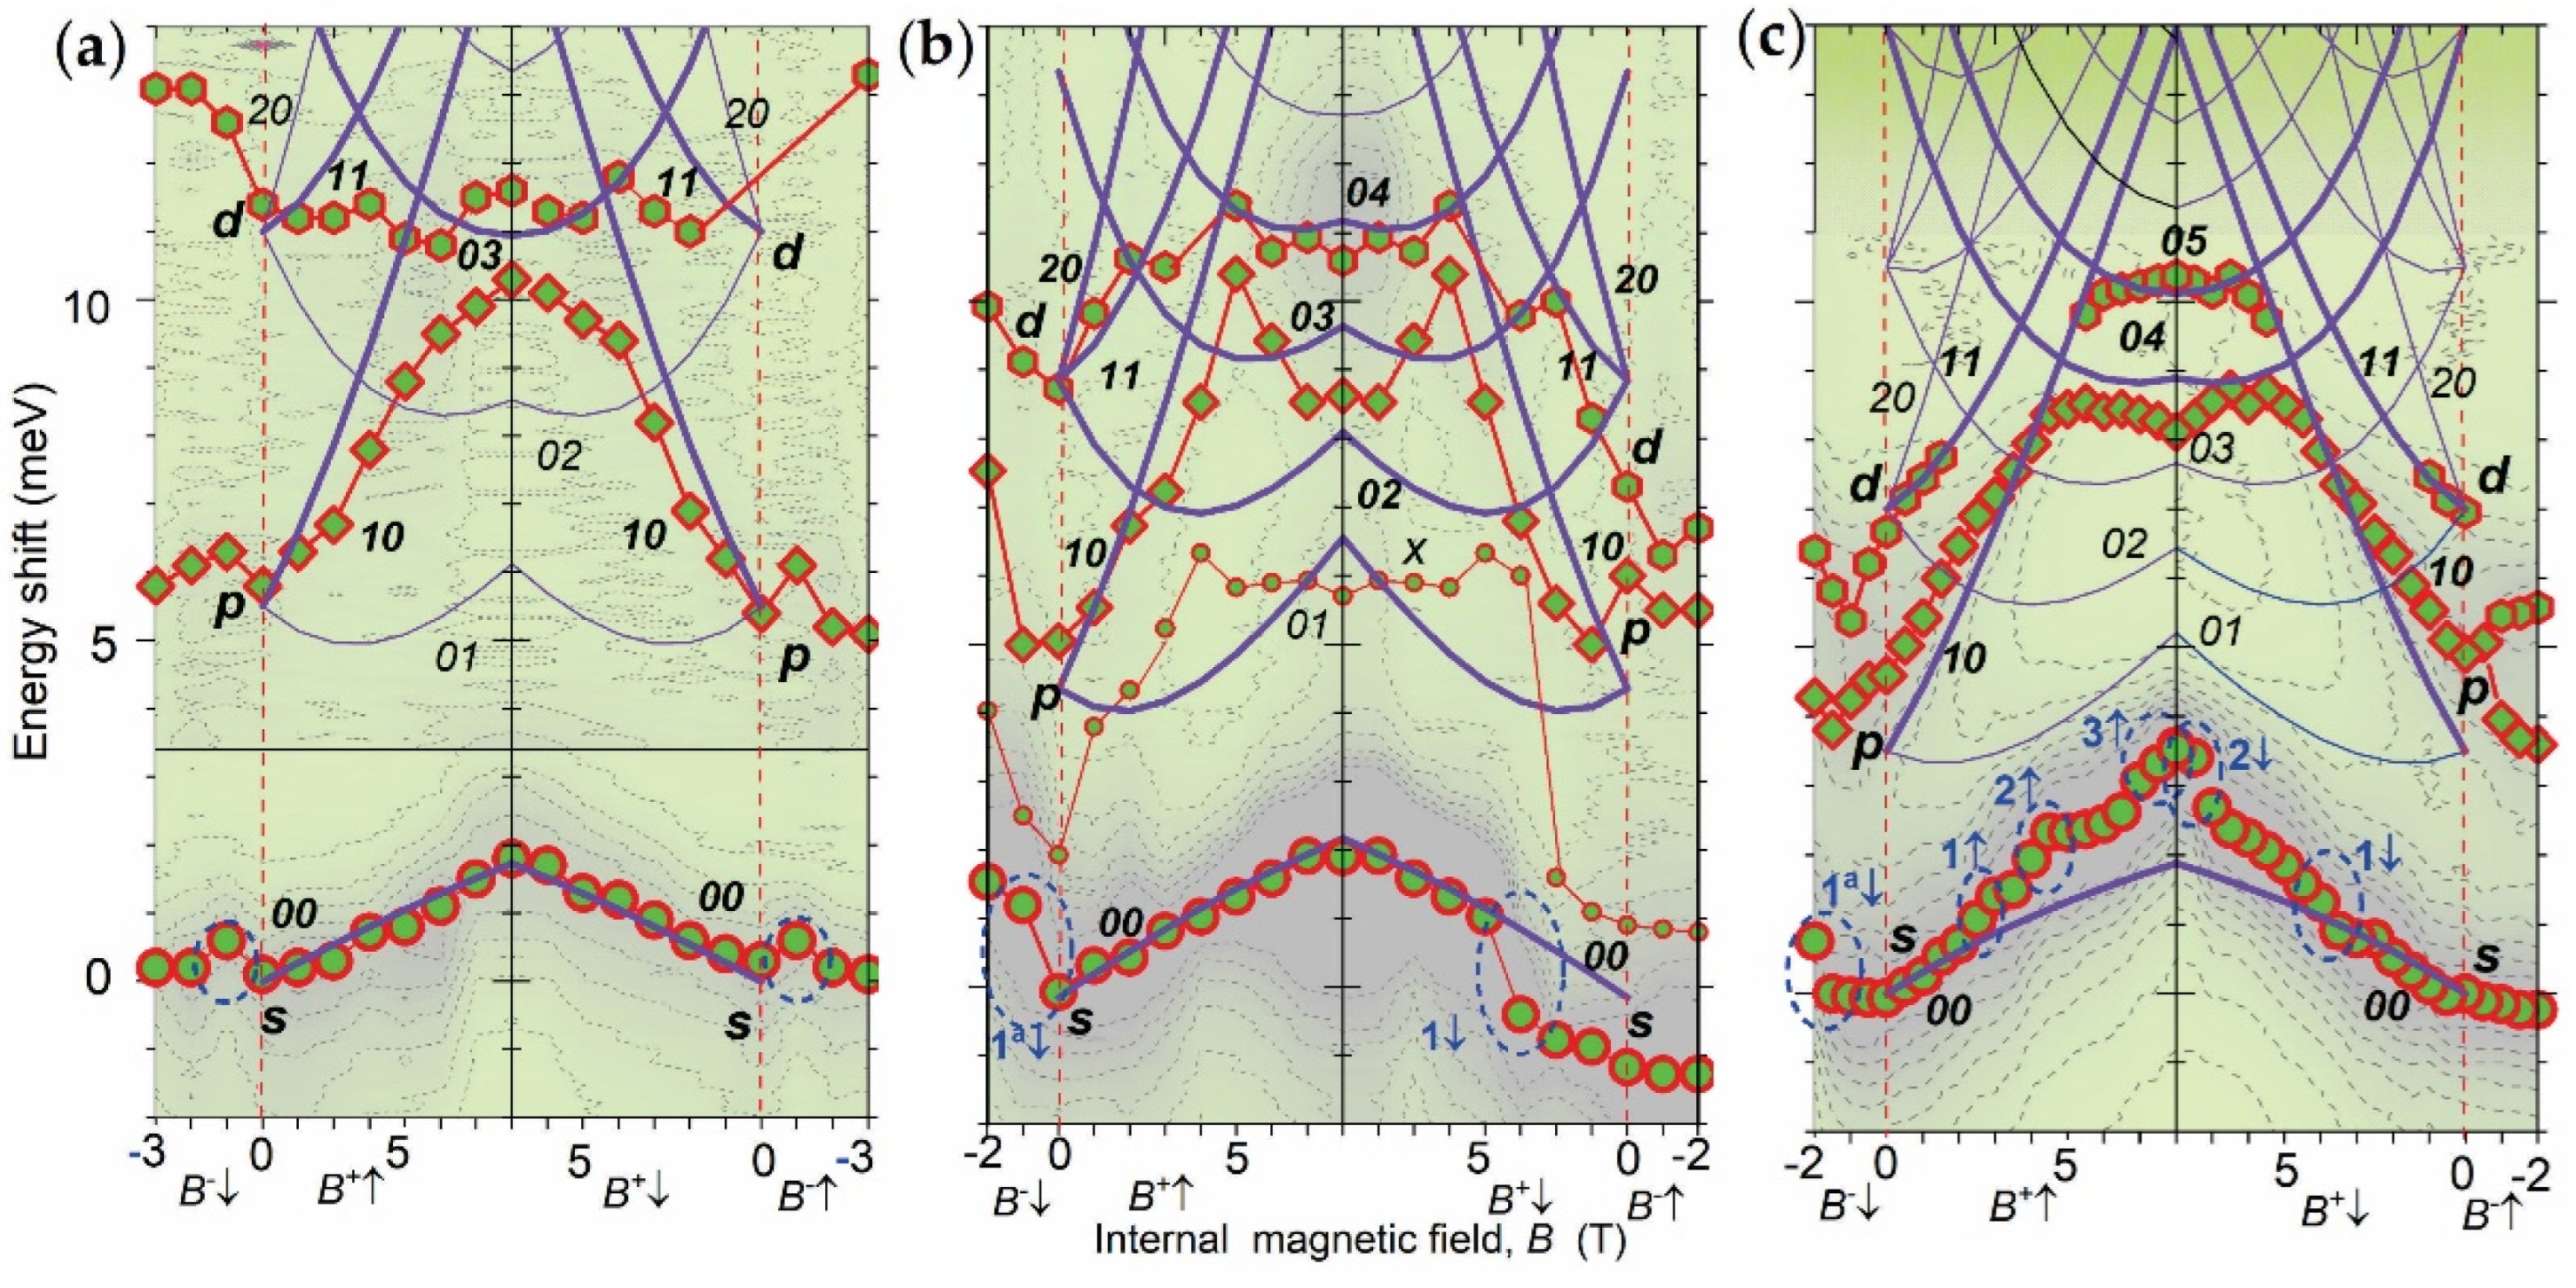
3.2. Shell Structure in Magnetic Field

In Figure 2a–c, we present unpolarized spectra of the dots, measured at Be = 0, 1, 2, … 10 T. The spectra were measured under an increase of the field from 0 to 10 T, denoted as Be↑ and shown in the lower part of the graphs, and a decrease from 10 to 0 T, denoted as Be↓ and shown in the upper parts of the graphs. For this range, the Ben and Bea ranges are the B+↓ and B↑–ranges, respectively.
The spectra having B = 0 T and dividing the Bea- and Ben-ranges (Bec = 3 and 2 T was found in D01m and D09m dots, respectively) are shown by thick solid lines. In Figure 2a–c, the peak maxima are connected by straight lines, which allows one to quali tatively trace their shift.
At all Be values, the s-peak is dominant, and changes of the spectral shape are caused by the changes of the intensity and the position of the p- and d-peaks at Be > 4 T. These are: the peak merging at Be = 7 T in the D01m dot; the few-times intensity increase of the d-peak at Be = 9 T and the appearance of the additional x-peak between the s- and p-peaks at Be = 7 T in D07m dot; a few-times intensity decrease of the p- and d-peak at Be = 8 T in the D09m dot.
The peak shift, further denoted as s, p- and d-shifts, in the Ben-range is mostly positive, i.e., increases with field increase, and at Be = 10 T reaches average values of ~2, ~5, and ~3 meV, respectively. In the Bea-range, the shifts are negative (paramagnetic), i.e., “anomalous”, and have values from 0 to 2 meV. In both ranges, the shifts reveal a few bends (see spectra near Be~3 T and 6 T).

3.3. Anomalous Shifts and Jumps Induced by Magneto-Electrons

In Figure 3a–c, we show the measured data points of the peak positions versus B and calculated B-dispersion of the peaks overlaid on the contour plots of the spectra. Calculated shifts are presented in the Ben-range, i.e., for B ≥ 0 T. The peaks are denoted by the quantum numbers of the Fock–Darwin (FD) spectrum kl (see Appendix A.2).
The s-shift data show that the bends seen in the spectra in Figure 2a–c are jumps having amplitude 1–2 meV over ΔBe~1 T (see dashed ovals in Figure 2a–c). Their appearance is different in different dots and B/Be ranges, revealing size dependence and Be↑–Be↓ asymmetry (hysteresis). In the D01m dot, one step is observed in both B↓– and B↑–ranges at B = −1 T, which is thus symmetric. In the D07m dot, two asymmetric steps are observed, one in the B↓– and the other in the B+↓–ranges at B = −2 and 5 T, respectively, and no mirror steps appear in the ranges of reversed direction of field change. In the D09m dot, four asymmetric steps are observed in the B↓– and B+↑–ranges at B = −2, 3, 5 and 7.
The calculated s-shift shows a weak, nearly linear dispersion with slope ~0.25 meV/T and in the regions where the jumps are absent the experimental slope is the same as the calculated one.
The p-shift follows a dispersion of 10-state up to Bc~5 T and at larger field the shift is saturated (for D01m dot) or becomes negative (for D07m and D09m) approximately reaching the 02–04 states, i.e., shows bending related to level crossing (see Figure A2c). The p-shift has a ~30% smaller slope than the 01-state (~1 meV/T).
The d-shift follows the 11-state for Be < Bc for all dots and the 03-, 04- and 05-states for B > Bc and the D01m, D07m and D09m dots, respectively, revealing a level crossing similar to the p-shift. For the D01m dot, the d-shift is strongly suppressed compared to the 11-state.
In the Bea range, the experimental data points do not coincide with mirror counterparts in the Ben-range, i.e., the shifts have a Bea/Ben asymmetry. This is most clearly seen for the d-peak in the D01m dot.
The appearance of the Bea-range is direct evidence for the existence of the ems in this range. For the Ben-range, the existence of the ems follows from the observation of the jumps of the s-peak and the suppression of the Be-dispersion of the p- and d-peaks for Be < Bc. The former are Δν steps and the latter is direct evidence for charge reduction of the e in the single-particle state (see Appendix C.2).
Since the B has opposite directions in the Bea and Ben ranges, the Vs and ems of the former are anti-Vs (aVs) and anti-ems (aems) in the latter (see Appendix C.1). The ems at zero Be are self-organized and can be considered to be equilibrium ems, which we will denote as S-ems. Thus, the shifts of the peaks in the Bae-range are related to the destruction of S-ems by the external field, which implies that the internal field generated by S-ems can be Bν ≠ Bec and the B decrease versus Be increase in this case is non-linear in the Bea-range, as observed. The ems in the Ben range are induced by the Be and can be considered as stimulated, further denoted as B-ems.

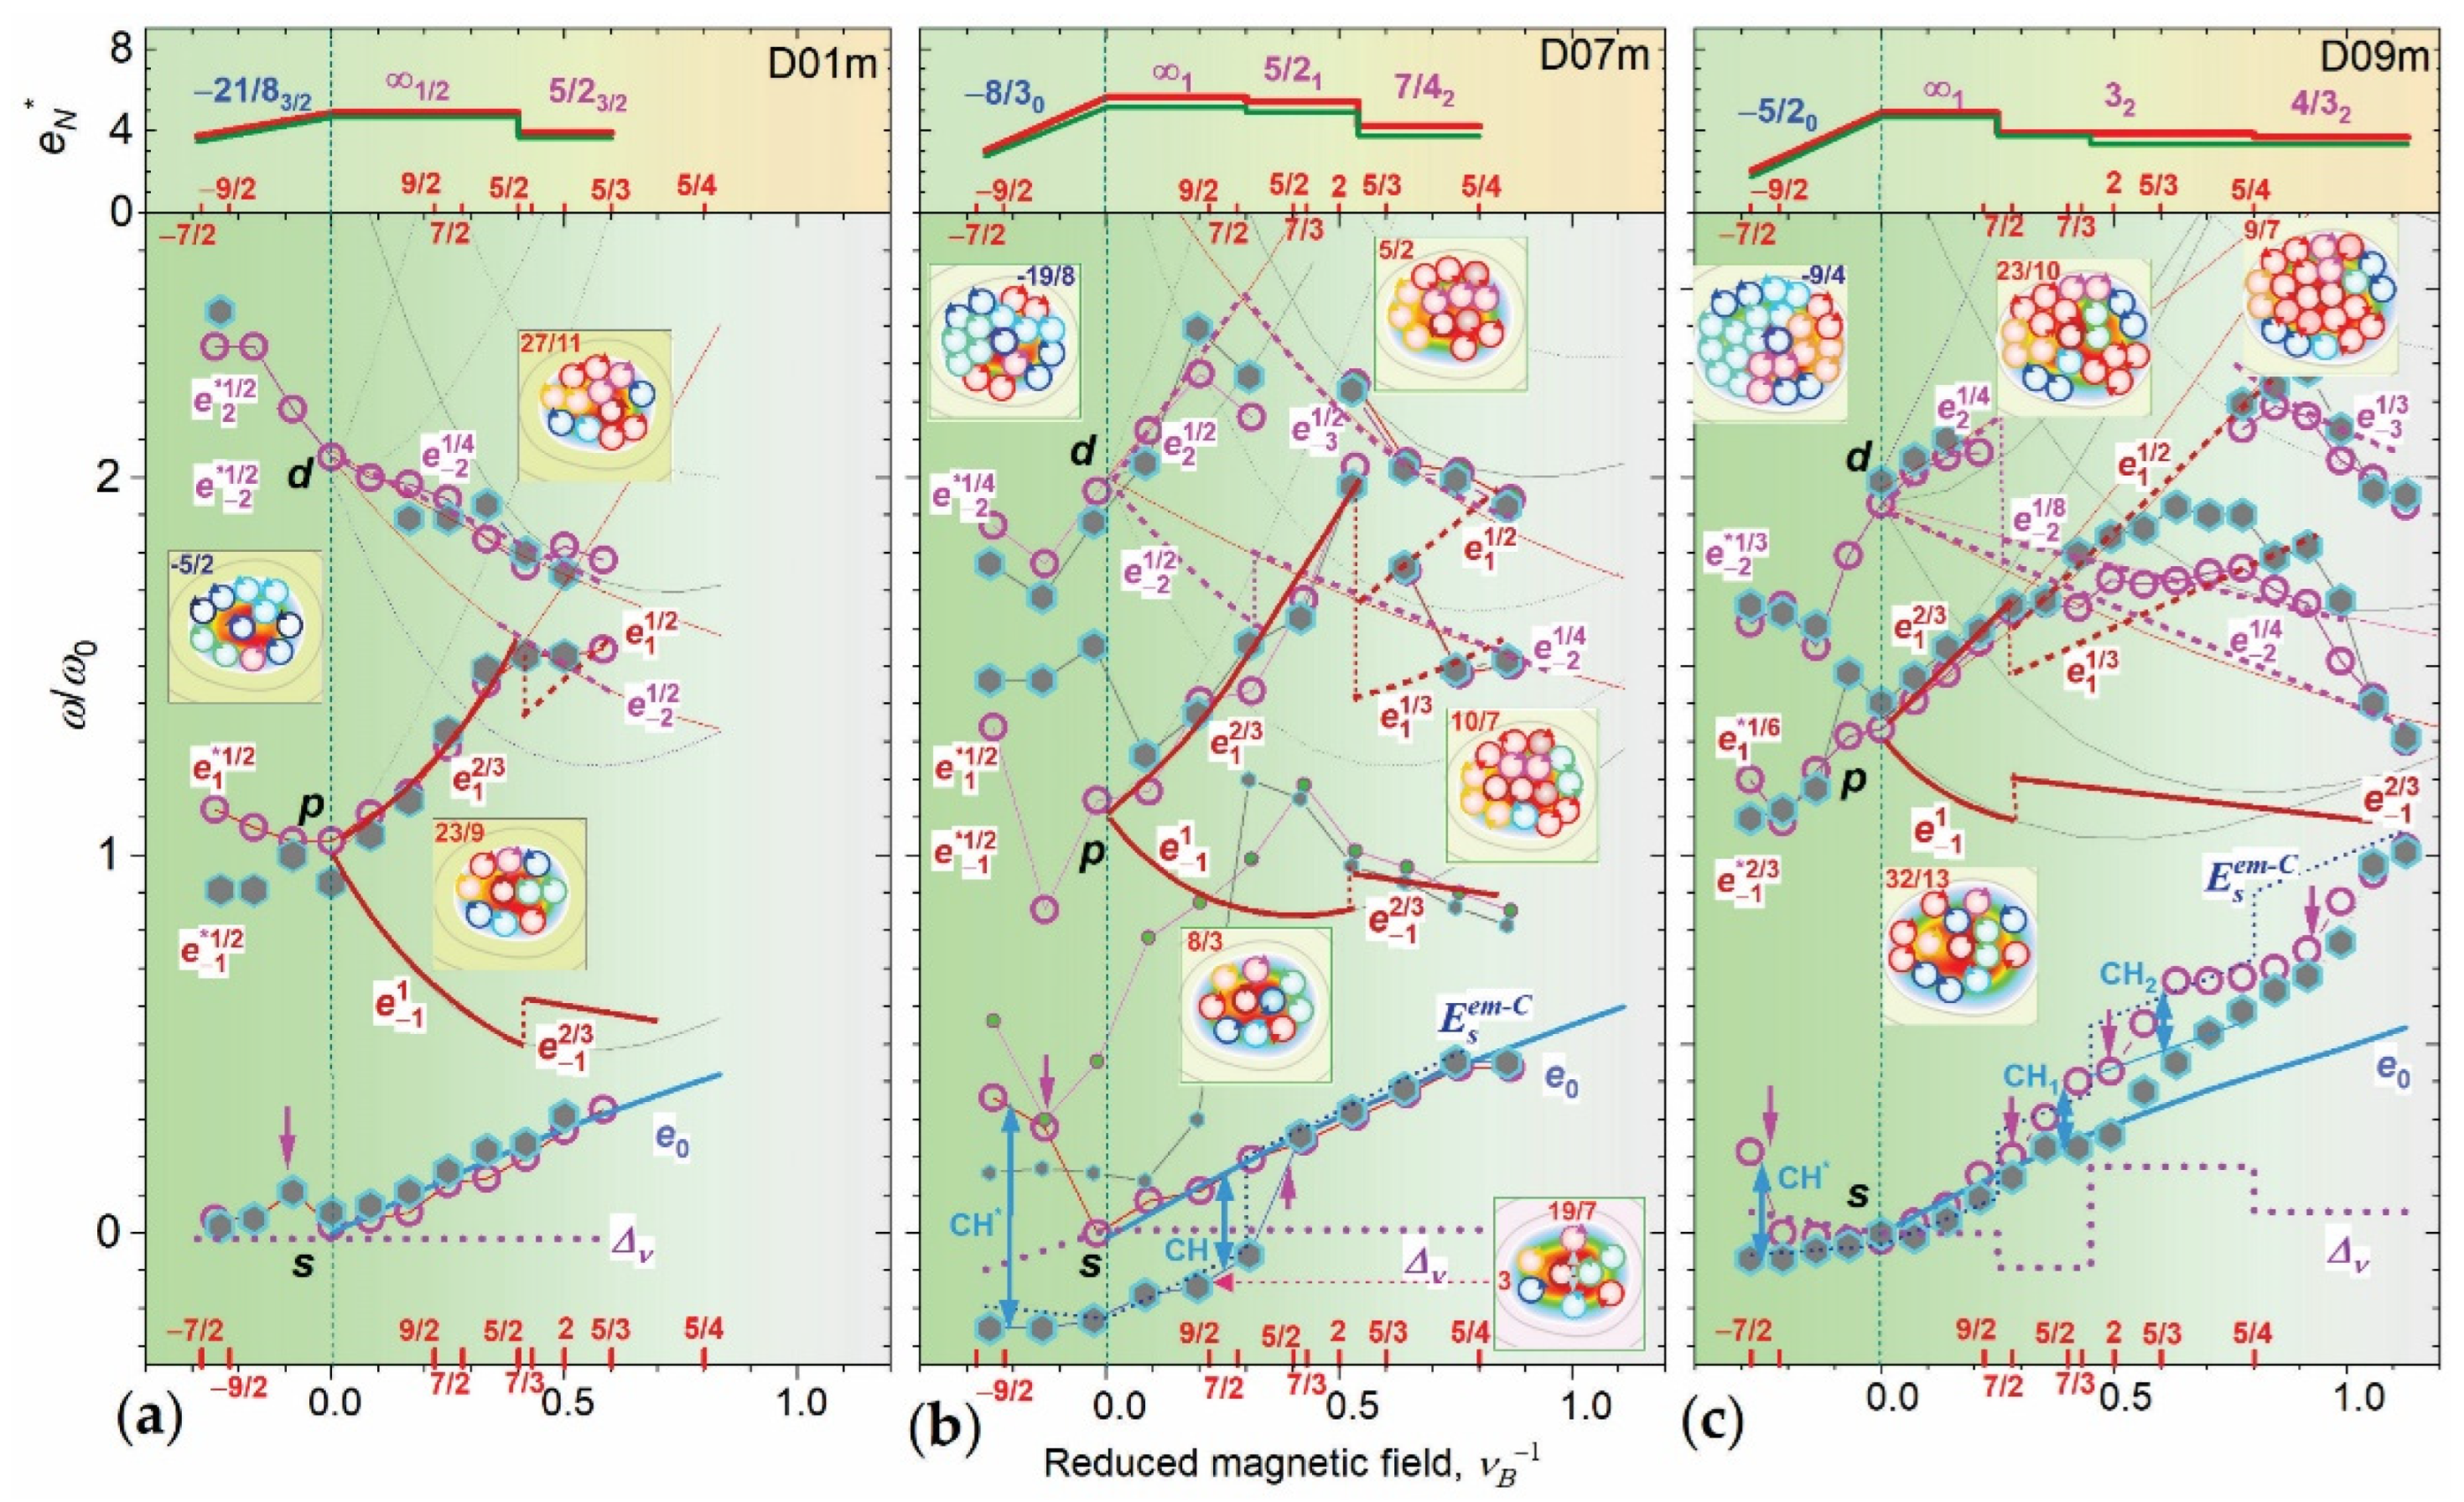
3.4. Majorana Anyon Composites in Fock-Darwin Spectrum

In Figure 4a–c, we present the results of the e-em-FD spectrum fit to the experimental data. The data and fit are presented in the reduced field νB-1 and energy ω/ω0 units (see Figure A2c) and the e-em-FD-states (e-em-FDSs) are labeled as eνl, where l is angular momentum of the state (see Appendix C.1). In the figures, we also show total charge values eN* (upper plots) and constructed V-structures (inserts). Total charge values are shown for photo-exited and initial states and were used to calculate the Δν and ESem-C. The experimental data for Be↓ and Be↑ measurements are plotted in the same graph and they reveal a Be↑–Be↓ asymmetry of the s-peak jumps as discussed above, and the same for p-shift in D07m and D09m for νB−1~0 and 0.4–0.9, respectively.
A comparison of the plots in Figure 4a–c shows different νB−1 ranges, acquired using the same Be range, in the dots studied, which is due to the different dot size giving an increase of the ν = 1 field B0 as D decreases (see Appendix B.1). The final νB−1value is 0.6 for the smallest D01m dot and 1.1 for the largest D09m dot. At the same time, the νB−1 starting value is the same ~−0.29, i.e., ν~−7/2.
In addition, a comparison of the plots shows that the νB−1-dispersion of the FDSs is smoothed out as D increases (see the shallowing of 2e1 level “depth” at νB−1~0.5), which shows a suppression of the quantum confinement effect.
The data in Figure 4a–c show that the ems are observed in the p- and d-single particle states forming B-em-Cs over the entire Ben-range measured. The composites correspond to a set of n GSs |νnS1+ > N1/νB given in Table 1. In all B-em-Cs, only the 2e s-state is em-free and has ν = 2 (e20-state) for n = 1 and 2 and ν = 1 (2e10-state) for the n=3 composites. The rest are B-em states, which have ν = 1 and 2/3 for 2e py/px-states and ν = 1/2, 1/3, 14 and 1/8 for 1e 10(px)-, 02(dy)-, 20(dx)- and 03(fy)–states, depending on B, N* and D.
The n = 1 structures in the inserts in Figure 4a–c show that in the D01m dot B-emM-C has two single-state Majorana ems (emM) (see Appendix C.1) e1-1(0) and e1/4−2(0) and one two-state emM, formed by s-e and e2/31 states, in which the V of the former is compensated by the aV of the latter. Note, however, that this compensation is not complete since two s-es in the ν = 2 state generate two-times smaller flux. In the D07m dot, the n = 1 emM-C has the same number of Vs NV since the extra e generates e1/22(0) emM in a dx-state taking two Vs from the dy-state. In the D09m dot, MMs e1/2−2(2) and e1/22(2) are generated in dx- and dy-states increasing the NV on four Vs/aVs.
For n = 2 and n = 3, emM-C are formed by the addition of Vs and elimination of aVs, resulting in an increase/decrease of NV/νnS+. Thus, we observed the expected NV increase, with an increase of D and B, and the minimum NV value of 9 has n = 1 emM-C in D01m, while the maximum of 21 has n = 3 em-C in D09m.
The charge values obtained are in the range eN = (3−6)e0, which is thus up to two times smaller than that without ems, i.e., (7–8)e0. The reduced charge for n = 1 corresponds to a zero field Bν generated by the composite, i.e., ν1S+ = ∞, and thus can be considered as Majorana anyon/em-C (emM-C). This emM-C has eN* = 4.91, 5.66, and 4.91 in the dots D01m, D07m and D09m, respectively, which shows that the increase of eN of D07m relative to D01m due to an extra e is compensated in D09m by its decrease due to the increase of the NV.

3.5. Charge Hysteresis and Majorana Modes

The Δν values calculated show an absence of the steps in the D01m and D07m dots and their presence in the D09m dot (see the corresponding curves in Figure 4a–c). Zero Δν (no steps) occurs when the photo-excited (topmost) em states and the initial states of the neighboring em-Cs have the same ν and NV, respectively (see Equation (A9)). This is the case for the smallest D01m dot for both Be↑ and Be↓ measurements.
For the intermediate size D07m dot, this took place only in the Be↑ data, and in the Be↓ data a negative jump occurs at νB−1~0.27 (ν~7/2). After the jump, the low-energy position of the s-peak is maintained under a further field decrease down to zero. This shows that two emM-Cs exist in the initial state in the D07m dot, which are 3(∞) and 19/7(∞) emM-Cs (see V-structure in the lower right insert in Figure 4b), among which the latter is a MM of the former appearing because of the generation of an e1−1(0) emM. The Be↓-jump is thus related to a charge increase in the initial state due to NV reduction in the 3(∞)-emM-C and is reproduced well by Eem-Cs(B). Thus, Be↑–Be↓ measurements reveal charge hysteresis (CH). CH is accompanied by Be↑–Bep-peak splitting at νB−1, B = 0, which can indicate generation of additional Vs in the p-state.
In the largest dot D09m the νl values of the four topmost em states are 1/42, 1/8−2, 1/21, and 1/3−3, which are different and thus give three Δν steps at ν = 7/2, 2 and 5/4, the first and the third of which are negative, as is seen in Figure 4c. The number and position of these steps match well to that of the Be↑ experiment, but the sign of the first and third jumps is positive instead. This implies a MM in the corresponding initial state, substituting Vs of the photo-excited em. Analysis has shown that this is the e1−1(0) emM (the same as in the D07m dot) forming the e2/5−1(1) em from the e2/3−1(1) one. The calculated Esem-C accounting for this MM shows good agreement. The Be↓ data show two CH starting at ν~5/4 (CH1) and 2 (CH2), respectively. In the CH2 em-C, there is an increase of p-peak energy, indicating the generation of additional Vs.

3.6. Collapse of S-Magneto-Electron-Composites

The structure of S-em-Cs and the ν0+(Bν) values can be derived from the crossing of the positions of the p- and d-peaks at Be = 0 and em-FDSs of the Bn-range. Thus, a position of the topmost d-peak corresponds to a dx-state at ν ~5/2 and S = 3/2 in the D01m dot and to dy-state at ν~5/2 and S = 0 in the D07m and D09m dots. Note that while for the D01m dot the total spin of the mirror aem S- and B-composites is the same (3/2), for the D07m and D09m dots it is different (0 versus 1 and 2). Note also that the ν0+ value of all dots (see Table 1) are nearly the same, i.e., ~5/2 (for dots D01m and D07m ν0+ = 5/2 + 1/8 and 5/2 + 1/6, respectively), and the corresponding Bν values are larger than Bec on ~1 T.
The preference of the self-formation of the S-em-Cs follows from their smaller charge compared to the B-em-Cs; it is 3.75e0, 3.05e0 and 2.08e0 for the S-em-Cs versus 3.91e0, 5.41e0 and 3.85e0 for the B-em-Cs for the D01m, D07m, and D09m dots, respectively. Charge reduction is provided by the extra Vs in the p-states (see the corresponding V-structures in the left inserts in Figure 4a–c) and thus there can be some mechanism for selecting the V direction in these states. These preferential Vs create e*1/2−1(2) and e*1/61(4) S-ems (we add a superscript * to distinguish S-ems from B-ems).
In the D01m dot, a symmetric positive s-jump at νB−1~0.1 related to S-em-C destruction indicates the generation of aVs/Vs decreasing/increasing Bν needed for formation of n = 1 B-em-C/S-em-C in Be↑/Be↓ measurements. A transition to S-em-C for the Be↓ data is accompanied by a red shift of the p-peak, indicating emission of the py-component, which is not seen for B-em-Cs. Its appearance implies a redistribution of the hole density (see (Appendix A.3) under V formation and the instability of B-em-C.
In the D07m and D09m dots, negative Bes-jumps correspond to the annihilation of MMs under a decrease of B and their absence in the Be↓ data indicate a suppression of the MM under the collapse of n = 1 B-em-Cs. The signatures of S-em-C instability in these dots is a Be↑–Be↓ splitting of the p-peak, which is stronger in D07m dot.

4. Discussion

4.1. Majorana Anyons

A subset of the GSs measured is different from that obtained in the exact quantum mechanical CI calculations in Appendix B.1. For D09m dot, they are |∞1, 32, 4/32 > 81.1 (see Table 1) and |80, 7/21, 7/30, 21 > 80.6 (see Figure A2a,b), respectively, showing a reduction of the number of B-em-C GSs compared to e-GSs due to a suppression of the level crossing (see Appendix C.2). The CI set includes fractional ν GSs, which, however, do not imply a generation of Vs by single electrons, i.e., fractional charge, and reflect only a matching of the number of Vs to the total angular momentum value [36,37]. Moreover, the observed B-em-Cs have a variety of MM states, including d-type MMs, emM and emM-Cs, which is unexpected and very important accounting for the limited experimental data on MMs (mainly for the p-type-states) in FQHE [25], one-dimensional hybrid superconductor topological structures [38,39] and in topological superconductor [40]. Thus, our observations give high impact to the physics of anyon/Majorana states and to the perspectives of their use for TQC. Note that from five em-Cs observed there is only one MM-free, which is a ν2,1+ = 5/2 composite in the D07m dot, and, thus, MMs seen are intrinsic features of the confined electrons for ν > 1, in contrast to ν < 1 molecular states [16]. In the context of emM and emM-Cs, a SC analog of such states has been reported in the compound EuFe2(As1−xPx)2 [41].
The Δν steps observed demonstrate detection of fractional charge variations related to MMs using PL spectra. Moreover, the observed CHs are related to the states with and without MM, i.e., to a MM qubit (see Appendix D), and for the D07m and D09m dots these are zero-field qubits. This two-level qubit can be used in conventional schemes of quantum computing and/or quantized information bit of classical Boolean logics [42]. The data show that the appearance of the Δν steps depends on D, N and B, or more generally on NV and rs, and is suppressed with rs decrease. This gives the opportunity for engineering of MM qubits. The CH is related to the suppression of aV generation under a decrease of the field and evidently reflects some fundamental interaction between em Vs and a sign of the magnetic field variation, which needs further investigation.

4.2. Magneto-Electrons and Fractional Quantum Hall Effect States

Our experimental results presented here and in the previous studies [15,16] show that the fractionally charged em-anyons emerge in the quantum confined (gapped) e-states, which allows superconducting-type sub-e PCLs/Vs generated by a single or a pair of es, creating ems. This allows consider a description of the FQHE in terms of a liquid crystal (LC), rather than as an incompressible liquid, in which specific νnS+-B-em-C is a unit cell of the crystal. The nucleation of the νnS+-B-em-C LC is provided by a quasi-ordering of potential fluctuations (PF) [43] of the corresponding size as was suggested by us in [15]. The experimental evidence of such quasi-ordering is the observation of the Wigner-crystal-type network patterns of the localized electron states for ν = 1, observed in a scanning electrometer probe experiment in quantum Hall 2D-e structures [44].
Within the LC description, the conductivity plateaus are quantum-confined-type LS plateaus (see Figure A2b,d) rather than a set of states above the mobility edge of the disorder-broadened LLs. The LS plateaus strongly overlap, as follows from the ELS curves in Figure A2e, which is consistent with the models describing the temperature-dependence of the width of IQHE and FQHE plateaus [45], revealing a Lorentzian broadening of LLs. Moreover, LC description does not involve e-e interaction as shown in Appendix B.
We can suggest that the emM Majorana anyons revealed are the CFs of the quasi-particle description of the FQHE and they naturally explain the zero internal field of CFs, leading to a termination of the conductance plateaus at even fractional filling factors. The description of CFs using LC implies B-em-C consisting of e1/20 and e1/2−1(0) ems, in which the latter contribute to the conductivity. The S-em-C of such type can explain the ½ and ¼ fractional quantization of the conductivity of the holes and electrons in Ge [46] and GaAs [47] nanowires, respectively, in a zero magnetic field and the “0.25 anomaly” of the conductivity of a point quantum contact [48,49].
The signatures of emMs in these experiments using confined geometries, i.e., probing of submicron areas, imply that the corresponding PFs are naturally formed in 2D-e structures and that their short- versus long-range order arrangement determine the formation the corresponding LCs and FQHE conductivity plateaus. Thus, in the extremely pure, high mobility structures in which FQHE plateaus emerge, the imperfection density is in a dilute regime (~1%), which provides a wide spectrum and long-range order of the PFs [43], induced by S- and B-em-Cs. The PFs depth in 2D-e-structures is ~10 meV [50], which is an order of magnitude smaller than in InP/GaInP2 QDs, and we can expect that the FQHE LC states will include em-Cs having size ~50 nm, adopting only s- and p-ems, and assume extended imperfections having a size of at least a few nanometers.

4.3. Majorana Anyons and Topological Quantum Computing

The proposal of the topologically protected qubit involving the ν = 5/2 state [31] is based on Laughlin’s quasi-particle description of FQHE states [14], in which this state is assigned to a non-Abelian topological phase characterized by a Pfaffian wave function [51,52]. This state is considered as a set of degenerate p-wave paired fermions having charge e0/4. The qubit is formed by a zero-energy Majorana excitation of a fused fermion having charge e0/2. We can suggest that the em analog of the e0/4 fermion is e20 + e1/8−1(2) B-em-C, the e0/2 state is e20 + e1/8−1(2) + e1/81(2) B-em-C, formed by addition of two es, and MM is e20 + e1/8−1(2) + e1/81(0) B-em-C. It follows from our results that it may be possible to realize and measure such B-em-Cs in InP/GaInP2 using appropriate N and D, and to check the formation of the corresponding LC states in 2D-e structures using high-spatial-resolution optical [16] and electrometrical [53] measurements. Moreover, it may be possible to realize similar states using S-ems, thus creating magnetic-field-free TQCs.

5. Conclusions

We have used the magneto-PL spectra of InP/GaInP2 QDs having seven electrons and a Wigner–Seitz radius ~1.3 to demonstrate the self-formation of fractionally charged anion(magneto-electron) composites having ν~5/2 and Majorana modes/anyons. We observed the destruction of these composites and the appearance of anti-em composites induced by a magnetic field. Using a theoretical description of magneto-PL spectra and an analysis of the electronic structure of these dots based on single-particle Fock–Darwin spectrum and many-particle configuration interaction calculations, we show the formation of fractionally charged anion states based on the mechanism in which non-interacting quantum confined electrons generate sub-electron persistent current loops (vortexes). This implies the liquid-crystal nature of the fractional quantum Hall effect states, in which Majorana anyons are spontaneously formed, and opens new perspectives for the realization of topological quantum computing.

Author Contributions

A.M.M., D.V.L., and A.S.V. conceived the magneto-PL NSOM experiment. S.A.B. performed the configuration interaction calculations. The manuscript was written by A.M.M. with critical input from all authors. All authors have read and agreed to the published version of the manuscript.

Funding

A.M.M. and A.S.V. acknowledge support from the Russian Science Foundation grant No 19-19-00246; a portion of work related to initial selection of quantum dots using cryo-NSOM measurement was supported the National Science Foundation grant #DMR-1904610.

Data Availability Statement

All data needed to evaluate the conclusions in the paper are present in the paper.

Conflicts of Interest

All authors declare that they have no competing interest.

Appendix A. Theory of Photo-Luminescence Specra of Quabtum Hall Pudlles

Appendix A.1. General Model

The PL spectrum of a QD having N electrons arises from the radiative recombination of the photo-excited hole (h) state in the valence band with N* = N + 1 es in the conduction band, which together form the photo-excited state (PS) of the QD. This PS is formed after absorption of the incoming photon by QD in initial state (IS) creating an e-h pair, as shown in Figure A1a. Accounting for the fact that IS can have fractionally charged ems, we assume that all the interactions leading to formation of such a state are included in the formation of the e-h pair and PS state and do not affect photo-excitation and radiative recombination processes. This implies that, for an IS having ems, the generated and recombined e-h states have fractional charge.
Figure A1. (a) Population of electrons (solid circles) and hole (solid ellipse) in the s, p and d PS levels in conduction (CB) and valence (VB) bands of InP/GaInP2 QD in PL experiment under low photon pumping (Nph~1). Parabolas with horizontal lines inside are CB and VB potential of QD with quantum confined e and h levels, thick vertical up(down)/snaked arrows are excitation(emission)/photons, inclined arrows show e-h relaxation, thin vertical arrows are electron energies involved in PL transitions (see Equation (A3)). (b,c) Population of electrons/hole (solid/empty circles) in CB of IS* | v f * k (b) and IS (c) states. (d) Probability densities of the three lowest electron (upper) and hole (lower) states of InP/GaInP2 QD (D~100 nm) calculated using 8 k ¯ · p ¯   band model. (e) HF electron density distributions of the six occupied states having total spin Sz = 3/2 of InP/GaInP2 QD having N = 9 and ħω0 = 7.5 meV (D~100 nm). Arrows show spin direction.
Nanomaterials 12 01016 g0a1
The energy of the photon of the exciting laser is ħωph~E0 + Egr_QD + ΔEexc, where E0 is a band gap energy of the material, Egr_QD is the ground state energy of N*e-h QD, and Eexc is the excess excitation energy (~500 meV). After photon absorption, the photo-excited e-h pair relaxes (loosing Eexc by phonon emission) to the ground PS state, which is the initial state of the PL process (ISPL). The many-particle Hamiltonian of the PS-ISPL state can be written, using composite indexes i for a single particle state | i and accounting for the Coulomb interaction [54], as
H P S = i ε i e c i c i + n ε   n h h n h n + 1 2 i j k l i j | V e e | k l c i c j c l c k + i n m j i n | V e h | j m c i h n h m c j .
The operators c i and c i ( h n and h m ) create and annihilate an electron (a hole) in a single particle (SP) state | i ( | n ), where there are N* electrons. The first two terms in Equation (A1) are the kinetic energy of the electrons and the hole, quantized by ħω0 and ħωh, respectively, where ω0 and ωh are the harmonic frequencies of e and h in the parabolic confinement potential. The third and the fourth terms are scattering terms described by corresponding two-body matrix elements of e-e [55,56] and e-h [56,57] Coulomb interactions, respectively.
For the final PL state (FSPL), which is the IS of the QD (see Figure A1c), the Hamiltonian H I S does not have the fourth term of Equation (A1) and there are N electrons and no hole. The PL spectrum, i.e., the dependence of the emission intensity on the photon frequency IPL(ω), is determined by Fermi’s Golden Rule:
I P L ( ω ) = 2 π Σ f [ v f | 𝒫 | v i ] 2 δ ( ε i ε f ħ ω ) ,
where   | v i and | v f are the initial and final states of the QD having corresponding energies i and f . The inter-band polarization operator 𝒫 = k n k | n c k h n removes an e-h pair from the PS state | v i . The matrix element (overlap integral) k | n determines the selection rules. Since there is only a single valence band hole, we can define a purely electronic PS state | v i k = n k | n h n | v i [54]. The operator 𝒫 create a hole in PS 𝒫 | v i = k c k | v i k and leaves the QD in the excited state IS*-FSPL* (see Figure A1b), having energy ϵ ˇ k N . This state can be degenerate with a few other IS* configurations, which can be mixed by Coulomb exchange leading to a splitting of the PL transition [54]. Such a contribution is important in relatively small excitonic QDs [58], which are not considered here.
The contribution of the IS* state to the PL spectrum is described by a difference | Δ k =   | v f * k | v f k and it is important in dots having a molecular electron arrangement, i.e., rs > 2 [16].
Accounting for a low temperature (ħω0, ħωh < kT) and low pumping rate (Nph~1), generating only one e-h pair in the dot in ISPL (see Figure A1a), the PL spectrum, can be written as:
I P L ( ω ) = 1 | 1 2 γ 1 ( E 1 , 1 ħ ω ) + i 1 i | 1 2 γ i ( E 1 , 1 + ϵ i N * ħ ω ) k Δ k | Δ k 2 γ k ( E 1 , 1 ϵ ˇ k N ħ ω ) ,
where E 1 , 1 = E 0 + ε 1 N * ε 1 N + ħ ω h , ε i N * ( ε i N ) is the many-particle orbital energy of i-electron in PS(IS), ϵ i N * = ε i N * ε 1 N * is difference in the kinetic (confinement) energy between the higher and the lowest states, ϵ ˇ k N is the energy of the | v f * k state and γ i ( ω ) is a Lorentzian spectral function of the corresponding transition, describing the final width of the spectral lines and replacing of the delta function used in Equation (A2).
The PL spectrum thus has three contributions: a “zero” energy s-line (first term) accompanied by the anti-Stokes (ASCs) and Stokes (SCs) components (second and third terms, respectively). The SCs arise from the “molecular” contribution to the electron distribution, i.e., center-of-mass and relative electron vibrational modes and, in general, include combinations of translational, breathing, and rotational modes, having frequencies ϵ ˇ k N ħ ~ ω0, ~1.8ω0, and ~0.2ω0, respectively [33].

Appendix A.2. Single-Particle States of Confined Electrons

To describe the SP states (SPSs), we have used the FD spectrum Ekl(B) = Ek,lFD(Ω), where Ω2 = ω02+ωc2/4, ωc = e*B/m* is a cyclotron frequency, k = 0, 1, …, is a principal quantum number, l = k-|m| is a radial quantum number and m = −k, −k + 2, …, k − 2 is an azimuthal quantum number [59]. Circular symmetric FD states (FDSs) 00-, 01, 10-, 02-, 11-, 20-, and so on correspond to 2D atomic-like states 1s-, 1px-, 1py-, 1dx-, 1dy-, 2s-, and so on.
We also analyzed SPSs accounting for the atomic crystal structure of InP/GaInP2 dots using the 8-band k ¯ · p ¯ method [35]. In Figure A1d we show the probability density distributions of the 1s, 1px, and 1py states calculated for a circular dot having size 100 nm. The calculations give ħω0 = 4 meV and ħωh = 2 meV. This shows that the spatial extent of e and h states in these QDs is nearly the same (despite a two-times difference in the confinement energy) and that their wave-functions show FD type s- and p-shell spatial structure. For the h, however, the spatial extent is two times larger than that of FD states, which is a result of an inter-valence-band mixing induced by a piezo-electric field. The piezo-electric field also leads to a ~10 nm separation of the e and h along the x-direction, which is [−110]. This makes transitions involving x-type electron shells allowed.

Appendix A.3. Effect of Coulomb Interaction on Confined Electrons States

The e-h Coulomb interaction between the N* es and single h (the fourth term in Equation (A1)) mixes single-band h states (intra-band mixing) allowing PL transitions for all es in QD [34] as shown in Figure A1a. Accounting for the mixing, we can approximate the distribution of the density of the h in the lowest state by a nearly uniform positive charge distribution having weak modulations induced by spatial variations of the occupied electron shells and extending over the whole QD size. Thus, we can neglect the effect of the e-h interaction on ε i N * and include only e-e interaction in analysis of PS.
In Figure A1e, we present the electron density distributions (EDDs) of the occupied PS shells of a QD having N = 9, ħω0 = 7.5 meV (D~75 nm), total spin Sz = 3/2 and a non-circular dot shape (analog of D07m) calculated by the Hartree–Fock (HF) method. The densities have minor shape deviations from those of the single-particle ones in Figure A1d, except (1d-2s)x shell hybridization together with slight asymmetry of the states having different spin (see s-state) and spatially split parts for non-zero angular momentum states (see spin down px-state), which appear from the non-circular shape. The e-e interaction, however, gives a renormalization of the shell splitting, resulting in ε i N * / ε i e ~0.7. This shows that the electron states in InP/GaInP2 QDs can be approximated by FDSs having screened ħω0* = ε i N * ≈ΔEsp≈ΔEsd/2, where ΔEsp and ΔEsd is s-p and s-d splitting.

Appendix A.4. Magnetic Field Dispersion of Photoluminescence Spectra

The shift of s-line in magnetic field is
E s ( B ) = E 1 , 1 ( B ) E 0 = ε 1 N * ( B ) ε 1 N ( B ) + ħ ω h ( B ) ,  
where for the parabolic potential, for which the energy of center-of-mass motion ħω0 does not depend on N [59], the Coulomb energy term is
ε 1 N * ( B ) ε 1 N ( B ) =   Δ E s C ( B ) = N V 1 i , e e N * ( B ) N 1 V 1 i , e e N ( B ) ,  
and depends on the difference between the e-e interaction energy of the s electron in the PS and IS. The matrix elements in Equation (A4b) can be written as V 1 i , e e N * = V e e ( B ) π 2 e * 2 ε 1 l B , where l B 2 = ħ c / ( e B 1 + 4 ω 0 2 ω c 2 ) [55]. At zero field, Δ E s C ( 0 ) rs · k · ħω0, where k is the level number (1 for 1s-, 2 for 1p-, 3 for 1d- and 2s-states and so on) of the photo-excited e. For a pure electron state (no ems), Δ E s C N * · V e e ( B ) and
E s ( B ) N * · V e e ( B ) + ħ ω h ( B )
The formation of eν ems corresponds to a reduction of the charge from e0 to e0/ν and results in a decrease of V e e ( B ) . Since N * · V e e ( B ) < ħ ω h ( B ) , the effect on Es(B) is expected to be weak.
For the ASCs the B-shift is
ϵ i = k , l N * ( B ) = E k l ( B ) + E s ( B )
and the experimental value ϵ i = k , l N * ( B ) E s ( B ) directly measures the corresponding FDSs dispersion. The same is valid for SCs. In Equation (A5) the B-dispersion of E k l ( B )   term directly depends on ωc and the values of ν can be measured using the fit of the corresponding FDSs in the form Ekl(B) = Ekl(Be + Bν), where Bν accounts for internal field generated by Vs to experimental data, as was shown by us for dots having rs > 2 and ν < 1 in Refs. [15,16].

Appendix B. Ground States of Quantum Hall Puddles

Appendix B.1. Total Angular Momentum Plateaus of Confined Electrons in Magnetic Field

In Figure A2a,b we show the total energy EStot and total angular momentum LSz, respectively, versus B calculated using CI for N = 8 and ħω0 = 5.8 meV, corresponding to the PS of the QD D09m. We used reduced units νLS−1 = LS/L0 = −LzSz/L0, where L0 = N(N − 1)/2 [16,60] and νB−1 = B/B0, where B0 is a field corresponding to ν = 1, and B(νB−1) ranges up to ~B0(1). The νLS−1(νB−1) curves are presented for all total spin Sz = S states from 0 to 4 and for S > 1 the curves are truncated for ν−1 > 0.25. The inset in Figure A2a shows EStot for N = 7 and S from ½ to 5/2 related to the IS of the QD D09m. The upper inserts in Figure A2b show the calculated zero field CDDs for N = 8 and 7, and the lower ones show the HF EDD of the 10-px state with a few V circles adjacent to each other, which represent a tentative description of the em structure. EStot and Lz for N = 6 (the IS of D01m) were calculated in Ref. [16].
The CDDs give D ≈ 85 nm and rs ≈ 1.5 (see Table 1). They have two minima having size ~15 nm and separated by ~30 nm along the x-axis, which can be assigned to (7,1) and (6,1) isomers in a molecular arrangement in the limit of rs >> 1 [61], for N = 8 and 7, respectively. For N = 7, the CDD show enhanced density (clustering of electrons) along the y direction.
The EStot(νB−1) energies in Figure A2a and in the insert are nearly constant up to νB−1~0.6 and then increase linearly with B increase. The former corresponds to weak fields (ωc < ω0), for which the kinetic and Coulomb energy, related to quantum confinement, Econf = 16ħω0*, and center-of-mass motion, Ec.m ≈ rsEconf, are dominant. The latter corresponds to strong fields (ωc > ω0,) when the cyclotron energy of electrons, Ecycl = 4ħωc, becomes dominant [16].
As can be seen from the comparison of EStot(νB−1) curves, the boundary between weak and strong fields is S dependent and increases from νB−1~0.5 for S = 0 to νB−1~1 for S = 4.
The analysis of the curves also give B0 = 7.2 T, which is a field at a crossing point between the E3tot(νB−1) and E4tot(νB−1) curves. This value is equal to B0 = A · (h/e)(4N/πD2), where a geometrical factor A = 1.25.
The EStot(νB−1) curves also have weak modulations, having amplitude ≤0.5 meV and period ΔνB−1~0.2, which are considered to arise from the energy of relative electron motion Erel [16,60]. A set of minima of the modulations at ν = 8 and 7/3 for S = 0 and at ν = 7/2 and 2 for S = 1 for νB−1 < 0.6 correspond to a set of GSs |νnS > N1/νB, where n numbers GSs in the set, which is |80, 7/21, 7/30, 21 > 80.6. For N = 7, the set is |9/21/2, 5/21/2 > 70.6, for N = 6 it is |31/2, 5/31/2 > 60.6, and the GS sets are different for different N. Note that the difference between EStot(0) values, ΔEtot = 36 meV for N = 8 and 7, which corresponds to Δ E s C ( 0 ) = ΔEtot – 3ħω0 = 18 meV rs · k · ħω0 (see below Appendix C.1).
In Figure A2b, the νLS−1(νB)−1 curves reveal LS plateaus. The plateaus follow energy modulations and stay between the modulation maxima, having, thus, the same period (width). Their crossing with νLS−1 = νB−1 line give the values of νnS as shown in Figure A2b for both N = 8 and 7. The plateaus recall the same of the transversal conductance of IQHE and FQHE [62], which gives evidence on the critical role of localization, i.e., quantum confinement, in the formation of IQHE and FQHE states.

Appendix B.2. Single-Particle Fock-Darwin Ground States and Vortexes

In Figure A2c we present the FD spectrum Ek,l(νB−1)/ħω0 (ħω0 = ħω0* = 3.5 meV), which is related to D09m, plotted up to 3ħω0 and νB−1 = 1.15, which includes levels up to 13 and 07. Using this spectrum, we calculated the total angular momentum LFDS and energies of the corresponding states ELS versus νB−1 for N = 8 and S = 1, which are shown in Figure A2d,e, respectively. For the calculation of the ELS energy, we use the expression ELS = 16 · ħω0 · rs+ ∑NEklL(S), where the first term is the Coulomb energy and EklL(S) are FDSs constituents of the L(S) state. In Figure A2d, we also show LFD,V1 = LV + LFD1 (see Appendix C.1), which is also shown in Figure A2b.
Figure A2. Total energy EStot (a) and reduced total angular momentum νLS−1 = LS/L0 (b) for different S (solid curves marked by numbers) versus reduced field νB−1 for ħω0 = 5.8 meV and N = 8 calculated by CI method. Insert in (a) presents EStot for N = 7. Vertical arrows in (a) mark GSs (see composition numbers on νB−1 axes). The dashed line in (b) is the νL−1 = νB−1 dependence, circles(squires) mark GSs for N = 8(7), dashed curve is the LFD,V1 function (see also (d). The inserts show calculated total CCD (upper) for at N = 8 (left) and N = 7 (right) at B = 0 T and HF EDD of 1px single particle state (lower) with Vs (circles with arrow, showing circulation direction), corresponding to e1/2l em (left) and its MM (right). The CCD and EDD size is 100 × 100 nm2. FD spectrum (dark and light color curves are occupied and unoccupied levels, respectively) Ek,lFD(νB1)/ħω0* calculated for ħω0* = 3.5 meV (c) together with total angular momentum (thick curve) LFD1(νB1) (d) and energies (thin dot curves) EL1(νB1) of N = 8 and S = 1 (see thick lines outlining topmost levels in (c)) (e). Thick solid lines in (e) outline minima of EL1(νB1) and vertical arrows mark corresponding GSs. Thin line in (d) is LFD,V1 function.
Nanomaterials 12 01016 g0a2
The topmost S = 1 FDSs in Figure A2d show three crossings at νB−1~0.35, 0.57 and 0.74. The last crossing corresponds to the transition between the weak and strong field of Figure A2a, in which all electrons occupy the lowest Landau level. As can be found from an analysis of the FD spectrum in Figure A2c, this crossing shifts to larger fields with step ΔνB−1~0.1 when S increases, which is in good agreement with the EStot crossings and, thus, allows one to explain this shift using a single-particle description.
Between the crossings, a set {lz}N is conserved resulting in the LFDS plateaus (see Figure A2d). Within a specific LFDS-plateau, the energy of the corresponding state ELS is the lowest and has a minimum, which gives modulations of the total energy and a set of GSs (see Figure A2e), like that in Figure A2a. Thus, the plateaus and discrete GSs of electrons in magnetic field arise in QDs due to quantum confinement and they appear without accounting for the e-e interaction. The LFDS plateaus, however, have one-and-a-half-times larger period and two times smaller amplitudes than LS ones, which implies a contribution of additional non-zero lz states, missing in the FD spectrum. It is naturally assumed that these states are the Vs, which add lz = 1 each. Since at ν = 1 the number of Vs NV = N*, the contribution of Vs to LS can be approximated by a stepped function LV, in which lz = 1 step is added at νB−1~k/N*, where k is integer. A LFD,V1 function, accounting for their contribution (LFD,VS = LFDS + LV), has increased period amplitude (see Figure A2d) and approximately matches LS (see Figure A2b). Thus, accounting for Vs and single-particle states seems to be adequate for the description of the ems states.

Appendix C. Fractionally Charged Ground States

Appendix C.1. Magneto-Electron Composites and Majorana Modes

The fractional νnS implies the formation of ems. Based on our previous studies [15,16], we suggest that for the px state and ν = 1/2 the em structure consists of two vortexes (Vs) generated at the center of the left half of the EDD at x~−50 nm, which corresponds to a clockwise phase change of the electron wave-function (see right lower insert in Figure A2b). We denote this em as e11/2, where we add a subscript l = lz in the em notation, which further will be elν. For a paired e-state em is e2νl.
The adjacent right insert shows corresponding MM, i.e., e11/4 em, in which single V and anti-V (aV) are added. The aV is generated in the right half of px-state at x~+50 nm, which has anticlockwise phase change of electron wave-function. The e11/4 em can also have a configuration consisting of two Vs and two aVs, which exist at zero B and, thus, can be considered to be a Majorana magneto-electron/anyon (emM). To distinguish it from a MM, we add the number Vs of the “host” em to the MM-type ems notation. Using such a notation, one can see that e11/4(0) is emM and e11/4(2) is a MM. Note that there exists e11/2(0) emM, which implies that e11/4(0) em is the MM of e11/2(0) emM.
For the py-state, the Vs/aVs generated are located along y at distances ±50 nm and the Vs of e11/2 and e-11/2 ems do not overlap. The same can be generally valid for other lz states and, thus, different lz states can form ems simultaneously and independently creating a multi-em state, i.e., an em-composite (em-C).
The classification of the em-Cs can be done by listing the values of νl, which are the νs of elν ems, mapping of Vs positions as shown in the insert in Figure A2b and specification of the total composition value νnS, which we set up as
νnS = (νNie + Nem/NV)S,
where νNie is an integer value related to Ni electrons, Nem = N − Ni is the number of ems and NV = ∑(νl)−1 is the total number of em’s Vs. For MM em-Cs having a number of aVs NaV ≤ NV, there is an additional, effective composition value νiS+, which is
νnS+ = (νNie + Nem/NV+)S,
where NV+ = NV 2NaV is the number of uncompensating Vs determining Bν. The reduced charge of the em-C is
eN* = eN/e0 = (Ni +∑nlνl)/e0,
where nl is the SPS occupation equal to 1 or 2.
A change of νnS of the PS and IS em-Cs at the boundaries of the LS plateaus can give Δν steps in the dispersion of the s-peak, which can be written as:
Δ ν   b · Δ E s C ( 0 ) · [ ( Δ e N e N ) 2 ( Δ e N e N ) 1 ] ,  
where b is a coupling coefficient, assumed to be unity, and ( Δ e N e N ) 1 , 2 = ( Δ N i + n l p ν l p + Δ n l Δ ν l ) 1 , 2 and the superscript p denotes a photo-excited e, is a relative charge between PS and IS of adjacent em-C1 and em-C2 composites. The steps are positive(negative) when NV in IS(PS) of em-C2 is larger than the same in em-C1 and vice versa. In our dots (N = 7, k = 3 and ħω0~6 meV), Δ E s C ( 0 )   ~20 meV (as discussed above in Appendix B.1) and for single e1/2 em, i.e., two Vs NV difference, the expected step amplitude is Δν~1 meV. Equation (A4c) can thus be written as
E s e m - C ( B ) N · V e e ( B ) + ħ ω h ( B ) + Δ ν .

Appendix C.2. Fock-Darwin Spectrum Fit

The ems composition of the single particle e-states were obtained using a fitting procedure. In the procedure we first extracted the experimental p- and d-FD states values from the data in Figure 3a–c using the subtraction of the s-shift from the p- and d–shifts, respectively. Second, we fitted calculated FD energies to the experimental data by adjusting the cyclotron frequency ωc, which give νl values. Third, we plotted the experimental and calculated FD shifts and denoted them by eνl (see Figure 4a–c), together with s-shift and the calculated Δν and Esem-C values. The results are plotted using reduced units, as in Figure A2c. This allows a unified description of the e-em-FD spectrum of different dots. The fitted curves include an adjustment of the zero field p- and d peak positions for dots D07m and D09m.
The fit accounts for a decrease of the B-dispersion due to a 1/ν–times decrease of ωc, which in the limit 1/ν→0 comes out to be dispersionless, i.e., a zero shift, eliminating the level crossing. Thus, for the states having negative lz (see the FD spectrum in Figure A2c), the ems lead to an increase, while for zero and positive lz to a decrease of the energy, towards a zero field value. For negative lz this can be traced for e1/2-2 and e1/4-2 B-ems of D01m in Figure 4a.

Appendix C.3. Construction of the em-C Structure

The em-C structure is represented by the Vs overlaid on the CDD of the dot. To plot it, we used the νl values obtained and put (νl)−1 arrowed circles of individual Vs in the region occupied by corresponding HF EDD (see inserts in Figure A2b) adjusting their positions to avoid overlap with Vs of other FDSs. The condition prohibiting V overlap restricts total number of Vs and was used to check the values of νnS obtained from the fit. The arrows of the circles contour line show the V direction which is clockwise for Vs and anticlockwise for and Vs/aVs and are color coded as is shown in the inserts in Figure 4a–c.

Appendix D. Majorana Qubit

In Figure A3, we present the observation of the mixed 3(∞) and 9/7(∞) emM-C states in the magneto-PL spectra of dot D07m, which correspond to the spectra measured at time delays <4 min, before equilibrium 3(∞) state will be stabilized. The mixed states have a position of the s-peak between 0 (3) and 1 (19/7) qubit states as is seen in Figure A3 for a 2 min delay.
Figure A3. Spectra of D07m QD measured at Be↓ = 5T at time delay 0, 2 and 4 minutes (solid curves) together with the spectra measured at Be↑ = 5T (dotted curve).
Nanomaterials 12 01016 g0a3

References

  1. Onnes, H.K. Investigations into the Properties of Substances at Low Temperatures, Which Have Led, Amongst Other Things, to the Preparation of Liquid Helium. Nobel Lect. 1913, 11, 306–336. [Google Scholar]
  2. File, J.; Mills, R.G. Observation of persistent current in a superconducting solenoid. Phys. Rev. Lett. 1963, 10, 93–96. [Google Scholar] [CrossRef]
  3. Meissner, W.; Oschenfeld, R. Ein neuer effekt bei entritt der upraleitfähigkeit. Naturwissenschaften 1933, 21, 787–788. [Google Scholar] [CrossRef]
  4. London, F. Superfluids; John Willey & Sons: New York, NY, USA, 1950; p. 152. [Google Scholar]
  5. Deaver, B.S.; Fairbank, W.R. Experimental evidence for quantized flux in superconducting cylinders. Phys. Rev. Lett. 1961, 7, 43–46. [Google Scholar] [CrossRef]
  6. Doll, R.; Näbauer, M. Experimental Proof of Magnetic Flux Quantization in a Superconducting Ring. Phys. Rev. Lett. 1961, 7, 51–52. [Google Scholar] [CrossRef]
  7. Abrikosov, A.A. Type II superconductors and the vortex lattice. Nobel Lect. 2003, 8, 59–67. [Google Scholar]
  8. Essmann, U.; Träuble, H. The direct observation of individual flux lines in type-II superconductors. Phys. Lett. A 1967, 24, 526–527. [Google Scholar] [CrossRef]
  9. Cooper, L.N. Microscopic quantum interference effects in the theory of superconductivity. Nobel Lect. 1972, 11, 73–93. [Google Scholar]
  10. Klitzing, A.K.; Dorda, G.; Pepper, M. New Method for High-Accuracy Determination of the Fine-Structure Constant Based on Quantized Hall Resistance. Phys. Rev. Lett. 1980, 45, 494–497. [Google Scholar] [CrossRef] [Green Version]
  11. Tsui, D.C.; Stormer, H.L.; Gossard, A.C. Two-Dimensional Magnetotransport in the Extreme Quantum Limit. Phys. Rev. Lett. 1982, 48, 1559–1562. [Google Scholar] [CrossRef] [Green Version]
  12. Halperin, B.I. Quantized Hall conductance, current carrying edge states and the existence of extended states in a two-dimensional disorder potential. Phys. Rev. B 1982, 25, 2185–2190. [Google Scholar] [CrossRef]
  13. Jain, J.K. Composite-fermion approach for the fractional quantum Hall effect. Phys. Rev. Lett. 1989, 63, 199–202. [Google Scholar] [CrossRef] [PubMed]
  14. Laughlin, R.B. Anomalous Quantum Hall Effect: An Incompressible Quantum Fluid with Fractionally Charged Excitations. Phys. Rev. Lett. 1983, 50, 1395–1398. [Google Scholar] [CrossRef] [Green Version]
  15. Mintairov, A.M.; Lebedev, D.; Vlasov, A.; Bogdanov, A.; Ramezanpour, S.; Blundell, S. Fractional charge states in the mag-neto-photoluminescence spectra of a single-electron quantum dot. Nanomaterials 2021, 11, 493. [Google Scholar] [CrossRef] [PubMed]
  16. Mintairov, A.M.; Lebedev, D.V.; Vlasov, A.S.; Orlov, A.O.; Snider, G.L.; Blundell, S.A. Nano-photoluminescence of natural anyon molecules and topological quantum computation. Sci. Rep. 2021, 11, 21440. [Google Scholar] [CrossRef] [PubMed]
  17. de Gennes, P.G. Superconductivity of Metals and Alloys; Benjamin: New York, NY, USA, 1966; p. 294. [Google Scholar]
  18. Chibotaru, C.F.; Ceulemans, A.; Bruyndoncx, V.; Moshchalkov, V.V. Symmetry induced formation of antvortexes in mesoscopic superconductors. Nature 2000, 408, 833–835. [Google Scholar] [CrossRef] [Green Version]
  19. Slachmuylders, A.F.; Partoens, B.; Peeters, F.M. Geometry and magnetic-field-induced vortices and antivortices in mesoscopic two-dimensional systems. Phys. Rev. B 2005, 71, 245405-10. [Google Scholar] [CrossRef]
  20. Kitaev, A. Fault-tolerant quantum computation by anyons. Ann. Phys. 2003, 303, 2–30. [Google Scholar] [CrossRef] [Green Version]
  21. Millikan, R.A. The Electron and the Light-Quant from the Experimental Point of View. Nobel Lect. 1924, May 23, 54–66. [Google Scholar]
  22. Holton, G. Subelectrons, Presuppositions, and the Millikan-Ehrenhaft Dispute. Hist. Stud. Phys. Sci. 1978, 9, 161–224. [Google Scholar] [CrossRef] [Green Version]
  23. LaRue, G.S.; Fairbank, W.M.; Hebard, A.F. Evidence on the existence of fractional charge of matter. Phys. Rev. Lett. 1977, 38, 1011–1014. [Google Scholar] [CrossRef]
  24. Choi, H.C.; Kang, W.; Das Sarma, S.; Pfeiffer, L.N.; West, K.W. Activation gaps of fractional quantum Hall effect in the second Landau level. Phys. Rev. B 2008, 77, 081301. [Google Scholar] [CrossRef] [Green Version]
  25. Willett, R.L.; Nayak, C.; Shtenge, K.; Pfeiffer, L.N.; West, K.W. Magnetic-Field-Tuned Aharonov-Bohm Oscillations and Evi-dence for Non-Abelian Anyons at v = 5/2. Phys. Rev. Lett. 2013, 111, 186401-5. [Google Scholar] [CrossRef] [PubMed] [Green Version]
  26. Volovik, G.E. Fermion zero modes on vortices in chiral superconductors. JETP Lett. 1999, 70, 609–614. [Google Scholar] [CrossRef] [Green Version]
  27. Volovik, G.E. Monopoles and fractional vortexes in chiral superconductors. Proc. Natl. Acad. Sci. USA 2000, 97, 2431–2435. [Google Scholar] [CrossRef] [PubMed] [Green Version]
  28. Read, N.; Green, D. Paired states of fermions in two dimensions with breaking of parity and time-reversal symmetries and the fractional quantum Hall effect. Phys. Rev. B 2001, 61, 10267–10297. [Google Scholar] [CrossRef] [Green Version]
  29. Ivanov, D.A. Non-Abelian Statistics of Half-Quantum Vortices in p-Wave Superconductors. Phys. Rev. Lett. 2001, 86, 268–271. [Google Scholar] [CrossRef] [PubMed] [Green Version]
  30. Sarma, S.D.; Freedman, M.; Nayak, C. Majorana zero modes and topological quantum computation. NPJ Quantum Inf. 2015, 1, 15001. [Google Scholar] [CrossRef] [Green Version]
  31. Sarma, S.D.; Freedman, M.; Nayak, C. Topologically Protected Qubits from a Possible Non-Abelian Fractional Quantum Hall State. Phys. Rev. Lett. 2005, 94, 166802. [Google Scholar] [CrossRef] [Green Version]
  32. Willett, R.L.; Pfeiffer, L.N.; West, K.W. Alternation and interchange of e/4 and e/2 period interference oscillations consistent with filling factor 5/2 non-Abelian quasiparticles. Phys. Rev. B 2010, 82, 205301. [Google Scholar] [CrossRef]
  33. Mintairov, A.M.; Merz, J.L.; Blundell, S. Molecular States of Electrons: Emission of Single Molecules in Self-Organized InP/GaInP Quantum Dots, Fingerprints in the Optical and Transport Properties of Quantum Dots; InTech: London, UK, 2012; pp. 125–152. [Google Scholar]
  34. Mintairov, A.M.; Kapaldo, J.; Merz, J.L.; Rouvimov, S.; Lebedev, D.V.; Kalyuzhnyy, N.A.; Mintairov, S.A.; Belyaev, K.G.; Rakhlin, M.V.; Toropov, A.A.; et al. Control of Wigner localization and electron cavity effects in near-field emission spectra of In(Ga)P/GaInP quantum-dot structures. Phys. Rev B 2018, 97, 195443. [Google Scholar] [CrossRef]
  35. Mintairov, A.M.; Ankundinov, A.V.; Kalyuzhnyy, N.A.; Lebedev, D.V.; Mintairov, S.A.; Pavlov, N.V.; Galimov, A.I.; Rakhlin, M.V.; Salii, R.A.; Toropov, A.A.; et al. Piezo-electric fields and state-filling photo-luminescence in natural InP/GaInP2 Wigner molecule structures. Appl. Phys. Lett. 2021, 118, 121101. [Google Scholar] [CrossRef]
  36. Saarikoski, H.; Harju, A.; Puska, M.J.; Niemin, R.M. Vortex Clusters in Quantum Dots. Phys. Rev. Lett. 2004, 93, 116802. [Google Scholar] [CrossRef] [PubMed] [Green Version]
  37. Tavernier, M.B.; Anisimovas, E.; Peeters, F.M. Ground state and vortex structure of the N = 5 and N = 6 electron quantum dot. Phys. Rev. B 2006, 74, 125305. [Google Scholar] [CrossRef]
  38. Mourik, V.; Zuo, K.; Frolov, S.M.; Plissard, S.R.; Bakkers, E.P.A.M.; Kouwenhoven, L.P. Signatures of Majorana Fermions in Hybrid Superconductor-Semiconductor Nanowire Devices. Science 2012, 336, 1003–1007. [Google Scholar] [CrossRef] [PubMed] [Green Version]
  39. Nadj-Perge, S.; Drozdov, I.K.; Li, J.; Chen, H.; Jeon, S.; Seo, J.; MacDonald, A.H.; Bernevig, B.A.; Yazdani, A. Observation of Majorana fermions in ferromagnetic atomic chains on a superconductor. Science 2014, 346, 602–607. [Google Scholar] [CrossRef] [PubMed] [Green Version]
  40. Xu, J.-P.; Wang, M.-X.; Liu, Z.L.; Ge, J.-F.; Yang, X.; Liu, C.; Xu, Z.A.; Guan, D.; Gao, C.L.; Qian, D.; et al. Experimental Detection of a Majorana Mode in the core of a Magnetic Vortex inside. Phys. Rev. Lett. 2015, 114, 017001. [Google Scholar] [CrossRef] [Green Version]
  41. Stolyarov, V.S.; Veshchunov, I.; Grebenchuk, S.; Baranov, D.; Golovchanskiy, I.; Shishkin, A.; Zhou, N.; Shi, Z.; Xu, X.; Pyon, S.; et al. Domain Meissner state and spontaneous vortex-antivortex generation in the ferromagnetic supercon-ductor EuFe2(As0.79P0.21)2. Sci. Adv. 2018, 4, eaat1061. [Google Scholar] [CrossRef] [Green Version]
  42. Golod, T.; Iovan, A.; Krasnov, V.M. Single Abrikosov vortices as quantized information bits. Nat. Comm. 2015, 6, 8628. [Google Scholar] [CrossRef] [Green Version]
  43. Mintairov, A.M.; He, Y.; Merz, J.L.; Jin, Y.; Goldman, R.S.; Kudrawiec, R.; Misiewicz, J.; Akimov, I.A.; Yakovlev, D.R.; Bayer, M. Quasi-ordering of composition fluctuations and their interaction with lattice imperfections in an optical spectra of dilute ni-tride alloys. Semicond. Sci. Technol. 2016, 31, 095012. [Google Scholar] [CrossRef]
  44. Zhitenev, N.B.; Fulton, T.A.; Yacoby, A.; Hess, H.F.; Pfeiffer, L.N.; West, K.W. Imaging of localized electronic states in the quantum Hall regime. Nature 2000, 404, 473–476. [Google Scholar] [CrossRef]
  45. Poux, A.; Wasilewski, Z.R.; Friedland, K.J.; Hey, R.; Ploog, K.H.; Airey, R.; Plochocka, P.; Maude, D.K. Microscopic model for the magnetic-field-driven breakdown of the dissipationless state in the integer and fractional quantum Hall effect. Phys. Rev. B 2016, 94, 075411. [Google Scholar] [CrossRef] [Green Version]
  46. Gul, Y.S.; Holmes, N.; Myronov, M.; Kumar, S.; Pepper, M. Self-organized fractional quantization in a hole quantum wire. J. Phys. Cond. Matter. 2018, 30, 09LT01. [Google Scholar] [CrossRef] [PubMed] [Green Version]
  47. Kumar, S.; Pepper, M.; Holmes, S.N.; Montagu, H.; Gul, Y.; Ritchie, D.A.; Farrer, I. Zero-Magnetic Field Fractional Quantum States. Phys. Rev. Lett. 2019, 122, 086803. [Google Scholar] [CrossRef] [PubMed] [Green Version]
  48. Ihnatsenka, S.; Zozoulenko, I.V. Origin of the “0.25 anomaly” in the nonlinear conductance of a quantum point contact. Phys. Rev. B 2009, 79, 235313. [Google Scholar] [CrossRef] [Green Version]
  49. Czapkiewicz, M.; Kolkovsky, V.; Nowicki, P.; Wiater, M.; Wojciechowski, T.; Wojtowicz, T.; Wróbel, J. Evidence for charging effects in CdTe/CdMgTe quantum point contacts. Phys. Rev. B 2012, 86, 165415. [Google Scholar] [CrossRef] [Green Version]
  50. Ilani, S.; Martin, J.; Teitelbaum, E.; Smet, J.H.; Mahalu, D.; Umansky, V.; Yacoby, A. The microscopic nature of localization in the quantum Hall effect. Nature 2004, 427, 328–332. [Google Scholar] [CrossRef]
  51. Moore, G.; Read, N. Nonabelions in the fractional quantum Hall effect. Nucl. Phys. B 1991, 360, 362–396. [Google Scholar] [CrossRef]
  52. Greiter, M.; Wen, X.G.; Wilczek, F. Paired Hall State at Half Filling. Phys. Rev. Lett. 1991, 66, 3205–3208. [Google Scholar] [CrossRef]
  53. Martin, J.; Ilani, S.; Verdene, B.; Smet, J.; Umansky, V.; Mahalu, D.; Schuh, D.; Abstreiter, G.; Yacoby, A. Localization of Fractionally Charged Quasi-Particles. Science 2004, 305, 980–983. [Google Scholar] [CrossRef] [Green Version]
  54. Wojs, A.; Hawrylak, P. Theory of photoluminescence from modulation-doped self-assembled quantum dots. Phys. Rev. B 1997, 55, 13066. [Google Scholar] [CrossRef] [Green Version]
  55. Kyriakidis, J.; Pioro-Ladriere, M.; Ciorga, M.; Sachrajda, A.S.; Hawrylak, P. Voltage-tunable singlet-triplet transition in lateral quantum dots. Phys. Rev. B 2002, 66, 035320. [Google Scholar] [CrossRef] [Green Version]
  56. Warburton, R.J.; Miller, B.T.; Dürr, C.S.; Bödefeld, C.; Karrai, K.; Kotthaus, J.P.; Medeiros-Ribeiro, G.; Petroff, P.M.; Huant, S. Coulomb interactions in small charge-tunable quantum dots: A simple model. Phys. Rev. B 1998, 58, 16221. [Google Scholar] [CrossRef] [Green Version]
  57. Wojs, A.; Hawrylak, P. Negatively charged magnetoexcitons in quantum dots. Phys. Rev. B 1995, 51, 10880–10885. [Google Scholar] [CrossRef] [PubMed]
  58. Ediger, M.; Bester, G.; Badolato, A.; Petroff, P.M.; Karrai, K.; Zunger, A.; Warburton, R.J. Peculiar many-body effects revealed in the spectroscopy of highly charged quantum dots. Nat. Phys. 2007, 3, 774–779. [Google Scholar] [CrossRef]
  59. Jacak, L.; Hawrylak, P.; Wojs, A. Quantum Dots; Springer: Berlin/Heidelberg, Germany, 1998; p. 176. [Google Scholar]
  60. Yannouleas, C.; Landman, U. Unified microscopic approach to the interplay of pinned-Wigner-solid and liquid behavior of the lowest Landau-level states in the neighborhood of ν = 1/3. Phys. Rev. B 2011, 84, 165327. [Google Scholar] [CrossRef] [Green Version]
  61. Saint Jean, M.; Even, C.; Guthmann, C. Macroscopic 2D Wigner islands. Europhys. Lett. 2001, 55, 45–51. [Google Scholar] [CrossRef] [Green Version]
  62. Stormer, H.L.; Chang, A.; Tsui, D.C.; Hwang, J.C.M.; Gossard, A.C.; Weigmann, W. Fractional quantization of the Hall effect. Phys. Rev. Lett. 1983, 50, 1953–1956. [Google Scholar] [CrossRef]
Figure 1. (a) Comparison of low-temperature (10 K) PL spectra of D01m, D07m and D09m InP/GaInP2 QDs. Lines connect the peak maxima and stars denote neighboring dots. Center inserts show portions of contour plots of a set of spatially resolved near-field PL spectra of D07m measured along two perpendicular directions, in which regions corresponding to the size of emission area are outlined by the magenta color and the horizontal bars. The dashed ellipse in x-scan outlines contribution of neighboring dot. Right inserts show charge density distributions (size 100 × 100 nm) of the dots (upper D09m, lower D01m) calculated using the CI method. (b) Circular polarized spectra of D07m measured in the range Be = 0–10 T.
Nanomaterials 12 01016 g001
Figure 2. Low-temperature (10 K) magneto-PL spectra (thin solid curves) of D01m (a), D07m (b) and D09m (c) QDs measured in the field range Be = 0–10 T (thick solid curves are for B = 0 T, short-dot curves are for |Be| < |Bec|). Solid, dashed and short-dashed lines (thinner for |Be| < |Bec|) connecting the maxima of s-, p- and d-peaks, respectively, are drawn to outline their shift and bends; a star symbol denotes neighboring dot, which in (c) is the single electron dot S11 studied in Ref. [15]. Vertical arrows at the left show direction of field increase.
Nanomaterials 12 01016 g002
Figure 3. Peak shifts (circles −s, diamonds −p, hexagons −d, small circle −x) versus internal magnetic field B and calculated shifts (solid curves) overlaid on the PL spectra contour plot of D01m (a), D07m (b) and D09m (c) InP/GaInP2 QDs. Changes of B–field has four ranges: decrease from Bν to 0 T (B↓), increase from 0 to 10 T-|Bν| (B+↑), decrease from 10 T-|Bν| to 0 T (B+↓) and increase from 0 T to Bν (B↑). Dashed ovals mark s-shift jumps.
Nanomaterials 12 01016 g003
Figure 4. Experimental (empty circles/solid hexagons are for Be↑/Be↓ measurements) and fitted (thick solid/dashed curves are paired/single e-states, respectively) s-shifts and eνl-FDSs (lower plots) and eN* (upper plots) versus νB−1 for D01m (a), D07m (b) and D09m (c) InP/GaInP2 QDs. Insets are V-structures of the em-Cs represented by NV Vs arrangement (arrowed circles) overlaid on the dot CDD. Numbers on νB−1 axis, total charge curves and inside insert’s frames are ν, νnS+ and νnS values, respectively. Arrows (one/double sided), thick and thin dotted curves on s-shifts are psotion/hysteresis of the jumps, Δν and Esem-C functions, respectively (see text). Vs circles color code is for B-ems– dark red, yellow/violet and red are Vs in s-, p- and d-states and light blue/green and blue are aVs in p- and d-states; for S-ems the colors for Vs and aVs are interchanged. The insert at the lower right corner of (b) is the V-structure of n = 1 in initial state in Be↓-range in which dashed circles, marked by arrows, correspond 19/7 state (see text).
Nanomaterials 12 01016 g004
Table 1. Properties of anyon(magneto-electron) composites of InP/GaInP2 quantum Hall puddles.
QDN*ħω0*/ħω0
(meV)
D
(nm)
rsBec/Bν
(T)
ν0+(ν0)SeN*νn+(νn)SeN*
D01m75.5/9.2651.23/3.65/2(−21/8)3/23.7523/9(∞)1/24.9127/11(5/2)3/23.91-
D07m84.5/7.5751.32.5/3.221/8(−8/3)03.058/3(∞)15.665/2(5/2)15.4110/7(7/4)24.25
D09m83.5/5.8851.52/39/4(−5/2)02.0832/13(∞)14.9123/10(3)23.889/7(4/3)23.71
Publisher’s Note: MDPI stays neutral with regard to jurisdictional claims in published maps and institutional affiliations.

