
Photoluminescence Investigations of Dy3+-Doped Silicate Xerogels and SiO2-LaF3 Nano-Glass-Ceramic Materials
 , ,
, ,
Abstract
:1. Introduction
2. Materials and Methods
3. Results and Discussion
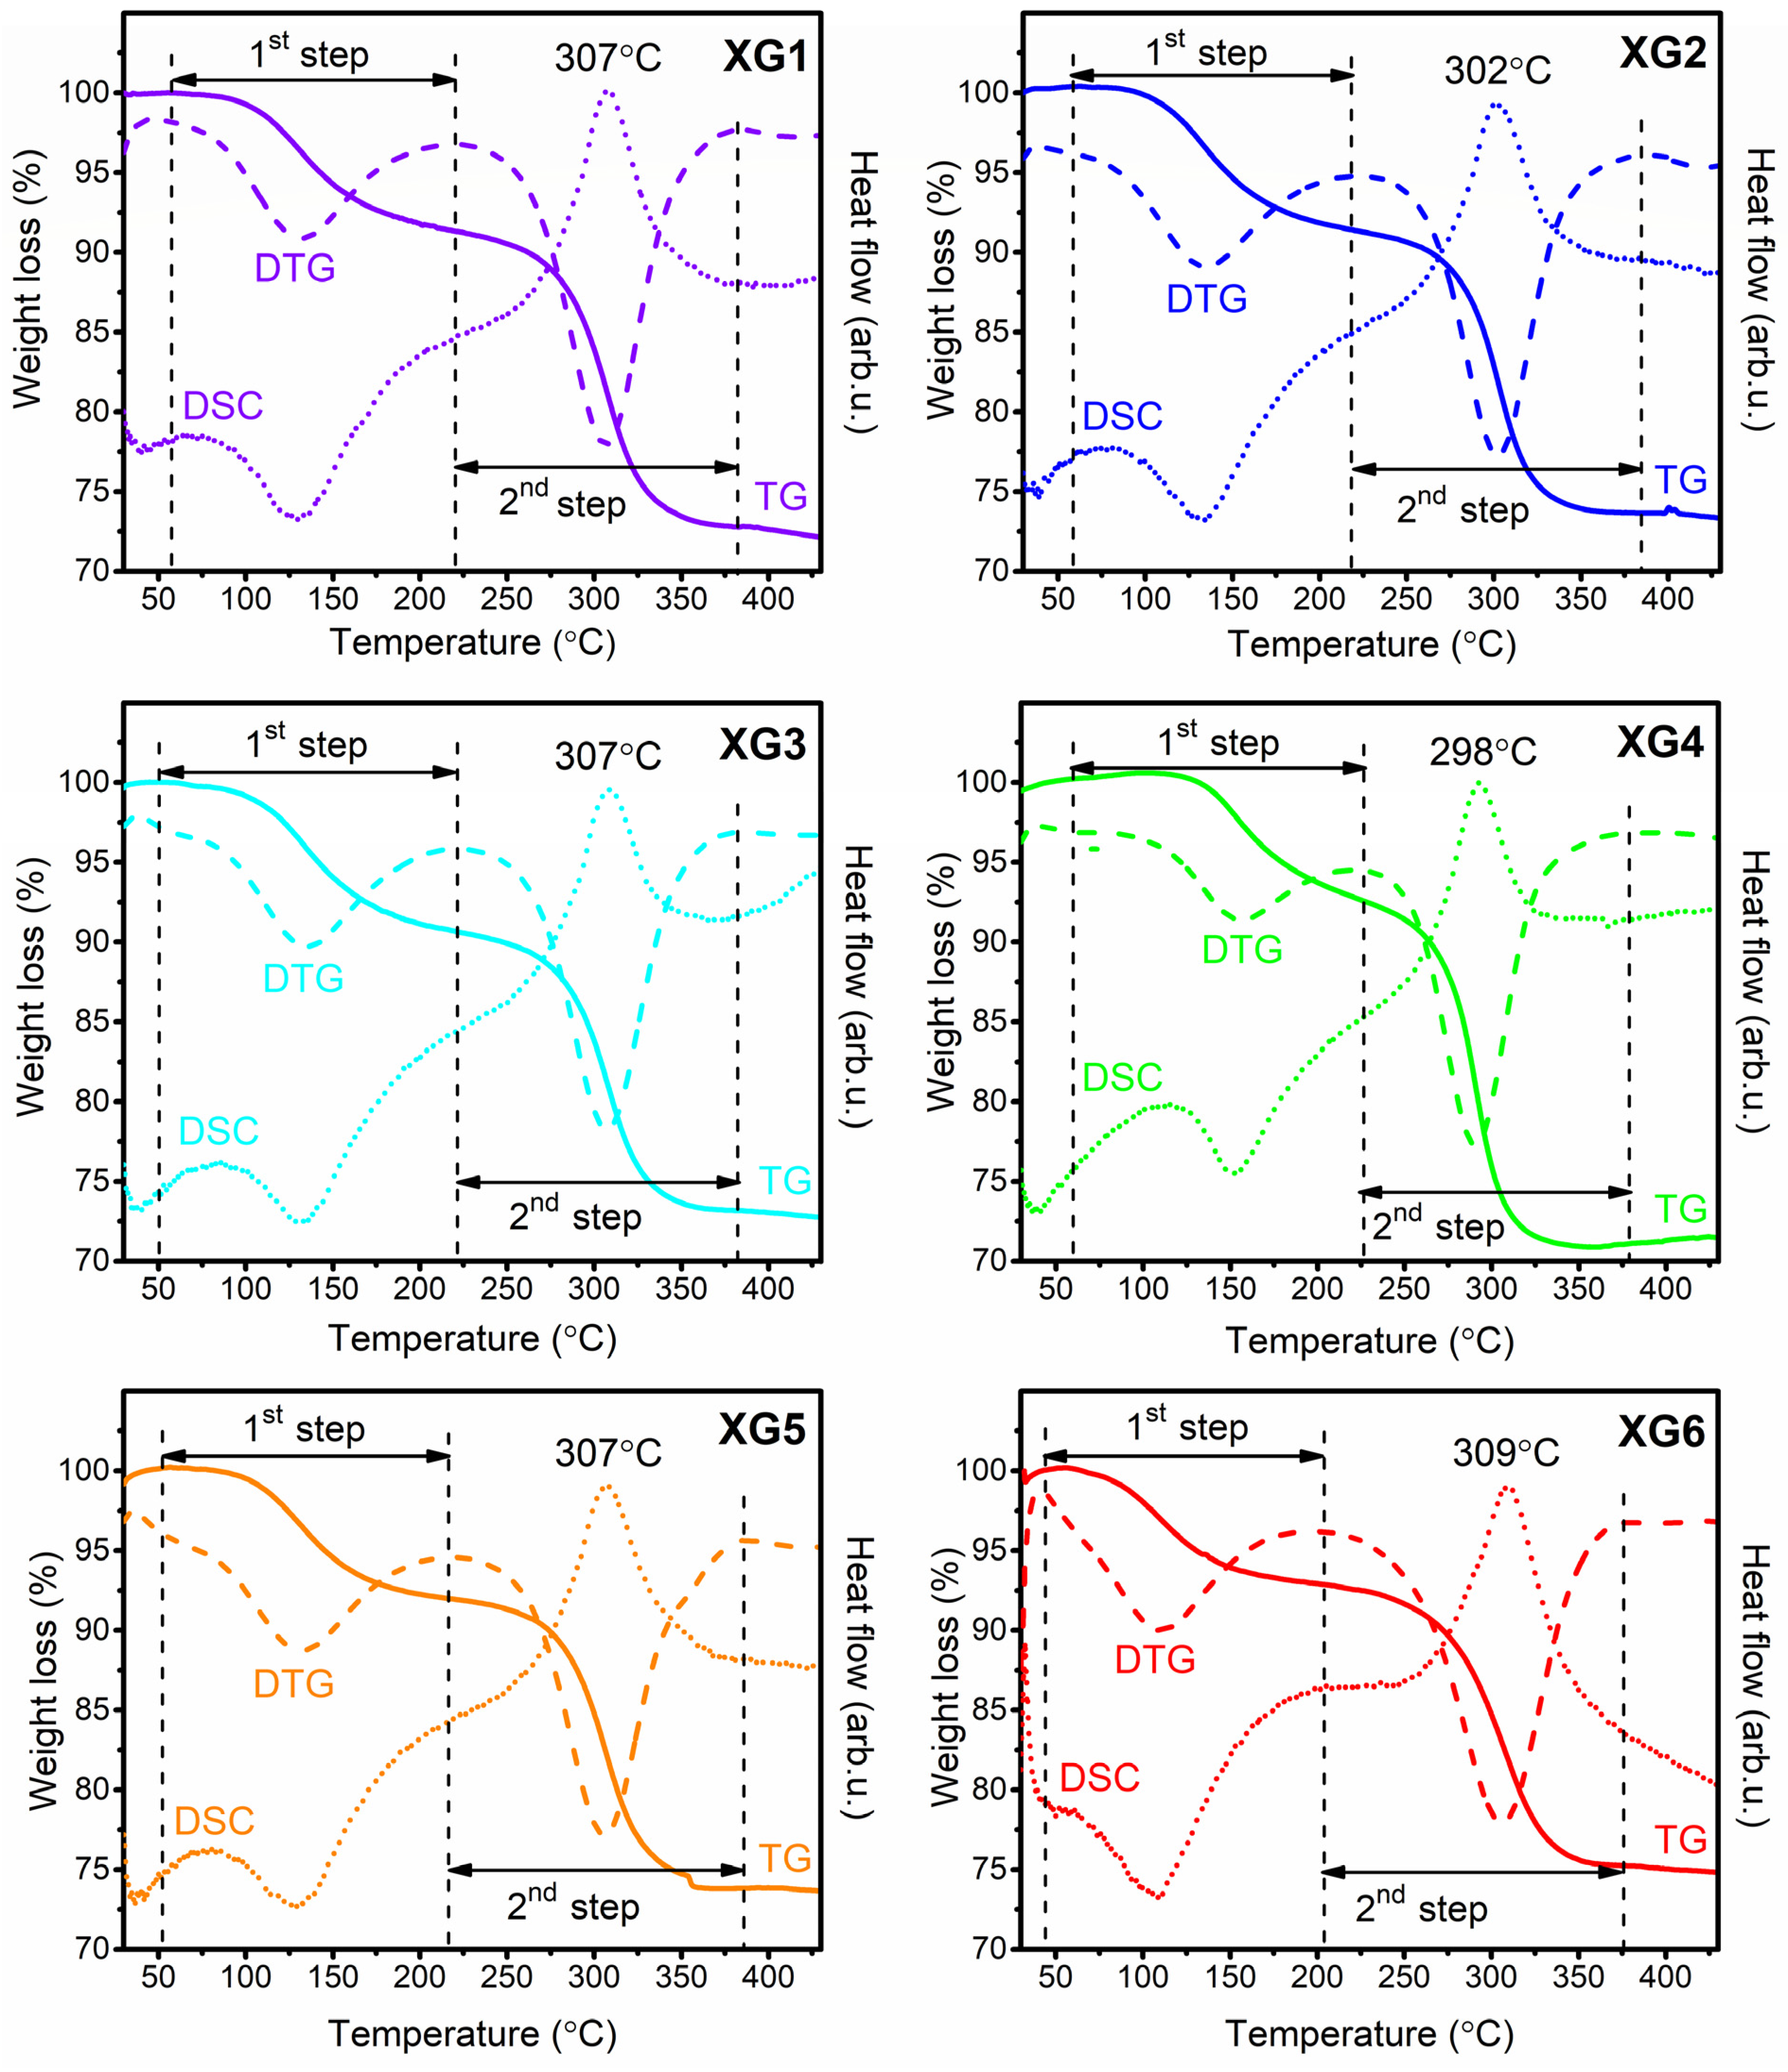
3.1. Analysis of TG/DTG and DSC Results for Dy3+-Doped Xerogels
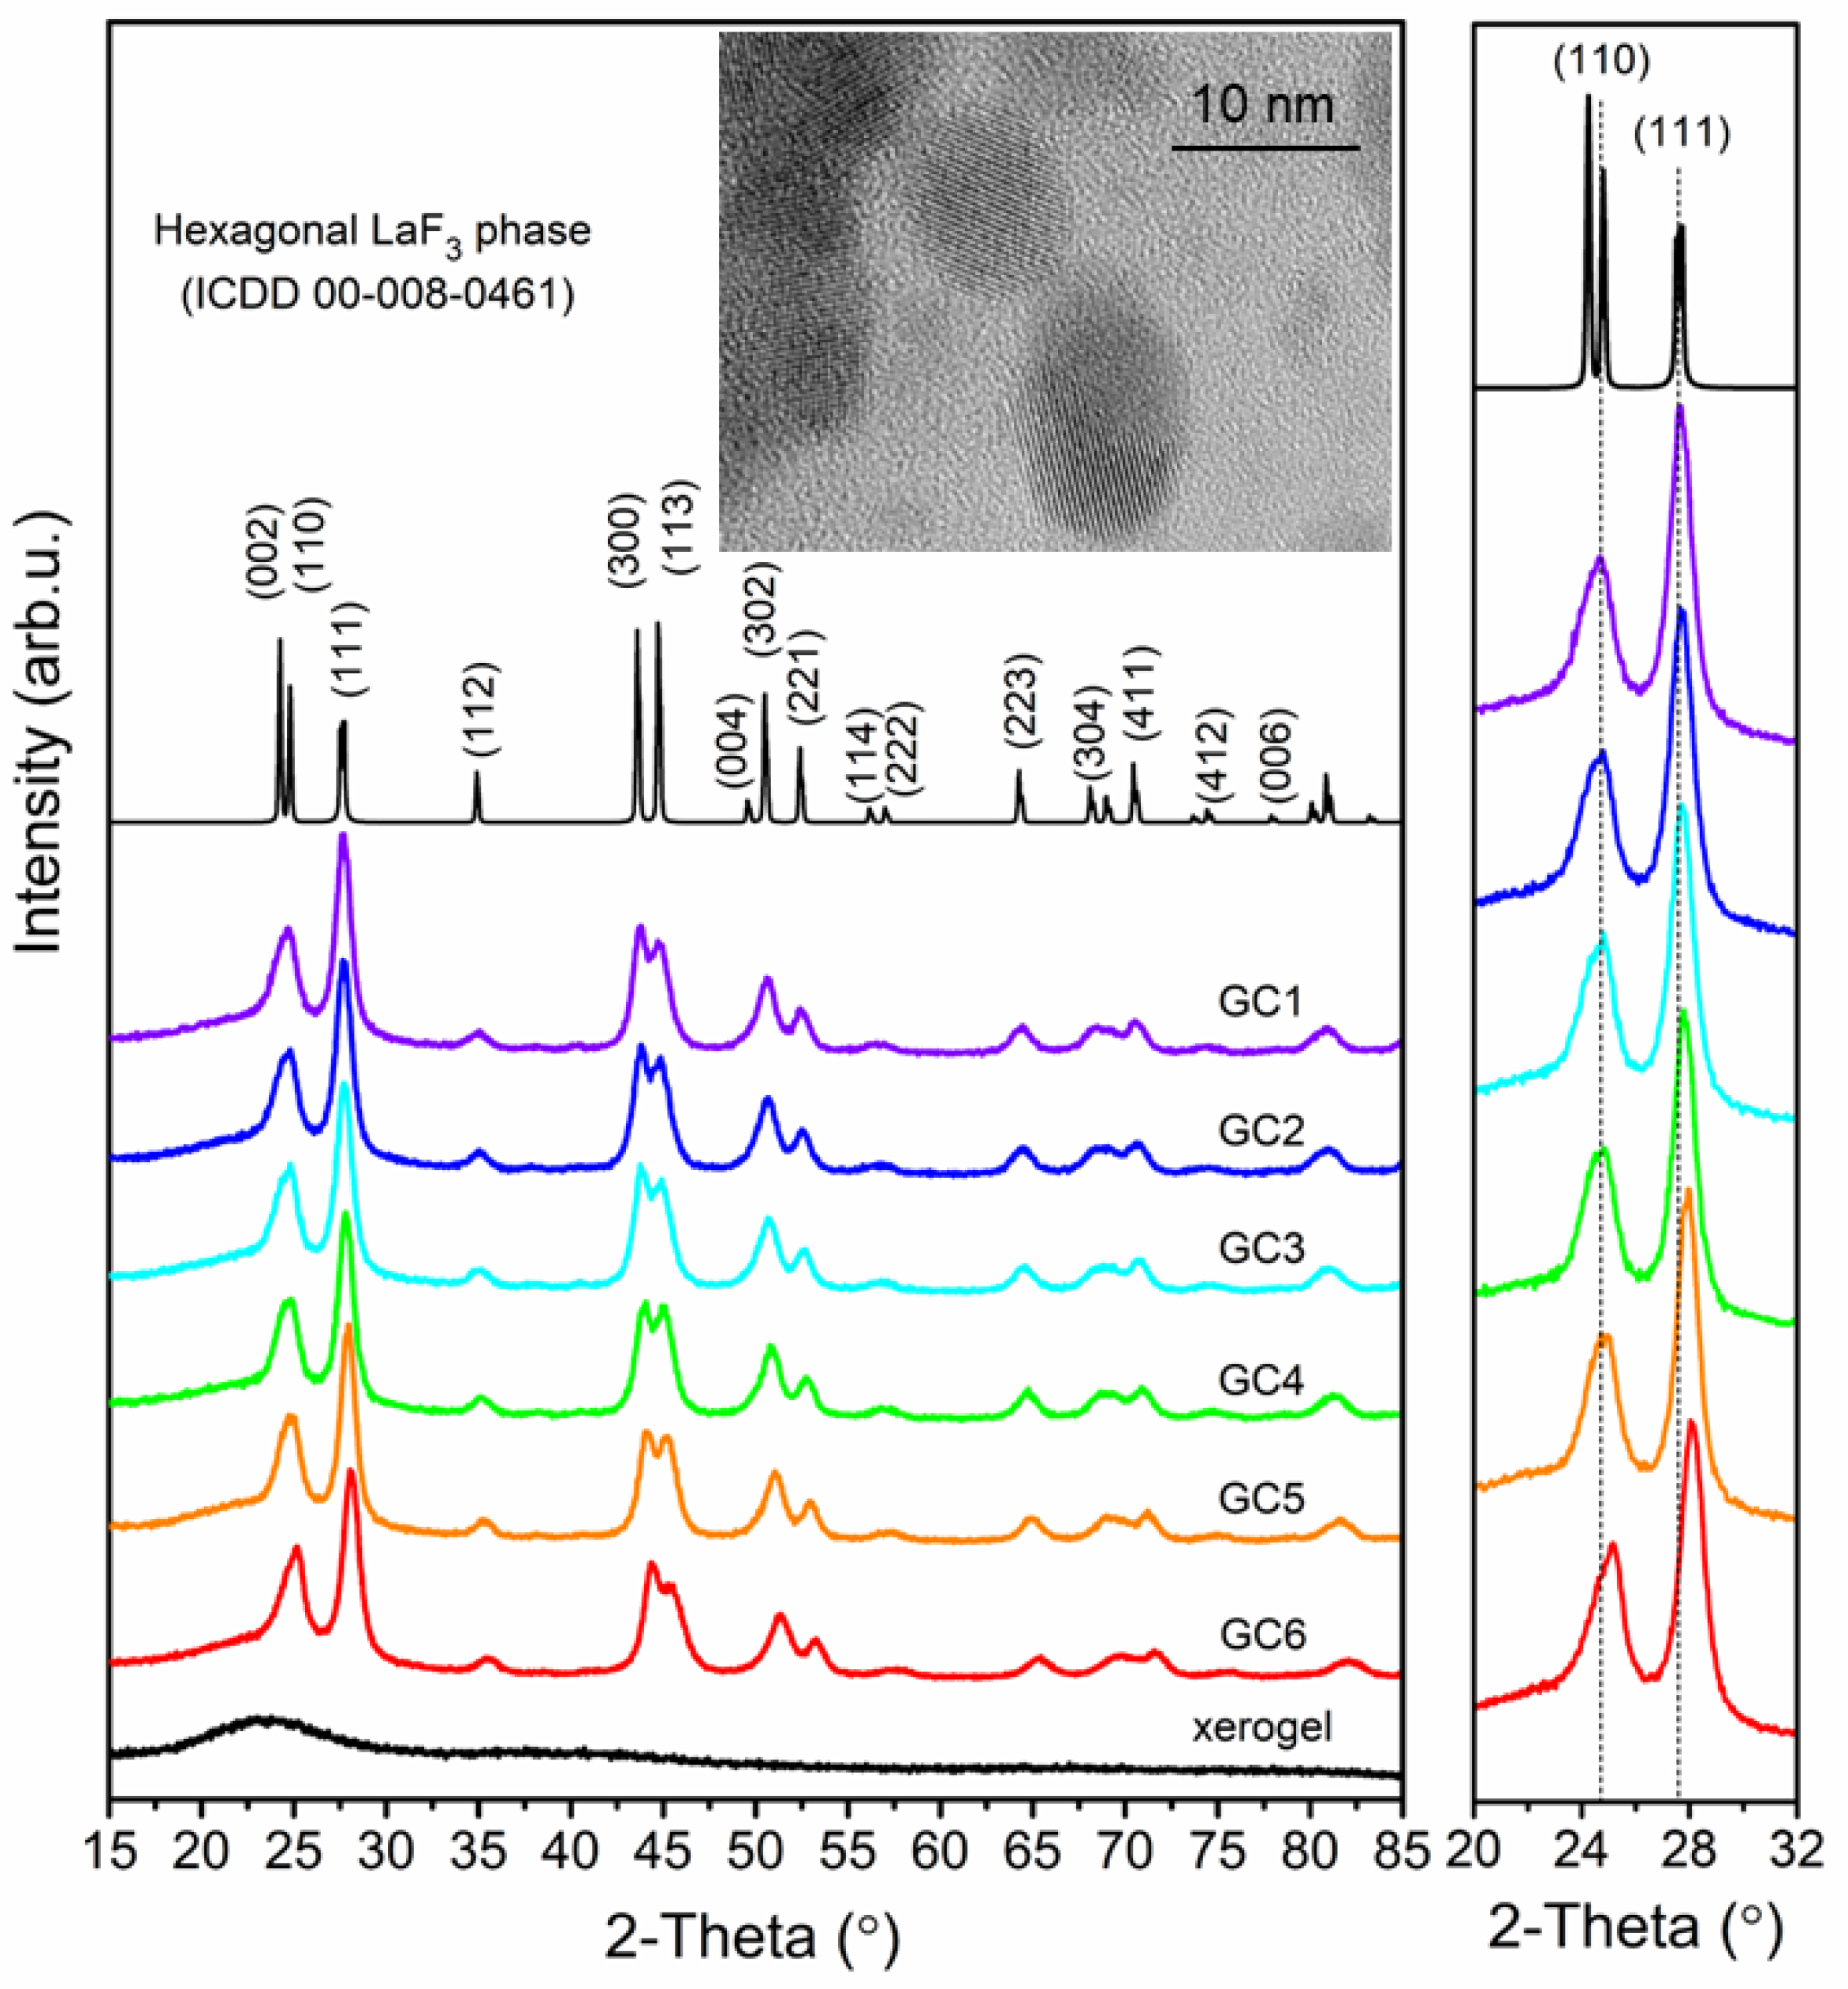
3.2. Structural Characterization of Fabricated Dy3+-Doped Sol-Gel Materials
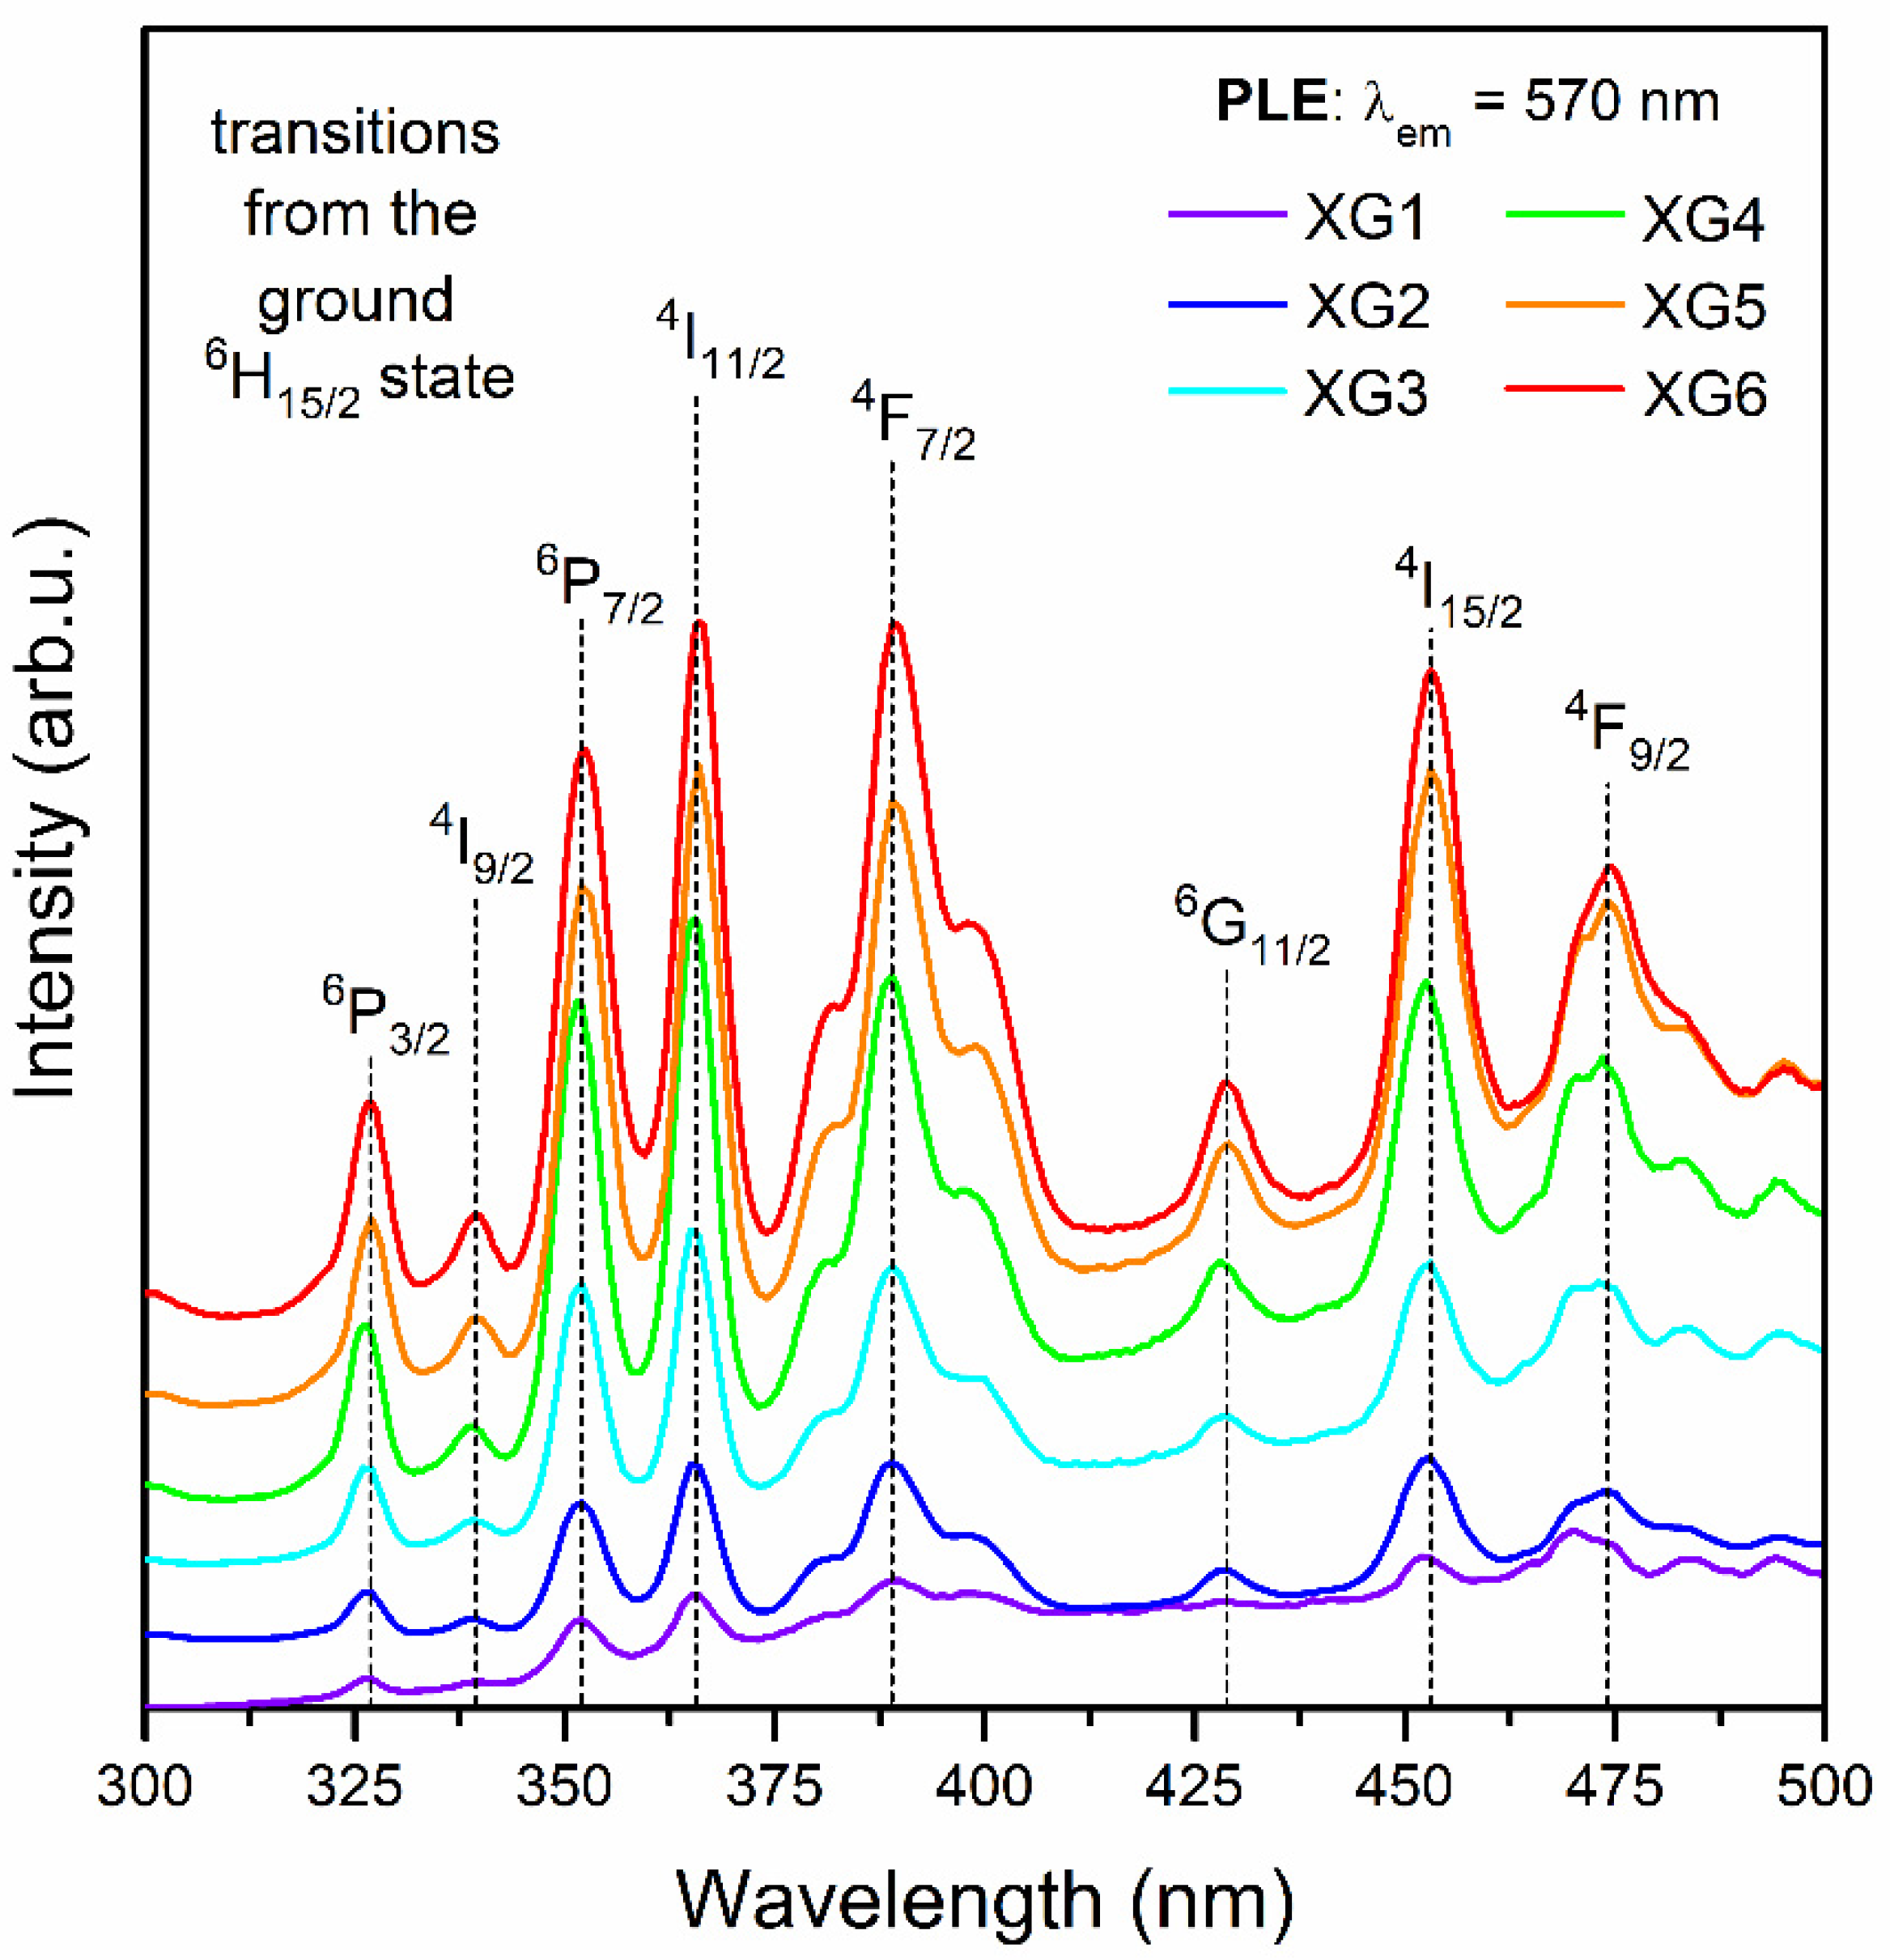
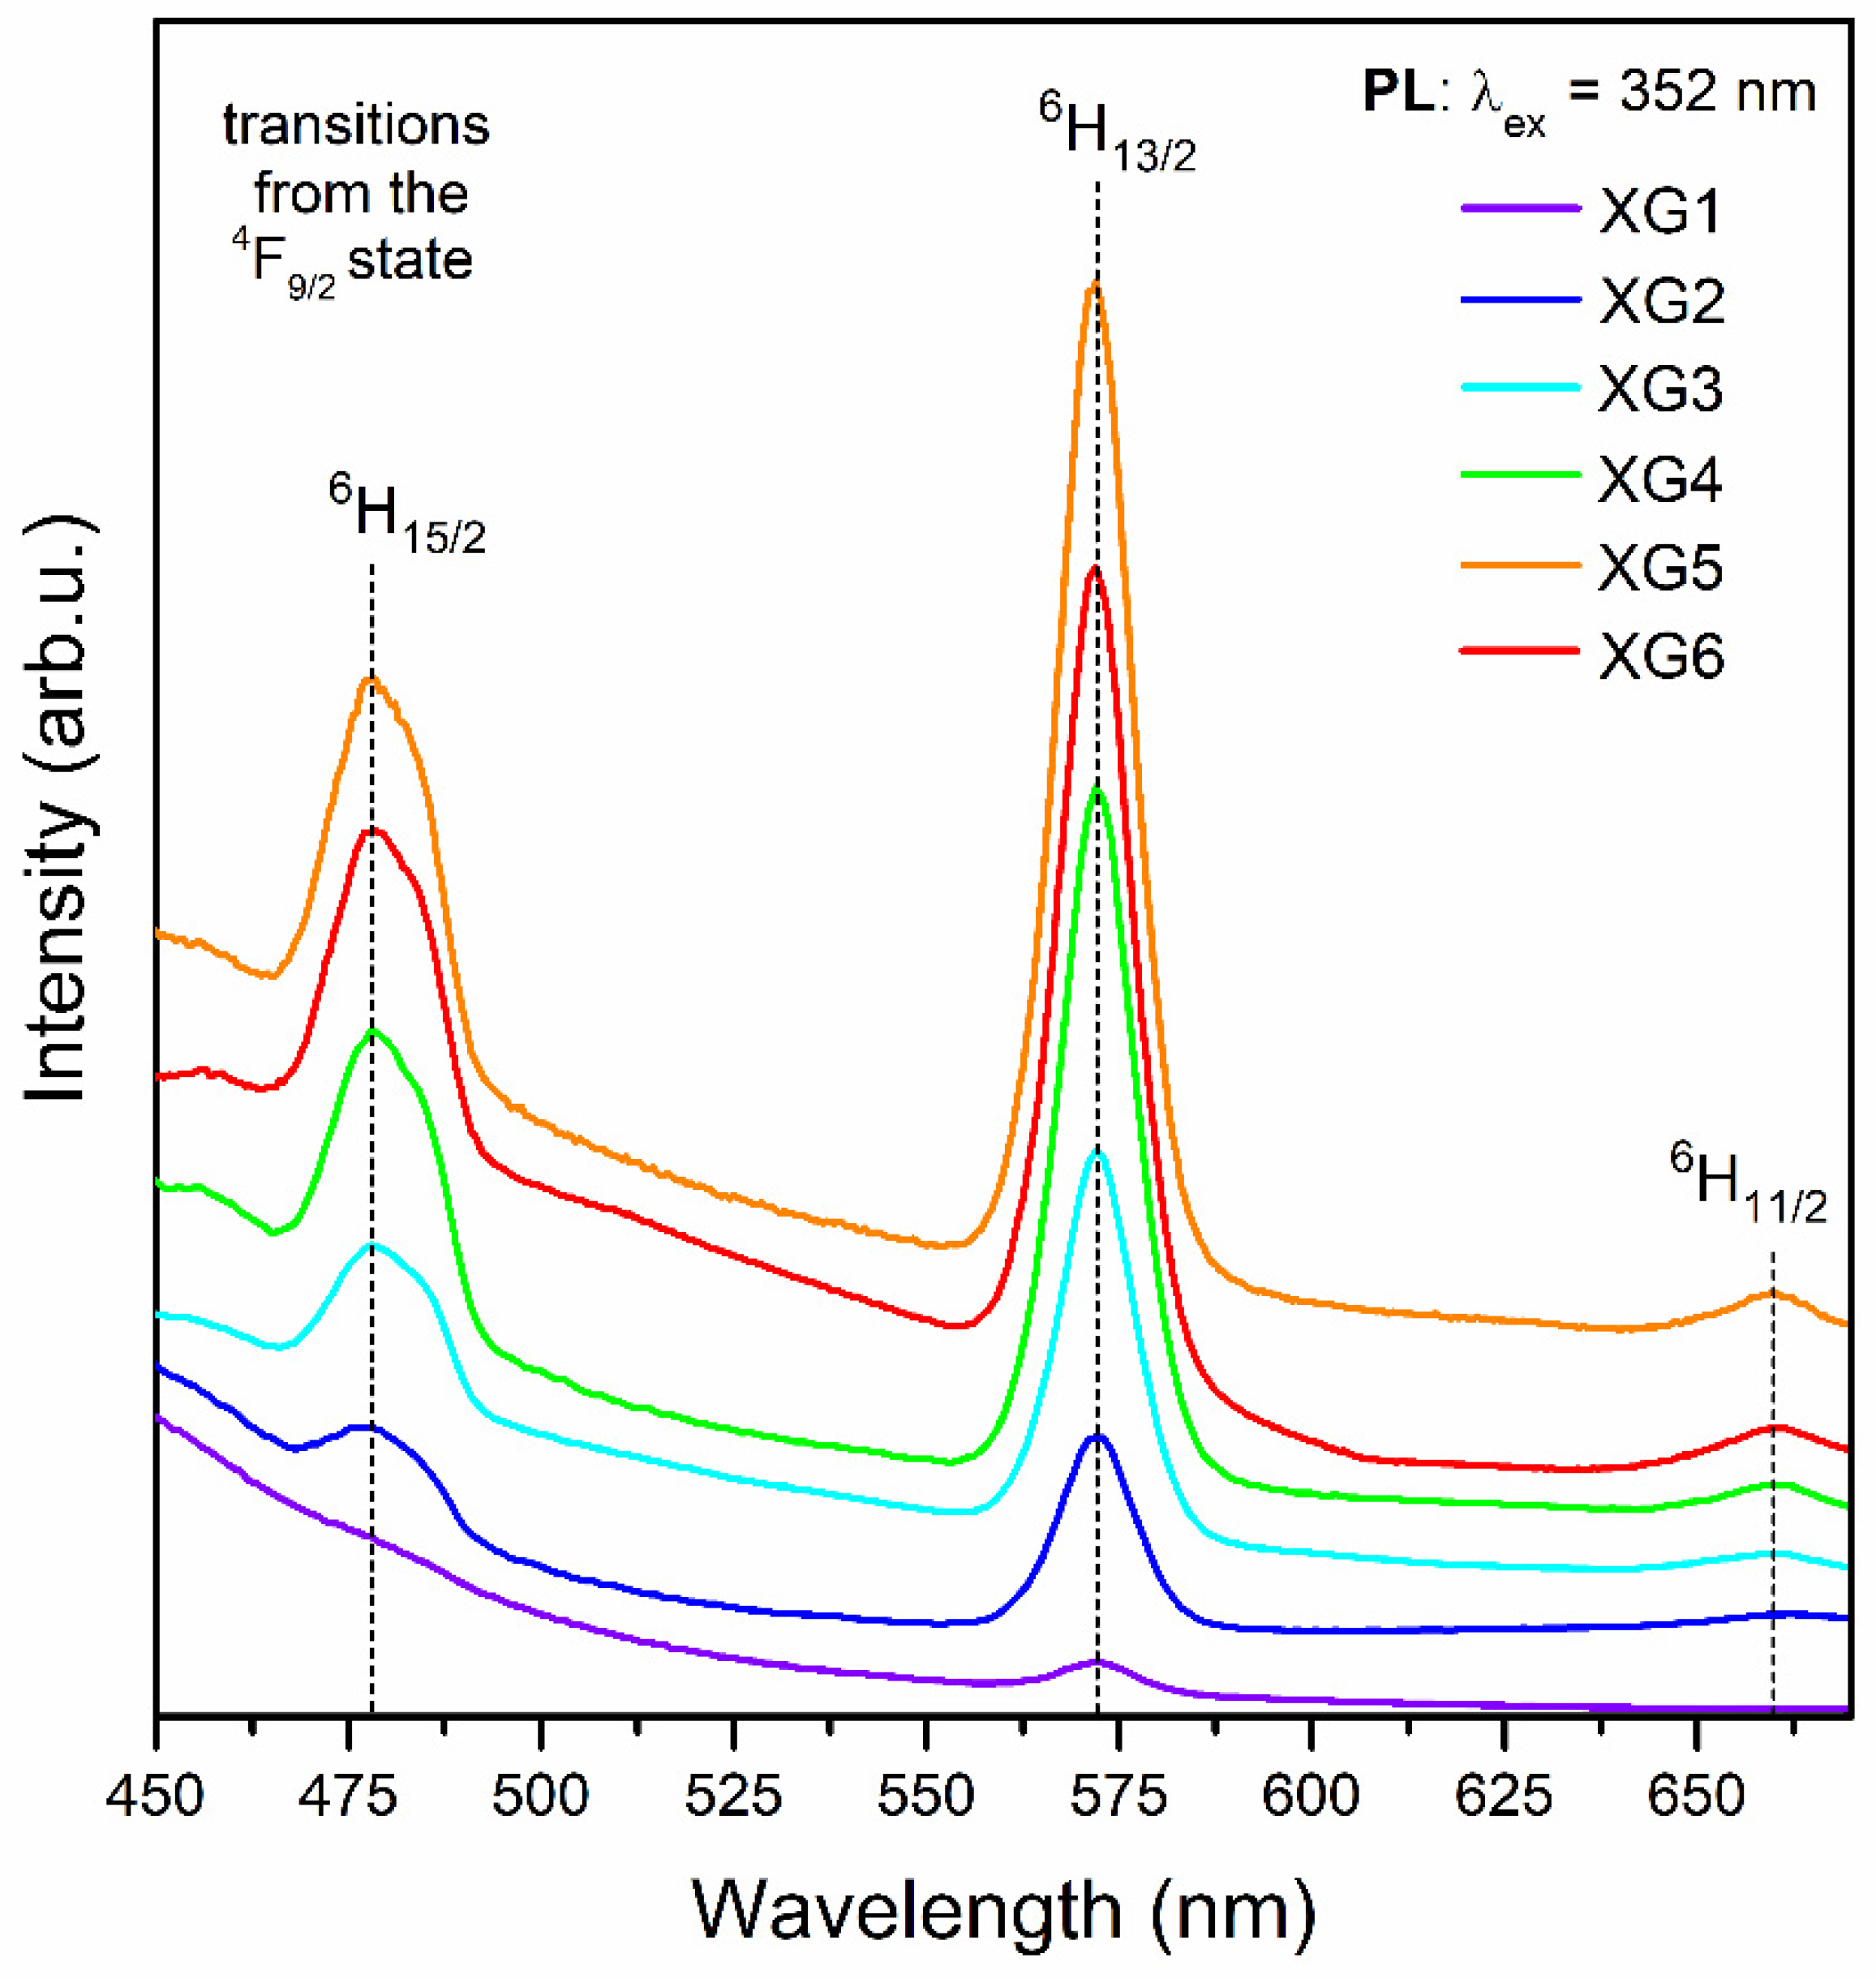
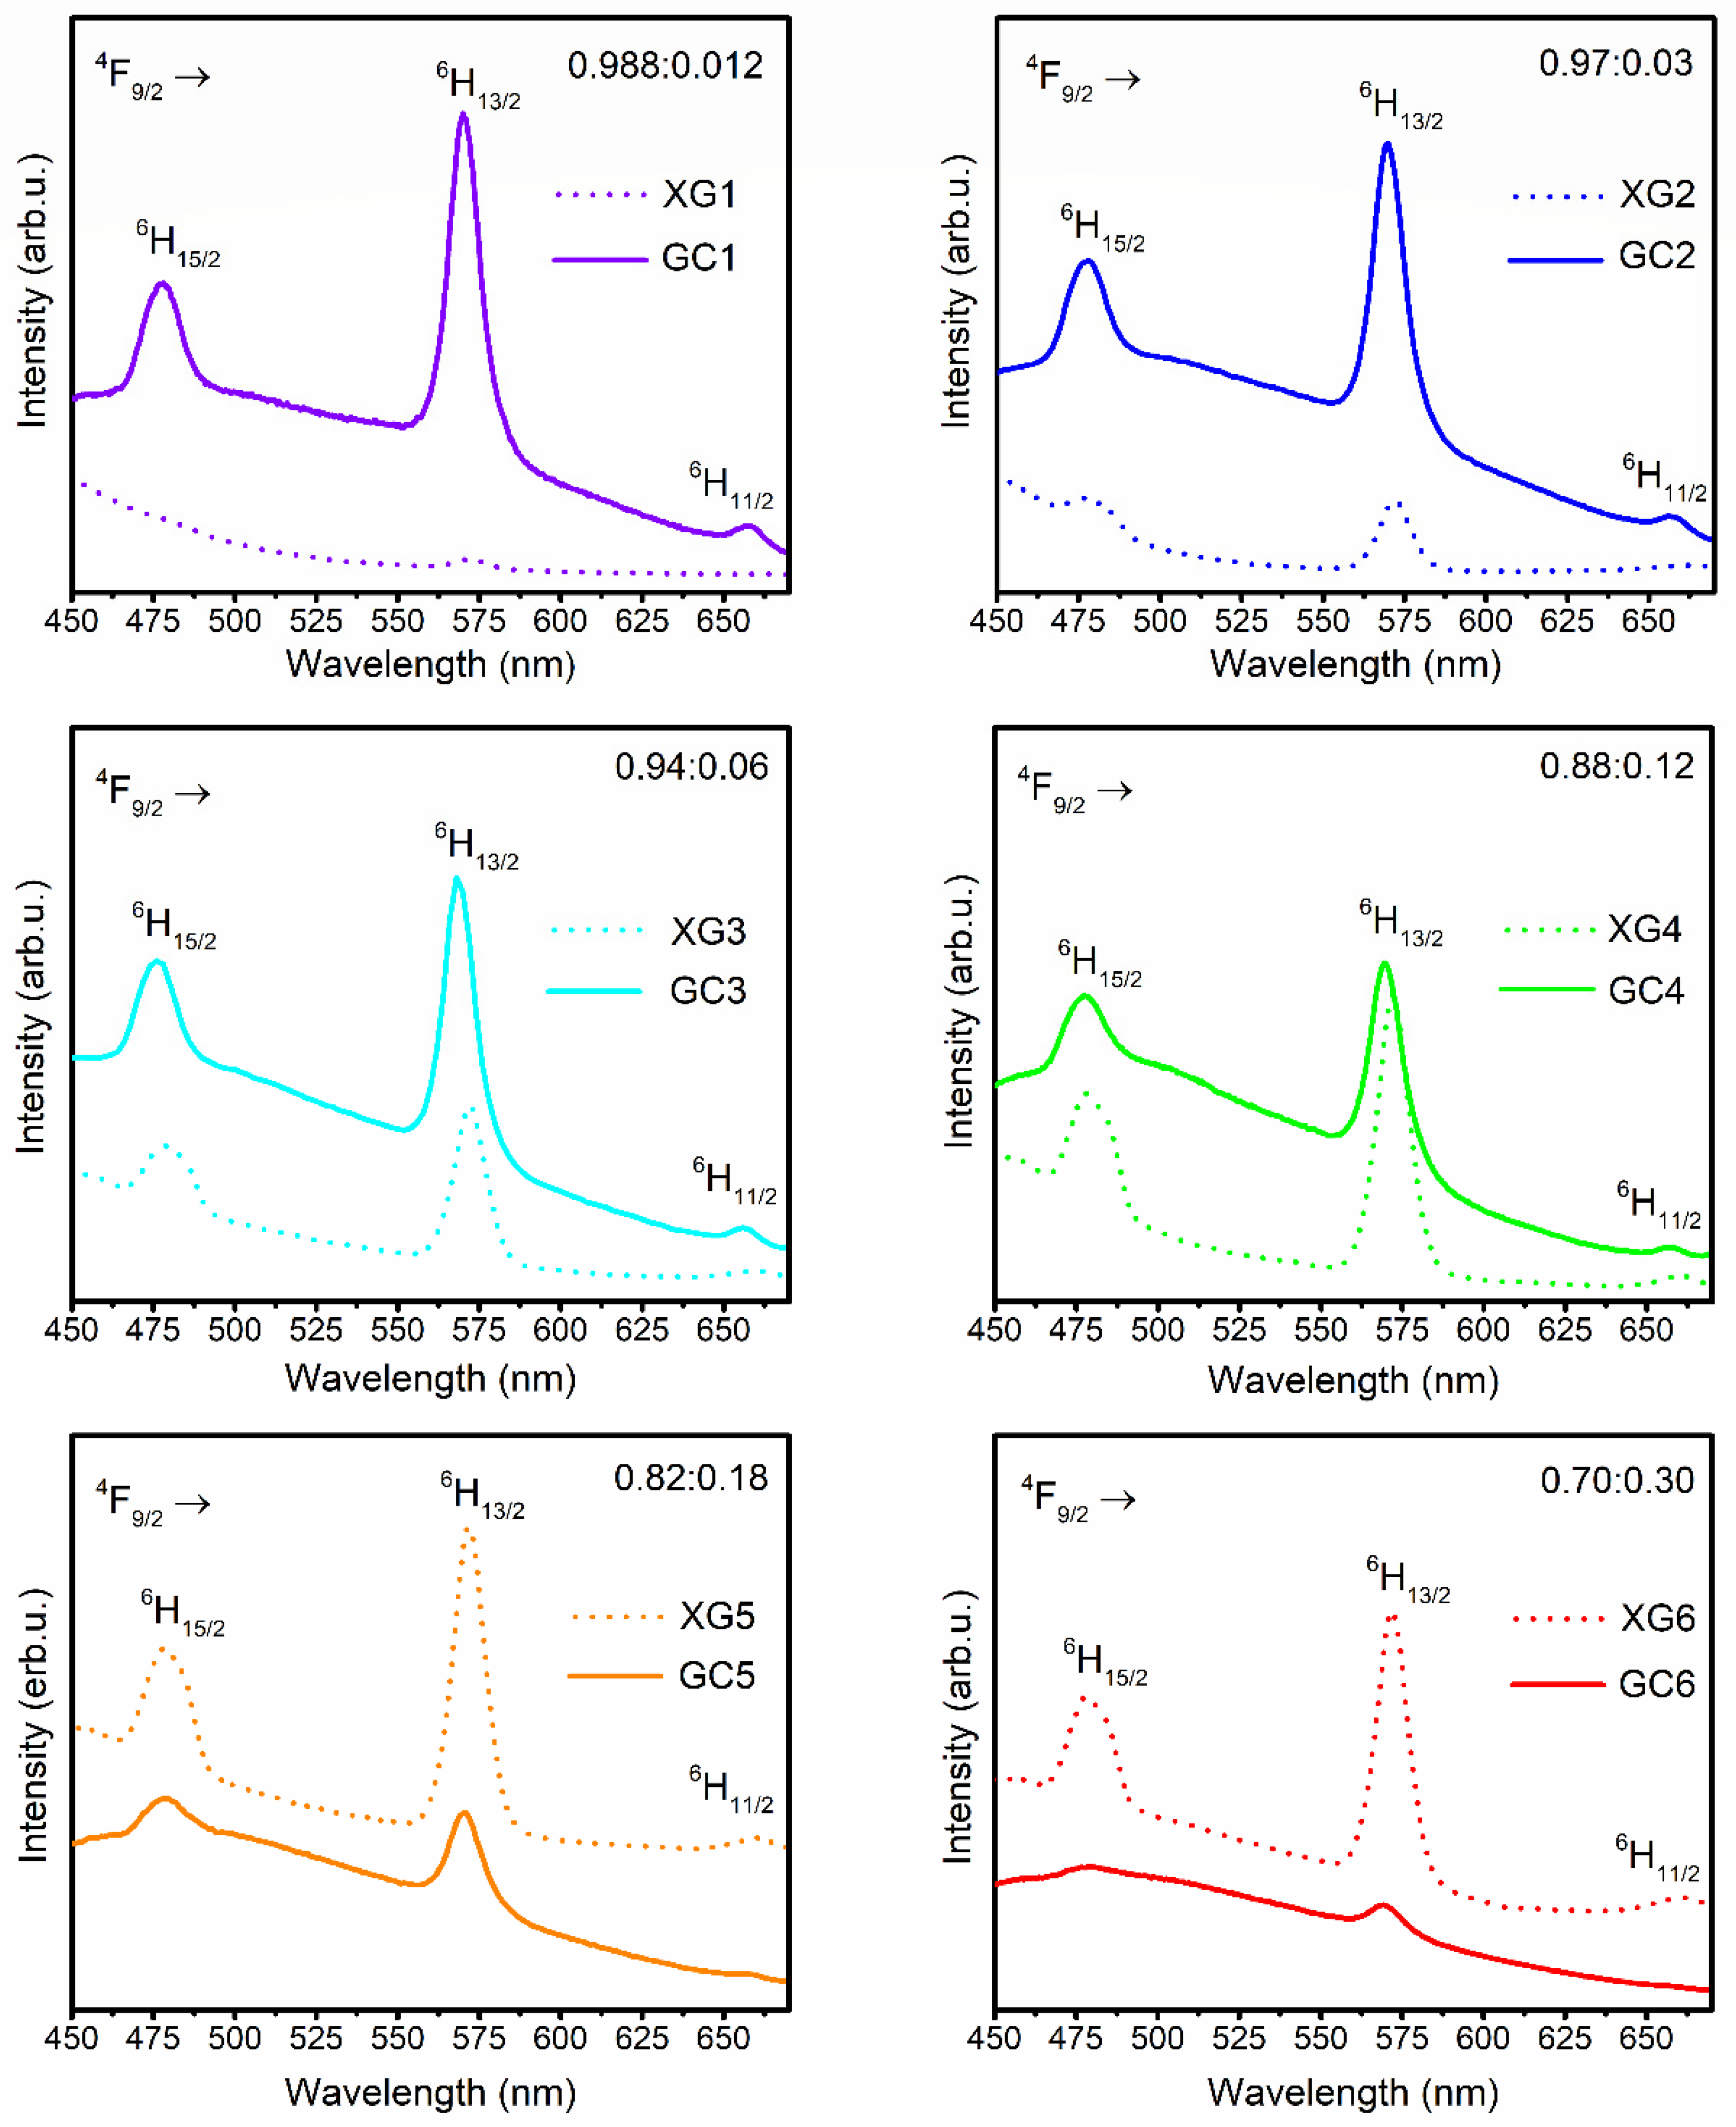
3.3. Optical Properties of Dy3+-Doped Xerogels
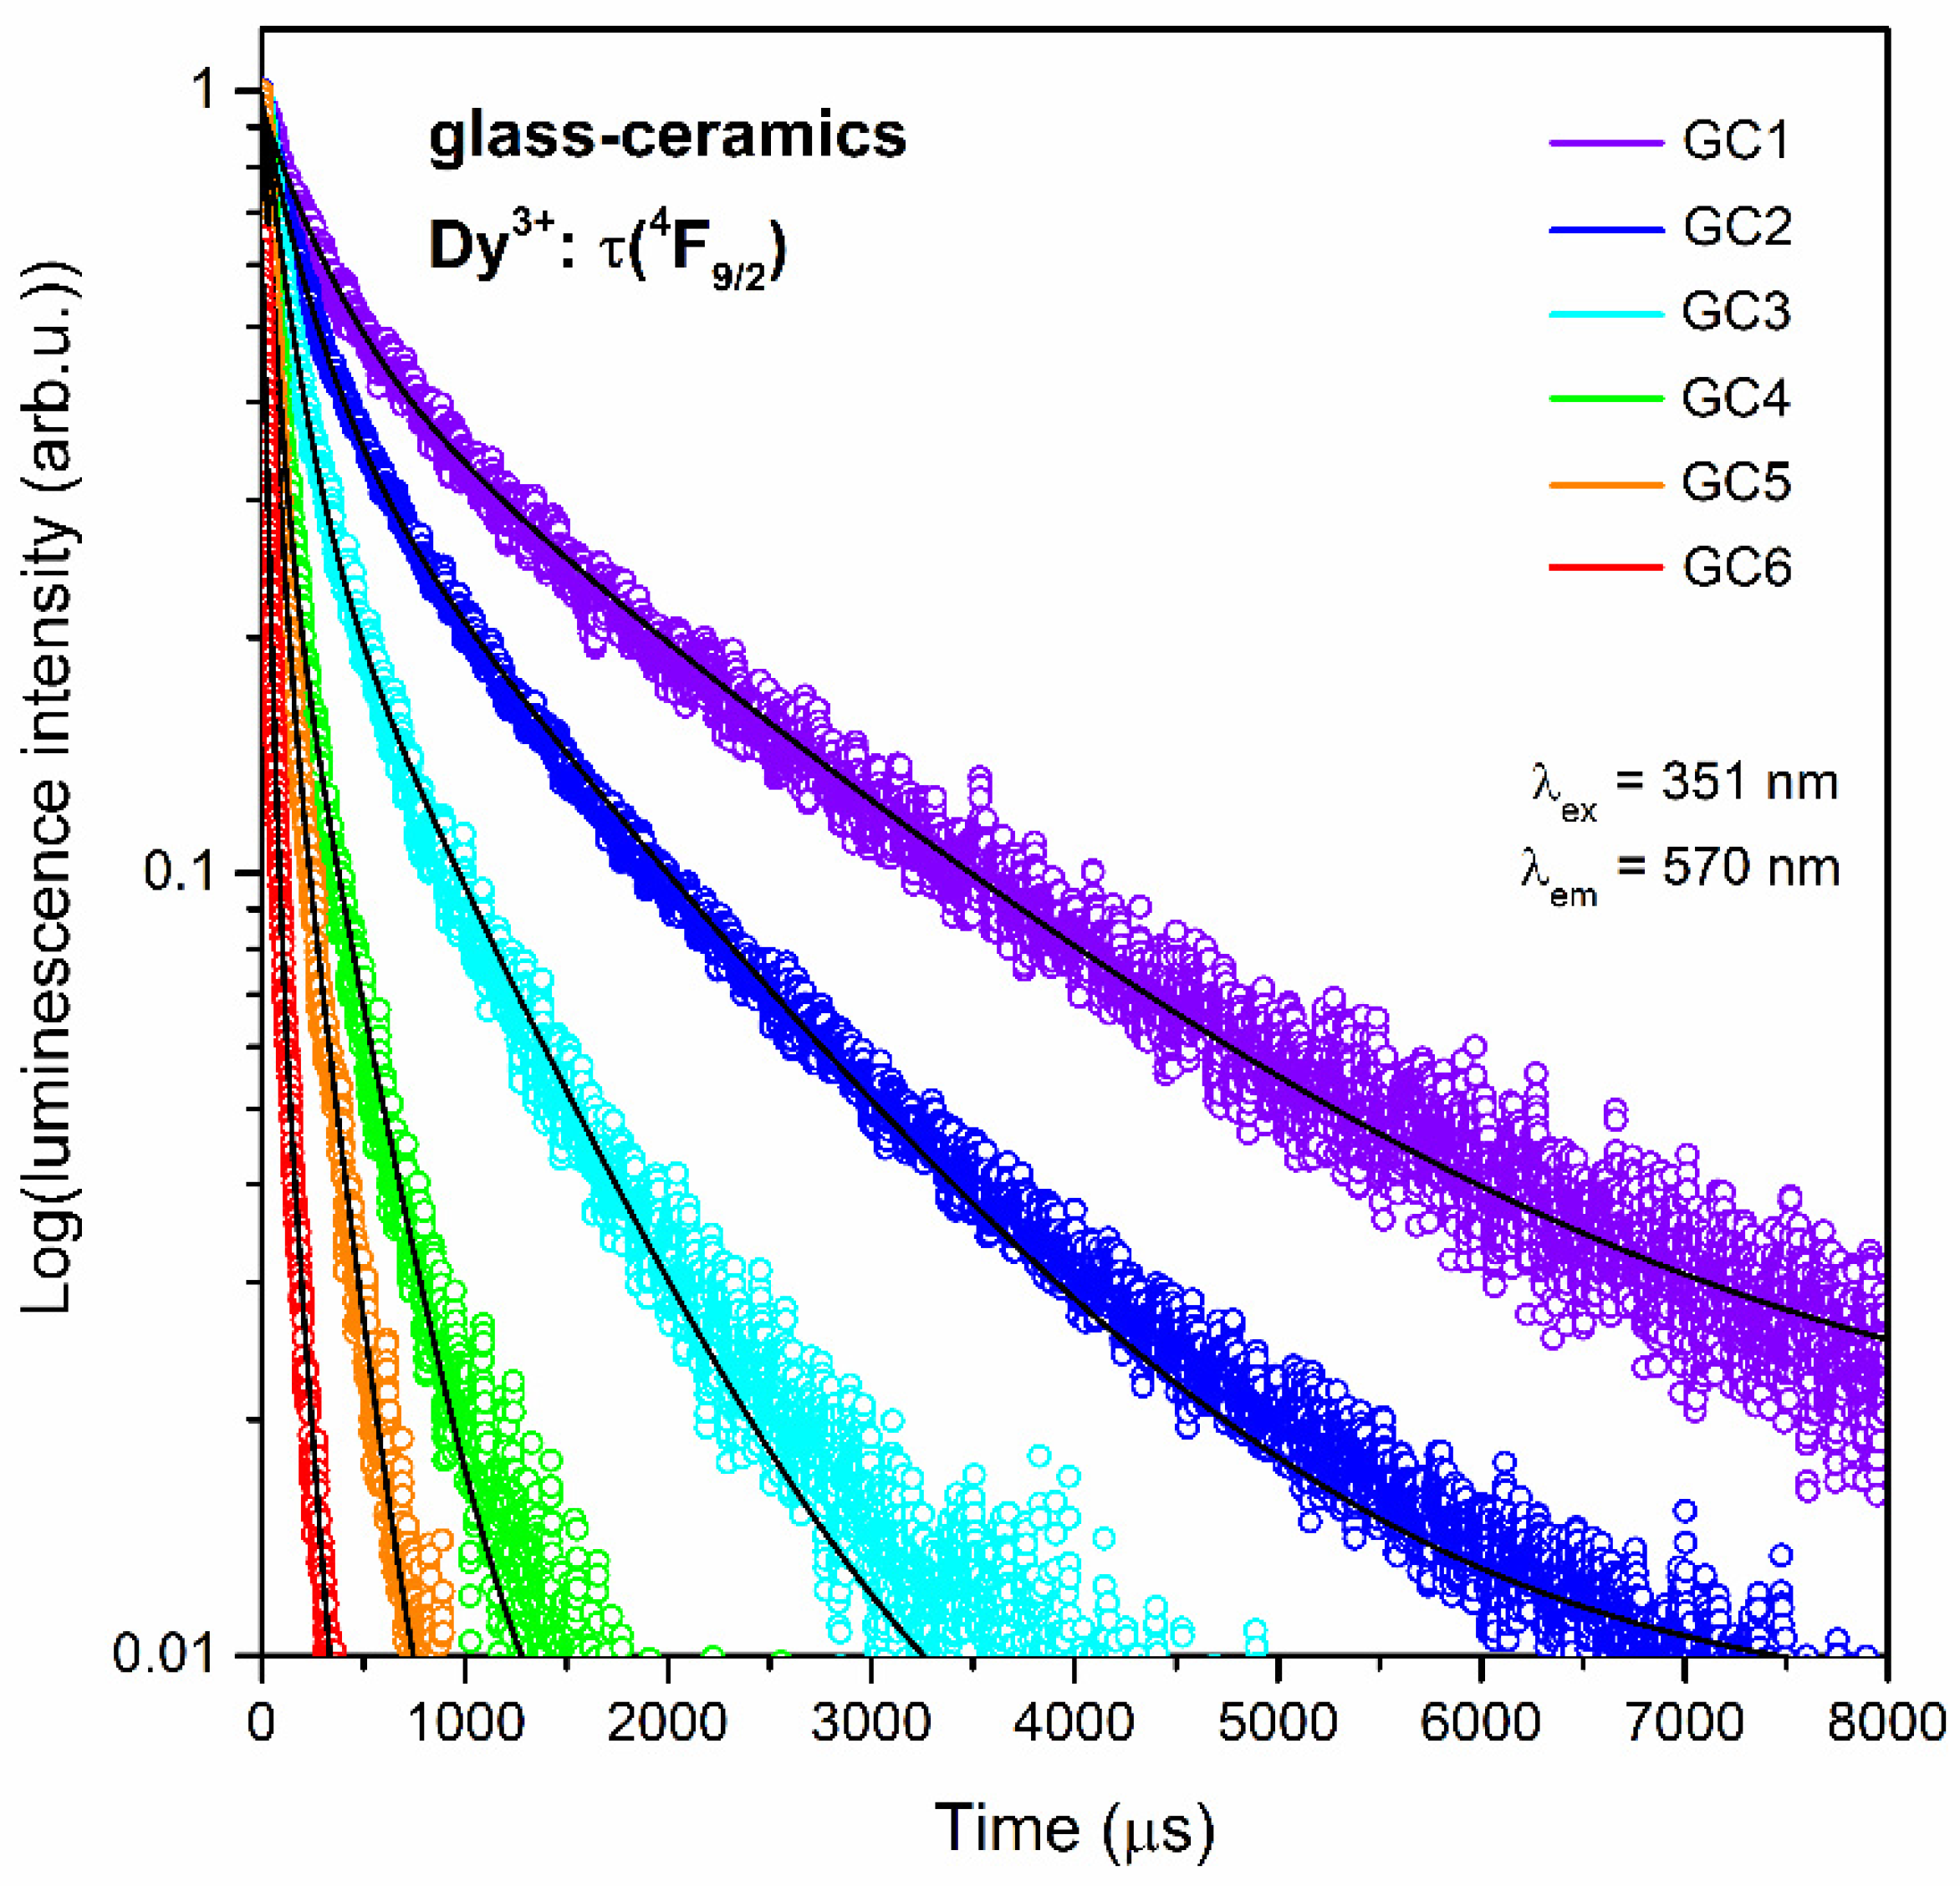
3.4. Luminescence Behavior of Dy3+-Doped Nano-Glass-Ceramics
4. Conclusions
Author Contributions
Funding
Data Availability Statement
Conflicts of Interest
References
- Archana, L.S.; Rajendran, D.N. Luminescence of rare earth doped ZnS nanophosphors for the applications in optical displays. Mater. Today Proc. 2021, 41, 461–467. [Google Scholar] [CrossRef]
- Frieiro, J.L.; Guillaume, C.; López-Vidrier, J.; Blázquez, O.; González-Torres, S.; Labbé, C.; Hernández, S.; Portier, X.; Garrido, B. Toward RGB LEDs based on rare earth-doped ZnO. Nanotechnology 2020, 31, 465207. [Google Scholar] [CrossRef] [PubMed]
- Liu, Z.; Ikesue, A.; Li, J. Research progress and prospects of rare-earth doped sesquioxide laser ceramics. J. Eur. Ceram. Soc. 2021, 41, 3895–3910. [Google Scholar] [CrossRef]
- Fois, M.; Cox, T.; Ratcliffe, N.; de Lacy Costello, B. Rare earth doped metal oxide sensor for the multimodal detection of volatile organic compounds (VOCs). Sens. Actuators B 2021, 330, 129264. [Google Scholar] [CrossRef]
- Mishra, L.; Sharma, A.; Vishwakarma, A.K.; Jha, K.; Jayasimhadri, M.; Ratnam, B.V.; Jang, K.; Rao, A.S.; Sinha, R.K. White light emission and color tunability of dysprosium doped barium silicate glasses. J. Lumin. 2016, 169, 121–127. [Google Scholar] [CrossRef]
- Jaidass, N.; Moorthi, C.K.; Babu, A.M.; Babu, M.R. Luminescence properties of Dy3+ doped lithium zinc borosilicate glasses for photonic application. Heliyon 2018, 4, e00555. [Google Scholar] [CrossRef] [Green Version]
- Rittisut, W.; Wantana, N.; Ruangtaweep, Y.; Mool-am-kha, P.; Padchasri, J.; Rujirawat, S.; Manyum, P.; Yimnirun, R.; Kidkhunthod, P.; Prasatkhetragarn, A.; et al. Bright white light emission from (Gd3+/Dy3+) dual doped transparent lithium aluminum borate glasses for W- LED application. Opt. Mater. 2021, 122, 111705. [Google Scholar] [CrossRef]
- Wang, L.; Guo, Z.; Wang, S.; Zhang, H.; Lv, H.; Wang, T.; Su, C. Luminescence properties of Dy3+ doped glass ceramics containing Na3Gd(PO4)2. J. Non-Cryst. Solids 2020, 543, 120091. [Google Scholar] [CrossRef]
- Bu, Y.Y.; Cheng, S.J.; Wang, X.F.; Yan, X.H. Optical thermometry based on luminescence behavior of Dy3+-doped transparent LaF3 glass ceramics. Appl. Phys. A 2015, 121, 1171–1178. [Google Scholar] [CrossRef]
- Komar, J.; Lisiecki, R.; Głowacki, M.; Berkowski, M.; Suszyńska, M.; Ryba-Romanowski, W. Spectroscopic parameters of Dy3+ ions in La3Ga0.5Ta0.5O14 single crystal. J. Lumin. 2020, 220, 116989. [Google Scholar] [CrossRef]
- Lin, X.; Zhao, L.; Jiang, B.; Mao, J.; Chi, F.; Wang, P.; Xie, C.; Wei, X.; Chen, Y.; Yin, M. Temperature-dependent luminescence of BaLaMgNbO6:Mn4+,Dy3+ phosphor for dual-mode optical thermometry. Opt. Mater. 2019, 95, 109199. [Google Scholar] [CrossRef]
- Murali Krishna, V.; Mahamuda, S.; Talewar, R.A.; Swapna, K.; Venkateswarlu, M.; Rao, A.S. Dy3+ ions doped oxy-fluoro boro tellurite glasses for the prospective optoelectronic device applications. J. Alloys Compd. 2018, 762, 814–826. [Google Scholar] [CrossRef]
- Pisarska, J.; Żur, L.; Pisarski, W.A. Optical spectroscopy of Dy3+ ions in heavy metal lead-based glasses and glass-ceramics. J. Mol. Struct. 2011, 993, 160–166. [Google Scholar] [CrossRef]
- Babu, P.; Jang, K.H.; Kim, E.S.; Shi, L.; Vijaya, R.; Lavín, V.; Jayasankar, C.K.; Seo, H.J. Optical Properties and energy transfer of Dy3+-doped transparent oxyfluoride glasses and glass-ceramics. J. Non-Cryst. Solids 2010, 356, 236–243. [Google Scholar] [CrossRef]
- Mahamuda, S.; Syed, F.; Annapurna Devi, C.B.; Swapna, K.; Prasad, M.V.V.K.S.; Venkateswarlu, M.; Rao, A.S. Spectral characterization of Dy3+ ions doped phosphate glasses for yellow laser applications. J. Non-Cryst. Solids 2021, 555, 120538. [Google Scholar] [CrossRef]
- Maheshwari, K.; Rao, A.S. Photoluminescence downshifting studies of thermally stable Dy3+ ions doped phosphate glasses for photonic device applications. Opt. Mater. 2022, 129, 112518. [Google Scholar] [CrossRef]
- Wu, H.; Liu, X.; Cao, L.; Zheng, Y.; Jin, W.; Li, L. Effect of lattice distortion induced by Li+ doping on white light CaWO4:Dy3+ phosphors: Phase, photoluminescence and electronic structure. J. Lumin. 2021, 235, 118023. [Google Scholar] [CrossRef]
- Sheoran, M.; Sehrawat, P.; Kumari, N.; Khatkar, S.P.; Malik, R.K. Cool white light emanation and photo physical features of combustion derived Dy3+ doped ternary yttrate oxide based nanophosphors for down converted WLEDs. Chem. Phys. Lett. 2021, 773, 138608. [Google Scholar] [CrossRef]
- Sehrawat, P.; Khatkar, A.; Boora, P.; Kumar, M.; Malik, R.K.; Khatkar, S.P.; Taxak, V.B. Emanating cool white light emission from novel down-converted SrLaAlO4:Dy3+ nanophosphors for advanced optoelectronic applications. Ceram. Int. 2020, 46, 16274–16284. [Google Scholar] [CrossRef]
- Eliseeva, S.V.; Salerno, E.V.; Lopez Bermudez, B.A.; Petoud, S.; Pecoraro, V.L. Dy3+ White Light Emission Can Be Finely Controlled by Tuning the First Coordination Sphere of Ga3+/Dy3+ Metallacrown Complexes. J. Am. Chem. Soc. 2020, 142, 16173–16176. [Google Scholar] [CrossRef]
- Anderson, B.R.; Gunawidjaja, R.; Eilers, H. Dy3+-doped yttrium complex molecular crystals for two-color thermometry in heterogeneous materials. J. Lumin. 2017, 188, 238–245. [Google Scholar] [CrossRef] [Green Version]
- Silva, I.G.N.; Kai, J.; Felinto, M.C.F.C.; Brito, H.F. White emission phosphors based on Dy3+-doped into anhydrous rare-earth benzenetricarboxylate complexes. Opt. Mater. 2013, 35, 978–982. [Google Scholar] [CrossRef]
- Grobelna, B.; Synak, A.; Głowaty, D.; Bojarski, P.; Szczodrowski, K.; Gryczyński, I.; Karczewski, J. Novel inorganic xerogels doped with CaWO4:xDy: Synthesis, characterization and luminescence properties. Mater. Chem. Phys. 2017, 199, 166–172. [Google Scholar] [CrossRef]
- Grobelna, B.; Synak, A.; Bojarski, P. The luminescence properties of dysprosium ions in silica xerogel doped with Gd1.6Dy0.4(WO4)3. Opt. Appl. 2012, XLII, 337–344. [Google Scholar]
- Grobelna, B.; Synak, A.; Bojarski, P.; Szczodrowski, K.; Kukliński, B.; Raut, S.; Gryczyński, I. Synthesis and luminescence characteristics of Dy3+ ions in silica xerogels doped with Ln2-xDyx(WO4)3. Opt. Mater. 2013, 35, 456–461. [Google Scholar] [CrossRef]
- Santana-Alonso, A.; Yanes, A.C.; Méndez-Ramos, J.; del-Castillo, J.; Rodríguez, V.D. Down-shifting by energy transfer in Dy3+-Tb3+ co-doped YF3-based sol-gel nano-glass-ceramics for photovoltaic applications. Opt. Mater. 2011, 33, 587–591. [Google Scholar] [CrossRef]
- Velázquez, J.J.; Rodríguez, V.D.; Yanes, A.C.; del-Castillo, J.; Méndez-Ramos, J. Increase in the Tb3+ green emission in SiO2-LaF3 nano-glass-ceramics by codoping with Dy3+ ions. J. Appl. Phys. 2010, 108, 113530. [Google Scholar] [CrossRef]
- Torres-Rodriguez, J.; Gutierrez-Cano, V.; Menelaou, M.; Kaštyl, J.; Cihlář, J.; Tkachenko, S.; González, J.A.; Kalmár, J.; Fábián, I.; Lázár, I.; et al. Rare-Earth Zirconate Ln2Zr2O7 (Ln: La, Nd, Gd, and Dy) Powders, Xerogels, and Aerogels: Preparation, Structure, and Properties. Inorg. Chem. 2019, 58, 14467–14477. [Google Scholar] [CrossRef]
- Cruz, M.E.; Durán, A.; Balda, R.; Fernández, J.; Mather, G.C.; Castro, Y. A new sol–gel route towards Nd3+-doped SiO2-LaF3 glass-ceramics for photonic applications. Mater. Adv. 2020, 1, 3589–3596. [Google Scholar] [CrossRef]
- Cheng, S.; Liu, L.; Yang, Q.; Li, Y.; Zeng, S. In vivo optical bioimaging by using Nd-doped LaF3 luminescent nanorods in the second near-infrared window. J. Rare Earths 2019, 37, 931–936. [Google Scholar] [CrossRef]
- Wu, H.; Fei, G.T.; Gao, J.; Huang, J.; Zhang, L.D. Single-Phase Organic−Inorganic Hybrid Nanoparticles for Warm-White Lighting. ACS Appl. Nano Mater. 2022, 5, 9112–9116. [Google Scholar] [CrossRef]
- Chen, Z.; Wang, W.; Kang, S.; Cui, W.; Zhang, H.; Yu, G.; Wang, T.; Dong, G.; Jiang, C.; Zhou, S.; et al. Tailorable Upconversion White Light Emission from Pr3+ Single-Doped Glass Ceramics via Simultaneous Dual-Lasers Excitation. Adv. Opt. Mater. 2018, 6, 1700787. [Google Scholar] [CrossRef]
- Zhang, H.; Dong, X.; Jiang, L.; Yang, Y.; Cheng, X.; Zhao, H. Comparative analysis of upconversion emission of LaF3:Er/Yb and LaOF:Er/Yb for temperature sensing. J. Mol. Struct. 2020, 1206, 127665. [Google Scholar] [CrossRef]
- Peng, Y.; Zhong, J.; Li, X.; Chen, J.; Zhao, J.; Qiao, X.; Chen, D. Controllable competitive nanocrystallization of La3+-based fluorides in aluminosilicate glasses and optical spectroscopy. J. Eur. Ceram. Soc. 2019, 39, 1420–1427. [Google Scholar] [CrossRef]
- Ansari, A.A.; Parchur, A.K.; Labis, J.P.; Shar, M.A. Physiochemical characterization of highly biocompatible, and colloidal LaF3:Yb/Er upconversion nanoparticles. Photochem. Photobiol. Sci. 2021, 20, 1195–1208. [Google Scholar] [CrossRef] [PubMed]
- Nie, L.; Shen, Y.; Zhang, X.; Wang, X.; Liu, B.; Wang, Y.; Pan, Y.; Xie, X.; Huang, L.; Huang, W. Selective synthesis of LaF3 and NaLaF4 nanocrystals via lanthanide ion doping. J. Mater. Chem. C 2017, 5, 9188–9193. [Google Scholar] [CrossRef]
- Chien, H.-W.; Huang, C.-H.; Yang, C.-H.; Wang, T.-L. Synthesis, Optical Properties, and Sensing Applications of LaF3:Yb3+/Er3+/Ho3+/Tm3+ Upconversion Nanoparticles. Nanomaterials 2020, 10, 2477. [Google Scholar] [CrossRef] [PubMed]
- Ansari, A.A.; Rai, M.; Rai, S.B. Impact of LaF3 and silica shell formation on the crystal, optical and photo-luminescence properties of LaF3:Ce/Tb nanoparticles. Mater. Chem. Front. 2017, 1, 727–734. [Google Scholar] [CrossRef]
- Mitroshenkov, N.V.; Matovnikov, A.V.; Kuznetsov, S.V.; Lazutkina, M.V.; Volchek, A.A.; Konoplin, N.A.; Kornev, B.I.; Novikov, V.V. Low-temperature anomalies of thermodynamic properties of lanthanum trifluoride LaF3 and (SrF2)0.5(LaF3)0.5 multivalent solid solution. J. Alloys Compd. 2022, 894, 162537. [Google Scholar] [CrossRef]
- Hu, M.; Zhu, Z.; Wang, Y.; Li, J.; You, Z.; Tu, C. Bulk Crystal Growth, First-Principles Calculations, and Mid-Infrared Spectral Properties of Dy3+ Doped and Dy3+/Nd3+ Codoped LaF3 Single Crystals. Cryst. Growth Des. 2018, 18, 5981–5990. [Google Scholar] [CrossRef]
- Hong, J.; Zhang, L.; Hang, Y. Enhanced 2.86 μm emission of Ho3+,Pr3+-codoped LaF3 single crystal. Opt. Mater. Express 2017, 7, 1509–1513. [Google Scholar] [CrossRef]
- Li, S.; Zhang, L.; Zhang, P.; Hong, J.; Xu, M.; Yan, T.; Ye, N.; Hang, Y. Spectroscopic characterisations of Dy:LaF3 crystal. Infrared Phys. Technol. 2017, 87, 65–71. [Google Scholar] [CrossRef]
- Cruz, M.E.; Castro, Y.; Durán, A. Transparent oxyfluoride glass-ceramics obtained by different sol-gel routes. J. Sol-Gel Sci. Technol. 2022, 102, 523–533. [Google Scholar] [CrossRef]
- Pawlik, N.; Szpikowska-Sroka, B.; Pietrasik, E.; Goryczka, T.; Pisarski, W.A. Structural and luminescence properties of silica powders and transparent glass-ceramics containing LaF3:Eu3+ nanocrystals. J. Am. Ceram. Soc. 2018, 101, 4654–4668. [Google Scholar] [CrossRef]
- Sun, X.; Zhang, Y.W.; Du, Y.P.; Yan, Z.G.; Si, R.; You, L.P.; Yan, C.H. From Trifluoroacetate Complex precursors to Monodisperse Rare-Earth Fluoride and Oxyfluoride Nanocrystals with Diverse Shapes through Controlled Fluorination in Solution Phase. Chem. Eur. J. 2007, 13, 2320–2332. [Google Scholar] [CrossRef] [PubMed]
- Pawlik, N.; Szpikowska-Sroka, B.; Goryczka, T.; Pisarska, J.; Pisarski, W.A. Structural and Photoluminescence Investigations of Tb3+/Eu3+ Co-Doped Silicate Sol-Gel Glass-Ceramics Containing CaF2 Nanocrystals. Materials 2021, 14, 754. [Google Scholar] [CrossRef]
- Pawlik, N.; Szpikowska-Sroka, B.; Pietrasik, E.; Goryczka, T.; Pisarski, W.A. Photoluminescence and energy transfer in transparent glass-ceramics based on GdF3:RE3+ (RE = Tb, Eu) nanocrystals. J. Rare Earths 2019, 37, 1137–1144. [Google Scholar] [CrossRef]
- Khan, A.F.; Yadav, R.; Singh, S.; Dutta, V.; Chawla, S. Eu3+ doped silica xerogel luminescent layer having antireflection and spectrum modifying properties suitable for solar cell applications. Mater. Res. Bull. 2010, 45, 1562–1566. [Google Scholar] [CrossRef]
- Pokhrel, M.; Gupta, S.K.; Perez, A.; Modak, B.; Modak, P.; Lewis, L.A.; Mao, Y. Up- and Down-Convertible LaF3:Yb,Er Nanocrystals with a Broad Emission Window from 350 nm to 2.8 μm: Implications for Lighting Applications. Appl. Nano Mater. 2021, 4, 13562–13572. [Google Scholar] [CrossRef]
- Lim, D.J.; Marks, N.A.; Rowles, M.R. Universal Scherrer equation for graphene fragments. Carbon 2020, 162, 475–480. [Google Scholar] [CrossRef]
- Nath, D.; Singh, F.; Das, R. X-ray diffraction analysis by Williamson-Hall, Halder-Wagner and size-strain plot methods of CdSe nanoparticles—A comparative study. Mater. Chem. Phys. 2020, 239, 122021. [Google Scholar] [CrossRef]
- D’Angelo, P.; Zitolo, A.; Migliorati, V.; Chillemi, G.; Duvail, M.; Vitorge, P.; Abadie, S.; Spezia, R. Revised Ionic Radii of Lanthanoid(III) Ions in Aqueous Solution. Inorg. Chem. 2011, 50, 4572–4579. [Google Scholar] [CrossRef] [PubMed]
- Sharma, R.K.; Mudring, A.-V.; Ghosh, P. Recent trends in binary and ternary rare-earth fluoride nanophosphors: How structural and physical properties influence optical behavior. J. Lumin. 2017, 189, 44–63. [Google Scholar] [CrossRef]
- Sharma, R.K.; Ghora, M.; Chouryal, Y.N.; Ganguly, T.; Acharjee, D.; Mondal, D.J.; Konar, S.; Nigam, S.; Ghosh, P. Multifunctional Lanthanide-Doped Binary Fluorides and Graphene Oxide Nanocomposites Via a Task-Specific Ionic Liquids. ACS Omega 2022, 7, 16906–16916. [Google Scholar] [CrossRef]
- Kurian, M.; Kunjachan, C. Investigation of size dependency on lattice strain of nanoceria particles synthesised by wet chemical methods. Int. Nano Lett. 2014, 4, 73–80. [Google Scholar] [CrossRef] [Green Version]
- Prieur, D.; Bonani, W.; Popa, K.; Walter, O.; Kriegsman, K.W.; Engelhard, M.H.; Guo, X.; Eloirdi, R.; Gouder, T.; Beck, A.; et al. Size Dependence of Lattice Parameter and Electronic Structure in CeO2 Nanoparticles. Inorg. Chem. 2020, 59, 5760–5767. [Google Scholar] [CrossRef]
- Andrade, A.B.; Ferreira, N.S.; Valerio, M.E.G. Particle size effects on structural and optical properties of BaF2 nanoparticles. RSC Adv. 2017, 7, 26839–26848. [Google Scholar] [CrossRef] [Green Version]
- Leontyev, I.N.; Kuriganova, A.B.; Leontyev, N.G.; Hennet, L.; Rakhmatullin, A.; Smirnova, N.V.; Dmitriev, V. Size dependence of the lattice parameters of carbon supported platinum nanoparticles: X-ray diffraction analysis and theoretical considerations. RSC Adv. 2014, 4, 35959–35965. [Google Scholar] [CrossRef]
- Shasmal, N.; Karmakar, B. White light-emitting Dy3+-doped transparent chloroborosilicate glass: Synthesis and optical properties. J. Asian Ceram. Soc. 2019, 7, 42–52. [Google Scholar] [CrossRef] [Green Version]
- Kłonkowski, A.M.; Wiczk, W.; Ryl, J.; Szczodrowski, K.; Wileńska, D. A white phosphor based on oxyfluoride nano-glass-ceramics co-doped with Eu3+ and Tb3+: Energy transfer study. J. Alloys Compd. 2017, 724, 649–658. [Google Scholar] [CrossRef]
- Lodi, T.A.; Dantas, N.F.; Gonçalves, T.S.; de Camargo, A.S.S.; Pedrocki, F.; Steimacher, A. Dy3+ doped calcium boroaluminate glasses and Blue Led for smart white light generation. J. Lumin. 2019, 207, 378–385. [Google Scholar] [CrossRef]
- Monisha, M.; Mazumder, N.; Lakshminarayana, G.; Mandal, S.; Kamath, S.D. Energy transfer and luminescence study of Dy3+ doped zinc-aluminoborosilicate glasses for white light emission. Ceram. Int. 2021, 47, 598–610. [Google Scholar] [CrossRef]
- Bajaj, R.; Prasad, A.; Yeswanth, A.V.S.; Rohilla, P.; Kaur, S.; Rao, A.S. Down-shifting photoluminescence studies of thermally stable Dy3+ ions doped borosilicate glasses for optoelectronic device applications. J. Mater. Sci. Mater. Electron. 2022, 33, 4782–4793. [Google Scholar] [CrossRef]
- Babu, P.; Jang, K.H.; Rao, C.S.; Shi, L.; Jayasankar, C.K.; Lavín, V.; Seo, H.J. White light generation in Dy3+-doped oxyfluoride glass and transparent glass-ceramics containing CaF2 nanocrystals. Opt. Express 2011, 19, 1836–1841. [Google Scholar] [CrossRef] [PubMed]
- Walas, M.; Lisowska, M.; Lewandowski, T.; Becerro, A.I.; Łapiński, M.; Synak, A.; Sadowski, W.; Kościelska, B. From structure to luminescence investigation of oxyfluoride transparent glasses and glass-ceramics doped with Eu3+/Dy3+ ions. J. Alloys Compd. 2019, 806, 1410–1418. [Google Scholar] [CrossRef]
- Górny, A.; Kuwik, M.; Pisarski, W.A.; Pisarska, J. Lead Borate Glasses and Glass-Ceramics Singly Doped with Dy3+ for White LEDs. Materials 2020, 13, 5022. [Google Scholar] [CrossRef]
- Deopa, N.; Saini, S.; Kaur, S.; Prasad, A.; Rao, A.S. Spectroscopic investigations on Dy3+ ions doped zinc lead alumino borate glasses for photonic device application. J. Rare Earths 2019, 37, 52–59. [Google Scholar] [CrossRef]
- Thomas, V.; Jose, G.; Jose, G.; Biju, P.R.; Rajagopal, S.; Unnikrishnan, N.V. Structural Evolution and Fluorescence Properties of Dy3+: Silica Matrix. J. Sol-Gel Sci. Technol. 2005, 33, 269–274. [Google Scholar] [CrossRef]
- Sun, X.; Zhao, S.; Fei, Y.; Huang, L.; Xu, S. Structure and optical properties of Dy3+/Tm3+ co-doped oxyfluoride glass ceramics containing β-NaGdF4 nanocrystals. Opt. Mater. 2014, 38, 92–96. [Google Scholar] [CrossRef]
- Nageswara Rao, C.; Vasudeva Rao, P.; Kameswari, R.; Ramesh Raju, R.; Chandana, G.; Samatha, K.; Srinivas Prasad, M.V.V.K.; Venkateswarlu, M.; Naveen, A.; Dhar, G.G. Luminescence investigations on Dy3+ doped CdO-PbF2 phosphate glass-ceramics. J. Mol. Struct. 2021, 1243, 130784. [Google Scholar]
- Lv, H.; Wang, S.; Su, C.; Zhang, H.; Guo, Z.; Wang, L.; Wang, T.; Wei, Y. Preparation and luminescent properties of Dy3+-doped transparent glass-ceramics containing NaGd(WO4)2. J. Mater. Sci. Mater. Electron. 2020, 31, 6636–6644. [Google Scholar] [CrossRef]
- Wei, Y.; Zhang, H.; Su, C.; Wang, T.; Wang, S.; Lv, H.; Zou, X. Luminescence and preparation of Dy2O3 doped SrCO3-WO3-SiO2 glass ceramics. J. Lumin. 2020, 220, 117021. [Google Scholar] [CrossRef]
- Ramachari, D.; Rama Moorthy, L.; Jayasankar, C.K. Energy transfer and photoluminescence properties of Dy3+/Tb3+ co-doped oxyfluorosilicate glass-ceramics for solid-state white lighting. Ceram. Int. 2014, 40, 11115–11121. [Google Scholar] [CrossRef]
- Jia, F.; Xu, S.; Zhang, G.; Zhao, T.; Zou, X.; Zhang, H. Effect of Mg2+/Sr2+ addition on luminescence properties of Dy3+ doped glass ceramics contining Ca2Ti2O6. Opt. Mater. 2022, 131, 112715. [Google Scholar] [CrossRef]
- Maruyama, N.; Honma, T.; Komatsu, T. Enhanced quantum yield of yellow photoluminescence of Dy3+ ions in nonlinear optical Ba2TiSi2O8 nanocrystals formed in glass. J. Solid State. Chem. 2009, 182, 246–252. [Google Scholar] [CrossRef]


| Sample | Thermal Degradation | ||||
|---|---|---|---|---|---|
| 1st Step | 2nd Step | ||||
| Temperature Range (°C) | Maximum of DTG Peak (°C) | Temperature Range (°C) | Maximum of DTG Peak (°C) | DSC Peak Position (°C) | |
| XG1 | 55–223 | 129 | 223–383 | 307 | 307 |
| XG2 | 56–222 | 134 | 222–382 | 303 | 302 |
| XG3 | 50–224 | 135 | 224–382 | 307 | 307 |
| XG4 | 57–226 | 157 | 226–378 | 291 | 298 |
| XG5 | 51–217 | 132 | 217–386 | 307 | 307 |
| XG6 | 45–201 | 111 | 201–375 | 307 | 309 |
| Sample | Lattice Parameter [Å] | Crystallite Size [nm] | Lattice Strain [%] | ||
|---|---|---|---|---|---|
| LaF3 (*) | Sol-Gel Sample | Scherrer | Williamson–Hall | ||
| GC1 | a0 = 7.184 c0 = 7.351 | a0 = 7.181(8) c0 = 7.359(4) | 21.3 ± 0.5 | 10.6 ± 0.1 | 0.24 ± 0.01 |
| GC2 | a0 = 7.172(4) c0 = 7.351(9) | 15.3 ± 0.3 | 8.2 ± 0.1 | 0.27 ± 0.01 | |
| GC3 | a0 = 7.161(0) c0 = 7.343(3) | 12.7 ± 0.1 | 9.0 ± 0.1 | 0.16 ± 0.01 | |
| GC4 | a0 = 7.147(7) c0 = 7.321(9) | 12.3 ± 0.1 | 9.0 ± 0.1 | 0.14 ± 0.01 | |
| GC5 | a0 = 7.139(6) c0 = 7.311(5) | 12.6 ± 0.1 | 9.8 ± 0.1 | 0.11 ± 0.01 | |
| GC6 | a0 = 7.077(2) c0 = 7.242(9) | 11.9 ± 0.1 | 9.0 ± 0.1 | 0.13 ± 0.01 | |
| Amorphous Material | Y/B-Ratio | Reference |
|---|---|---|
| 35.7SiO2-25.5B2O3-17BaO-3.4K2O-3.4Al2O3-15BaCl2 (mol%):0.1–1wt% Dy2O3 2 | 2.88–2.98 | [59] |
| XG2-XG6 1 | 2.83 | [this work] |
| 2.37 | [this work] | |
| 2.27 | [this work] | |
| 2.34 | [this work] | |
| 2.31 | [this work] | |
| 50B2O3-(25 − x)CaO-15Al2O3-10CaF2-xDy2O3 (x = 0.5–5) wt% 2 | 1.94–2.18 | [61] |
| 20SiO2-(40 − x)B2O3-10Al2O3-20NaF-10ZnO-xDy2O3 (x = 0.1–2.5) mol% 2 | 1.66–1.77 | [62] |
| 35B2O3-20SiO2-(15 − x)Al2O3-15ZnO-15Na2CO3-xDy2O3 (x = 0.1–2.5) mol% 2 | 1.61–1.75 | [63] |
| 45SiO2-20Al2O3-10CaO-24.9CaF2-0.1Dy2O3 mol% 2 | 1.52 | [64] |
| 73TeO2-4BaO-3Bi2O3-18SrF2-2Dy2O3 mol% 2 | 1.50 | [65] |
| Ba2O3-PbO-Al2O3-WO3-Dy2O3 wt.% 2 (B2O3:PbO molar ratio changed from 2:1 to 1:8) | 1.04–1.22 | [66] |
| (20 − x)Na2O-5BaF2-5CaF2-60B2O3-10TeO2-xDy2O3 (x = 0.5–2.5) mol% 2 | 0.86–1.11 | [12] |
| 15ZnO-5PbO-(20 − x)Al2O3-60B2O3-xDy2O3 (x = 0.1–2.0) mol% 2 | 0.68–0.78 | [67] |
| TEOS-based xerogels 1 | 0.51–0.76 | [68] |
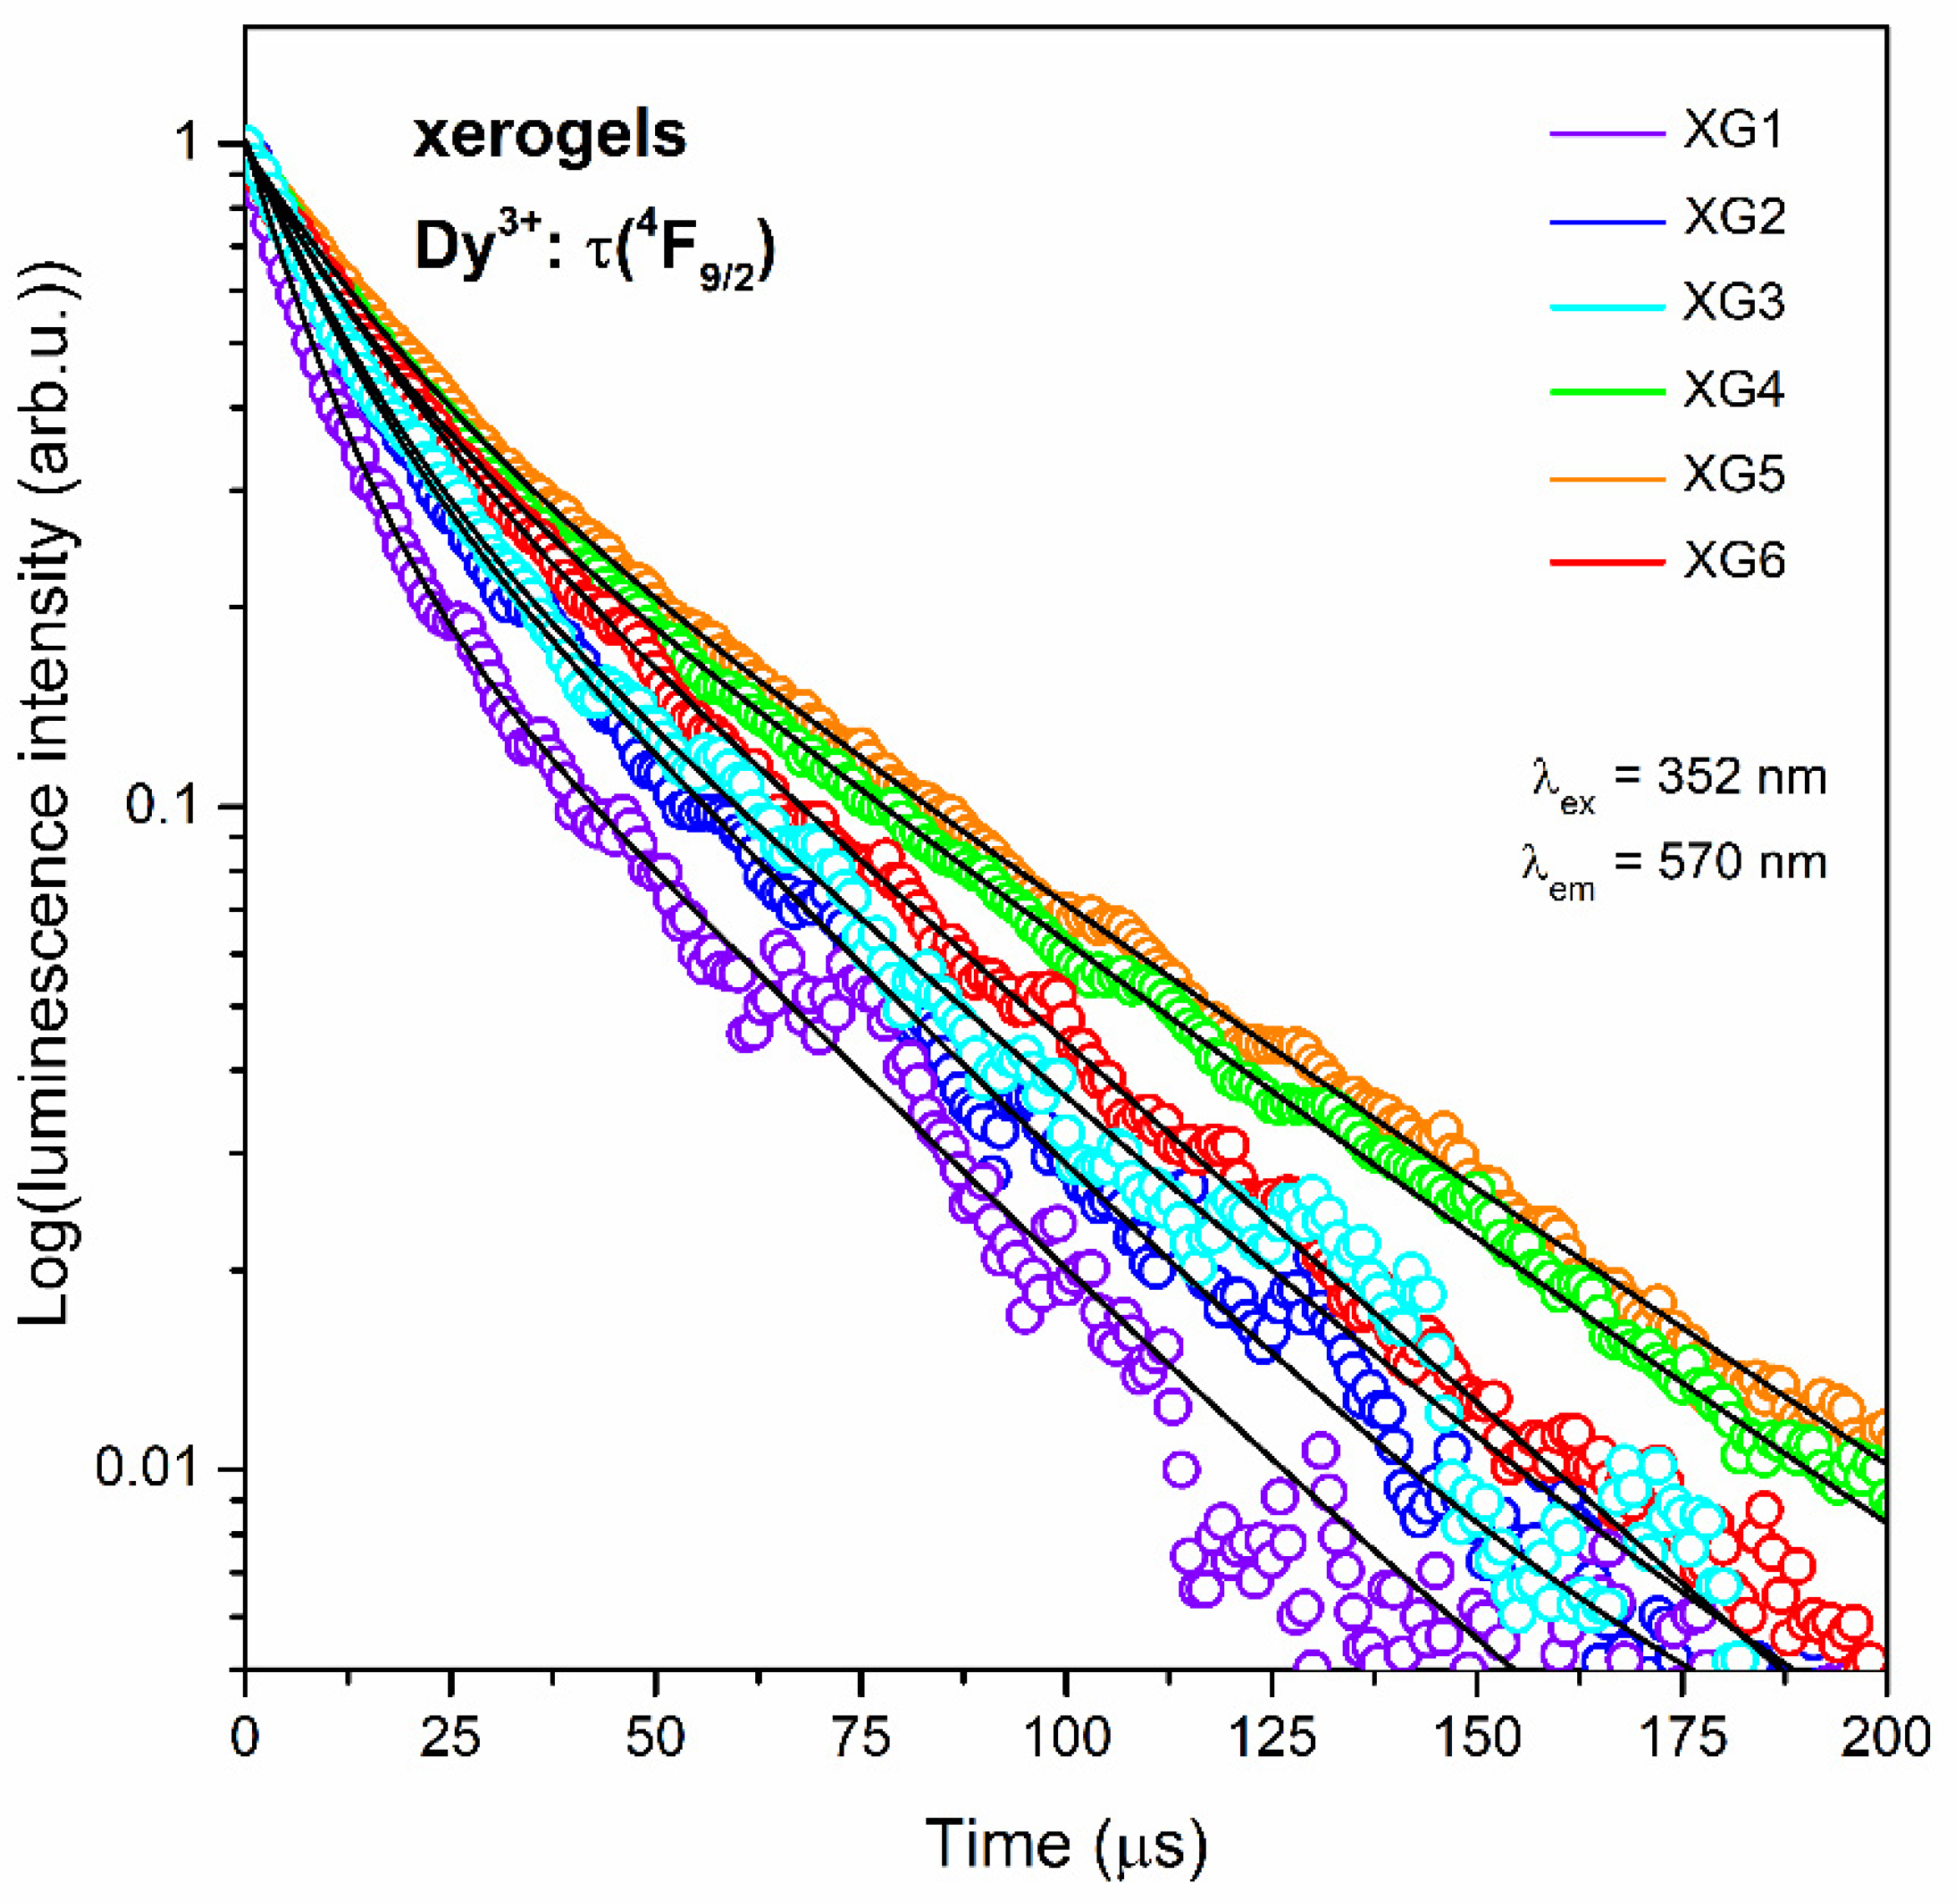
| Sample | Decay Components (μs) | Residual Weighting Factors (%) | Average Decay Time, τavg (μs) | ||
|---|---|---|---|---|---|
| τ1 | τ2 | A1 | A2 | ||
| XG1 | 8.0 ± 0.1 | 35.8 ± 0.8 | 68.76 | 31.24 | 26.6 ± 0.7 |
| XG2 | 9.4 ± 0.2 | 34.3 ± 0.6 | 50.76 | 49.76 | 28.9 ± 0.5 |
| XG3 | 10.8 ± 0.3 | 39.8 ± 0.9 | 56.79 | 43.21 | 32.2 ± 0.8 |
| XG4 | 12.7 ± 0.1 | 47.8 ± 0.3 | 49.16 | 50.84 | 40.6 ± 0.3 |
| XG5 | 15.0 ± 0.2 | 50.4 ± 0.3 | 48.28 | 51.72 | 42.7 ± 0.3 |
| XG6 | 13.0 ± 0.1 | 40.3 ± 0.1 | 46.52 | 53.48 | 34.3 ± 0.1 |
| Type of Crystal Phase | Y/B-Ratio | Reference |
|---|---|---|
| LaF3 1 (350 °C) | 2.74 | [this work] |
| 2.53 | ||
| 2.34 | ||
| 2.20 | ||
| 2.06 | ||
| 1.94 | ||
| CaF2 2 (650 °C, 700 °C) | 1.58 1.68 | [64] |
| β-NaGdF4 2 (700 °C) | 1.51 | [69] |
| PbF2 2 (380 °C/2 h) | 1.18 | [70] |
| PbF2 2 (380 °C/5 h) | 1.05 | |
| PbF2 2 (380 °C/10 h) | 1.22 | |
| NaGd(WO4)2 2 (450 °C) | 1.0–1.1 | [71] |
| SrWO4 2 | 0.787–0.881 | [72] |
| Gd2(WO4)3 1,* | 0.23–1.37 | [25] |
| La2(WO4)3 1,* | 0.26–1.21 | [25] |
| Sample | Decay Components (μs) | Residual Weighting Factors (%) | Average Decay Time, τavg (μs) | ||
|---|---|---|---|---|---|
| τ1 | τ2 | A1 | A2 | ||
| GC1 | 302.7 ± 2.1 | 1920.6 ± 6.8 | 45.64 | 54.36 | 1731.5 ± 5.7 |
| GC2 | 223.3 ± 0.8 | 1317.8 ± 3.0 | 55.92 | 44.07 | 1124.1 ± 2.5 |
| GC3 | 143.1 ± 0.6 | 782.5 ± 3.4 | 66.51 | 33.49 | 612.2 ± 3.0 |
| GC4 | 64.2 ± 0.5 | 305.1 ± 2.6 | 67.44 | 32.56 | 232.0 ± 2.3 |
| GC5 | 51.4 ± 0.4 | 197.6 ± 1.8 | 69.12 | 30.88 | 143.8 ± 1.5 |
| GC6 | 42.9 ± 0.1 | 180.2 ± 0.5 | 76.76 | 23.24 | 119.8 ± 0.4 |
Publisher’s Note: MDPI stays neutral with regard to jurisdictional claims in published maps and institutional affiliations. |
© 2022 by the authors. Licensee MDPI, Basel, Switzerland. This article is an open access article distributed under the terms and conditions of the Creative Commons Attribution (CC BY) license (https://creativecommons.org/licenses/by/4.0/).
Share and Cite
Pawlik, N.; Goryczka, T.; Pietrasik, E.; Śmiarowska, J.; Pisarski, W.A. Photoluminescence Investigations of Dy3+-Doped Silicate Xerogels and SiO2-LaF3 Nano-Glass-Ceramic Materials. Nanomaterials 2022, 12, 4500. https://doi.org/10.3390/nano12244500
Pawlik N, Goryczka T, Pietrasik E, Śmiarowska J, Pisarski WA. Photoluminescence Investigations of Dy3+-Doped Silicate Xerogels and SiO2-LaF3 Nano-Glass-Ceramic Materials. Nanomaterials. 2022; 12(24):4500. https://doi.org/10.3390/nano12244500
Chicago/Turabian StylePawlik, Natalia, Tomasz Goryczka, Ewa Pietrasik, Joanna Śmiarowska, and Wojciech A. Pisarski. 2022. "Photoluminescence Investigations of Dy3+-Doped Silicate Xerogels and SiO2-LaF3 Nano-Glass-Ceramic Materials" Nanomaterials 12, no. 24: 4500. https://doi.org/10.3390/nano12244500