
Insights into the Stability of Graphene Oxide Aqueous Dispersions

 , , , and
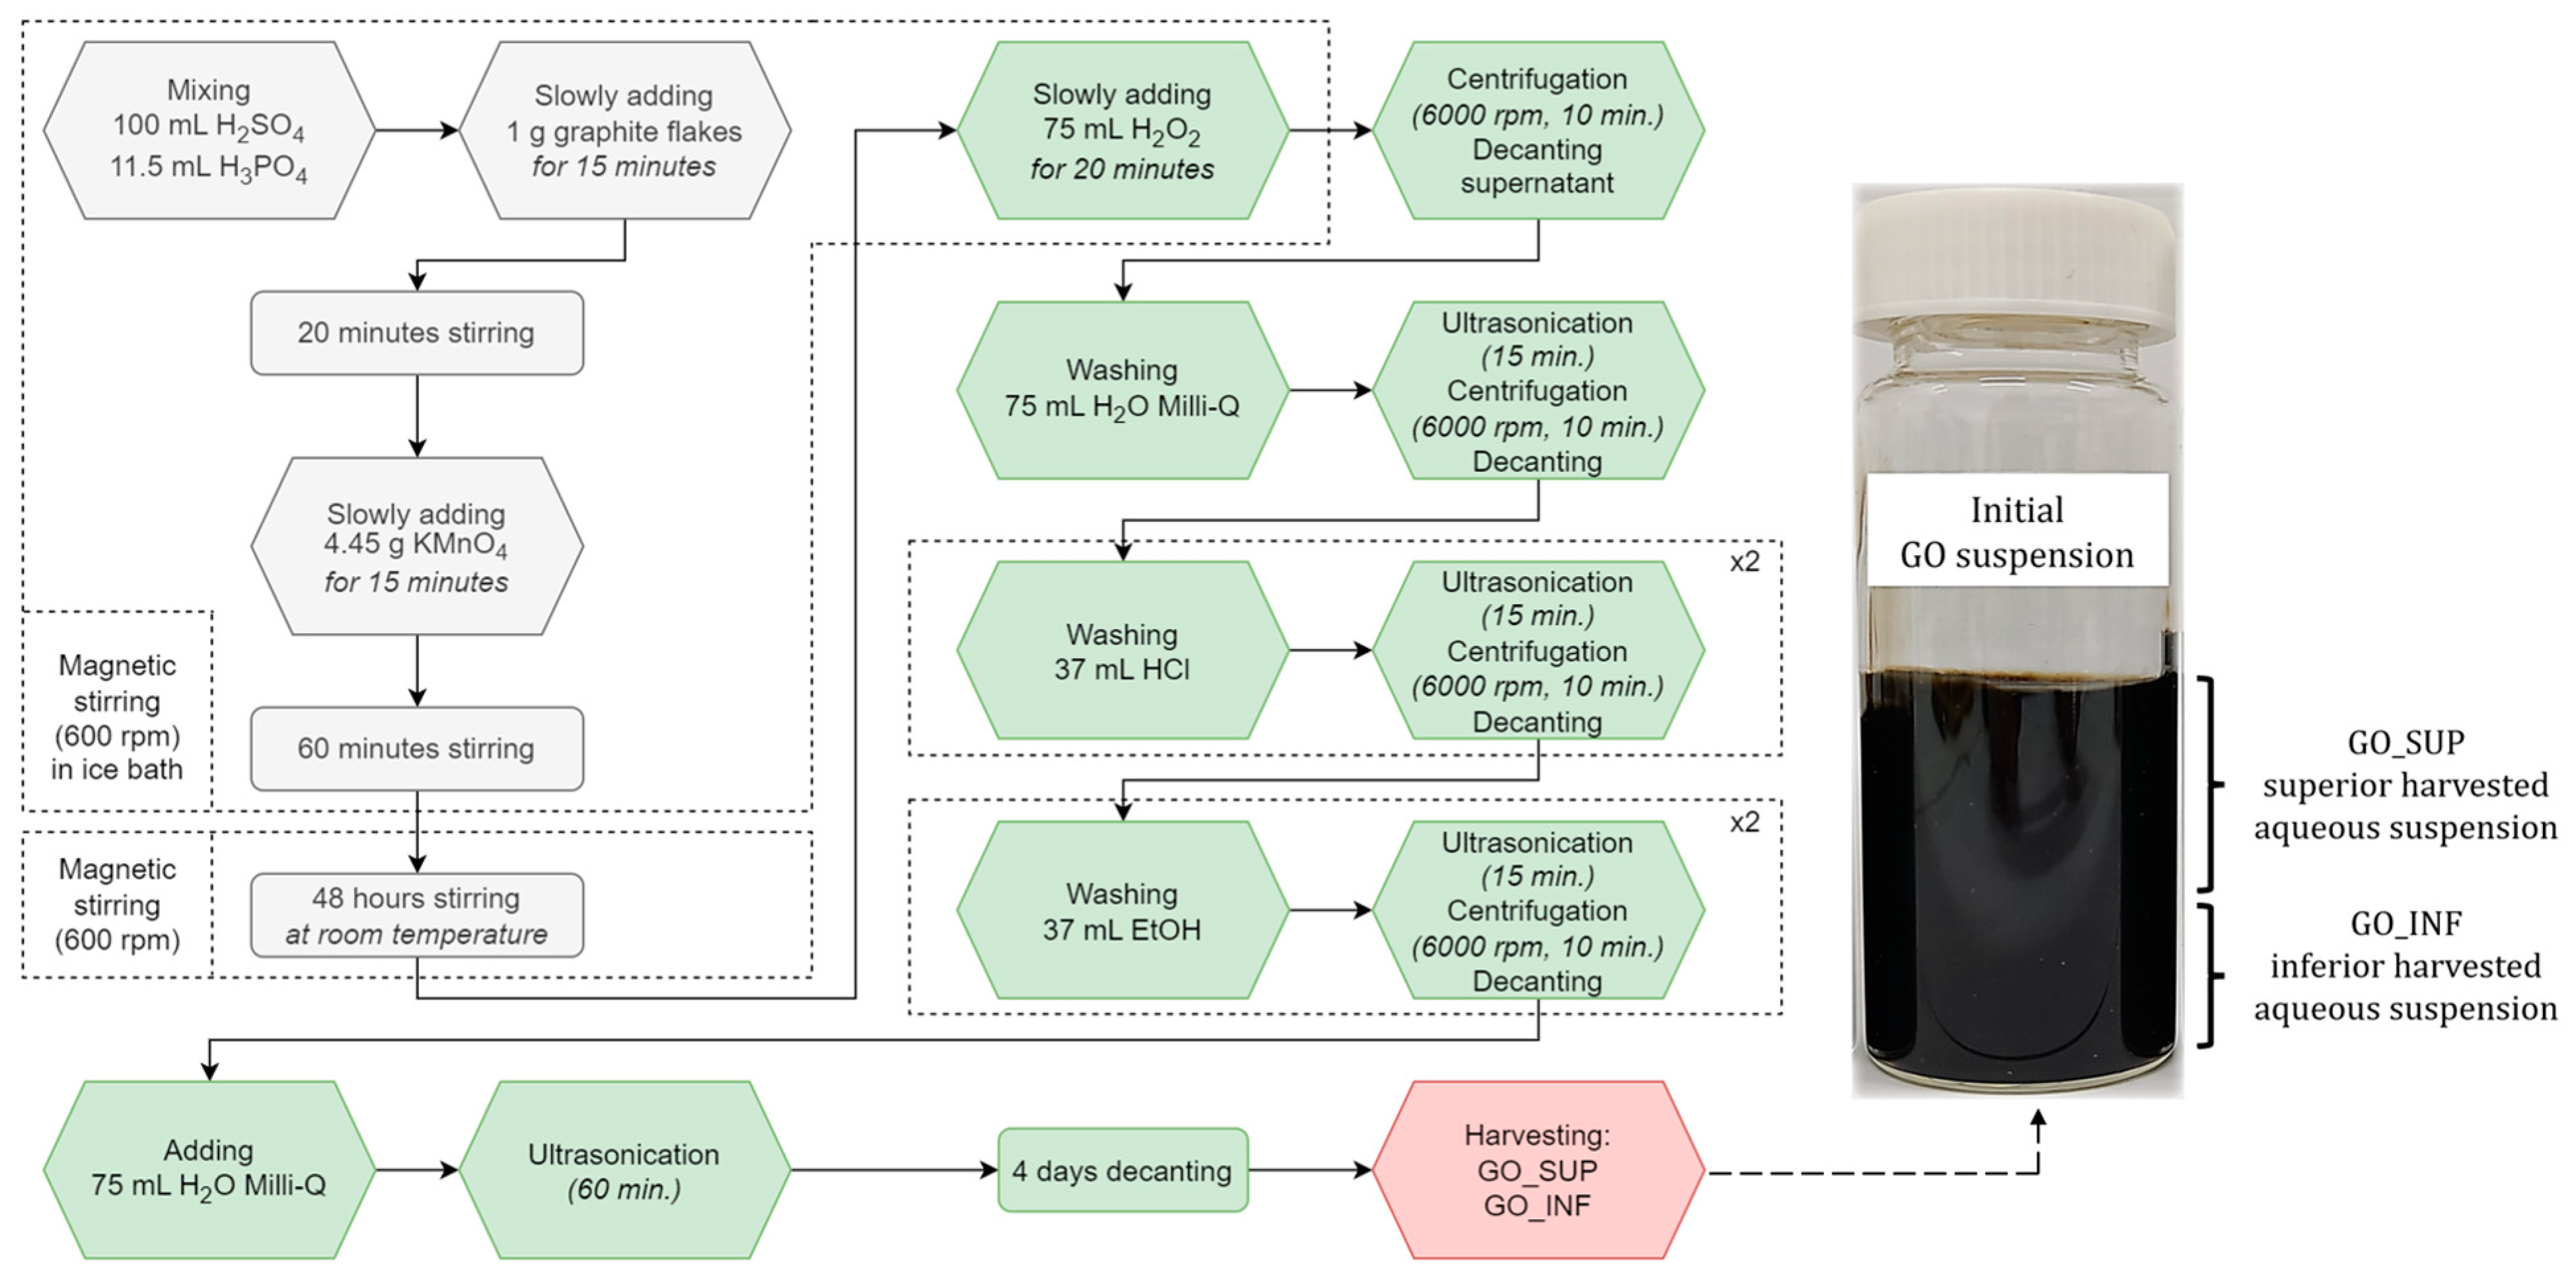
Abstract
:1. Introduction
2. Materials and Methods
2.1. GO Synthesis through a Sono-Chemical Exfoliation Method
2.2. Characterization Techniques
3. Results
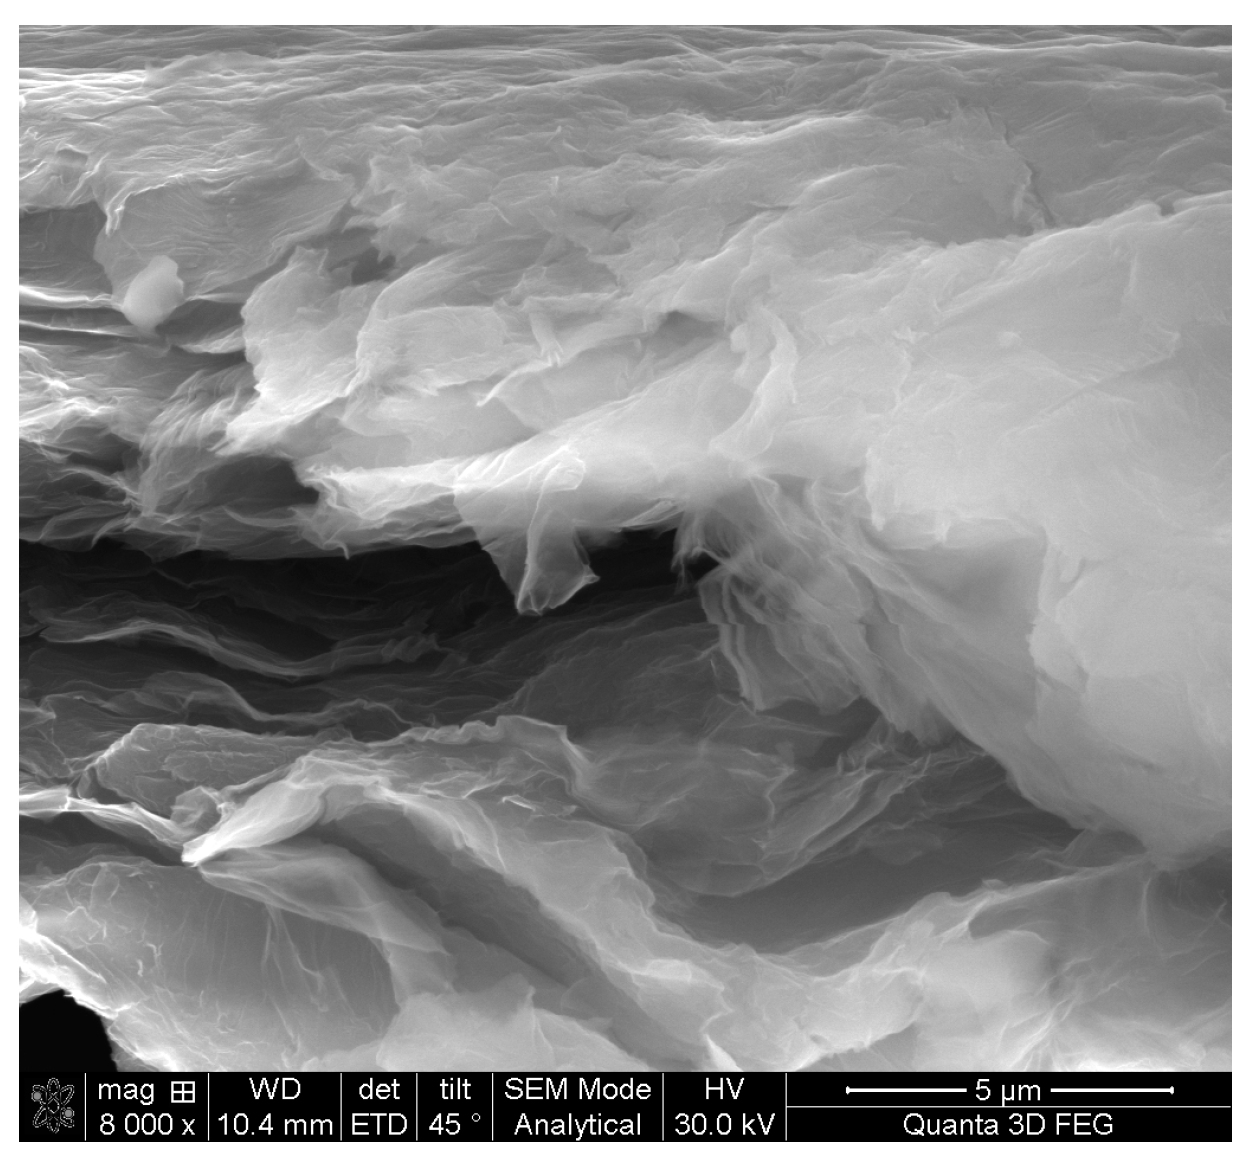
3.1. Scanning Electron Microscopy (SEM)
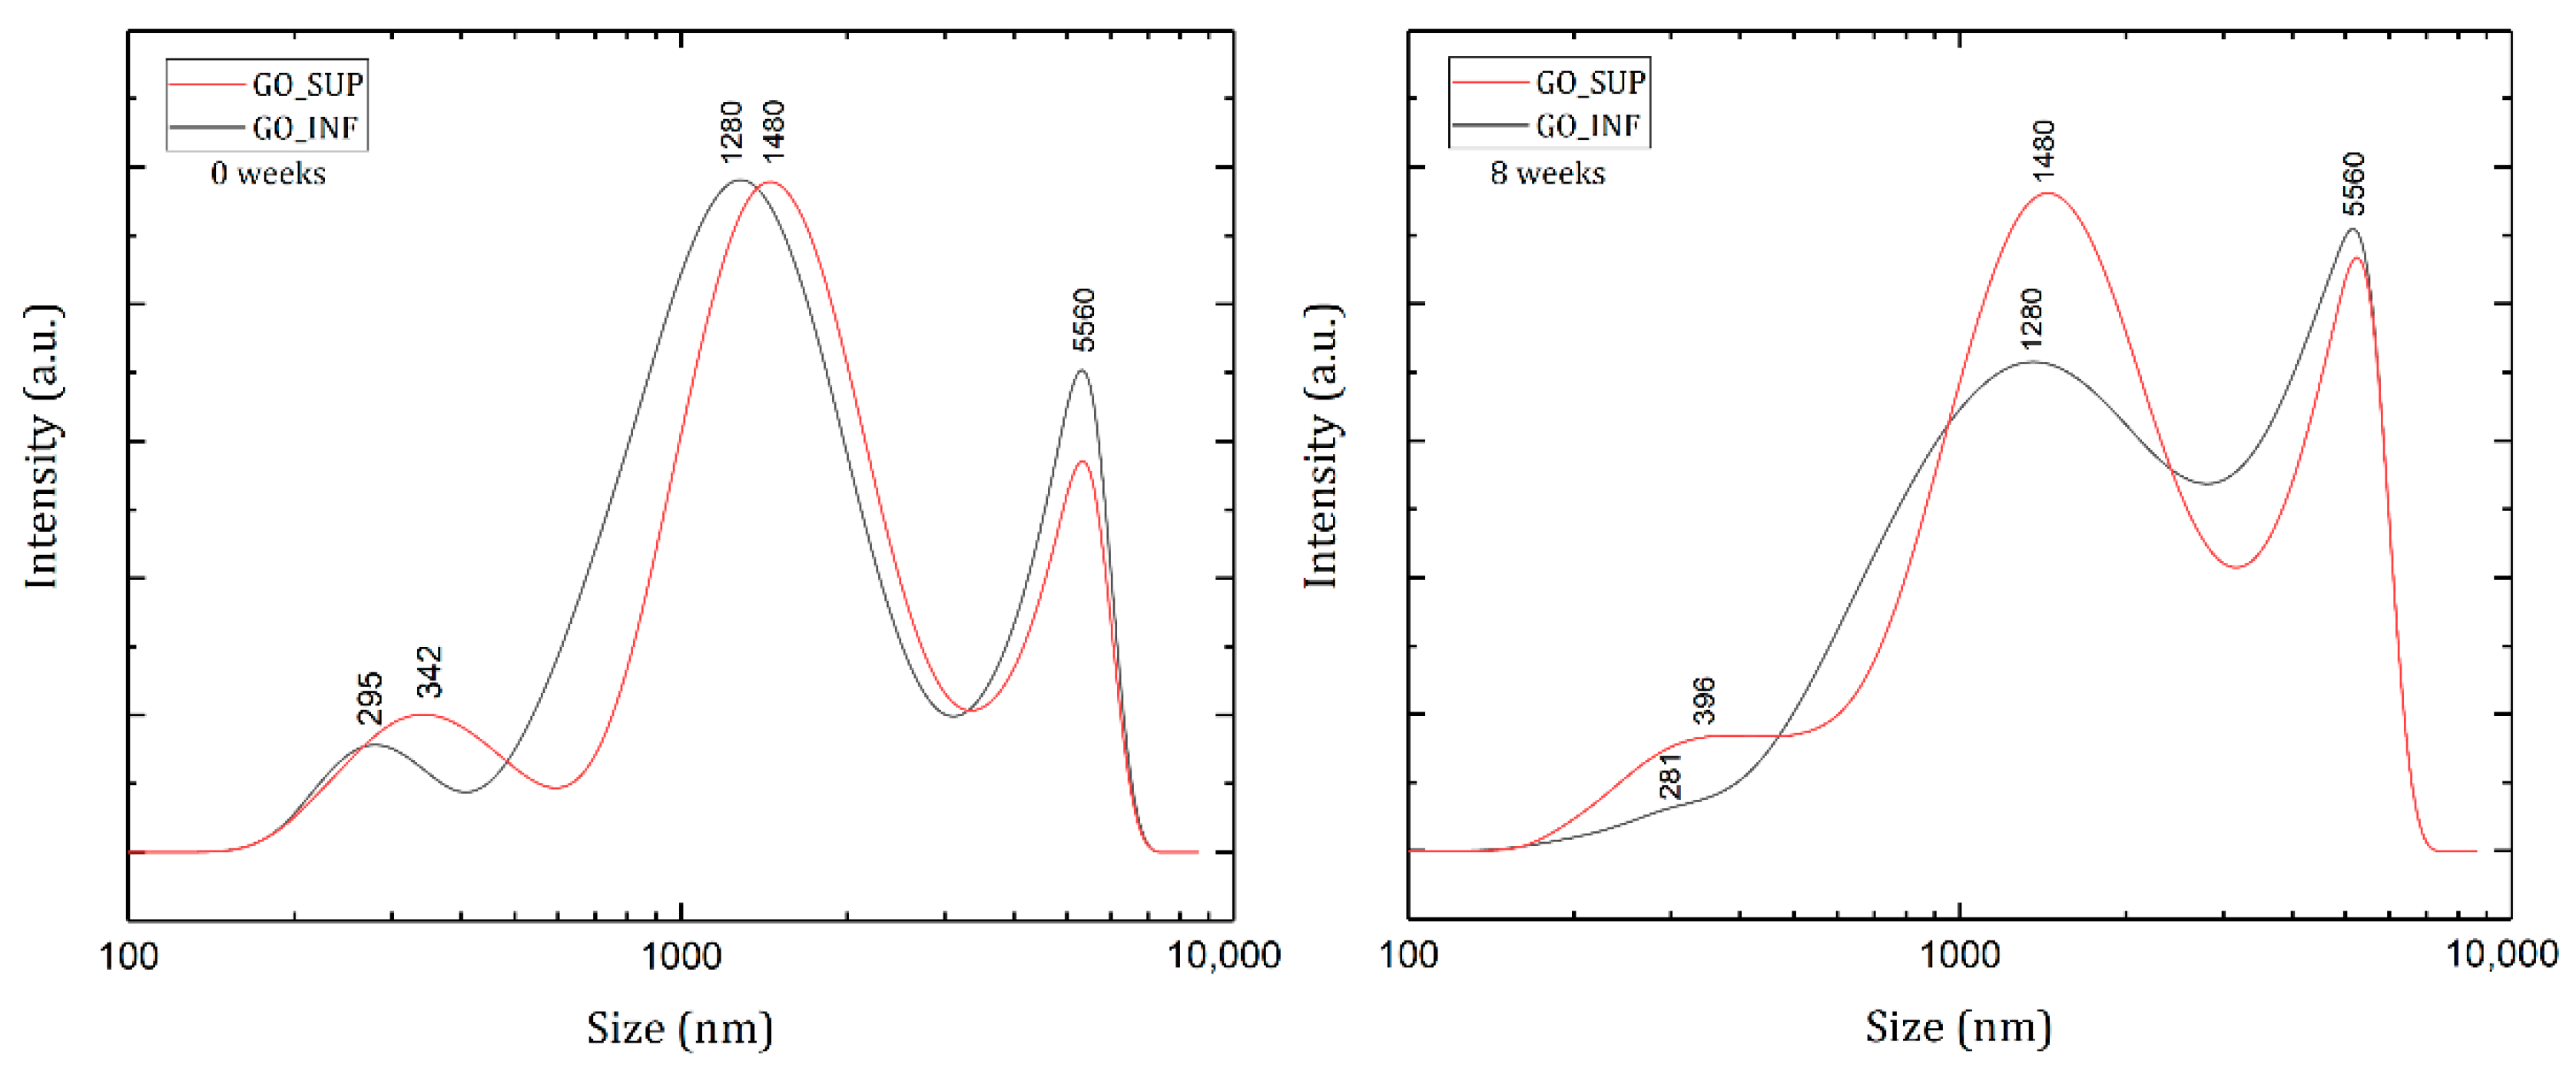
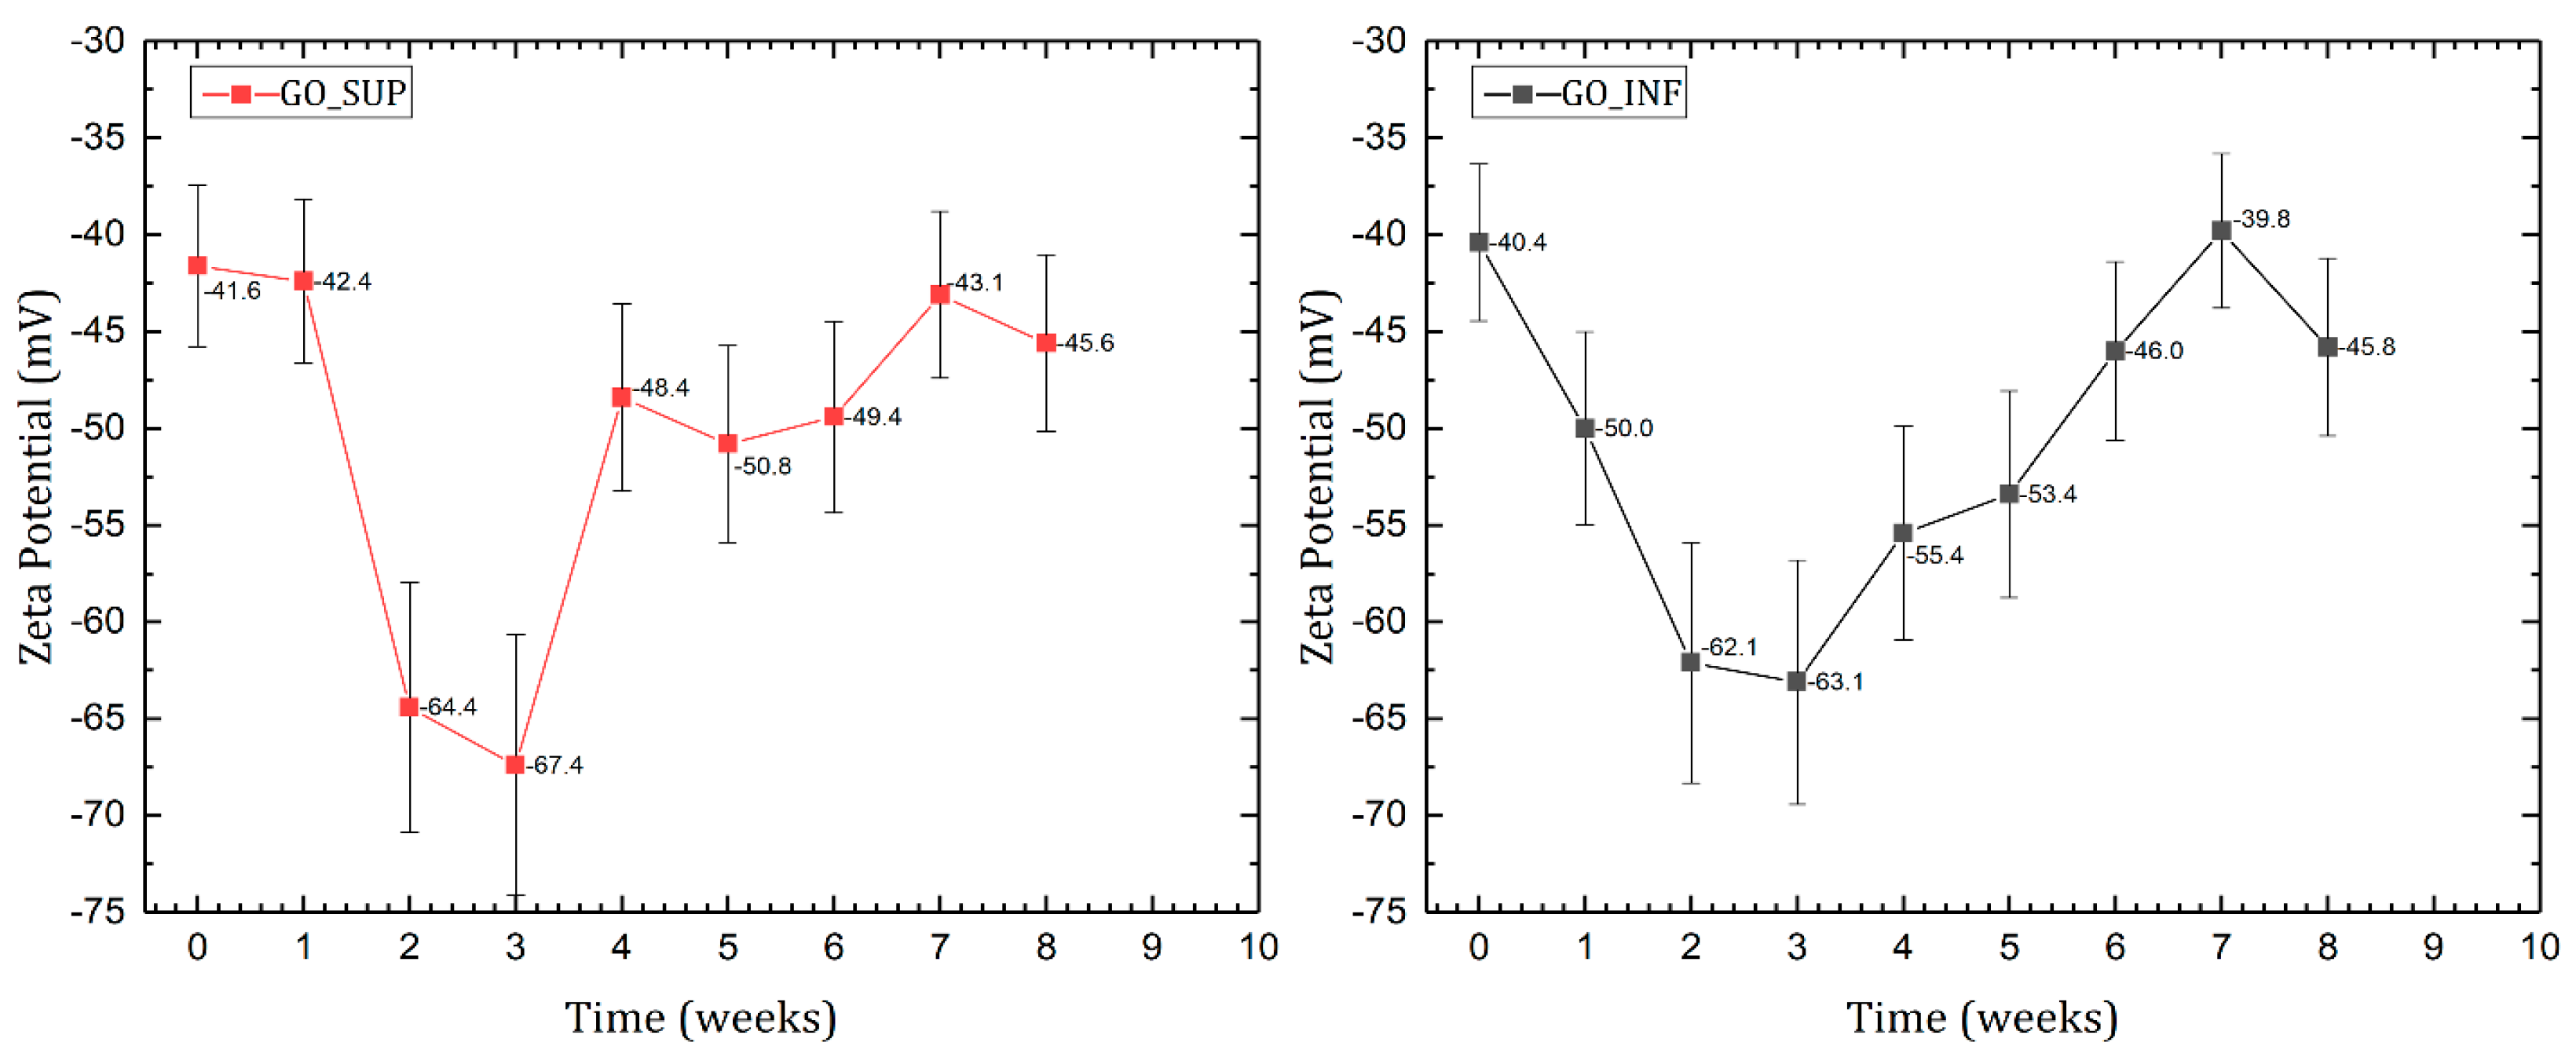
3.2. Dynamic Light Scattering (DLS) and Zeta Potential (ζ-Potential)
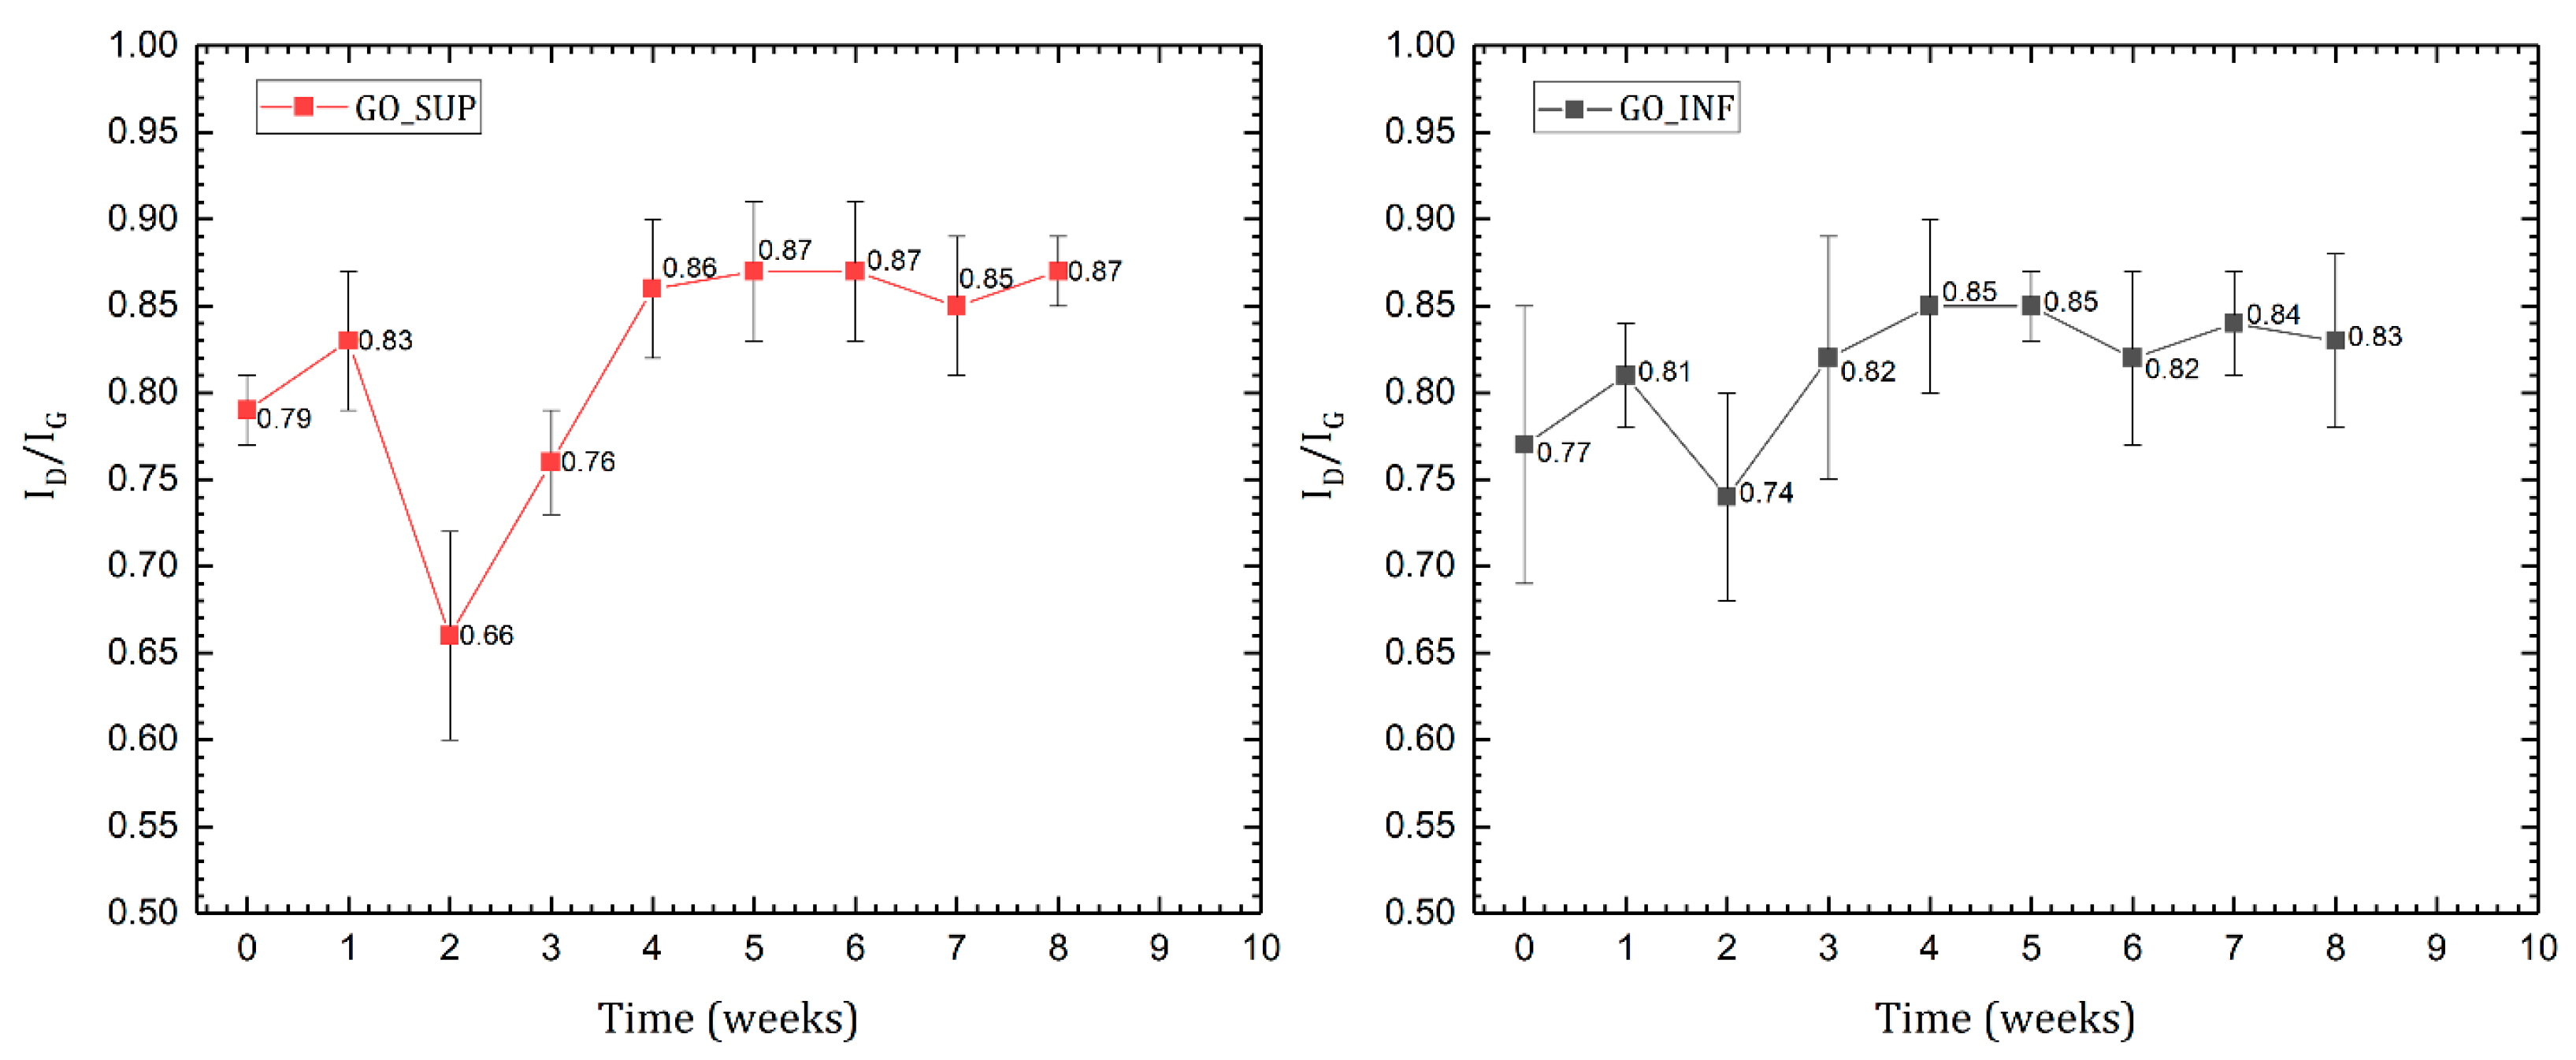
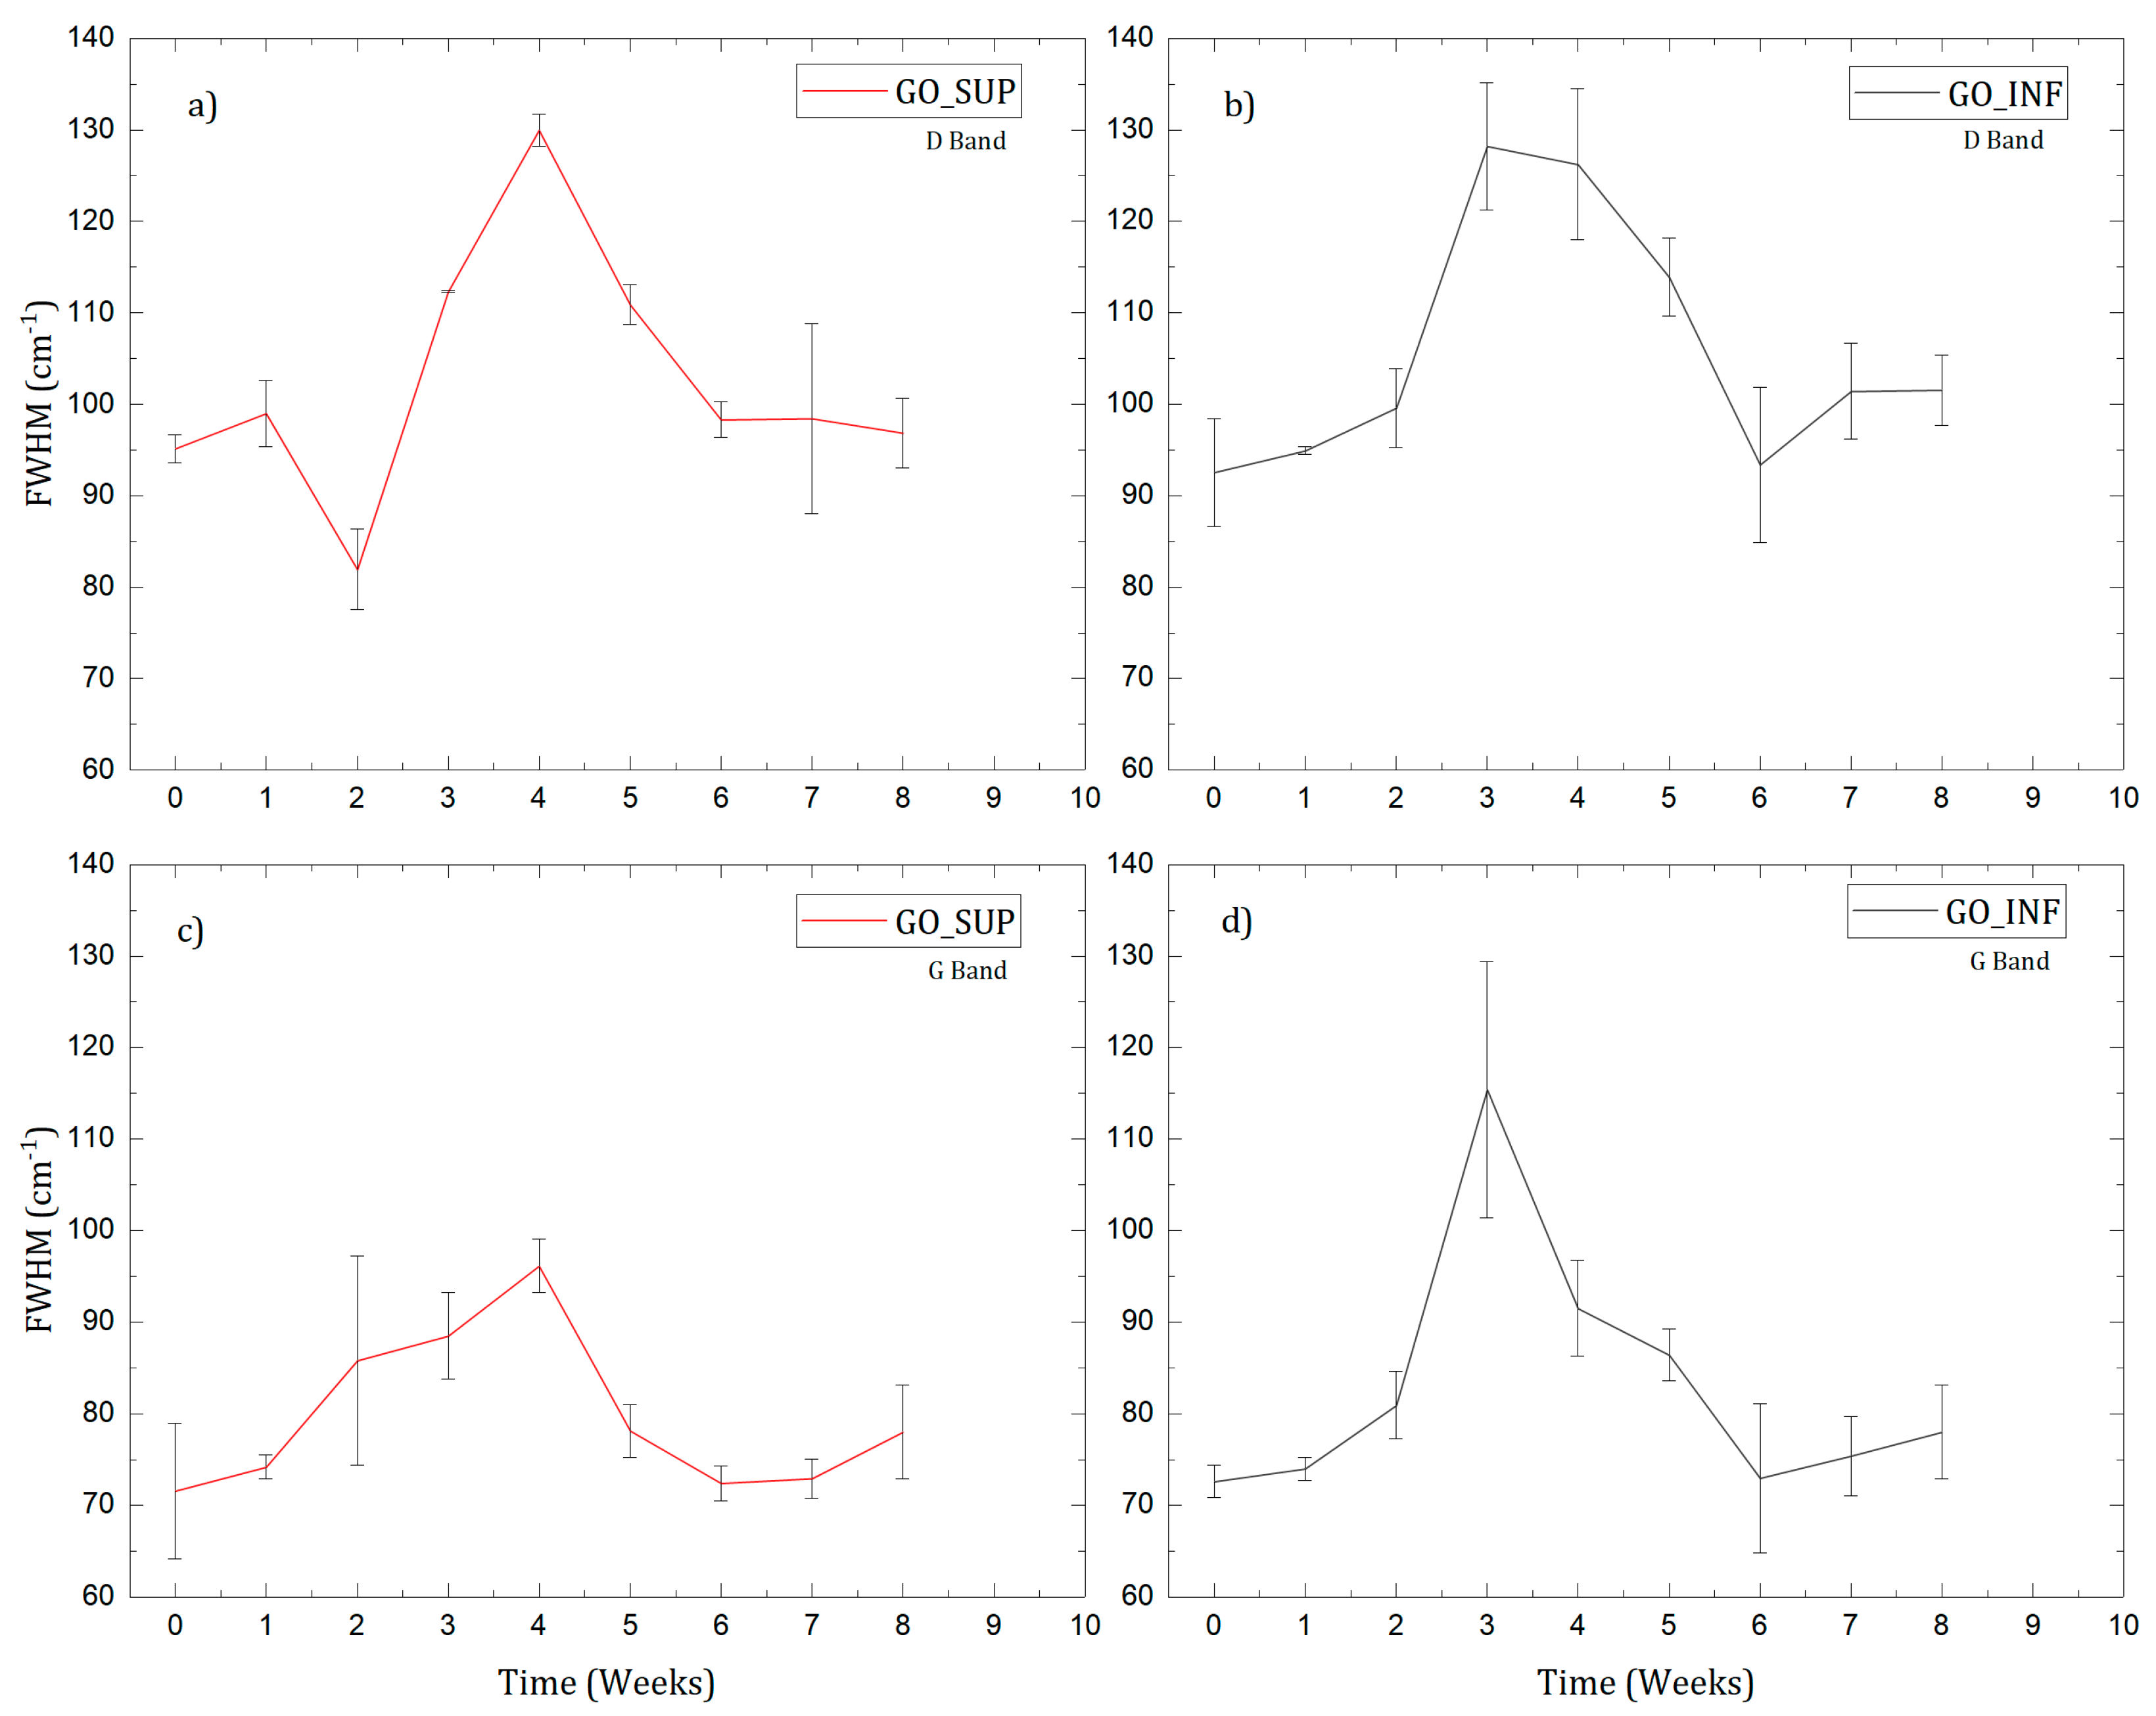
3.3. Raman Spectroscopy
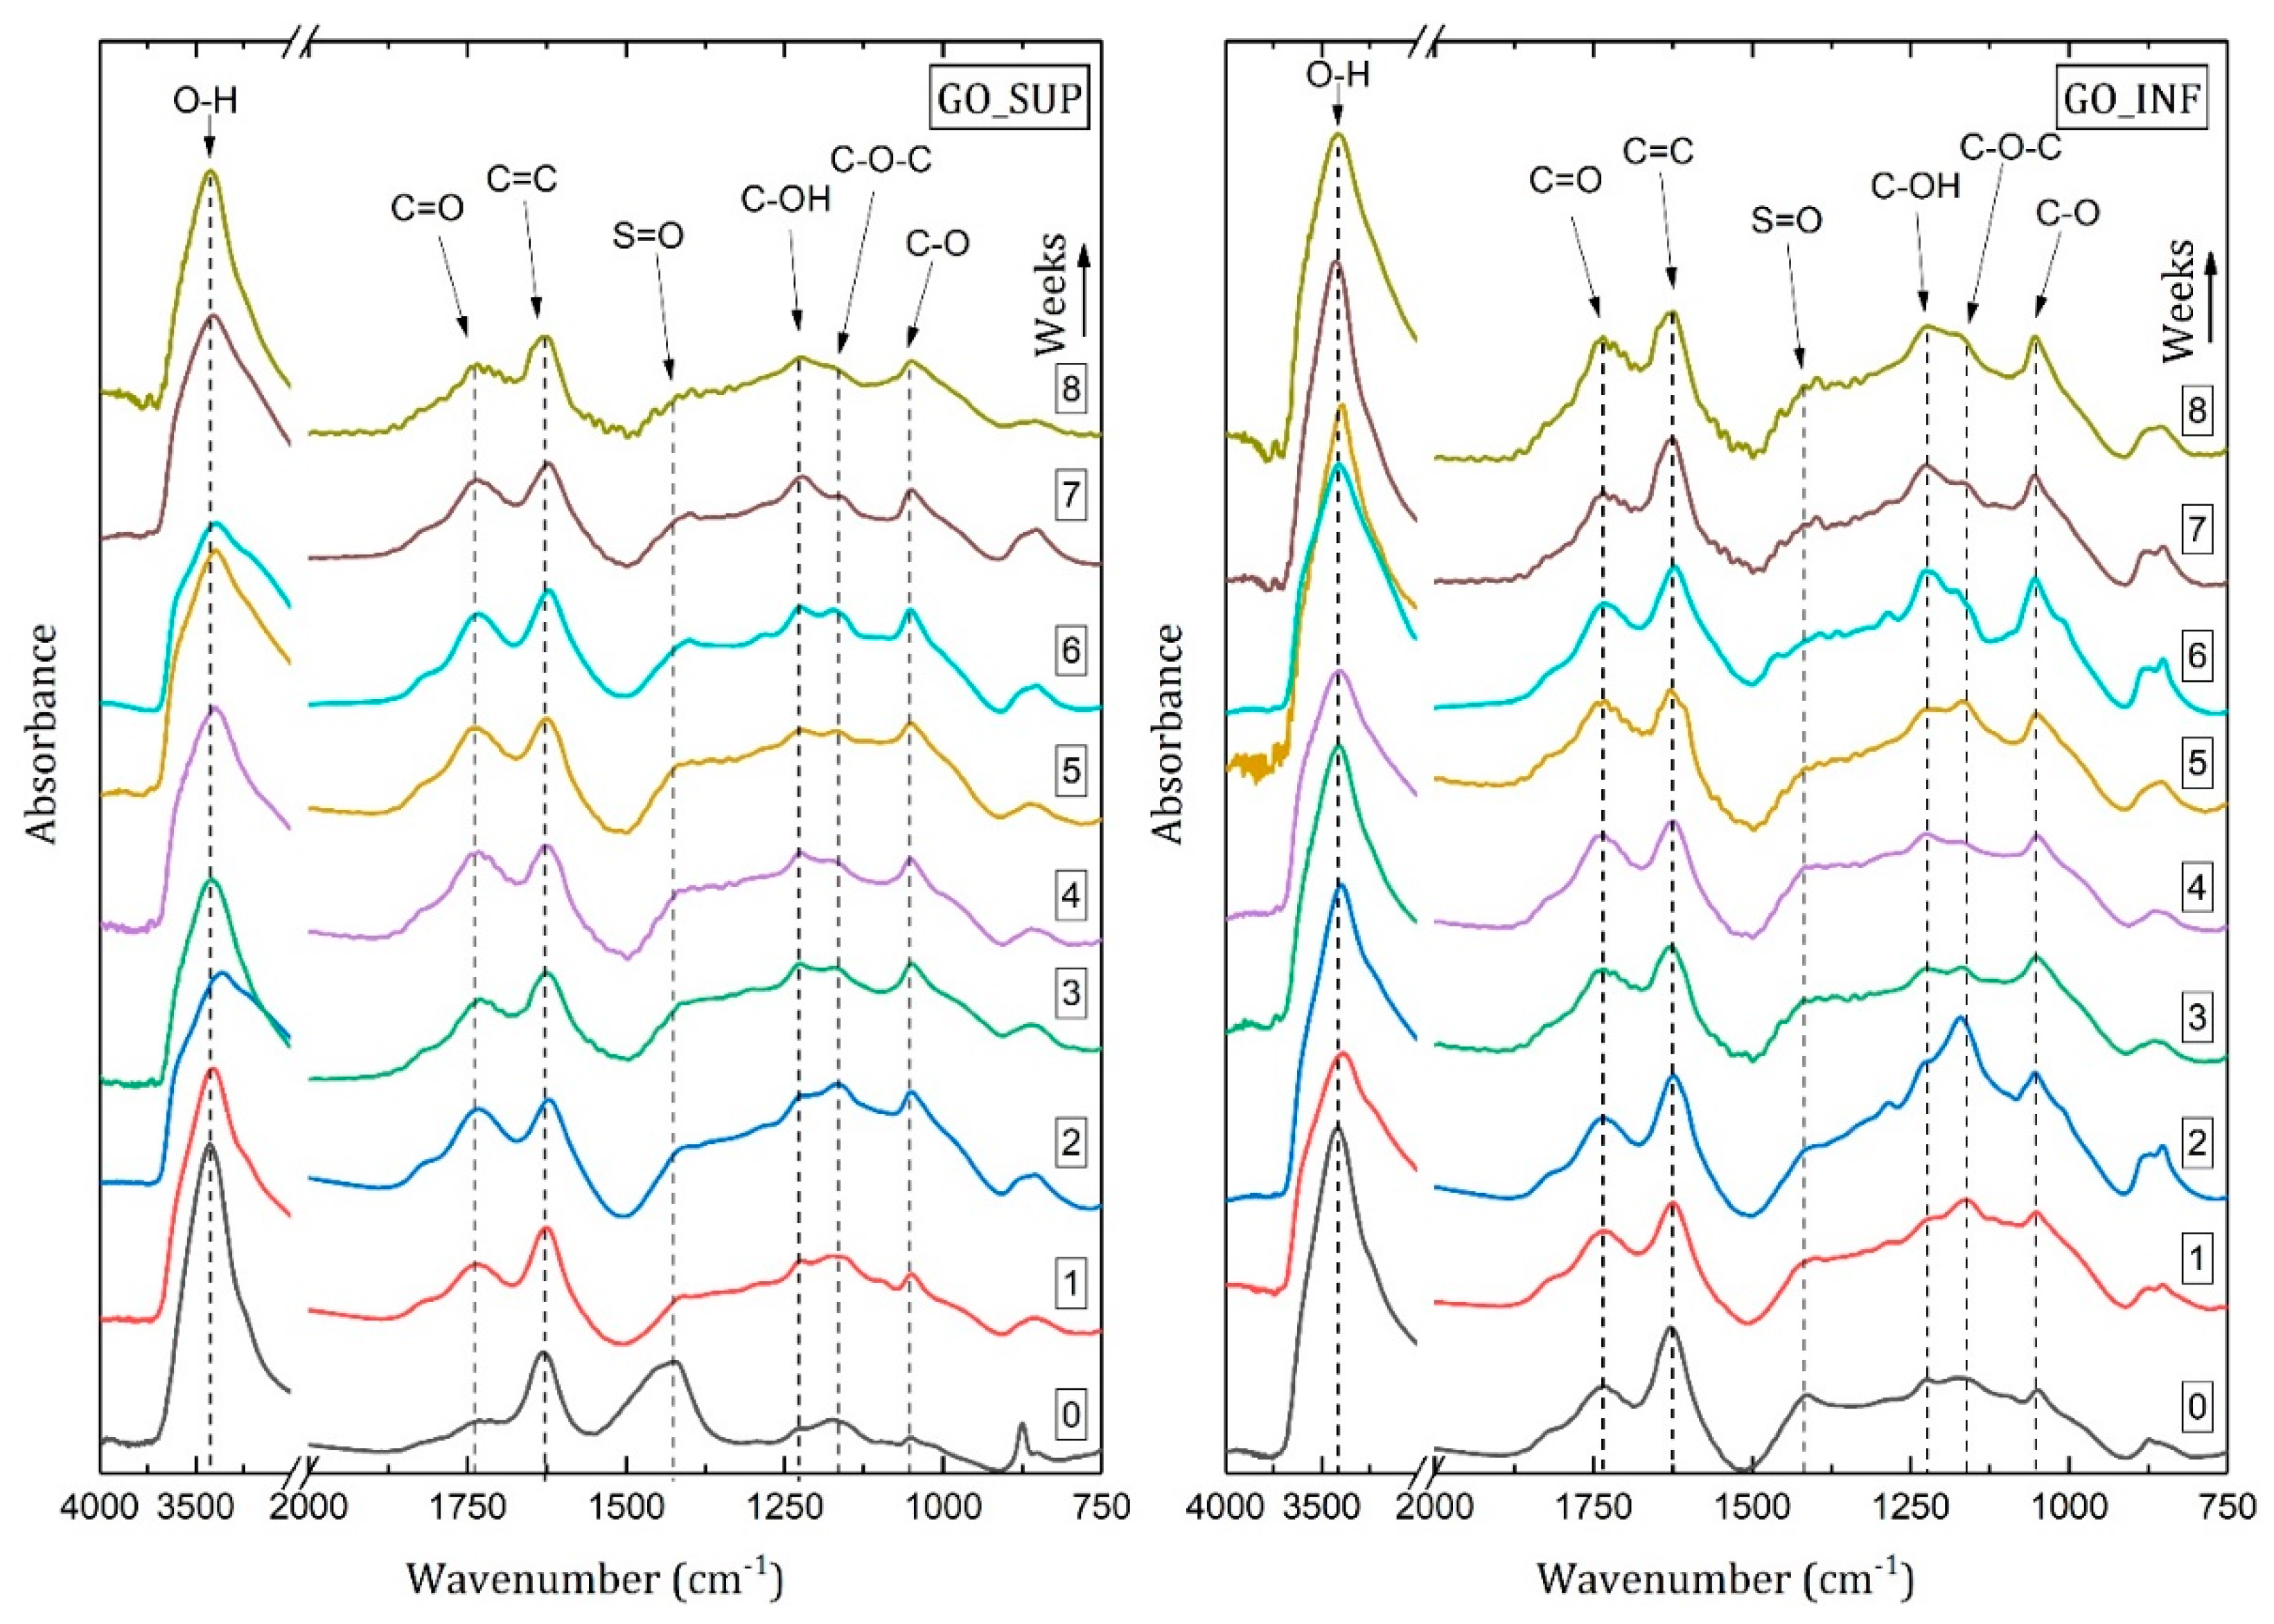
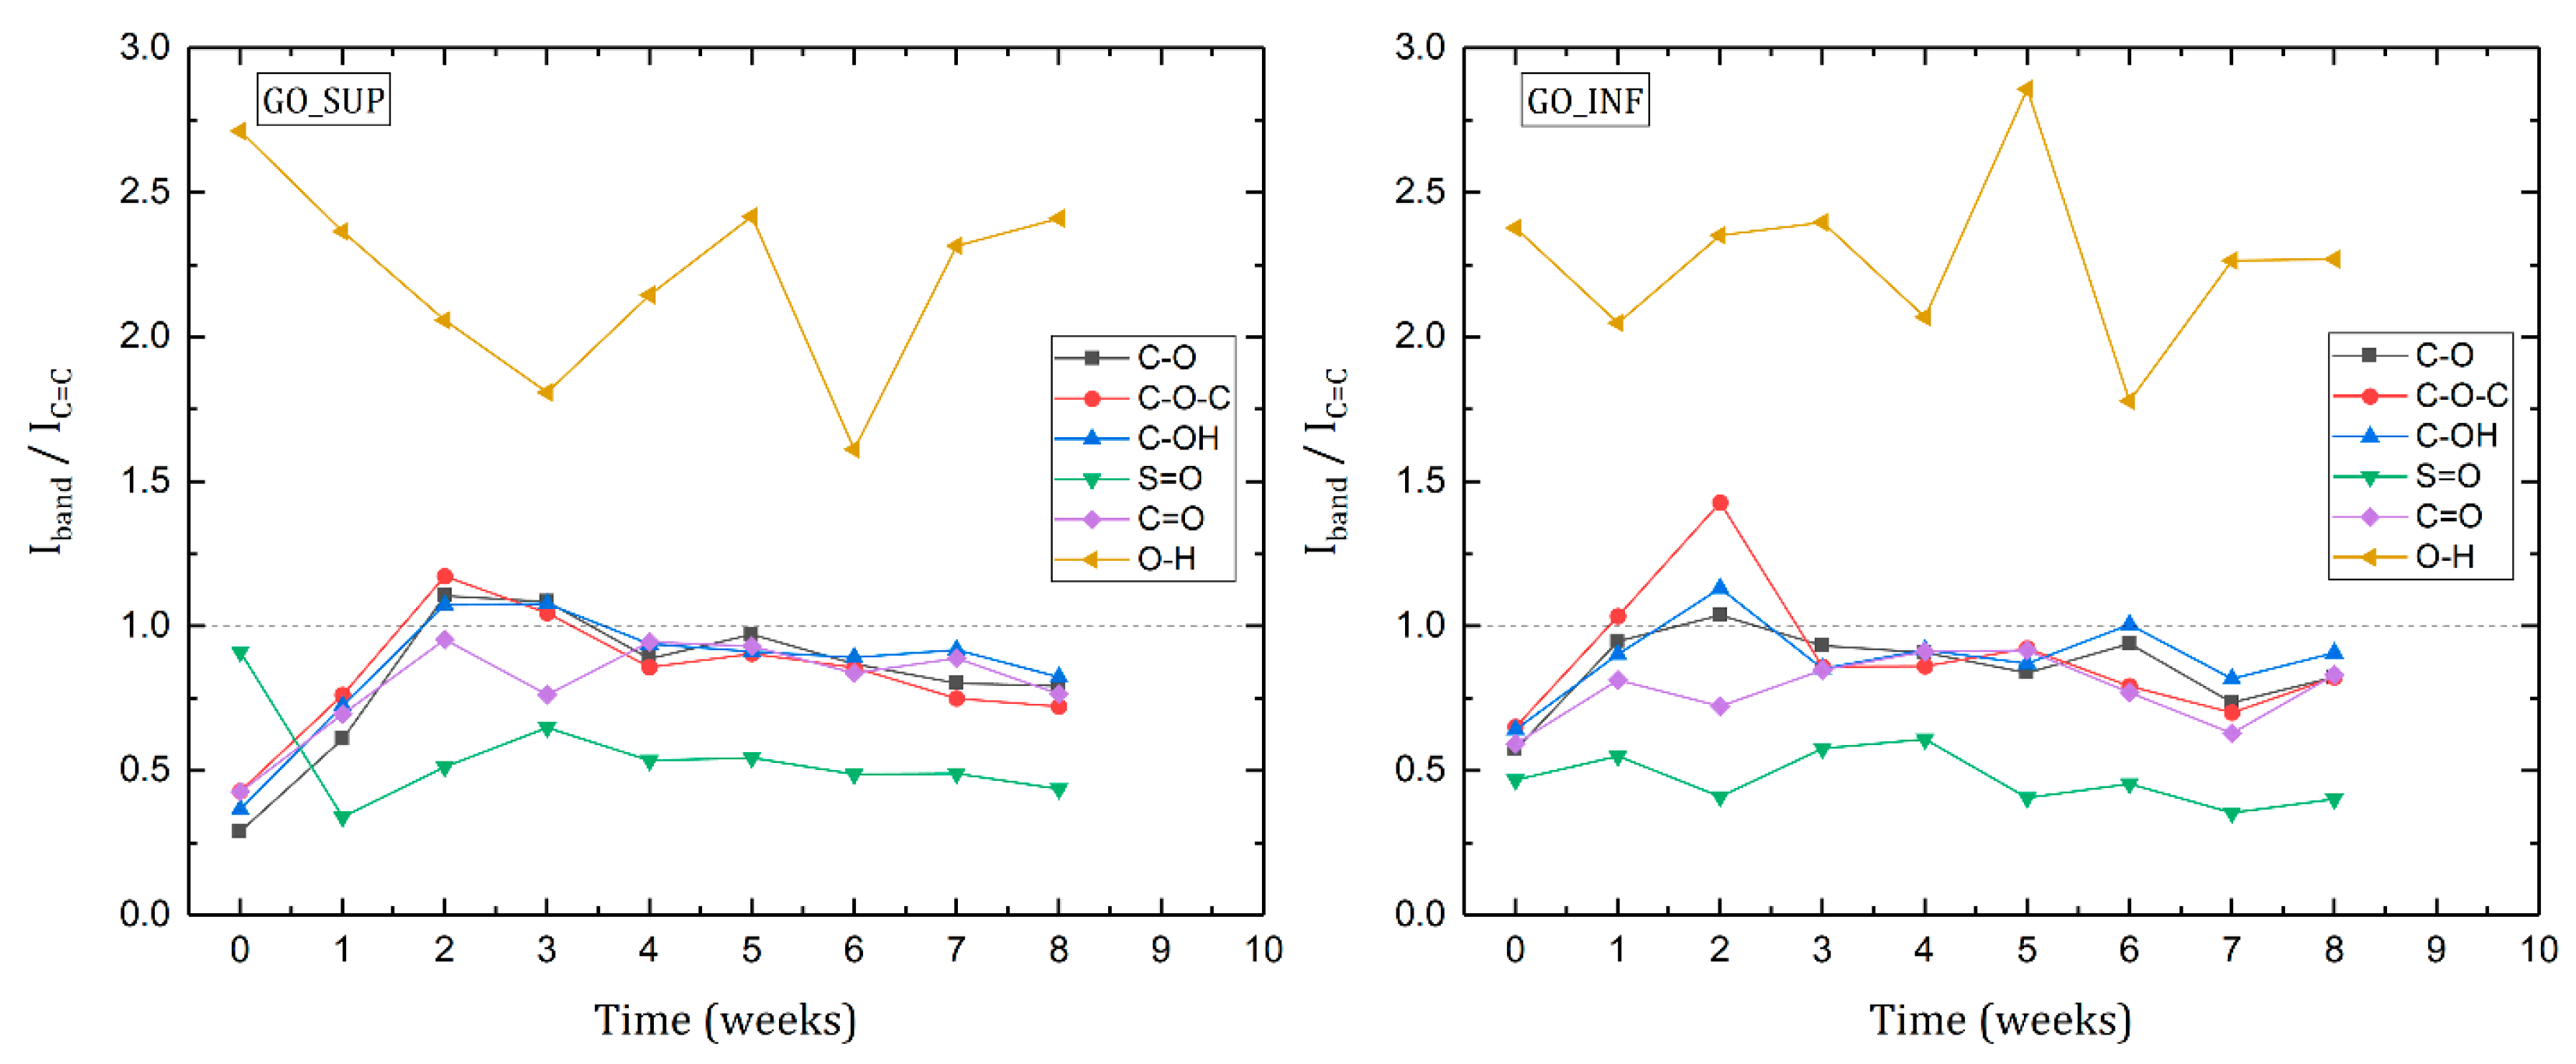
3.4. Fourier Transform IR Spectroscopy (FT-IR)
3.5. X-ray Diffraction (XRD)
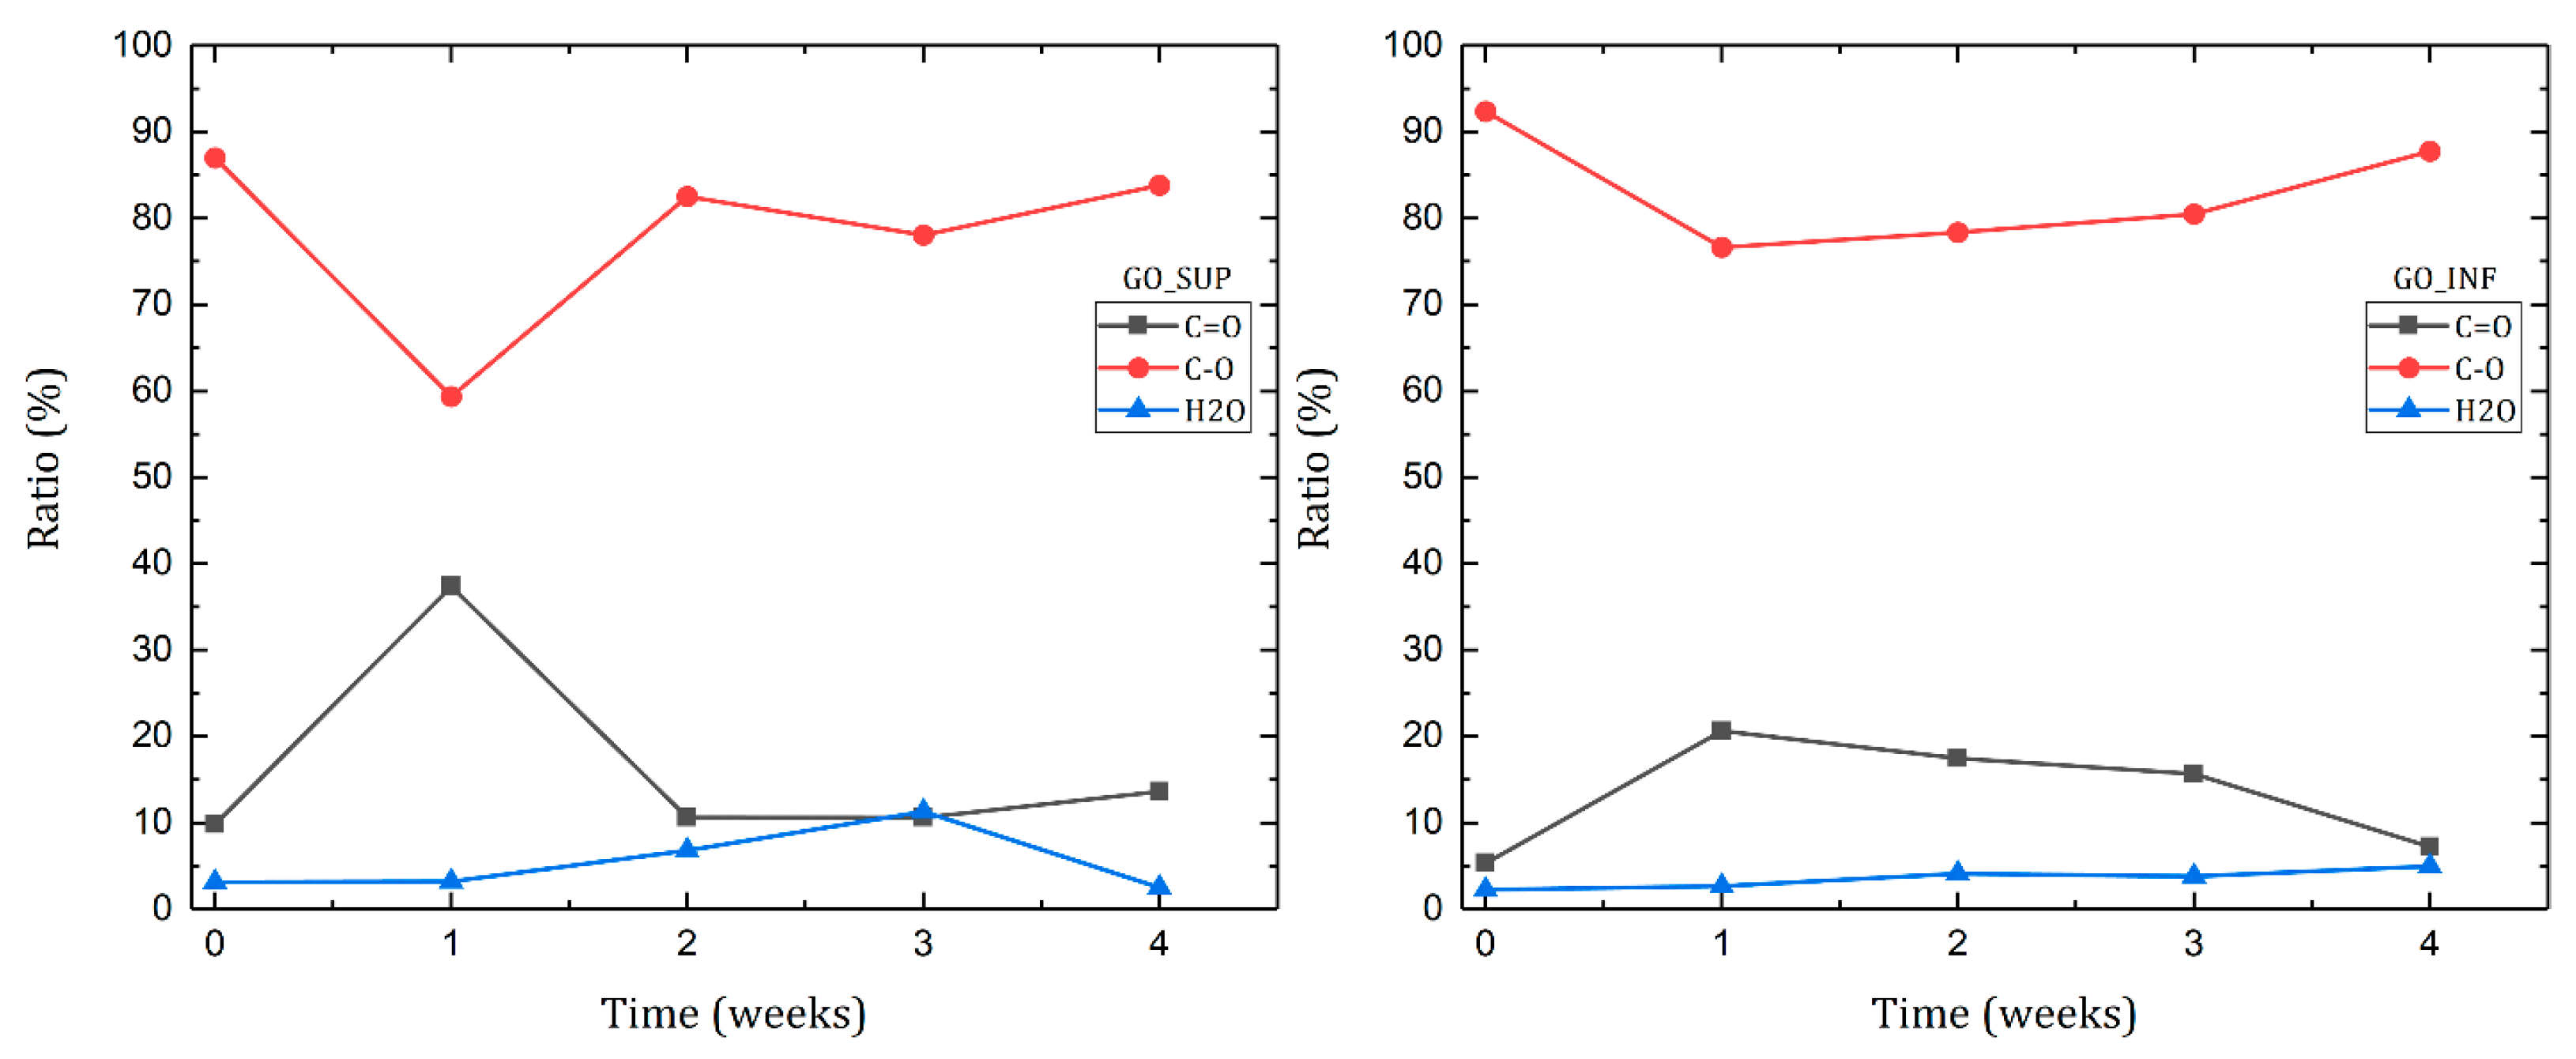
3.6. X-ray Photoelectron Spectroscopy (XPS)
4. Discussion
4.1. Correlation of Experimental Observations
4.2. Mechanisms Underlying the Meta-Stability of GO in Aqueous Dispersions
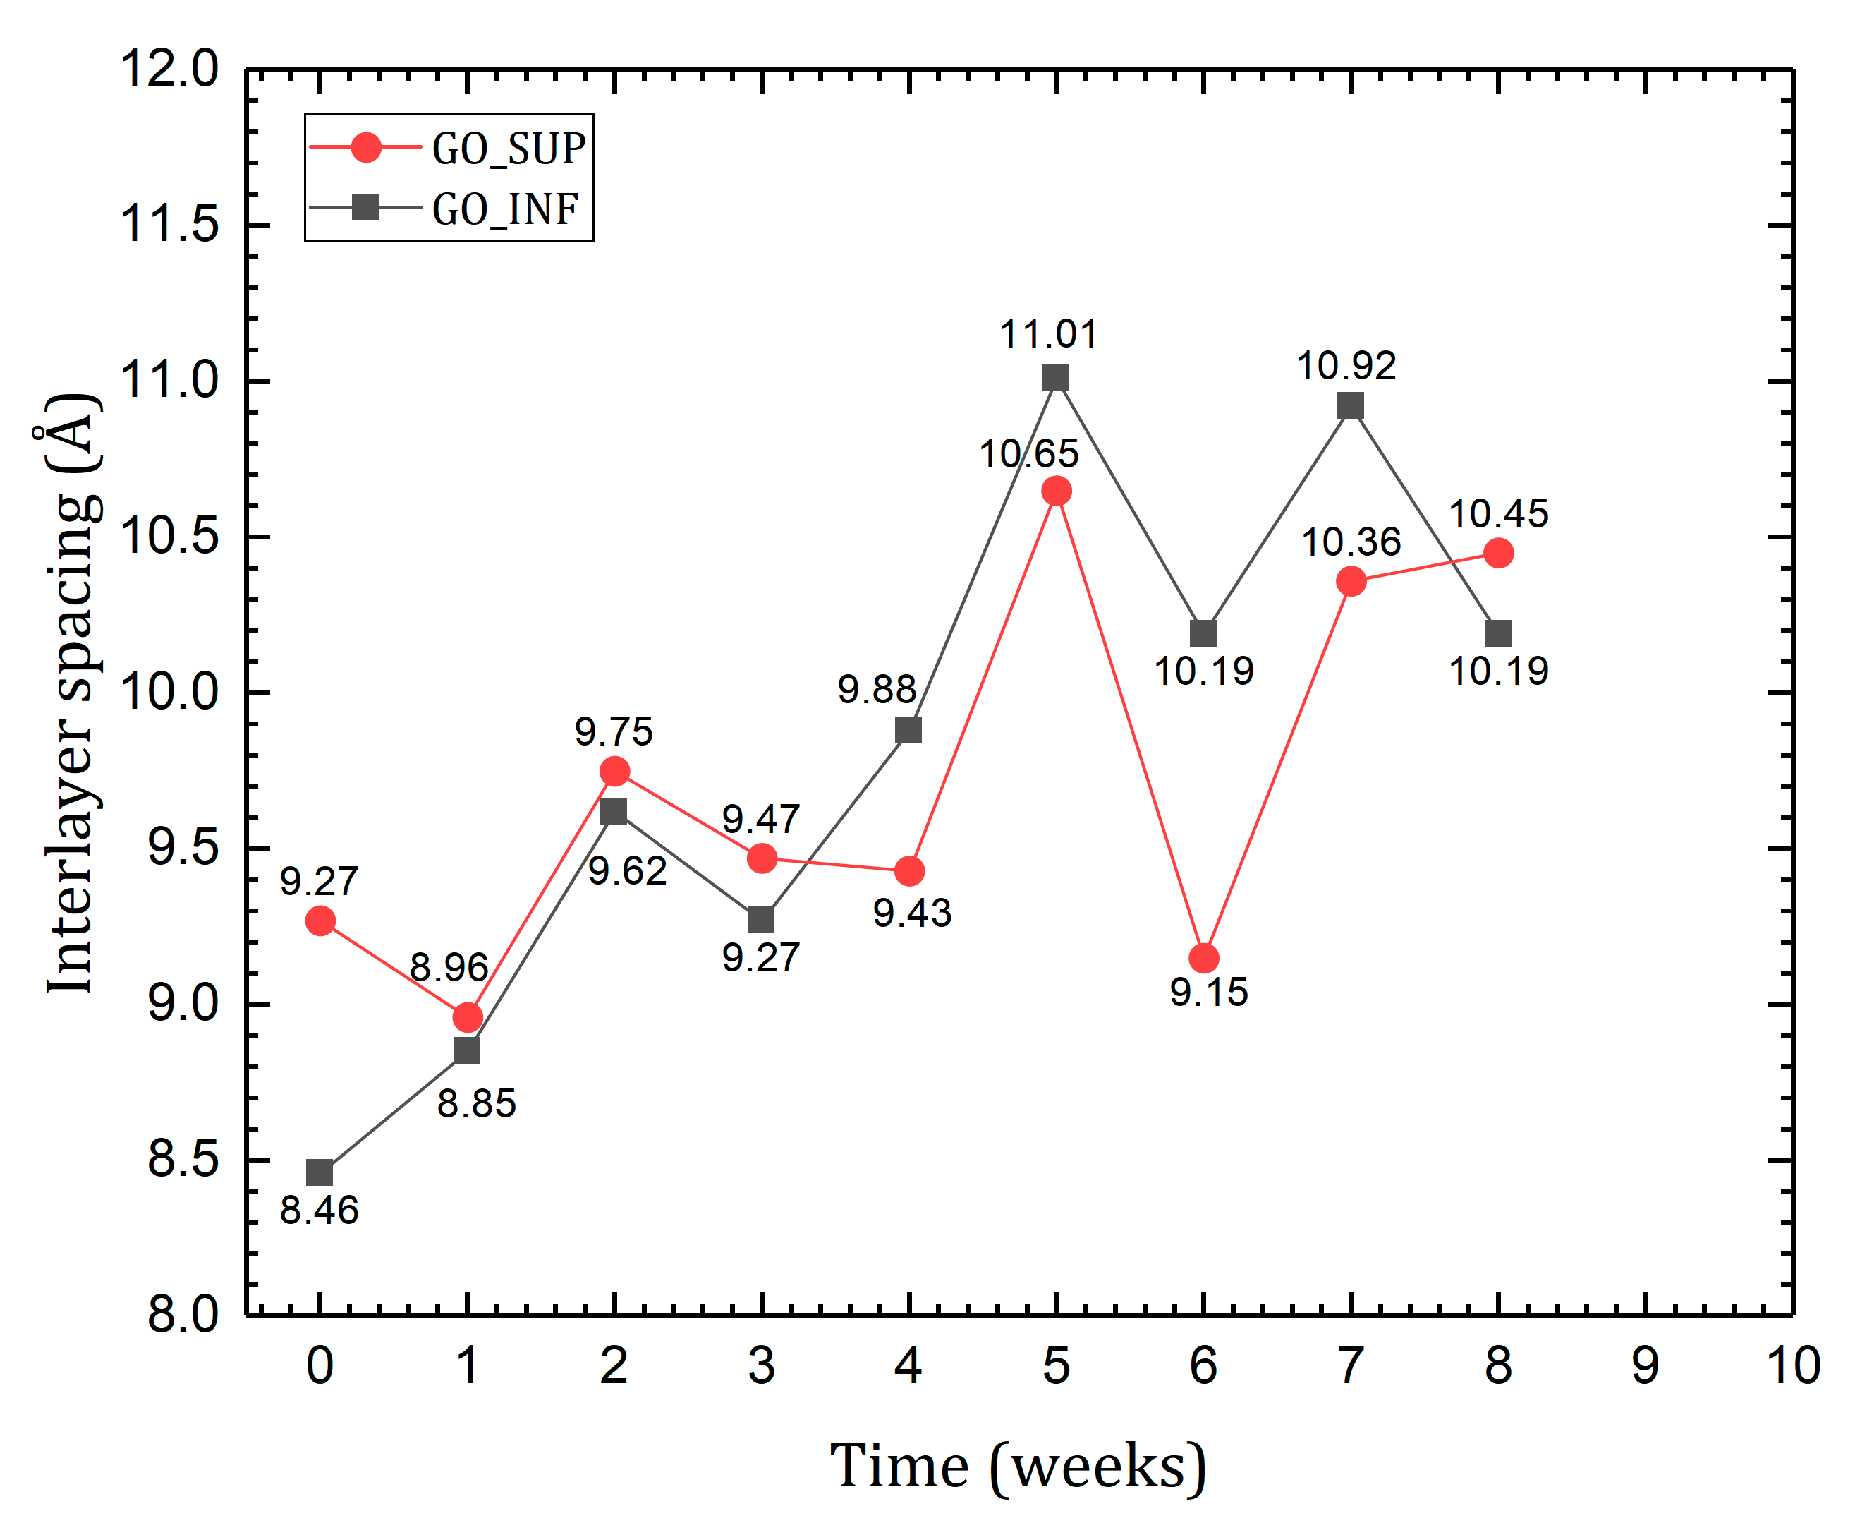
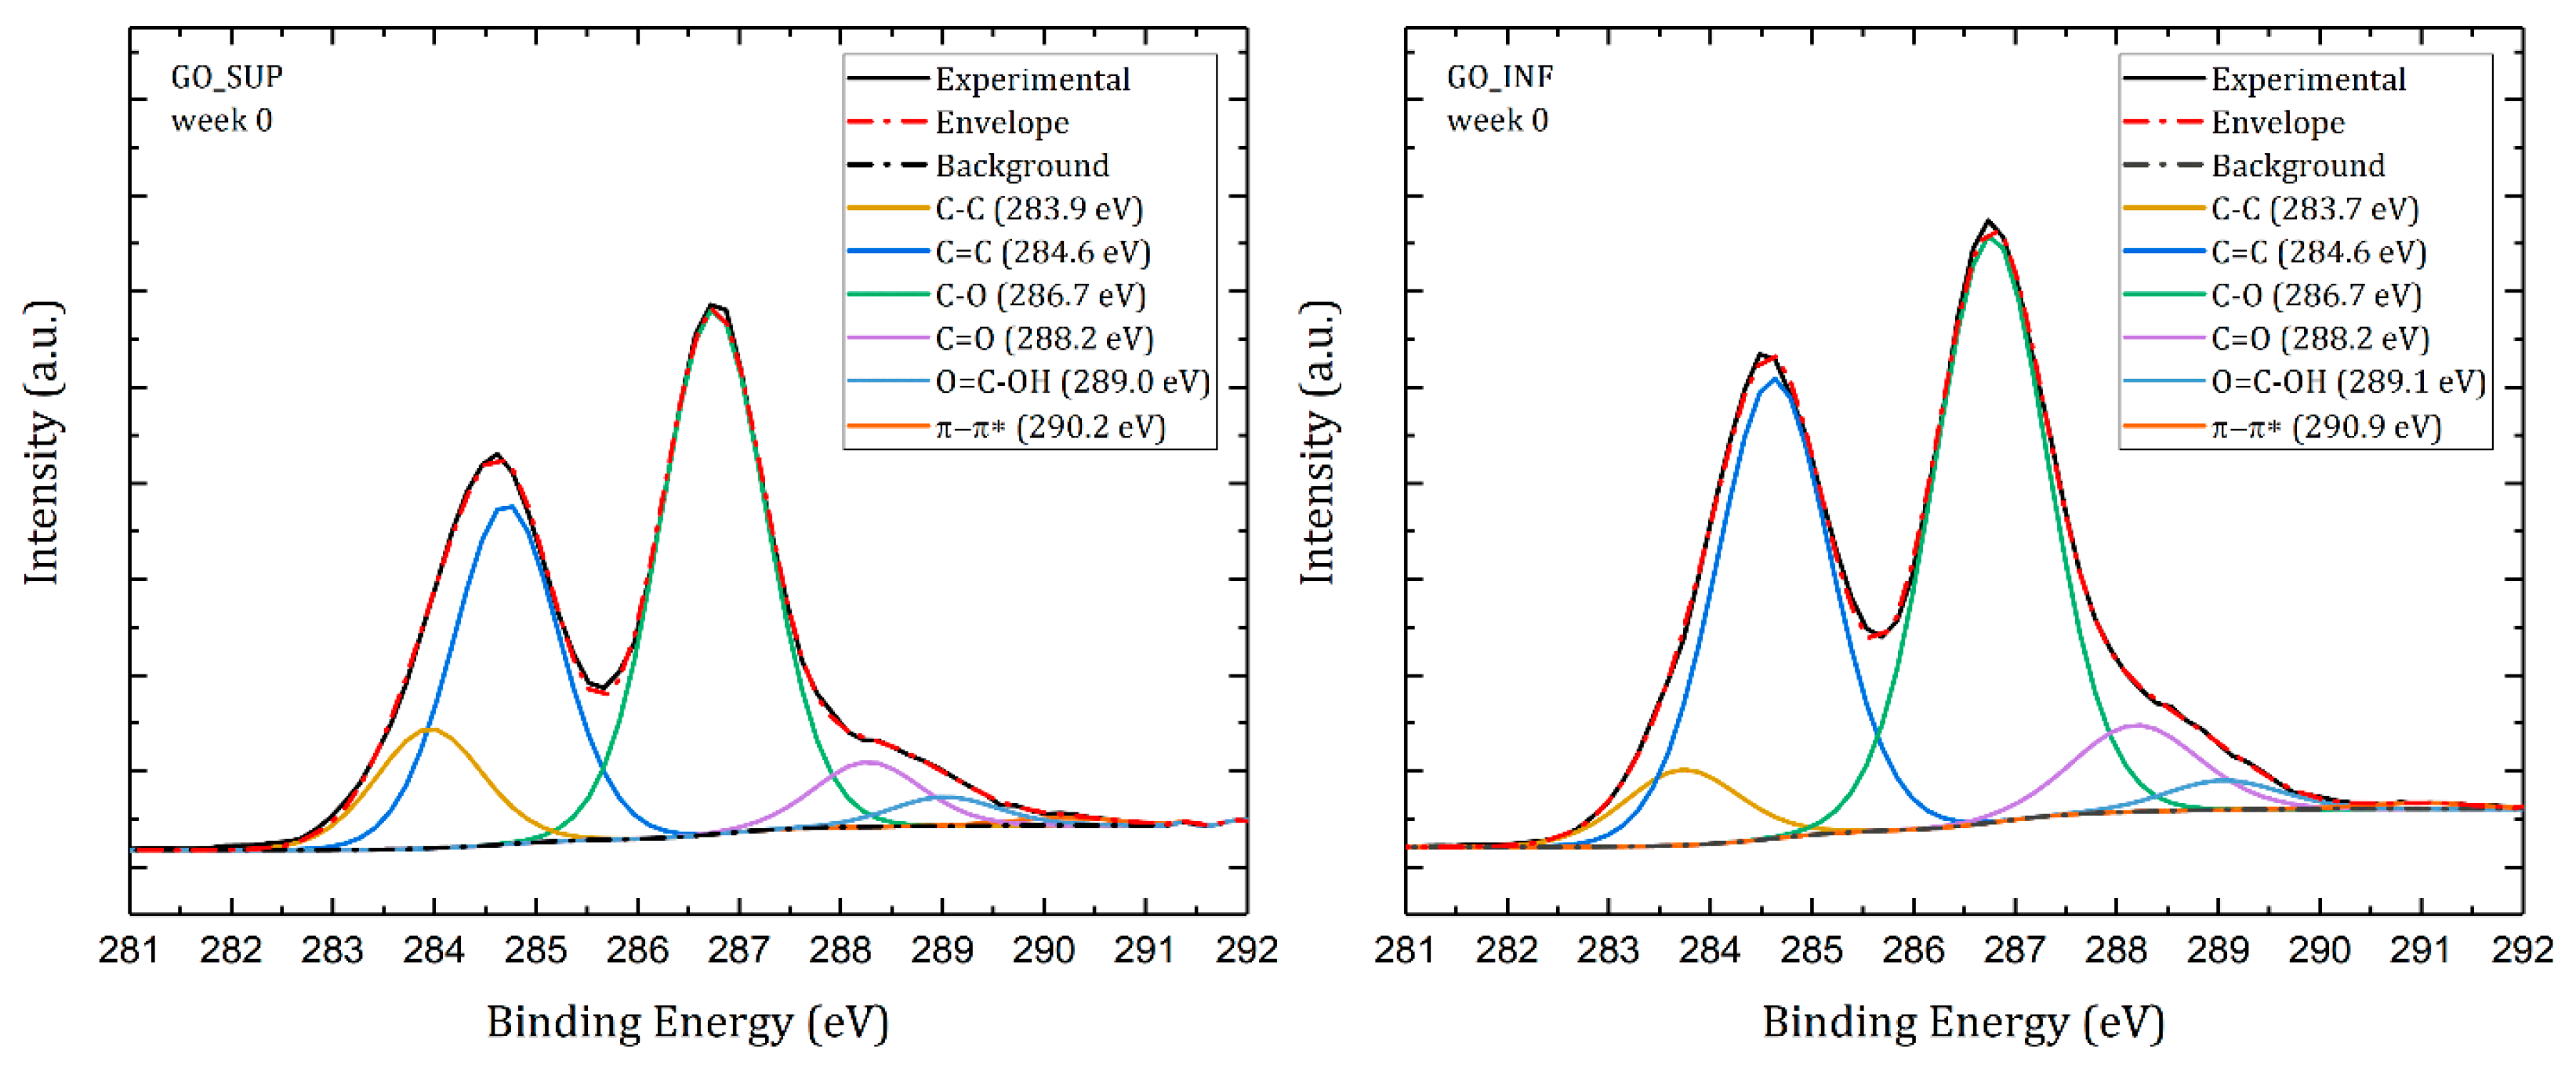
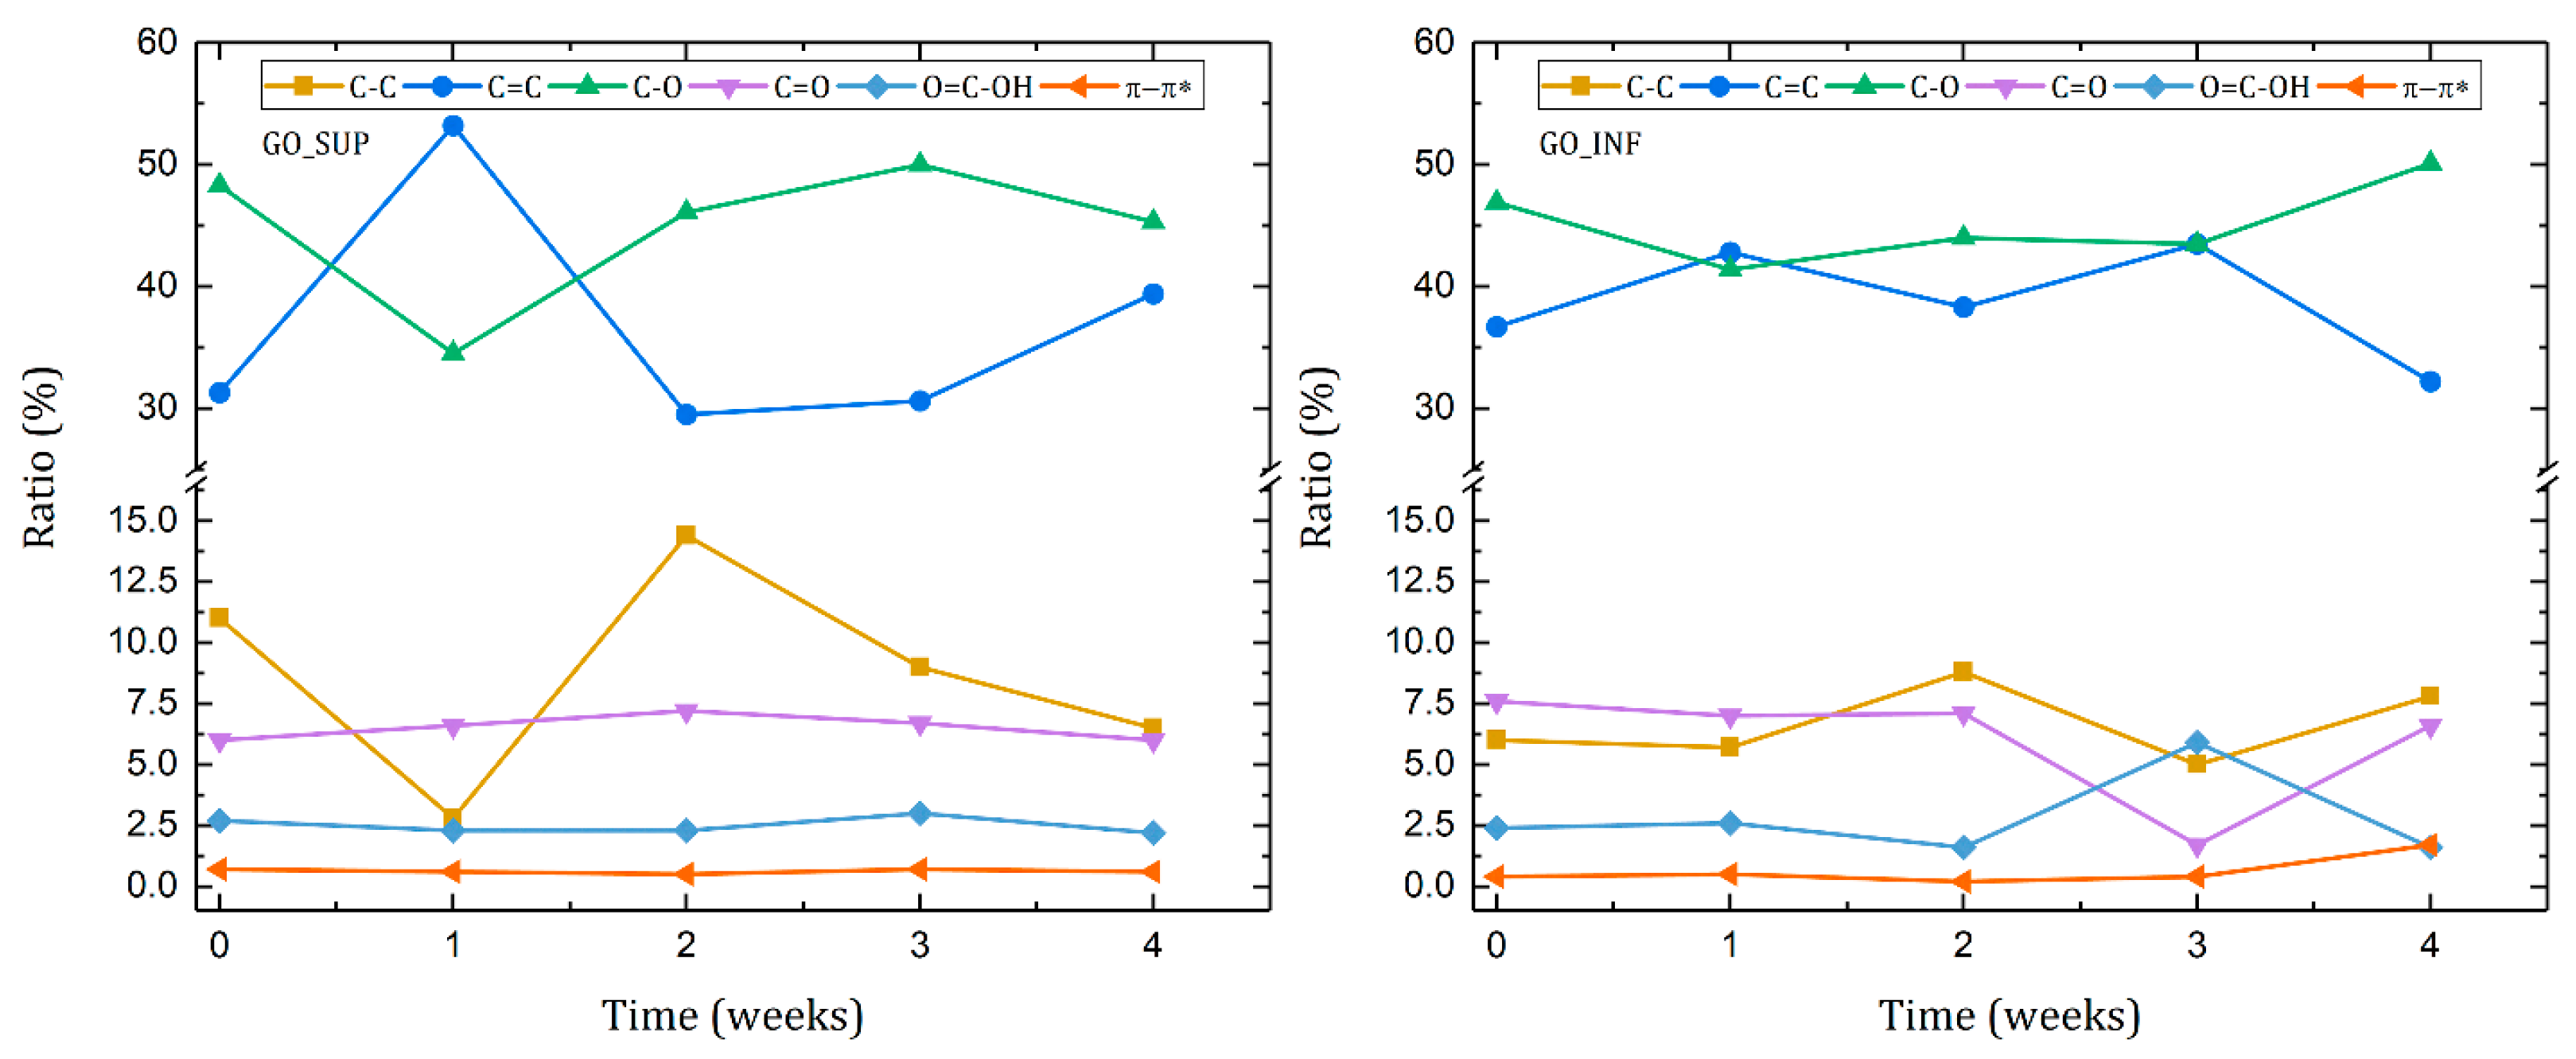
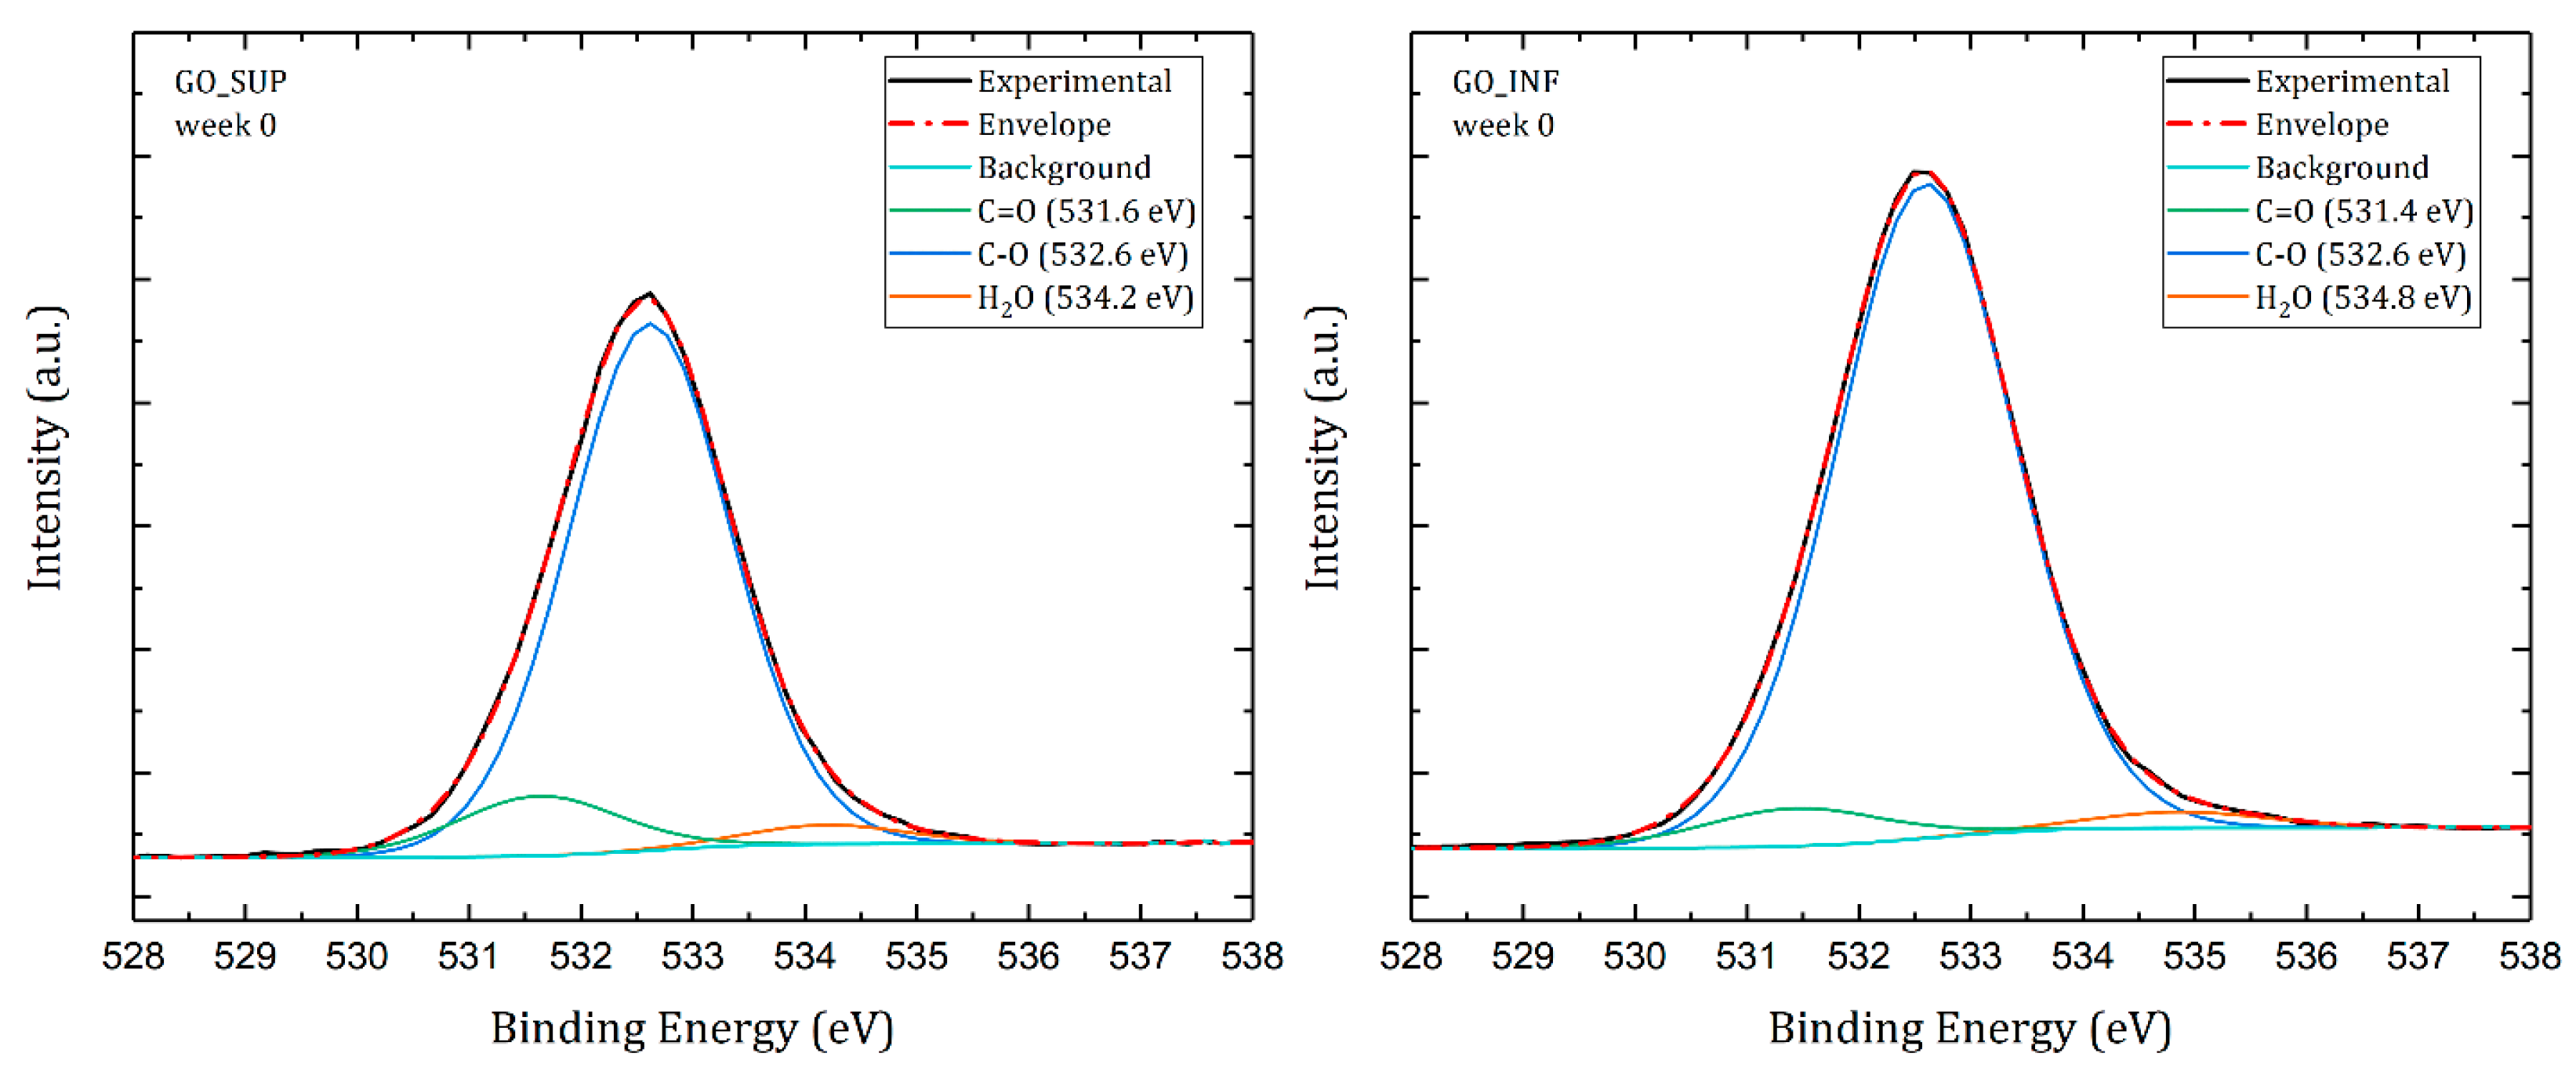
- The formation of oxygen-based functional groups at the surface of the GO nanosheets, through the interaction with the water molecules [22,30]. This process seems dominant during the first three to four weeks and is confirmed by the following observations: the enhancement of the IR absorption bands corresponding to the identified functional groups vibrations; the decrease of sp2 carbon (C=C) and the increase of the amount of centre-surface bonds (C-O) and sp3 carbon (C-C) in the XPS spectra; the independent evolution of the interlayer spacing of the O-H absorption band intensity, which indicates the lack of adsorbed H2O molecules in the interlayer space; an increase in the oxidation degree; and the decrease of the ζ-potential value.
- The partial restoration of the carbon planes, through the transformation of the existing functional groups into H2O molecules adsorbed on the surface [23]. The process is observed after the first three or four weeks, but its presence earlier might be hidden by the first mechanism, as confirmed by the XPS spectra. It is supported by the following experimental observations: the decrease of the intensities of the IR absorption bands corresponding to the oxygen functional groups vibrations; the slow increase in the amount of H2O molecules in the XPS spectra in the first four weeks; the strong correlation between the interlayer spacing and the intensity of the O-H absorption band, indicating the presence of adsorbed H2O molecules in the interlayer spacing; a decrease in the oxidation degree; and an increase of the ζ-potential.
5. Conclusions
Author Contributions
Funding
Acknowledgments
Conflicts of Interest
References
- Novoselov, K.S.; Geim, A.K.; Morozov, S.V.; Jiang, D.; Zhang, Y.; Dubonos, S.V.; Grigorieva, I.V.; Firsov, A.A. Electric Field in Atomically Thin Carbon Films. Science 2004, 306, 666–669. [Google Scholar] [CrossRef] [PubMed] [Green Version]
- Geim, A.K.; Novoselov, K.S. The Rise of Graphene. Nat. Mater. 2007, 6, 183–191. [Google Scholar] [CrossRef] [PubMed]
- Allen, J.M.; Vincent, T.C.; Richard, K.B. Honeycomb Carbon: A Review of Graphene What Is Graphene? Chem. Rev. 2010, 110, 132–145. [Google Scholar] [CrossRef] [PubMed]
- Cao, K.; Feng, S.; Han, Y.; Gao, L.; Hue Ly, T.; Xu, Z.; Lu, Y. Elastic Straining of Free-Standing Monolayer Graphene. Nat. Commun. 2020, 11, 284. [Google Scholar] [CrossRef] [PubMed] [Green Version]
- Balandin, A.A.; Ghosh, S.; Bao, W.; Calizo, I.; Teweldebrhan, D.; Miao, F.; Lau, C.N. Superior Thermal Conductivity of Single-Layer Graphene. Nano Lett. 2008, 8, 902–907. [Google Scholar] [CrossRef] [PubMed]
- Cooper, D.R.; D’Anjou, B.; Ghattamaneni, N.; Harack, B.; Hilke, M.; Horth, A.; Majlis, N.; Massicotte, M.; Vandsburger, L.; Whiteway, E.; et al. Experimental Review of Graphene. ISRN Condens. Matter Phys. 2012, 2012, 501686. [Google Scholar] [CrossRef] [Green Version]
- Seol, J.H.; Jo, I.; Moore, A.L.; Lindsay, L.; Aitken, Z.H.; Pettes, M.T.; Li, X.; Yao, Z.; Huang, R.; Broido, D.; et al. Two-Dimensional Phonon Transport in Supported Graphene. Science 2010, 328, 213–216. [Google Scholar] [CrossRef] [Green Version]
- Novoselov, K.S.; Fal’Ko, V.I.; Colombo, L.; Gellert, P.R.; Schwab, M.G.; Kim, K. A Roadmap for Graphene. Nature 2012, 490, 192–200. [Google Scholar] [CrossRef]
- Torres, J.A.; Kaner, R.B. Graphene Synthesis: Graphene Closer to Fruition. Nat. Mater. 2014, 13, 328–329. [Google Scholar] [CrossRef]
- Loh, K.P.; Bao, Q.; Eda, G.; Chhowalla, M. Graphene Oxide as a Chemically Tunable Platform for Optical Applications. Nat. Chem. 2010, 2, 1015–1024. [Google Scholar] [CrossRef]
- Zhu, Y.; Murali, S.; Cai, W.; Li, X.; Suk, J.W.; Potts, J.R.; Ruoff, R.S. Graphene and Graphene Oxide: Synthesis, Properties, and Applications. Adv. Mater. 2010, 22, 3906–3924. [Google Scholar] [CrossRef] [PubMed]
- Kim, D.H.; Yun, Y.S.; Jin, H.J. Difference of Dispersion Behavior between Graphene Oxide and Oxidized Carbon Nanotubes in Polar Organic Solvents. Curr. Appl. Phys. 2012, 12, 637–642. [Google Scholar] [CrossRef]
- Park, S.; Ruoff, R.S. Chemical Methods for the Production of Graphenes. Nat. Nanotechnol. 2009, 4, 217–224. [Google Scholar] [CrossRef] [PubMed]
- Kim, J.; Cote, L.J.; Huang, J. Two Dimensional Soft Material: New Faces of Graphene Oxide. Acc. Chem. Res. 2012, 45, 1356–1364. [Google Scholar] [CrossRef]
- Xu, Z.; Gao, C. Aqueous Liquid Crystals of Graphene Oxide. ACS Nano 2011, 5, 2908–2915. [Google Scholar] [CrossRef]
- Kim, J.E.; Han, T.H.; Lee, S.H.; Kim, J.Y.; Ahn, C.W.; Yun, J.M.; Kim, S.O. Graphene Oxide Liquid Crystals. Angew. Chem.-Int. Ed. 2011, 50, 3043–3047. [Google Scholar] [CrossRef]
- Cote, L.J.; Kim, J.; Tung, V.C.; Luo, J.; Kim, F.; Huang, J. Graphene Oxide as Surfactant Sheets. Pure Appl. Chem. 2011, 83, 95–110. [Google Scholar] [CrossRef]
- Shao, J.J.; Lv, W.; Yang, Q.H. Self-Assembly of Graphene Oxide at Interfaces. Adv. Mater. 2014, 26, 5586–5612. [Google Scholar] [CrossRef]
- Dreyer, D.R.; Park, S.; Bielawski, C.W.; Ruoff, R.S. The Chemistry of Graphene Oxide. Chem. Soc. Rev. 2010, 39, 228–240. [Google Scholar] [CrossRef]
- Lerf, A.; He, H.; Forster, M.; Klinowski, J. Structure of Graphite Oxide Revisited. J. Phys. Chem. B 1998, 102, 4477–4482. [Google Scholar] [CrossRef]
- Szabó, T.; Berkesi, O.; Forgó, P.; Josepovits, K.; Sanakis, Y.; Petridis, D.; Dékány, I. Evolution of Surface Functional Groups in a Series of Progressively Oxidized Graphite Oxides. Chem. Mater. 2006, 18, 2740–2749. [Google Scholar] [CrossRef]
- Dimiev, A.M.; Alemany, L.B.; Tour, J.M. Graphene Oxide. Origin of Acidity, Its Instability in Water, and a New Dynamic Structural Model. ACS Nano 2013, 7, 576–588. [Google Scholar] [CrossRef] [PubMed]
- Kim, S.; Zhou, S.; Hu, Y.; Acik, M.; Chabal, Y.J.; Berger, C.; De Heer, W.; Bongiorno, A.; Riedo, E. Room-Temperature Metastability of Multilayer Graphene Oxide Films. Nat. Mater. 2012, 11, 544–549. [Google Scholar] [CrossRef] [PubMed]
- Mouhat, F.; Coudert, F.X.; Bocquet, M.L. Structure and Chemistry of Graphene Oxide in Liquid Water from First Principles. Nat. Commun. 2020, 11, 1566. [Google Scholar] [CrossRef] [PubMed] [Green Version]
- Bagri, A.; Mattevi, C.; Acik, M.; Chabal, Y.J.; Chhowalla, M.; Shenoy, V.B. Structural Evolution during the Reduction of Chemically Derived Graphene Oxide. Nat. Chem. 2010, 2, 581–587. [Google Scholar] [CrossRef]
- Wang, L.; Sun, Y.Y.; Lee, K.; West, D.; Chen, Z.F.; Zhao, J.J.; Zhang, S.B. Stability of Graphene Oxide Phases from First-Principles Calculations. Phys. Rev. B-Condens. Matter Mater. Phys. 2010, 82, 161406. [Google Scholar] [CrossRef]
- Devanathan, R.; Chase-Woods, D.; Shin, Y.; Gotthold, D.W. Molecular Dynamics Simulations Reveal That Water Diffusion between Graphene Oxide Layers Is Slow. Sci. Rep. 2016, 6, 29484. [Google Scholar] [CrossRef] [Green Version]
- Hou, D.; Yang, T. A Reactive Molecular Dynamics Study of Graphene Oxide Sheets in Different Saturated States: Structure, Reactivity and Mechanical Properties. Phys. Chem. Chem. Phys. 2018, 20, 11053–11066. [Google Scholar] [CrossRef]
- Marcano, D.C.; Kosynkin, D.V.; Berlin, J.M.; Sinitskii, A.; Sun, Z.; Slesarev, A.; Alemany, L.B.; Lu, W.; Tour, J.M. Improved Synthesis of Graphene Oxide. ACS Nano 2010, 4, 4806–4814. [Google Scholar] [CrossRef]
- Cotet, L.C.; Magyari, K.; Todea, M.; Dudescu, M.C.; Danciu, V.; Baia, L. Versatile Self-Assembled Graphene Oxide Membranes Obtained under Ambient Conditions by Using a Water-Ethanol Suspension. J. Mater. Chem. A 2017, 5, 2132–2142. [Google Scholar] [CrossRef]
- Pérez Del Pino, A.; György, E.; Cotet, C.; Baia, L.; Logofatu, C. Laser-Induced Chemical Transformation of Free-Standing Graphene Oxide Membranes in Liquid and Gas Ammonia Environments. RSC Adv. 2016, 6, 50034–50042. [Google Scholar] [CrossRef] [Green Version]
- Chuquitarqui, A.; Cotet, L.C.; Baia, M.; György, E.; Magyari, K.; Barbu-Tudoran, L.; Baia, L.; Díaz-González, M.; Fernández-Sánchez, C.; Pérez Del Pino, A. New Fabrication Method for Producing Reduced Graphene Oxide Flexible Electrodes by Using a Low-Power Visible Laser Diode Engraving System. Nanotechnology 2020, 31, 325402. [Google Scholar] [CrossRef] [PubMed]
- Khlebtsov, B.N.; Khlebtsov, N.G. On the Measurement of Gold Nanoparticle Sizes by the Dynamic Light Scattering Method. Colloid J. 2011, 73, 118–127. [Google Scholar] [CrossRef]
- Anderson, W.; Kozak, D.; Coleman, V.A.; Jämting, Å.K.; Trau, M. A Comparative Study of Submicron Particle Sizing Platforms: Accuracy, Precision and Resolution Analysis of Polydisperse Particle Size Distributions. J. Colloid Interface Sci. 2013, 405, 322–330. [Google Scholar] [CrossRef]
- Kato, H.; Nakamura, A.; Kinugasa, S. Effects of Angular Dependency of Particulate Light Scattering Intensity on Determination of Samples with Bimodal Size Distributions Using Dynamic Light Scattering Methods. Nanomaterials 2018, 8, 708. [Google Scholar] [CrossRef] [Green Version]
- Ferrari, A.C.; Meyer, J.C.; Scardaci, V.; Casiraghi, C.; Lazzeri, M.; Mauri, F.; Piscanec, S.; Jiang, D.; Novoselov, K.S.; Roth, S.; et al. Raman Spectrum of Graphene and Graphene Layers. Phys. Rev. Lett. 2006, 97, 187401. [Google Scholar] [CrossRef] [Green Version]
- Childres, I.; Jauregui, L.A.; Park, W.; Caoa, H.; Chena, Y.P. Raman Spectroscopy of Graphene and Related Materials. In New Developments in Photon and Materials Research; Nova Science Publishers, Inc.: Hauppauge, NY, USA, 2013; pp. 403–418. ISBN 9781626183391. [Google Scholar]
- Ferrari, A.C.; Basko, D.M. Raman Spectroscopy as a Versatile Tool for Studying the Properties of Graphene. Nat. Nanotechnol. 2013, 8, 235–246. [Google Scholar] [CrossRef] [Green Version]
- Cançado, L.G.; Jorio, A.; Ferreira, E.H.M.; Stavale, F.; Achete, C.A.; Capaz, R.B.; Moutinho, M.V.O.; Lombardo, A.; Kulmala, T.S.; Ferrari, A.C. Quantifying Defects in Graphene via Raman Spectroscopy at Different Excitation Energies. Nano Lett. 2011, 11, 3190–3196. [Google Scholar] [CrossRef] [Green Version]
- Lucchese, M.M.; Stavale, F.; Ferreira, E.H.M.; Vilani, C.; Moutinho, M.V.O.; Capaz, R.B.; Achete, C.A.; Jorio, A. Quantifying Ion-Induced Defects and Raman Relaxation Length in Graphene. Carbon 2010, 48, 1592–1597. [Google Scholar] [CrossRef]
- Eigler, S.; Dotzer, C.; Hirsch, A. Visualization of Defect Densities in Reduced Graphene Oxide. Carbon 2012, 50, 3666–3673. [Google Scholar] [CrossRef]
- Eigler, S.; Dimiev, A.M. Characterization Techniques. In Graphene Oxide: Fundamentals and Applications; Wiley: New York, NY, USA, 2016; pp. 85–120. ISBN 9781119069447. [Google Scholar]
- Saito, R.; Hofmann, M.; Dresselhaus, G.; Jorio, A.; Dresselhaus, M.S. Raman Spectroscopy of Graphene and Carbon Nanotubes. Adv. Phys. 2011, 60, 413–550. [Google Scholar] [CrossRef]
- Fuente, E.; Menéndez, J.A.; Díez, M.A.; Suárez, D.; Montes-Morán, M.A. Infrared Spectroscopy of Carbon Materials: A Quantum Chemical Study of Model Compounds. J. Phys. Chem. B 2003, 107, 6350–6359. [Google Scholar] [CrossRef]
- Choi, E.Y.; Han, T.H.; Hong, J.; Kim, J.E.; Lee, S.H.; Kim, H.W.; Kim, S.O. Noncovalent Functionalization of Graphene with End-Functional Polymers. J. Mater. Chem. 2010, 20, 1907–1912. [Google Scholar] [CrossRef]
- Thema, F.T.; Moloto, M.J.; Dikio, E.D.; Nyangiwe, N.N.; Kotsedi, L.; Maaza, M.; Khenfouch, M. Synthesis and Characterization of Graphene Thin Films by Chemical Reduction of Exfoliated and Intercalated Graphite Oxide. J. Chem. 2013, 3, 150536. [Google Scholar] [CrossRef] [Green Version]
- Dimiev, A.; Kosynkin, D.v.; Alemany, L.B.; Chaguine, P.; Tour, J.M. Pristine Graphite Oxide. J Am Chem Soc 2012, 134, 2815–2822. [Google Scholar] [CrossRef] [PubMed]
- Chua, C.K.; Pumera, M. Selective Removal of Hydroxyl Groups from Graphene Oxide. Chem.-A Eur. J. 2013, 19, 2005–2011. [Google Scholar] [CrossRef] [PubMed]
- Lee, D.W.; Seo, J.W. Sp2/Sp3 Carbon Ratio in Graphite Oxide with Different Preparation Times. J. Phys. Chem. C 2011, 115, 2705–2708. [Google Scholar] [CrossRef] [Green Version]
- Hontoria-Lucas, C.; López-Peinado, A.J.; López-González, J.d.D.; Rojas-Cervantes, M.L.; Martín-Aranda, R.M. Study of Oxygen-Containing Groups in a Series of Graphite Oxides: Physical and Chemical Characterization. Carbon 1995, 33, 1585–1592. [Google Scholar] [CrossRef]
- Akhavan, O. The Effect of Heat Treatment on Formation of Graphene Thin Films from Graphene Oxide Nanosheets. Carbon 2010, 48, 509–519. [Google Scholar] [CrossRef]
- Park, J.S.; Cho, S.M.; Kim, W.J.; Park, J.; Yoo, P.J. Fabrication of Graphene Thin Films Based on Layer-by-Layer Self-Assembly of Functionalized Graphene Nanosheets. ACS Appl. Mater. Interfaces 2011, 3, 360–368. [Google Scholar] [CrossRef]
- Shao, J.J.; Wu, S.D.; Zhang, S.B.; Lv, W.; Su, F.Y.; Yang, Q.H. Graphene Oxide Hydrogel at Solid/Liquid Interface. Chem. Commun. 2011, 47, 5771–5773. [Google Scholar] [CrossRef] [PubMed]


Publisher’s Note: MDPI stays neutral with regard to jurisdictional claims in published maps and institutional affiliations. |
© 2022 by the authors. Licensee MDPI, Basel, Switzerland. This article is an open access article distributed under the terms and conditions of the Creative Commons Attribution (CC BY) license (https://creativecommons.org/licenses/by/4.0/).
Share and Cite
Costinas, C.; Salagean, C.A.; Cotet, L.C.; Baia, M.; Todea, M.; Magyari, K.; Baia, L. Insights into the Stability of Graphene Oxide Aqueous Dispersions. Nanomaterials 2022, 12, 4489. https://doi.org/10.3390/nano12244489
Costinas C, Salagean CA, Cotet LC, Baia M, Todea M, Magyari K, Baia L. Insights into the Stability of Graphene Oxide Aqueous Dispersions. Nanomaterials. 2022; 12(24):4489. https://doi.org/10.3390/nano12244489
Chicago/Turabian StyleCostinas, Codrut, Catalin Alexandru Salagean, Liviu Cosmin Cotet, Monica Baia, Milica Todea, Klara Magyari, and Lucian Baia. 2022. "Insights into the Stability of Graphene Oxide Aqueous Dispersions" Nanomaterials 12, no. 24: 4489. https://doi.org/10.3390/nano12244489