
Compositional Analysis of the Dental Biomimetic Hybrid Nanomaterials Based on Bioinspired Nonstoichiometric Hydroxyapatite with Small Deviations in the Carbonate Incorporation
 ,
,
Abstract
:1. Introduction
2. Materials and Methods
2.1. Obtaining of the Samples
2.2. Research Methods
3. Results and Discussion
4. Conclusions
Author Contributions
Funding
Data Availability Statement
Conflicts of Interest
References
- George, S.M.; Nayak, C.; Singh, I.; Balani, K. Multifunctional Hydroxyapatite Composites for Orthopedic Applications: A Review. ACS Biomater. Sci. Eng. 2022, 8, 3162–3186. [Google Scholar] [CrossRef] [PubMed]
- Dorozhkin, S.V. Hydroxyapatite and Other Calcium Orthophosphates: Bioceramics, Coatings and Dental Applications [Hardcover]; Nova Science Publishers, Inc: New York, NY, USA, 2017; ISBN 978-1-5361-1897-1. [Google Scholar]
- Cacciotti, I. Multisubstituted Hydroxyapatite Powders and Coatings: The Influence of the Codoping on the Hydroxyapatite Performances. Int. J. Appl. Ceram. Technol. 2019, 16, 1864–1884. [Google Scholar] [CrossRef]
- Kuczumow, A.; Chałas, R.; Nowak, J.; Smułek, W.; Jarzębski, M. Novel Approach to Tooth Chemistry: Quantification of Human Enamel Apatite in Context for New Biomaterials and Nanomaterials Development. Int. J. Mol. Sci. 2021, 22, 279. [Google Scholar] [CrossRef] [PubMed]
- Jiang, Y.; Yuan, Z.; Huang, J. Substituted Hydroxyapatite: A Recent Development. Mater. Technol. 2020, 35, 785–796. [Google Scholar] [CrossRef]
- Kono, T.; Sakae, T.; Nakada, H.; Kaneda, T.; Okada, H. Confusion between Carbonate Apatite and Biological Apatite (Carbonated Hydroxyapatite) in Bone and Teeth. Minerals 2022, 12, 170. [Google Scholar] [CrossRef]
- Tite, T.; Popa, A.-C.; Balescu, L.M.; Bogdan, I.M.; Pasuk, I.; Ferreira, J.M.F.; Stan, G.E. Cationic Substitutions in Hydroxyapatite: Current Status of the Derived Biofunctional Effects and Their In Vitro Interrogation Methods. Materials 2018, 11, 2081. [Google Scholar] [CrossRef] [Green Version]
- Domashevskaya, E.P.; Al-Zubaidi, A.A.; Goloshchapov, D.L.; Rumyantseva, N.A.; Seredin, P.V. Study of Metal Substituted Calcium Deficient Hydroxyapatite. Condens. Matter Interphases 2014, 16, 134–141. [Google Scholar]
- Zilm, M.E.; Chen, L.; Sharma, V.; McDannald, A.; Jain, M.; Ramprasad, R.; Wei, M. Hydroxyapatite Substituted by Transition Metals: Experiment and Theory. Phys. Chem. Chem. Phys. 2016, 18, 16457–16465. [Google Scholar] [CrossRef]
- Taylor, E.A.; Mileti, C.J.; Ganesan, S.; Kim, J.H.; Donnelly, E. Measures of Bone Mineral Carbonate Content and Mineral Maturity/Crystallinity for FT-IR and Raman Spectroscopic Imaging Differentially Relate to Physical–Chemical Properties of Carbonate-Substituted Hydroxyapatite. Calcif. Tissue Int. 2021, 109, 77–91. [Google Scholar] [CrossRef]
- Shah, F.A. Towards Refining Raman Spectroscopy-Based Assessment of Bone Composition. Sci. Rep. 2020, 10, 16662. [Google Scholar] [CrossRef]
- McElderry, J.-D.P.; Zhu, P.; Mroue, K.H.; Xu, J.; Pavan, B.; Fang, M.; Zhao, G.; McNerny, E.; Kohn, D.H.; Franceschi, R.T.; et al. Crystallinity and Compositional Changes in Carbonated Apatites: Evidence from 31P Solid-State NMR, Raman, and AFM Analysis. J. Solid State Chem. 2013, 206, 192–198. [Google Scholar] [CrossRef]
- Leventouri, T.; Antonakos, A.; Kyriacou, A.; Venturelli, R.; Liarokapis, E.; Perdikatsis, V. Crystal Structure Studies of Human Dental Apatite as a Function of Age. Int. J. Biomater. 2009, 2009, 698547. [Google Scholar] [CrossRef] [Green Version]
- Aoba, T. Solubility Properties of Human Tooth Mineral and Pathogenesis of Dental Caries. Oral Dis. 2004, 10, 249–257. [Google Scholar] [CrossRef]
- Bang, L.T.; Long, B.D.; Othman, R. Carbonate Hydroxyapatite and Silicon-Substituted Carbonate Hydroxyapatite: Synthesis, Mechanical Properties, and Solubility Evaluations. Available online: https://www.hindawi.com/journals/tswj/2014/969876/ (accessed on 3 August 2017).
- Xu, C.; Reed, R.; Gorski, J.P.; Wang, Y.; Walker, M.P. The Distribution of Carbonate in Enamel and Its Correlation with Structure and Mechanical Properties. J. Mater. Sci. 2012, 47, 8035–8043. [Google Scholar] [CrossRef] [PubMed]
- Wilschefski, S.C.; Baxter, M.R. Inductively Coupled Plasma Mass Spectrometry: Introduction to Analytical Aspects. Clin. Biochem. Rev. 2019, 40, 115–133. [Google Scholar] [CrossRef] [PubMed]
- Targonska, S.; Wiglusz, R.J. Investigation of Physicochemical Properties of the Structurally Modified Nanosized Silicate-Substituted Hydroxyapatite Co-Doped with Eu3+ and Sr2+ Ions. Nanomaterials 2021, 11, 27. [Google Scholar] [CrossRef] [PubMed]
- Bakan, F. A Systematic Study of the Effect of PH on the Initialization of Ca-Deficient Hydroxyapatite to β-TCP Nanoparticles. Materials 2019, 12, 354. [Google Scholar] [CrossRef] [PubMed] [Green Version]
- Goloshchapov, D.L.; Lenshin, A.S.; Savchenko, D.V.; Seredin, P.V. Importance of Defect Nanocrystalline Calcium Hydroxyapatite Characteristics for Developing the Dental Biomimetic Composites. Results Phys. 2019, 13, 102158. [Google Scholar] [CrossRef]
- Bystrova, A.V.; Dekhtyar, Y.D.; Popov, A.I.; Coutinho, J.; Bystrov, V.S. Modified Hydroxyapatite Structure and Properties: Modeling and Synchrotron Data Analysis of Modified Hydroxyapatite Structure. Ferroelectrics 2015, 475, 135–147. [Google Scholar] [CrossRef]
- Dai, C.; Duan, J.; Zhang, L.; Jia, G.; Zhang, C.; Zhang, J. Biocompatibility of Defect-Related Luminescent Nanostructured and Microstructured Hydroxyapatite. Biol. Trace Elem. Res. 2014, 162, 158–167. [Google Scholar] [CrossRef]
- Vidotto, M.; Grego, T.; Petrović, B.; Somers, N.; Antonić Jelić, T.; Kralj, D.; Matijaković Mlinarić, N.; Leriche, A.; Dutour Sikirić, M.; Erceg, I.; et al. A Comparative EPR Study of Non-Substituted and Mg-Substituted Hydroxyapatite Behaviour in Model Media and during Accelerated Ageing. Crystals 2022, 12, 297. [Google Scholar] [CrossRef]
- Cacciotti, I. Cationic and Anionic Substitutions in Hydroxyapatite. In Handbook of Bioceramics and Biocomposites; Antoniac, I.V., Ed.; Springer International Publishing: Cham, Germany, 2016; pp. 145–211. ISBN 978-3-319-12460-5. [Google Scholar]
- Awonusi, A.; Morris, M.D.; Tecklenburg, M.M.J. Carbonate Assignment and Calibration in the Raman Spectrum of Apatite. Calcif. Tissue Int. 2007, 81, 46–52. [Google Scholar] [CrossRef] [PubMed]
- Seredin, P.; Goloshchapov, D.; Ippolitov, Y.; Vongsvivut, J. Development of a New Approach to Diagnosis of the Early Fluorosis Forms by Means of FTIR and Raman Microspectroscopy. Sci. Rep. 2020, 10, 20891. [Google Scholar] [CrossRef] [PubMed]
- Miyamoto, N.; Adachi, T.; Boschetto, F.; Zanocco, M.; Yamamoto, T.; Marin, E.; Somekawa, S.; Ashida, R.; Zhu, W.; Kanamura, N.; et al. Molecular Fingerprint Imaging to Identify Dental Caries Using Raman Spectroscopy. Materials 2020, 13, 4900. [Google Scholar] [CrossRef]
- Spizzirri, P.G.; Cochrane, N.J.; Prawer, S.; Reynolds, E.C. A Comparative Study of Carbonate Determination in Human Teeth Using Raman Spectroscopy. Caries Res. 2012, 46, 353–360. [Google Scholar] [CrossRef]
- Pezzotti, G.; Zhu, W.; Boffelli, M.; Adachi, T.; Ichioka, H.; Yamamoto, T.; Marunaka, Y.; Kanamura, N. Vibrational Algorithms for Quantitative Crystallographic Analyses of Hydroxyapatite-Based Biomaterials: I, Theoretical Foundations. Anal. Bioanal. Chem. 2015, 407, 3325–3342. [Google Scholar] [CrossRef]
- Goloshchapov, D.L.; Gushchin, M.S.; Kashkarov, V.M.; Seredin, P.V.; Ippolitov, Y.A.; Khmelevsky, N.O.; Aksenenko, A. XPS and XANES Studies of Biomimetic Composites Based on B-Type Nano-Hydroxyapatite. Results Phys. 2018, 9, 1386–1387. [Google Scholar] [CrossRef]
- Seredin, P.V.; Goloshchapov, D.L.; Prutskij, T.; Ippolitov, Y.A. Fabrication and Characterisation of Composites Materials Similar Optically and in Composition to Native Dental Tissues. Results Phys. 2017, 7, 1086–1094. [Google Scholar] [CrossRef]
- Goloshchapov, D.; Buylov, N.; Emelyanova, A.; Ippolitov, I.; Ippolitov, Y.; Kashkarov, V.; Khudyakov, Y.; Nikitkov, K.; Seredin, P. Raman and XANES Spectroscopic Study of the Influence of Coordination Atomic and Molecular Environments in Biomimetic Composite Materials Integrated with Dental Tissue. Nanomaterials 2021, 11, 3099. [Google Scholar] [CrossRef] [PubMed]
- Xue, J.; Zavgorodniy, A.V.; Kennedy, B.J.; Swain, M.V.; Li, W. X-ray Microdiffraction, TEM Characterization and Texture Analysis of Human Dentin and Enamel. J. Microsc. 2013, 251, 144–153. [Google Scholar] [CrossRef] [PubMed]
- Suvorova, E.I.; Buffat, P.A. Electron Diffraction from Micro- and Nanoparticles of Hydroxyapatite. J. Microsc. 1999, 196, 46–58. [Google Scholar] [CrossRef] [PubMed]
- Sheikh, L.; Tripathy, S.; Nayar, S. Biomimetic Matrix Mediated Room Temperature Synthesis and Characterization of Nano-Hydroxyapatite towards Targeted Drug Delivery. RSC Adv. 2016, 6, 62556–62571. [Google Scholar] [CrossRef]
- Mocioiu, A.-M.; Tutuianu, R.; Madalina, L.; Piticescu, R.; Stanciu, P.; Vasile, B.; Trusca, R.; Sereanu, V.; Meghea, A. 3D Structures of Hydroxyapatite Obtained from Rapana Venosa Shells Using Hydrothermal Synthesis Followed by 3D Printing. J. Mater. Sci. 2019, 54. [Google Scholar] [CrossRef]
- Unabia, R.B.; Bonebeau, S.; Candidato, R.T.; Jouin, J.; Noguera, O.; Pawłowski, L. Investigation on the Structural and Microstructural Properties of Copper-Doped Hydroxyapatite Coatings Deposited Using Solution Precursor Plasma Spraying. J. Eur. Ceram. Soc. 2019, 39, 4255–4263. [Google Scholar] [CrossRef]
- Person, A.; Bocherens, H.; Saliège, J.-F.; Paris, F.; Zeitoun, V.; Gérard, M. Early Diagenetic Evolution of Bone Phosphate: An X-ray Diffractometry Analysis. J. Archaeol. Sci. 1995, 22, 211–221. [Google Scholar] [CrossRef]
- Seredin, P.; Kashkarov, V.; Lukin, A.; Ippolitov, Y.; Julian, R.; Doyle, S. Local Study of Fissure Caries by Fourier Transform Infrared Microscopy and X-ray Diffraction Using Synchrotron Radiation. J. Synchrotron Radiat. 2013, 20, 705–710. [Google Scholar] [CrossRef]
- Uskoković, V. X-ray Photoelectron and Ion Scattering Spectroscopic Surface Analyses of Amorphous and Crystalline Calcium Phosphate Nanoparticles with Different Chemical Histories. Phys. Chem. Chem. Physics. 2020, 22, 5531–5547. [Google Scholar] [CrossRef]
- Pereiro, I.; Rodríguez-Valencia, C.; Serra, C.; Solla, E.L.; Serra, J.; González, P. Pulsed Laser Deposition of Strontium-Substituted Hydroxyapatite Coatings. Appl. Surf. Sci. 2012, 258, 9192–9197. [Google Scholar] [CrossRef]
- Xia, W.; Lindahl, C.; Persson, C.; Thomsen, P.; Lausmaa, J.; Engqvist, H. Changes of Surface Composition and Morphology after Incorporation of Ions into Biomimetic Apatite Coating. J. Biomater. Nanobiotechnol. 2010, 01, 7–16. [Google Scholar] [CrossRef] [Green Version]
- França, R.; Samani, T.D.; Bayade, G.; Yahia, L.; Sacher, E. Nanoscale Surface Characterization of Biphasic Calcium Phosphate, with Comparisons to Calcium Hydroxyapatite and β-Tricalcium Phosphate Bioceramics. J. Colloid Interface Sci. 2014, 420, 182–188. [Google Scholar] [CrossRef]
- Crist, B.V. Handbook of Monochromatic XPS Spectra; Wiley: New York, NY, USA, 2000; ISBN 978-0-471-49265-8. [Google Scholar]
- Nagakane, K.; Yoshida, Y.; Hirata, I.; Fukuda, R.; Nakayama, Y.; Shirai, K.; Ogawa, T.; Suzuki, K.; Van Meerbeek, B.; Okazaki, M. Analysis of Chemical Interaction of 4-MET with Hydroxyapatite Using XPS. Dent. Mater. J. 2006, 25, 645–649. [Google Scholar] [CrossRef] [PubMed]
- Fu, B.; Yuan, J.; Qian, W.; Shen, Q.; Sun, X.; Hannig, M. Evidence of Chemisorption of Maleic Acid to Enamel and Hydroxyapatite. Eur. J. Oral Sci. 2004, 112, 362–367. [Google Scholar] [CrossRef] [PubMed]
- Liu, Y.; Ma, L.; Guo, J.; Dong, G.; Cong, J.; Ji, Y.; Ning, J.; Yang, G.; Wu, K. Study of New Practical ESR Dosimeter Based on Carbonated Hydroxyapatite and Its Dosimetric Properties. PLoS ONE 2018, 13, e0197953. [Google Scholar] [CrossRef] [PubMed] [Green Version]
- Van de Grampel, R.D.; Ming, W.; Gildenpfennig, A.; van Gennip, W.J.H.; Laven, J.; Niemantsverdriet, J.W.; Brongersma, H.H.; de With, G.; van der Linde, R. The Outermost Atomic Layer of Thin Films of Fluorinated Polymethacrylates. Langmuir 2004, 20, 6344–6351. [Google Scholar] [CrossRef] [PubMed]
- Ohkubo, Y.; Endo, K.; Yamamura, K. Adhesive-Free Adhesion between Heat-Assisted Plasma-Treated Fluoropolymers (PTFE, PFA) and Plasma-Jet-Treated Polydimethylsiloxane (PDMS) and Its Application. Sci Rep. 2018, 8, 18058. [Google Scholar] [CrossRef] [PubMed] [Green Version]
- Powell, C. X-ray Photoelectron Spectroscopy Database XPS; Version 4.1, NIST Standard Reference Database 20; National Institute of Standards and Technology: Gaithersburg, MD, USA, 1989. [Google Scholar]
- Moulder, J.F.; Chastain, J. (Eds.) Handbook of X-ray Photoelectron Spectroscopy: A Reference Book of Standard Spectra for Identification and Interpretation of XPS Data; Update; Perkin-Elmer Corporation: Eden Prairie, MN, USA, 1992; ISBN 978-0-9627026-2-4. [Google Scholar]
- Briggs, D.; Grant, J.T. (Eds.) Surface Analysis by Auger and X-ray Photoelectron Spectroscopy; IM Publications: Chichester, UK, 2003; ISBN 978-1-901019-04-9. [Google Scholar]
- Chusuei, C.C.; Goodman, D.W.; Van Stipdonk, M.J.; Justes, D.R.; Schweikert, E.A. Calcium Phosphate Phase Identification Using XPS and Time-of-Flight Cluster SIMS. Anal. Chem. 1999, 71, 149–153. [Google Scholar] [CrossRef] [PubMed]
- Mancardi, G.; Tamargo, C.E.H.; Tommaso, D.D.; Leeuw, N.H. de Detection of Posner’s Clusters during Calcium Phosphate Nucleation: A Molecular Dynamics Study. J. Mater. Chem. B 2017, 5, 7274–7284. [Google Scholar] [CrossRef] [PubMed] [Green Version]
- Robin, M.; Euw, S.V.; Renaudin, G.; Gomes, S.; Krafft, J.-M.; Nassif, N.; Azaïs, T.; Costentin, G. Insights into OCP Identification and Quantification in the Context of Apatite Biomineralization. CrystEngComm 2020, 22, 2728–2742. [Google Scholar] [CrossRef]
- Barroso, E.M.; Bakker Schut, T.C.; Caspers, P.J.; Santos, I.P.; Wolvius, E.B.; Koljenović, S.; Puppels, G.J. Characterization and Subtraction of Luminescence Background Signals in High-Wavenumber Raman Spectra of Human Tissue. J. Raman Spectrosc. 2018, 49, 699–709. [Google Scholar] [CrossRef] [Green Version]
- Penel, G.; Leroy, G.; Rey, C.; Bres, E. MicroRaman Spectral Study of the PO4 and CO3 Vibrational Modes in Synthetic and Biological Apatites. Calcif. Tissue Int. 1998, 63, 475–481. [Google Scholar] [CrossRef] [PubMed]
- Mihály, J.; Gombás, V.; Afishah, A.; Mink, J. FT-Raman Investigation of Human Dental Enamel Surfaces. J. Raman Spectrosc. 2009, 40, 898–902. [Google Scholar] [CrossRef]
- Zelic, K.; Milovanovic, P.; Rakocevic, Z.; Askrabic, S.; Potocnik, J.; Popovic, M.; Djuric, M. Nano-Structural and Compositional Basis of Devitalized Tooth Fragility. Dent. Mater. 2014, 30, 476–486. [Google Scholar] [CrossRef] [PubMed]
- Bērziņš, K.; Sutton, J.J.; Loch, C.; Beckett, D.; Wheeler, B.J.; Drummond, B.K.; Fraser-Miller, S.J.; Gordon, K.C. Application of Low-wavenumber Raman Spectroscopy to the Analysis of Human Teeth. J. Raman Spectrosc. 2019, 50, 1375–1387. [Google Scholar] [CrossRef]
- Sowa, M.G.; Popescu, D.P.; Werner, J.; Hewko, M.; Ko, A.C.-T.; Payette, J.; Dong, C.C.S.; Cleghorn, B.; Choo-Smith, L.-P. Precision of Raman Depolarization and Optical Attenuation Measurements of Sound Tooth Enamel. Anal. Bioanal. Chem. 2006, 387, 1613–1619. [Google Scholar] [CrossRef]
- Savchyn, P.; Karbovnyk, I.; Vistovskyy, V.; Voloshinovskii, A.; Pankratov, V.; Cestelli Guidi, M.; Mirri, С.; Myahkota, O.; Riabtseva, A.; Mitina, N.; et al. Vibrational Properties of LaPO4 Nanoparticles in Mid- and Far-Infrared Domain. J. Appl. Phys. 2012, 112, 124309. [Google Scholar] [CrossRef]
- Londoño-Restrepo, S.M.; Zubieta-Otero, L.F.; Jeronimo-Cruz, R.; Mondragon, M.A.; Rodriguez-García, M.E. Effect of the Crystal Size of Biogenic Hydroxyapatites on IR and Raman Spectra. arXiv 2018. [Google Scholar] [CrossRef] [Green Version]
- Jegova, G.; Titorenkova, R.; Rashkova, M.; Mihailova, B. Raman and IR Reflection Micro-Spectroscopic Study of Er:YAG Laser Treated Permanent and Deciduous Human Teeth. J. Raman Spectrosc. 2013, 44, 1483–1490. [Google Scholar] [CrossRef]
- Taylor, E.A.; Donnelly, E. Raman and Fourier Transform Infrared Imaging for Characterization of Bone Material Properties. Bone 2020, 139, 115490. [Google Scholar] [CrossRef]
- Saber-Samandari, S.; Alamara, K.; Saber-Samandari, S.; Gross, K.A. Micro-Raman Spectroscopy Shows How the Coating Process Affects the Characteristics of Hydroxylapatite. Acta Biomater. 2013, 9, 9538–9546. [Google Scholar] [CrossRef] [PubMed]
- Rey, C.; Marsan, O.; Combes, C.; Drouet, C.; Grossin, D.; Sarda, S. Characterization of Calcium Phosphates Using Vibrational Spectroscopies. In Advances in Calcium Phosphate Biomaterials; Springer Series in Biomaterials Science and Engineering; Springer: Berlin/Heidelberg, Germany, 2014; pp. 229–266. ISBN 978-3-642-53979-4. [Google Scholar]
- Karampas, I.A.; Kontoyannis, C.G. Characterization of Calcium Phosphates Mixtures. Vib. Spectrosc. 2013, 64, 126–133. [Google Scholar] [CrossRef]
- Shah, F.A. Characterization of Synthetic Hydroxyapatite Fibers Using High-Resolution, Polarized Raman Spectroscopy. Appl. Spectrosc. 2021, 75, 475–479. [Google Scholar] [CrossRef] [PubMed]
- Penel, G.; Delfosse, C.; Rey, C.; Hardouin, P.; Jeanfils, J.; Delecourt, C.; Lemaître, J.; Leroy, G. Raman Microspectrometry Studies of Calcified Tissues and Related Biomaterials. Dent. Med. Probl. 2003, 40, 37–43. [Google Scholar]
- De Aza, P.N.; Guitián, F.; Santos, C.; de Aza, S.; Cuscó, R.; Artús, L. Vibrational Properties of Calcium Phosphate Compounds. 2. Comparison between Hydroxyapatite and β-Tricalcium Phosphate. Chem. Mater. 1997, 9, 916–922. [Google Scholar] [CrossRef]
- Quillard, S.; Mellier, C.; Gildenhaar, R.; Hervelin, J.; Deniard, P.; Berger, G.; Bouler, J.M. Raman and Infrared Studies of Substituted β-TCP. KEM 2011, 493–494, 225–230. [Google Scholar] [CrossRef]
- Kim, D.-H.; Hwang, K.-H.; Lee, J.D.; Park, H.-C.; Yoon, S.-Y. Long and Short Range Order Structural Analysis of In-Situ Formed Biphasic Calcium Phosphates. Biomater. Res. 2015, 19, 14. [Google Scholar] [CrossRef] [PubMed] [Green Version]
- Stammeier, J.A.; Purgstaller, B.; Hippler, D.; Mavromatis, V.; Dietzel, M. In-Situ Raman Spectroscopy of Amorphous Calcium Phosphate to Crystalline Hydroxyapatite Transformation. MethodsX 2018, 5, 1241–1250. [Google Scholar] [CrossRef] [PubMed]
- Montes-Hernandez, G.; Renard, F. Nucleation of Brushite and Hydroxyapatite from Amorphous Calcium Phosphate Phases Revealed by Dynamic In Situ Raman Spectroscopy. J. Phys. Chem. C 2020, 124, 15302–15311. [Google Scholar] [CrossRef]
- Crane, N.J.; Popescu, V.; Morris, M.D.; Steenhuis, P.; Ignelzi, M.A., Jr. Raman Spectroscopic Evidence for Octacalcium Phosphate and Other Transient Mineral Species Deposited during Intramembranous Mineralization. Bone 2006, 39, 434–442. [Google Scholar] [CrossRef]
- Quillard, S.; Mevellec, J.-Y.; Deniard, P.; Bouler, J.-M.; Buisson, J.-P. Polarized Raman Spectra of Brushite (CaHPO4.2H2O) Crystal. Investigation of the Phosphate Stretching Modes, Study of the LOTO Splitting. J. Raman Spectrosc. 2016, 47, 971–977. [Google Scholar] [CrossRef]
- Pazderka, T.; Kopecký, V. Drop Coating Deposition Raman Spectroscopy of Proteinogenic Amino Acids Compared with Their Solution and Crystalline State. Spectrochim. Acta Part. A Mol. Biomol. Spectrosc. 2017, 185, 207–216. [Google Scholar] [CrossRef]
- Freire, P.T.C.; Barboza, F.M.; Lima, J.A.; Melo, F.E.A.; Filho, J.M. Raman Spectroscopy of Amino Acid Crystals. In Raman Spectroscopy and Applications; Maaz, K., Ed.; InTech: London, UK, 2017; ISBN 978-953-51-2907-3. [Google Scholar]
- Robinson, J.H.; Best, S.M. Comparison of Hydroxyapatite and AB-Type Carbonate-Substituted Hydroxyapatite Suspensions for Use in the Reticulated Foam Method of Scaffold Production. Key Eng. Mater. 2009, 396–398, 649–652. [Google Scholar] [CrossRef]
- Ulian, G.; Moro, D.; Valdrè, G. Hydroxylapatite and Related Minerals in Bone and Dental Tissues: Structural, Spectroscopic and Mechanical Properties from a Computational Perspective. Biomolecules 2021, 11, 728. [Google Scholar] [CrossRef]
- Seredin, P.; Goloshchapov, D.; Ippolitov, Y.; Vongsvivut, J. Comparative Analysis of Dentine and Gingival Fluid Molecular Composition and Protein Conformations during Development of Dentine Caries: A Pilot Study. Vib. Spectrosc. 2020, 108, 103058. [Google Scholar] [CrossRef]
- Seredin, P.; Goloshchapov, D.; Ippolitov, Y. Jitraporn Vongsvivut Spectroscopic Signature of the Pathological Processes of Carious Dentine Based on FTIR Investigations of the Oral Biological Fluids. Biomed. Opt. Express BOE 2019, 10, 4050–4058. [Google Scholar] [CrossRef] [PubMed]
- Dorozhkin, S.V. Calcium Orthophosphates (CaPO4): Occurrence and Properties. Prog. Biomater. 2016, 5, 9–70. [Google Scholar] [CrossRef] [PubMed] [Green Version]
- Ramírez-Rodríguez, G.B.; Delgado-López, J.M.; Gómez-Morales, J. Evolution of Calcium Phosphate Precipitation in Hanging Drop Vapor Diffusion by in Situ Raman Microspectroscopy. CrystEngComm 2013, 15, 2206–2212. [Google Scholar] [CrossRef]
- Spencer, P.; Ye, Q.; Kamathewatta, N.J.B.; Woolfolk, S.K.; Bohaty, B.S.; Misra, A.; Tamerler, C. Chemometrics-Assisted Raman Spectroscopy Characterization of Tunable Polymer-Peptide Hybrids for Dental Tissue Repair. Front. Mater. 2021, 8, 137. [Google Scholar] [CrossRef] [PubMed]
- Grunenwald, A.; Keyser, C.; Sautereau, A.M.; Crubézy, E.; Ludes, B.; Drouet, C. Revisiting Carbonate Quantification in Apatite (Bio)Minerals: A Validated FTIR Methodology. J. Archaeol. Sci. 2014, 49, 134–141. [Google Scholar] [CrossRef]


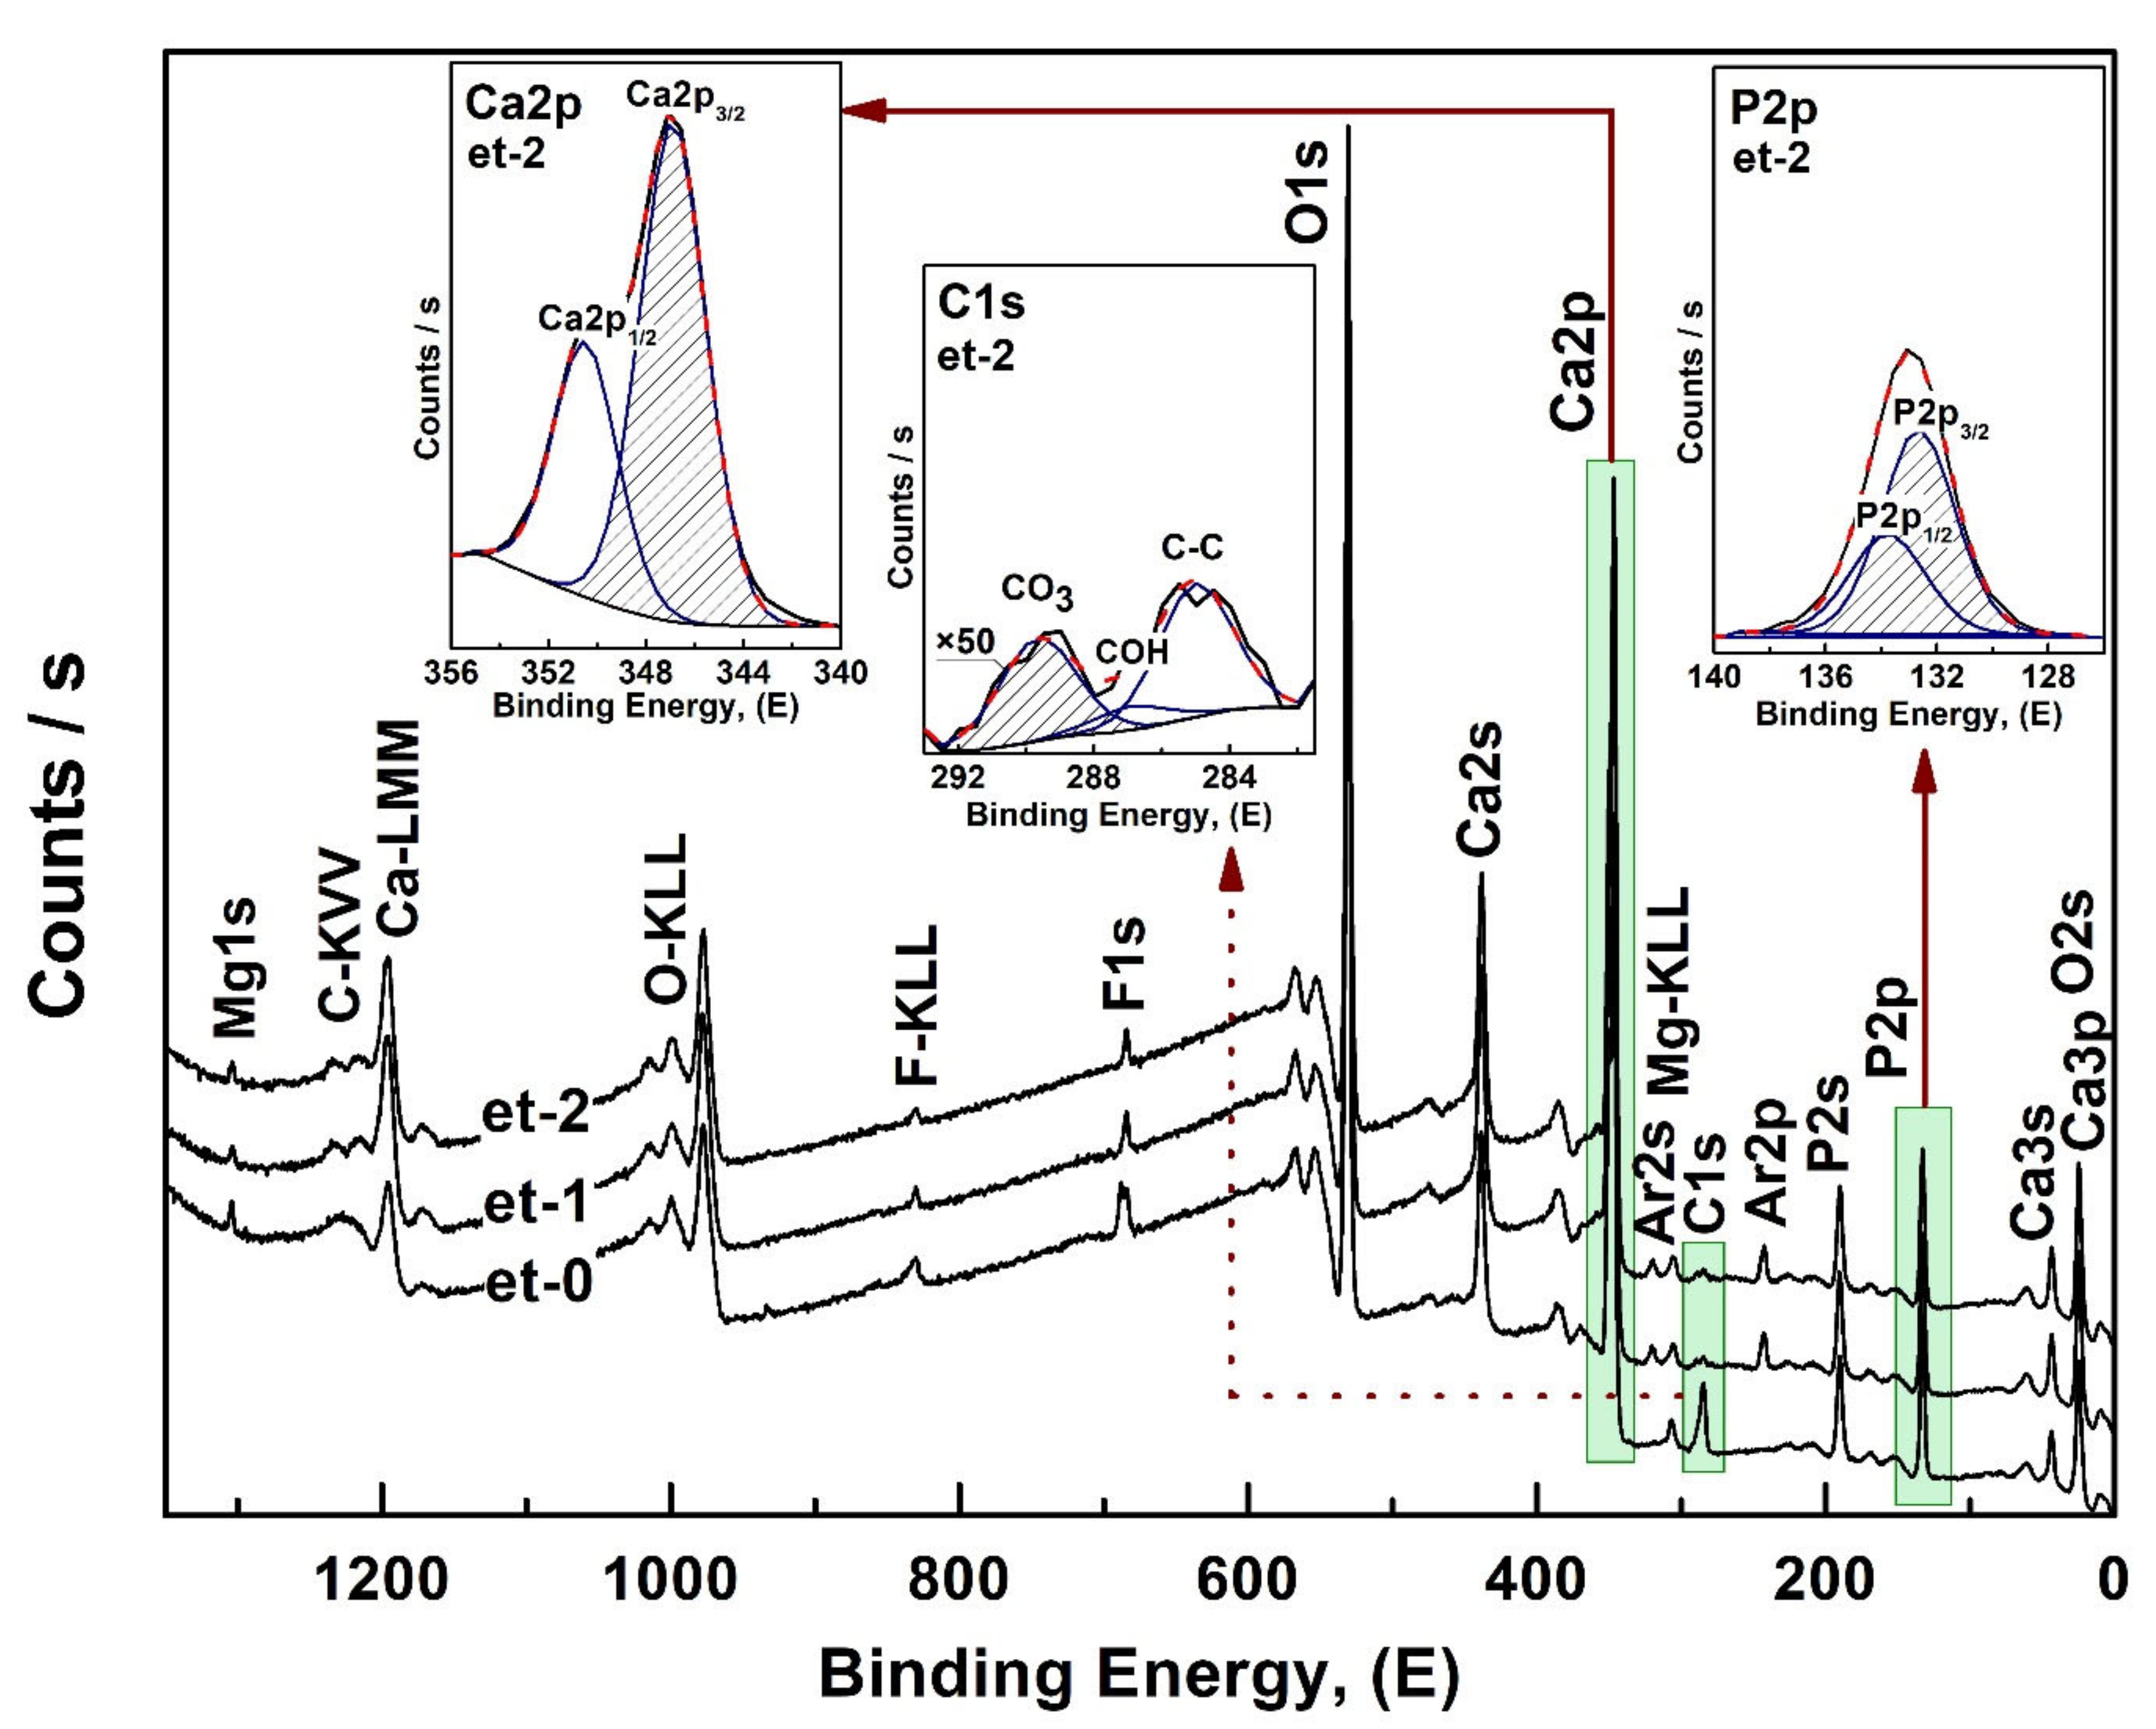
| Samples | Description | Ca/P (Estimated) |
|---|---|---|
| CHAp-1 | carbonate substituted hydroxyapatite 1 | 1.95 ± 0.05 |
| CHAp-2 | carbonate substituted hydroxyapatite 2 | 1.85 ± 0.05 |
| CHAp-3 | carbonate substituted hydroxyapatite 3 | 1.75 ± 0.05 |
| BHN-1 | CHAp-2 (~95%) + a set of basic polar amino acids (~5%) | 1.85 ± 0.05 |
| BHN-2 | CHAp-2 (~75%) + a set of basic polar amino acids (~25%) | 1.85 ± 0.05 |
| Sample | CHAp-1 | CHAp-2 | CHAp-3 | BHN-1 | BHN-2 |
|---|---|---|---|---|---|
| 27.8 ± 1.11% | 34.8 ± 1.42% | 36.1 ± 1.48% | 34.7 ± 1.40% | 34.8 ± 1.52% |
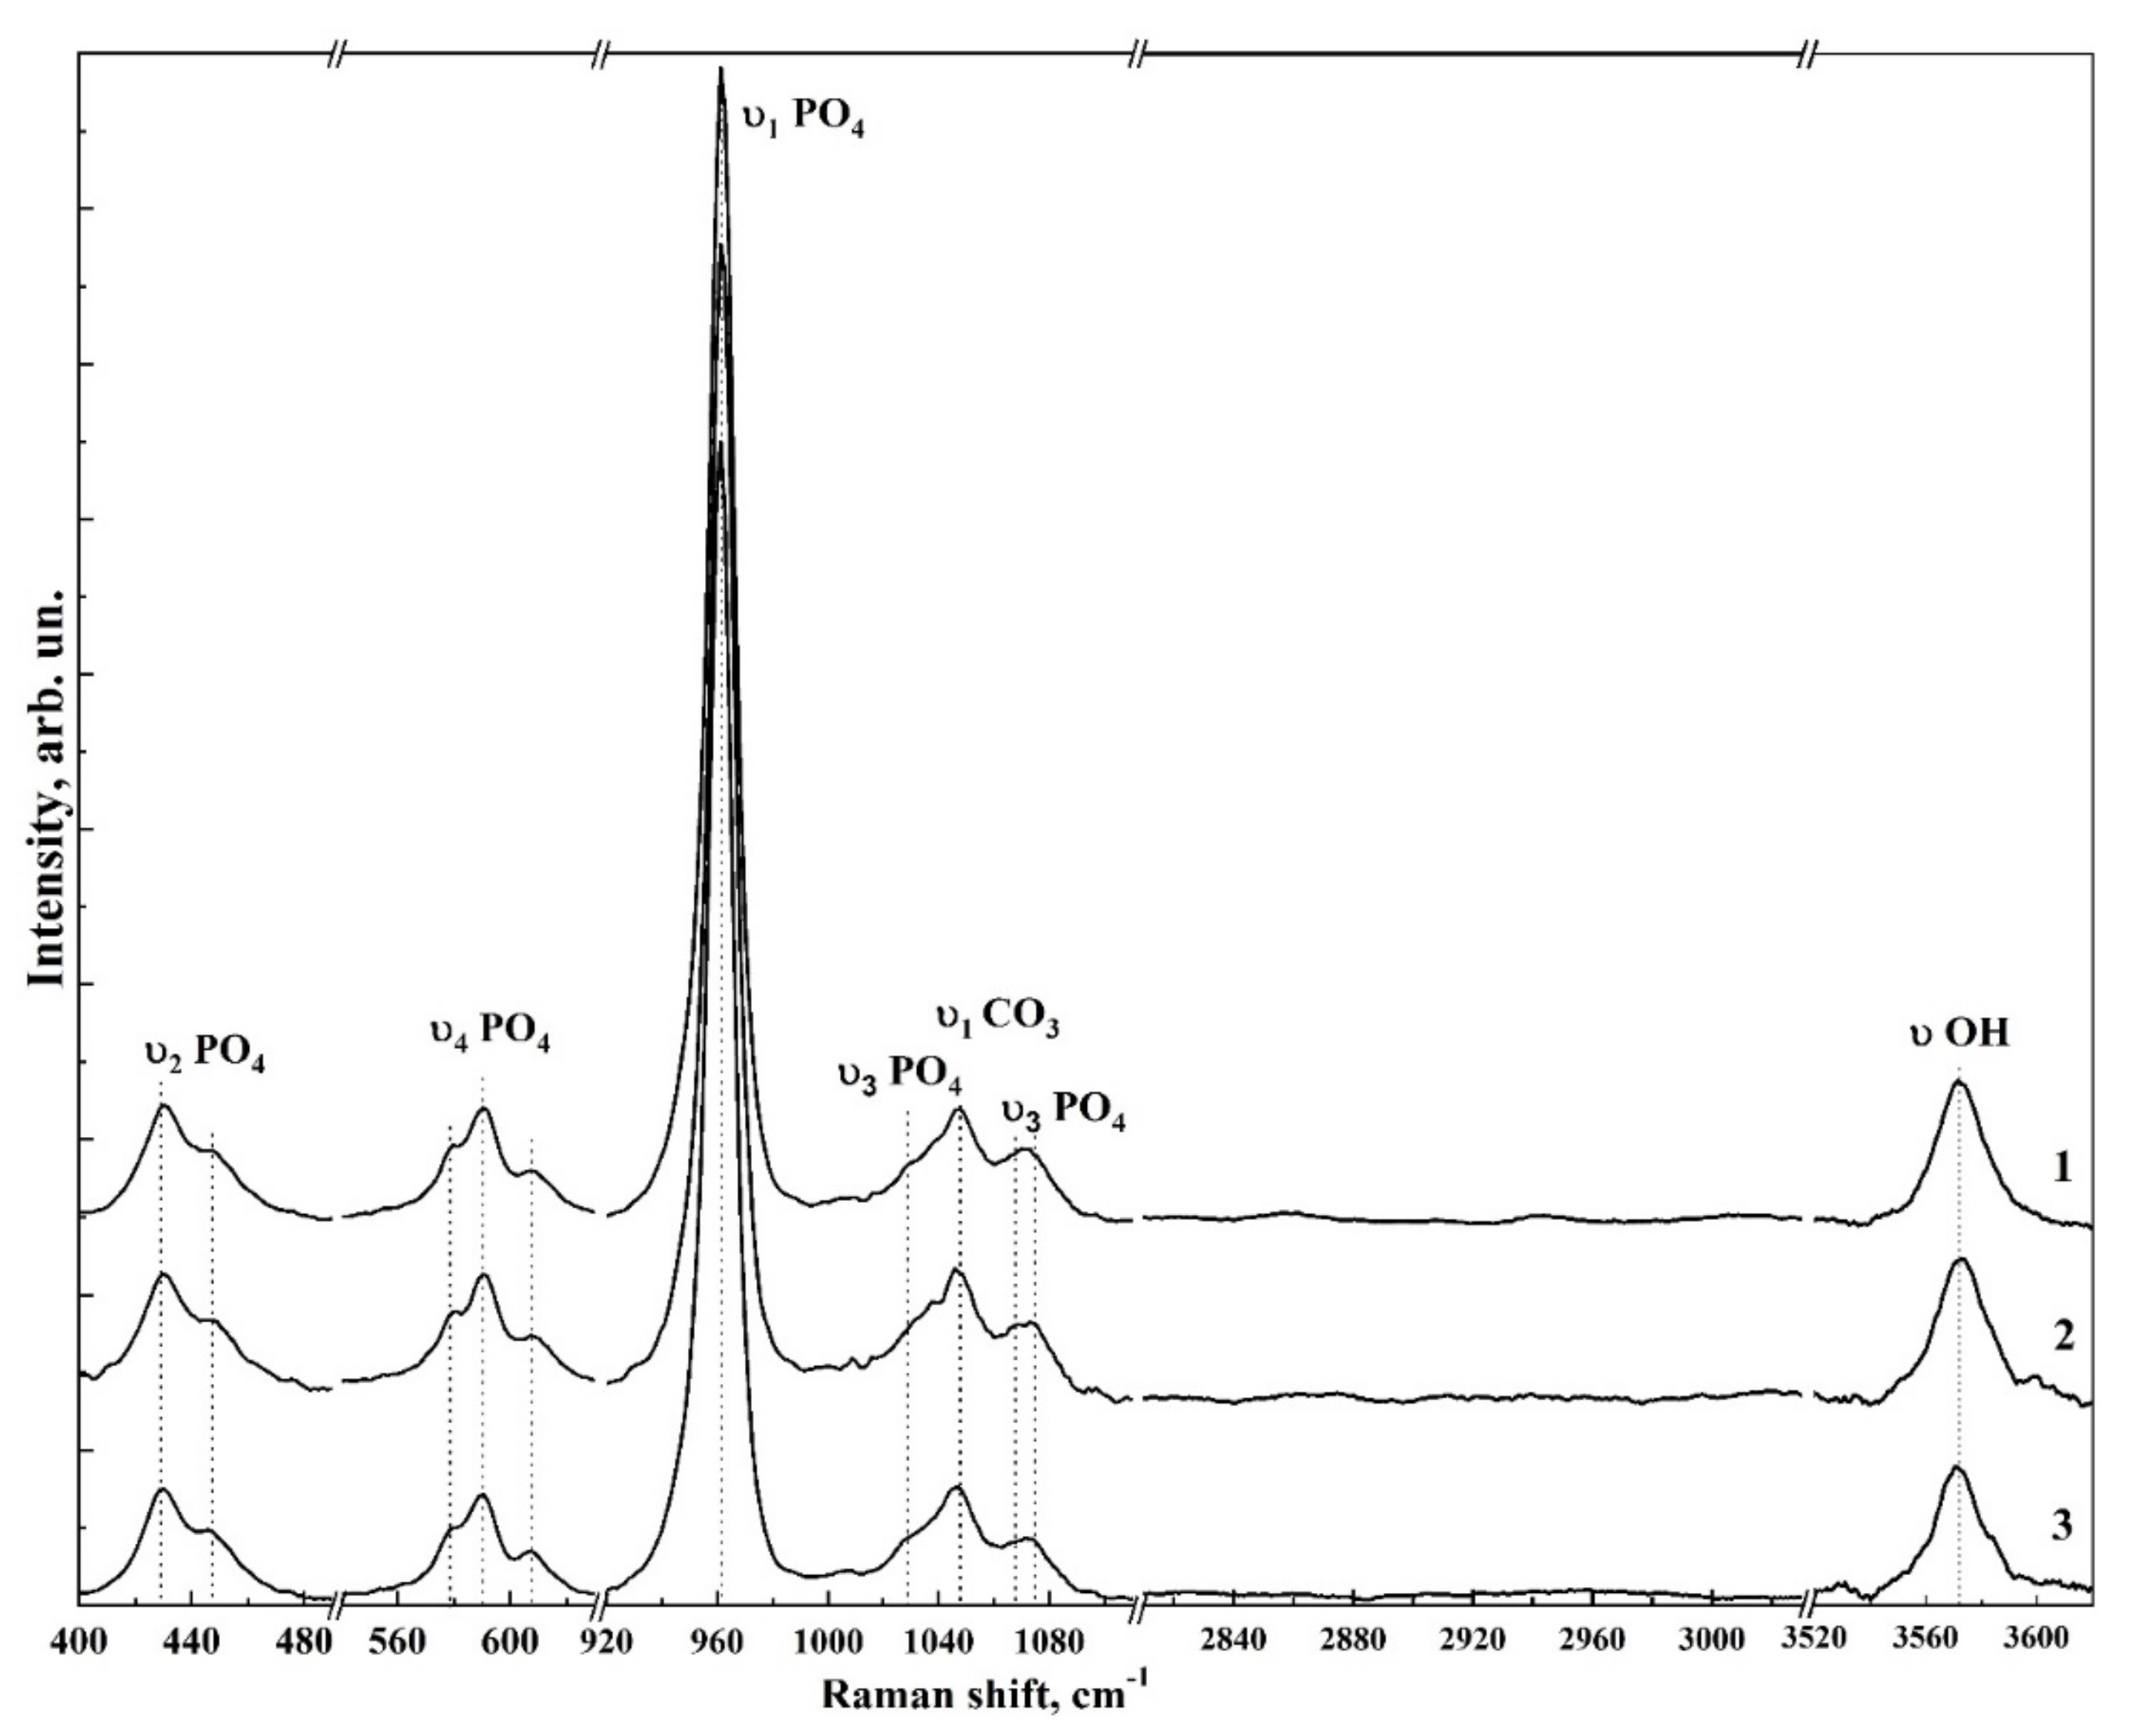
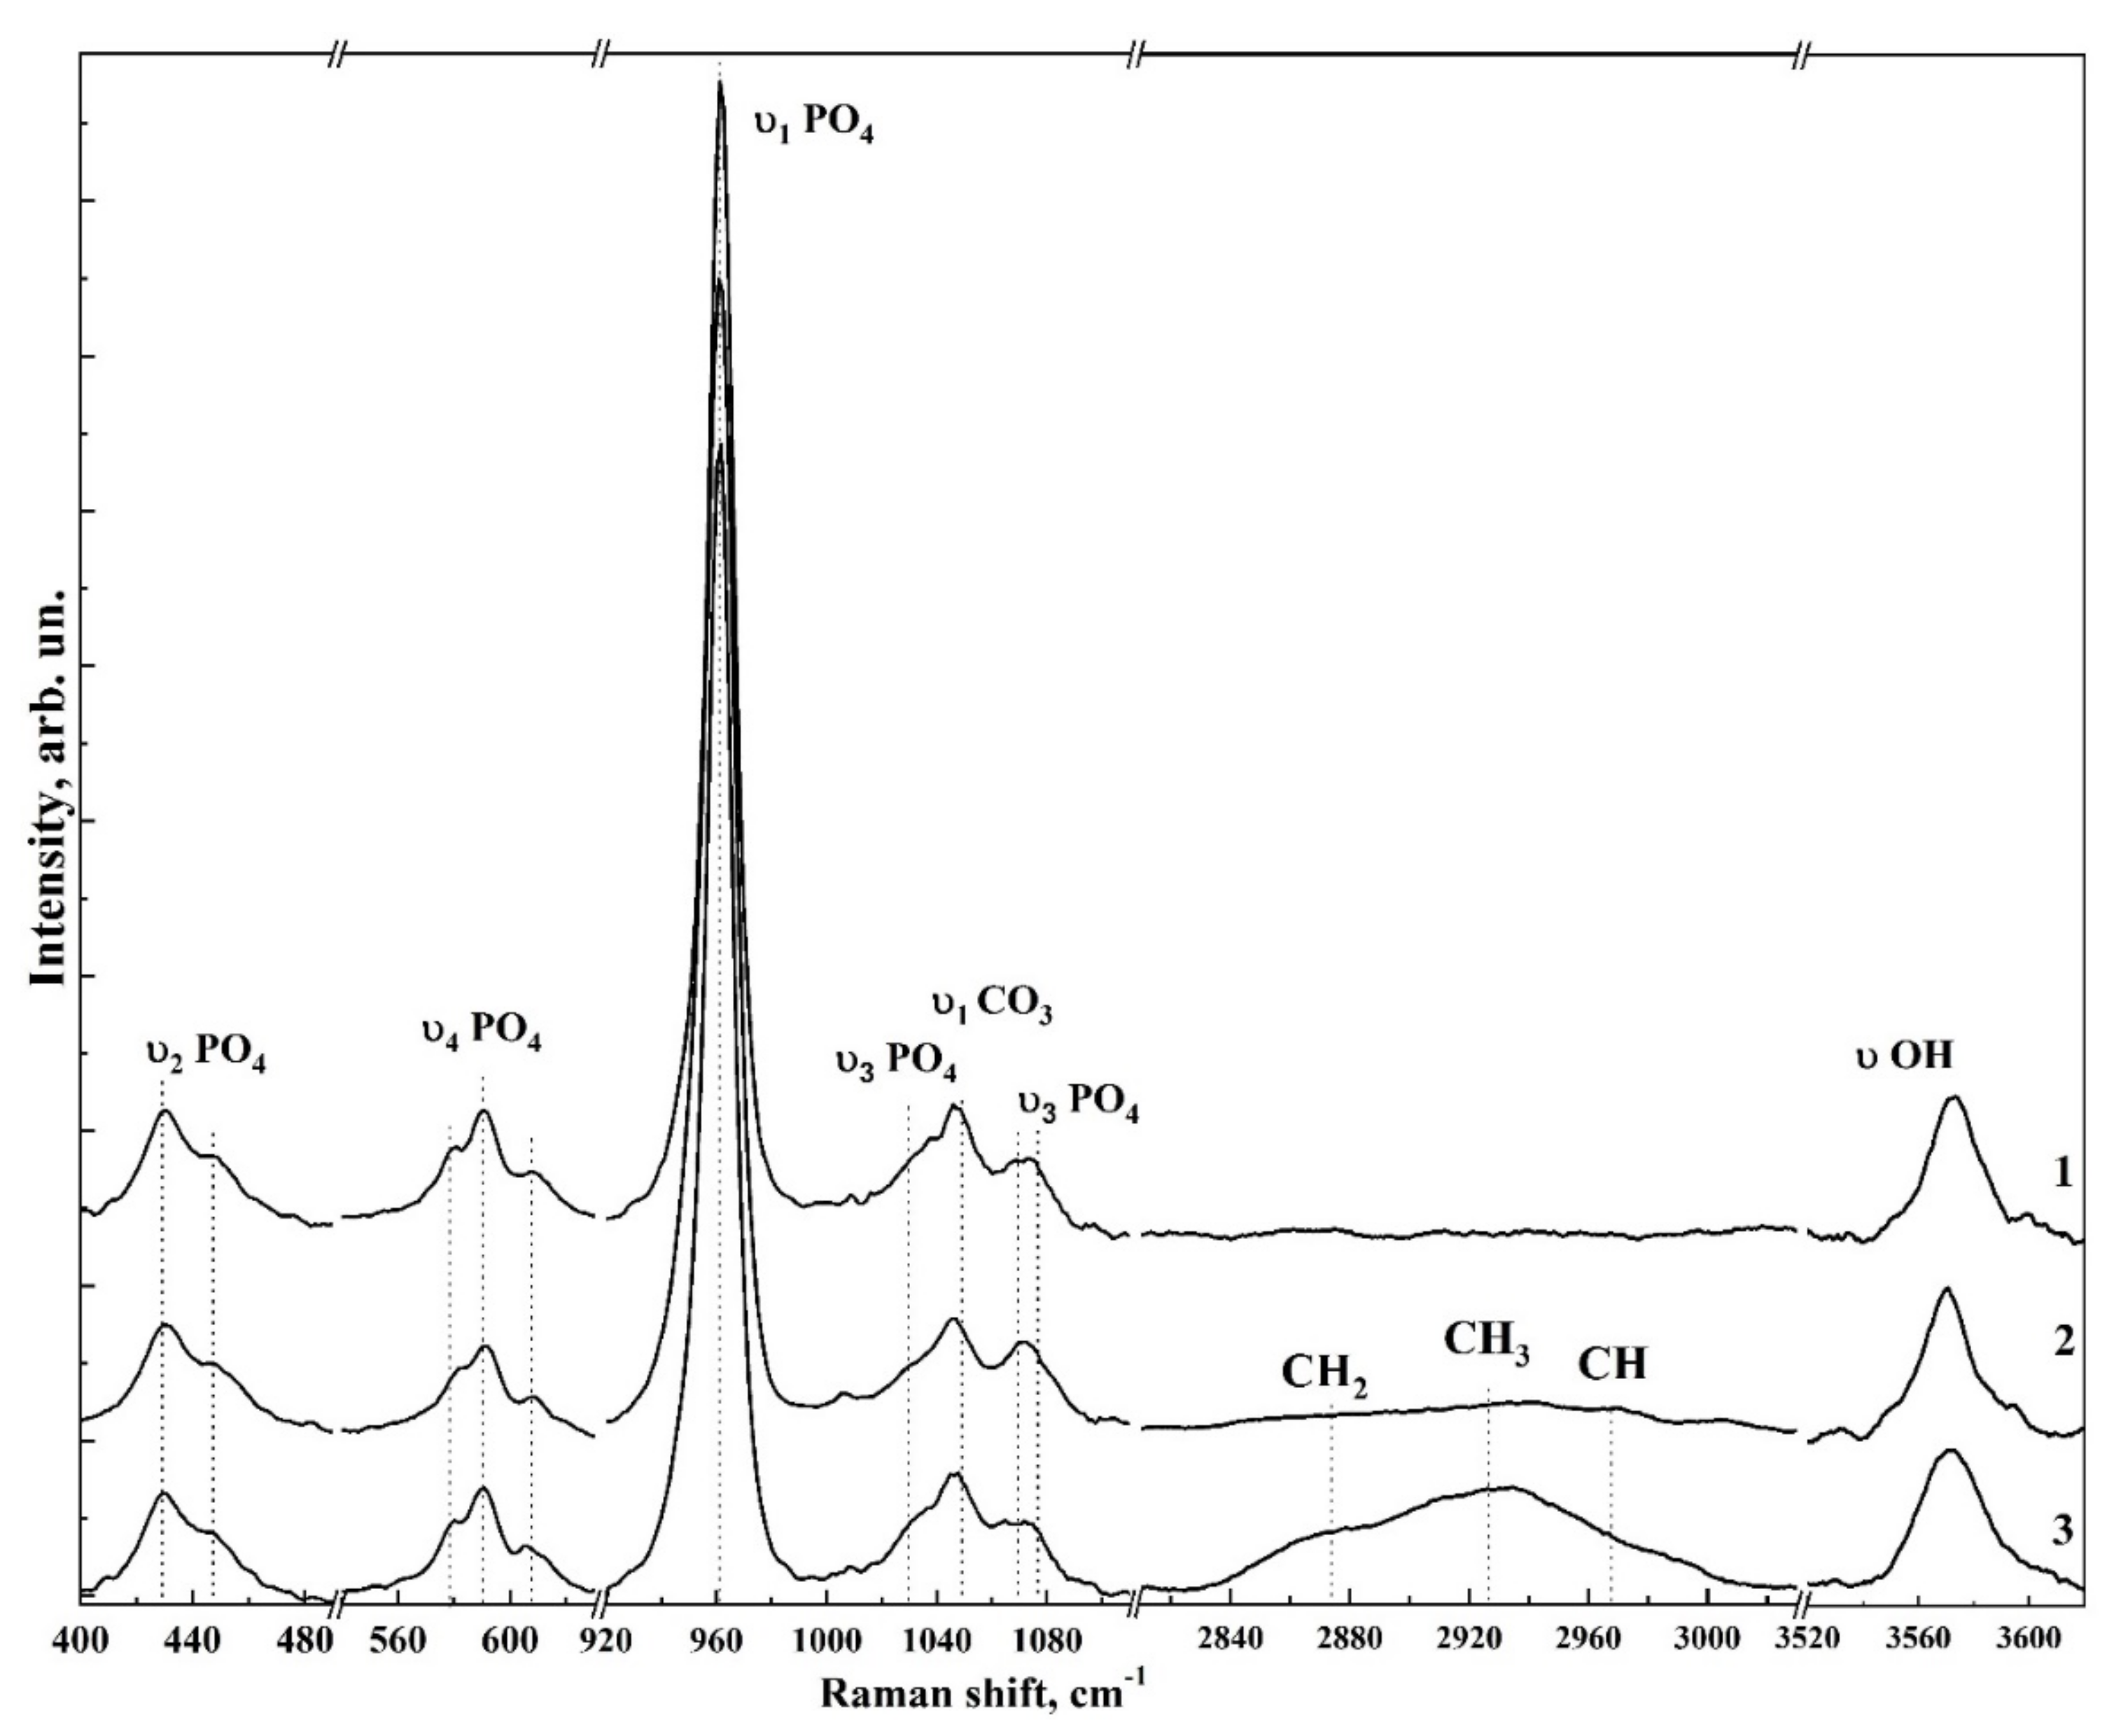
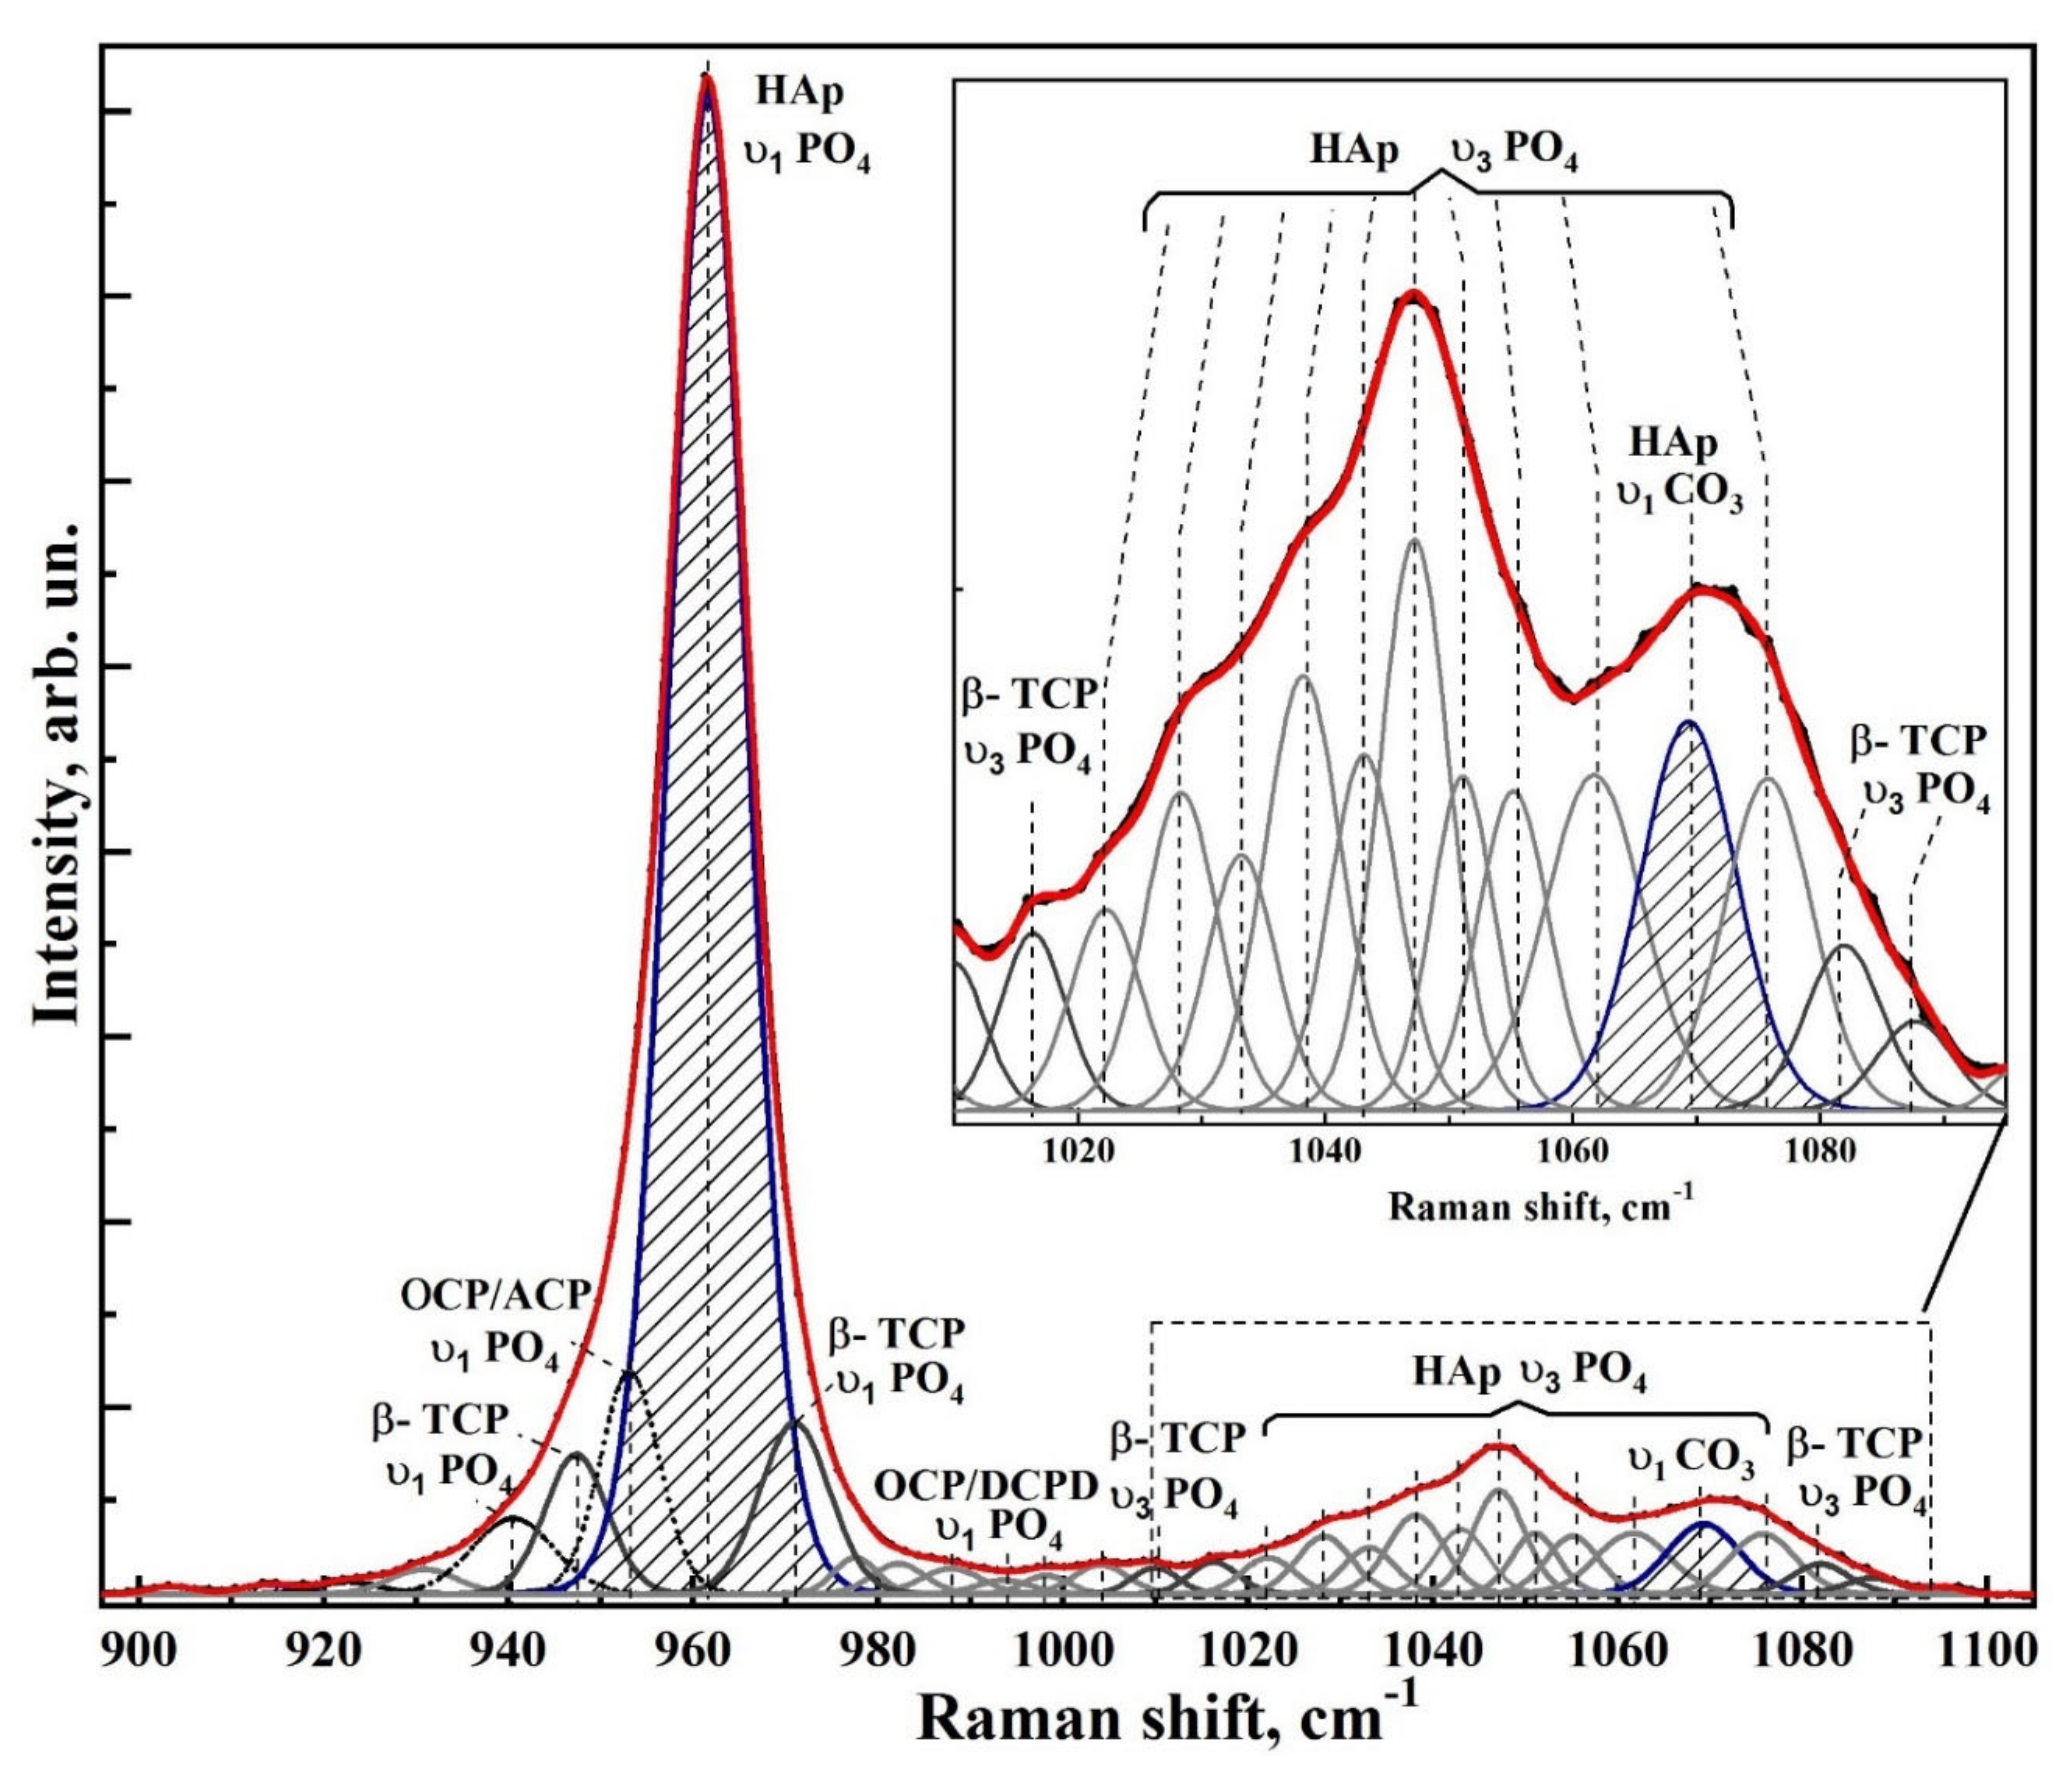
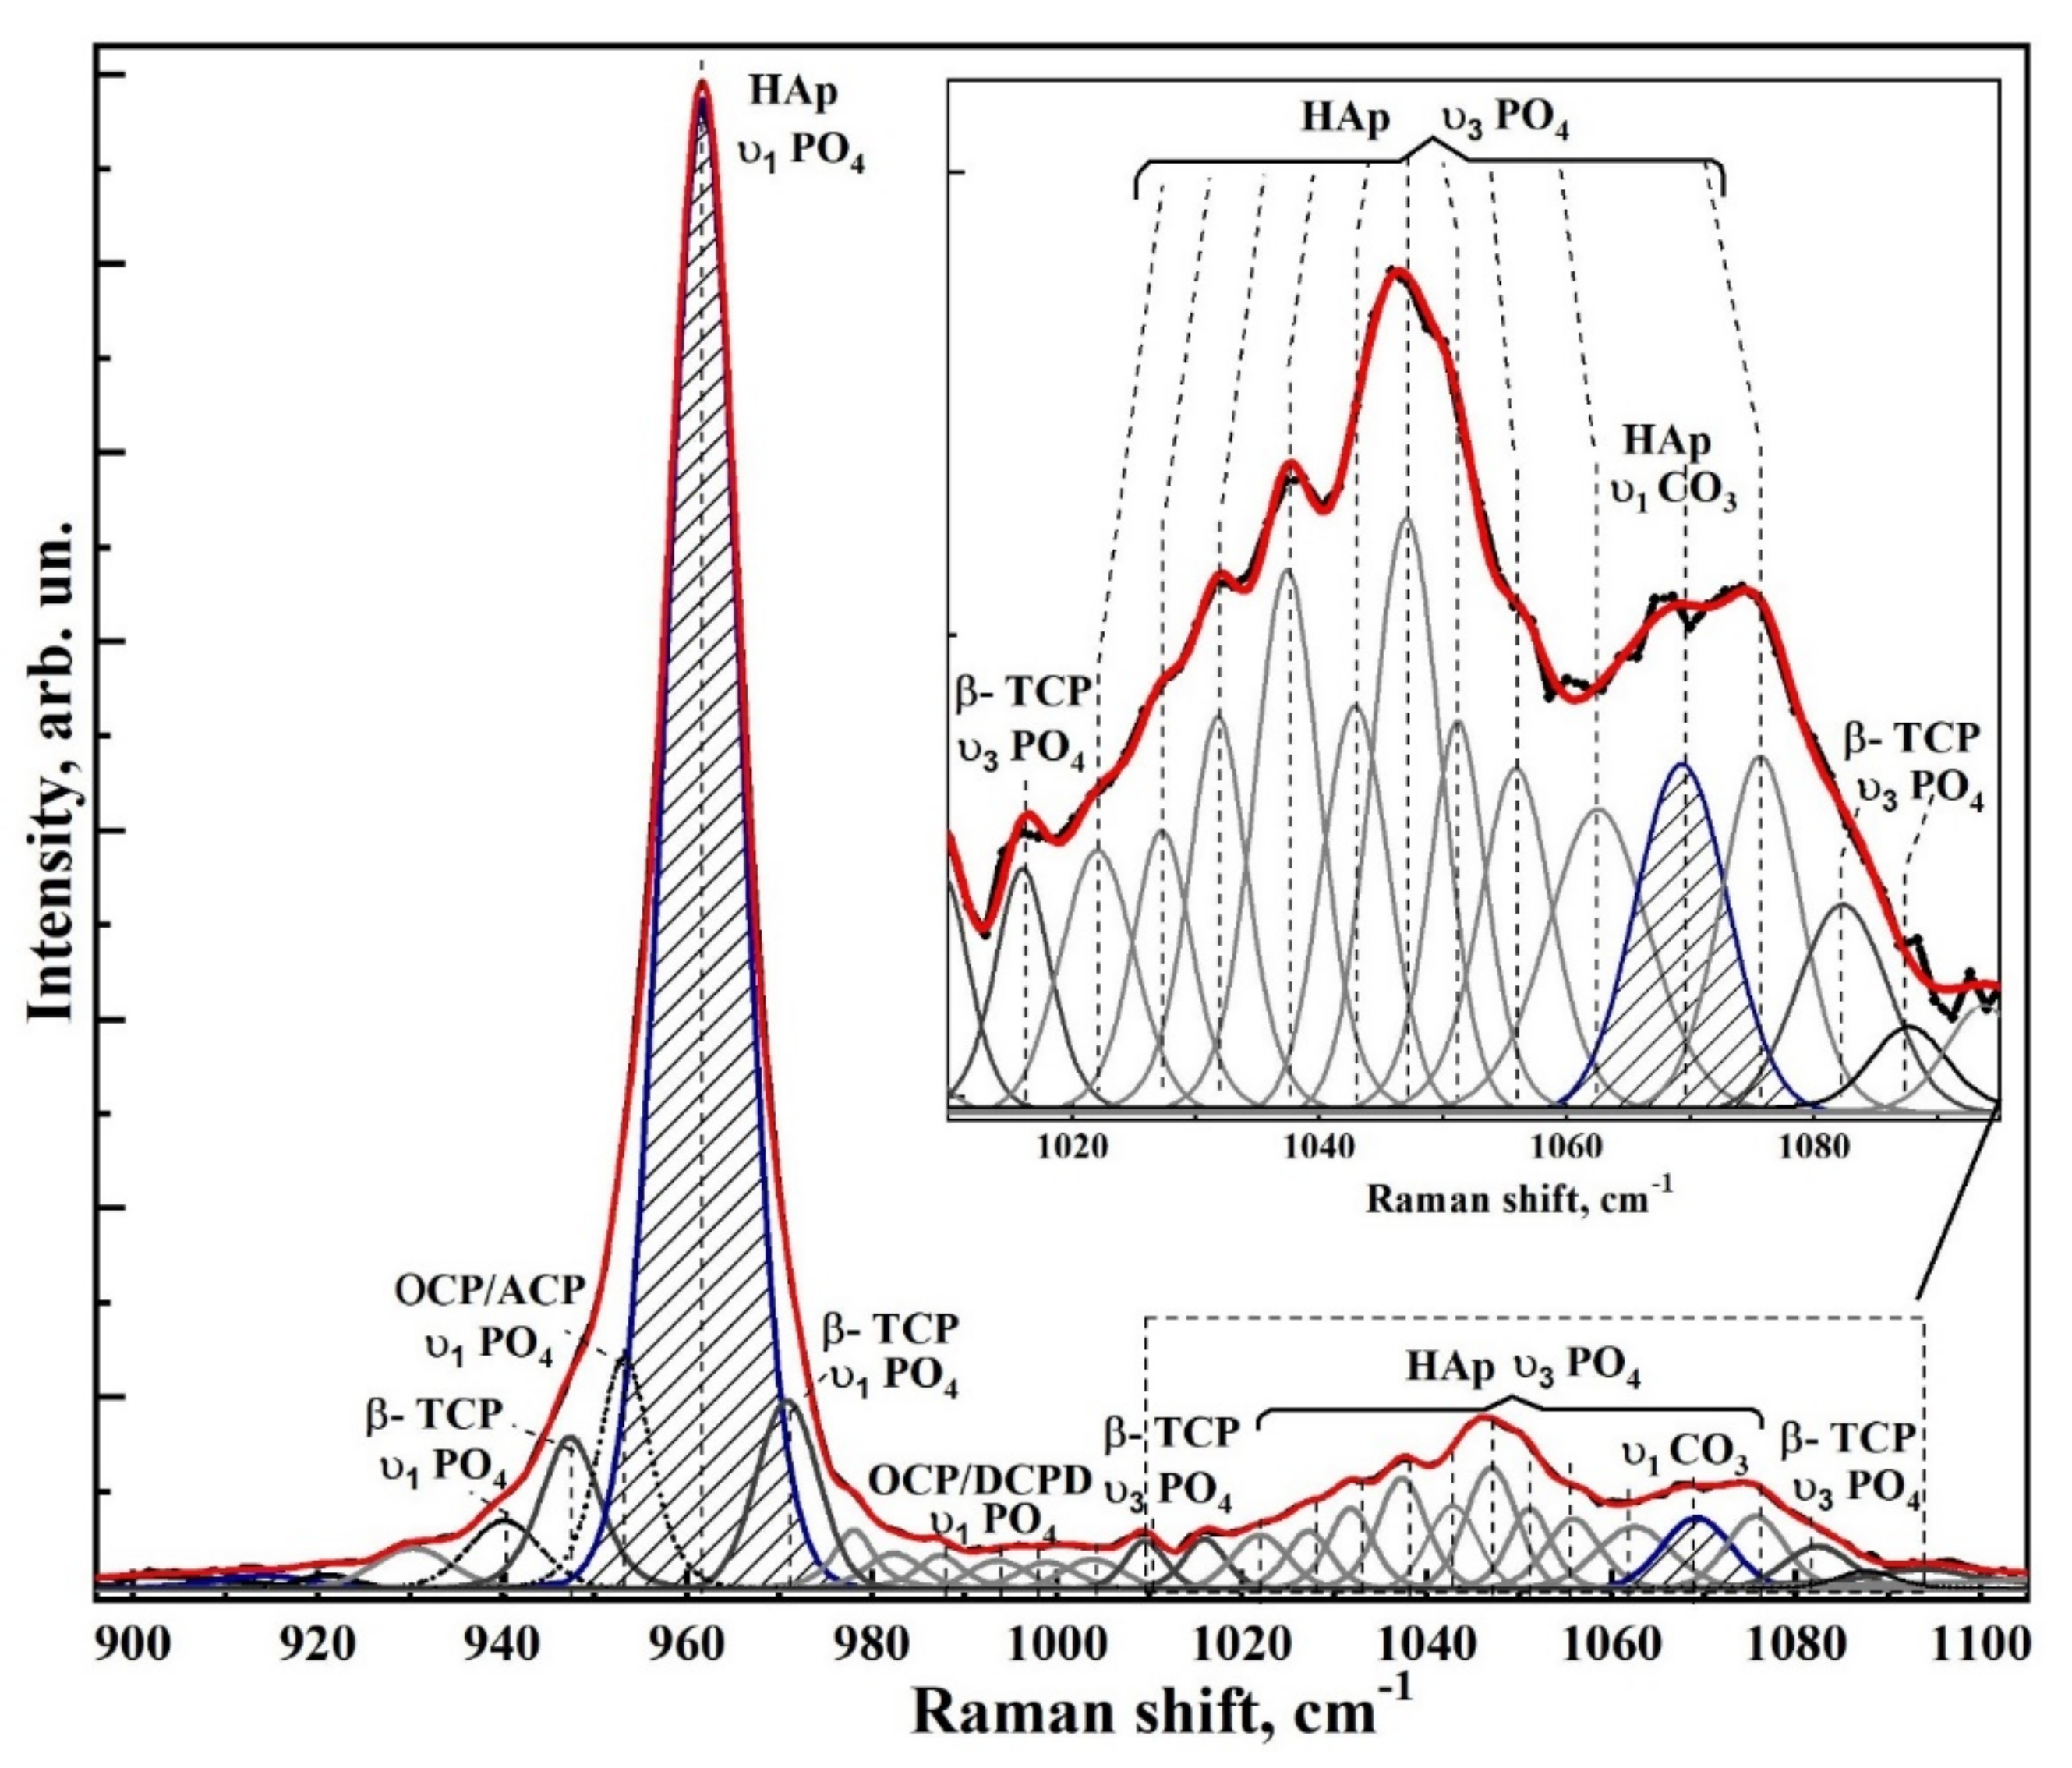
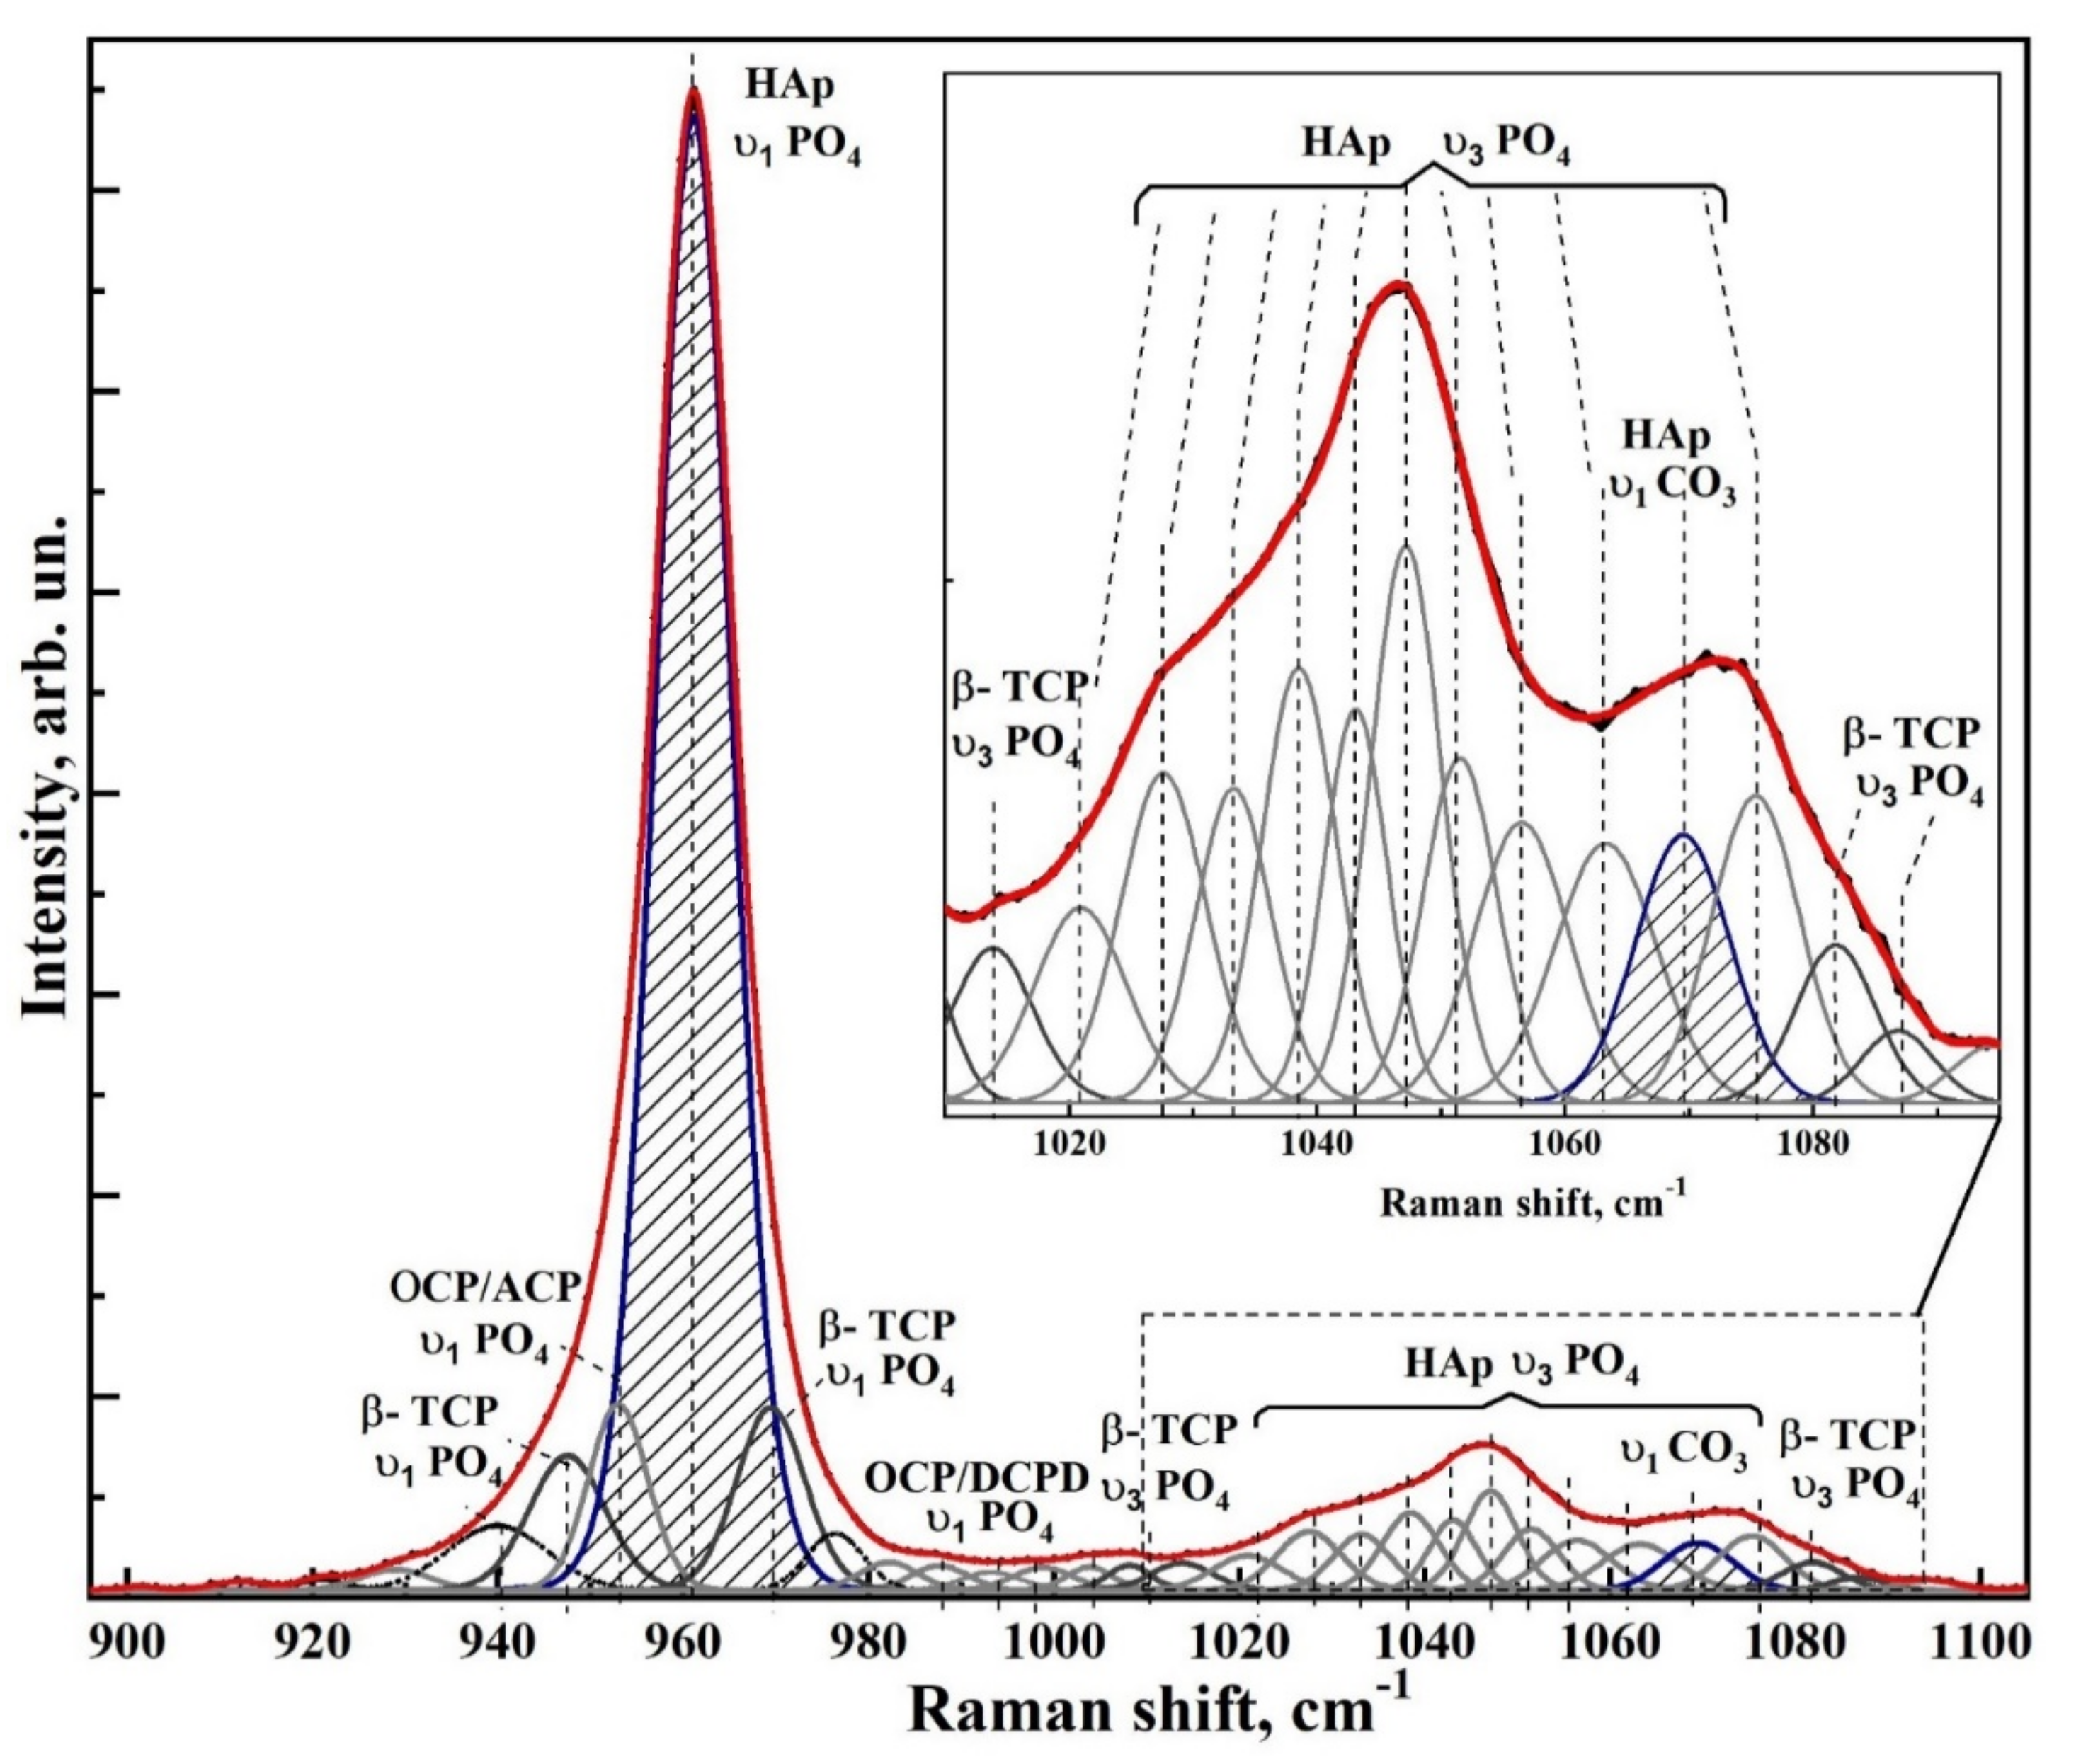
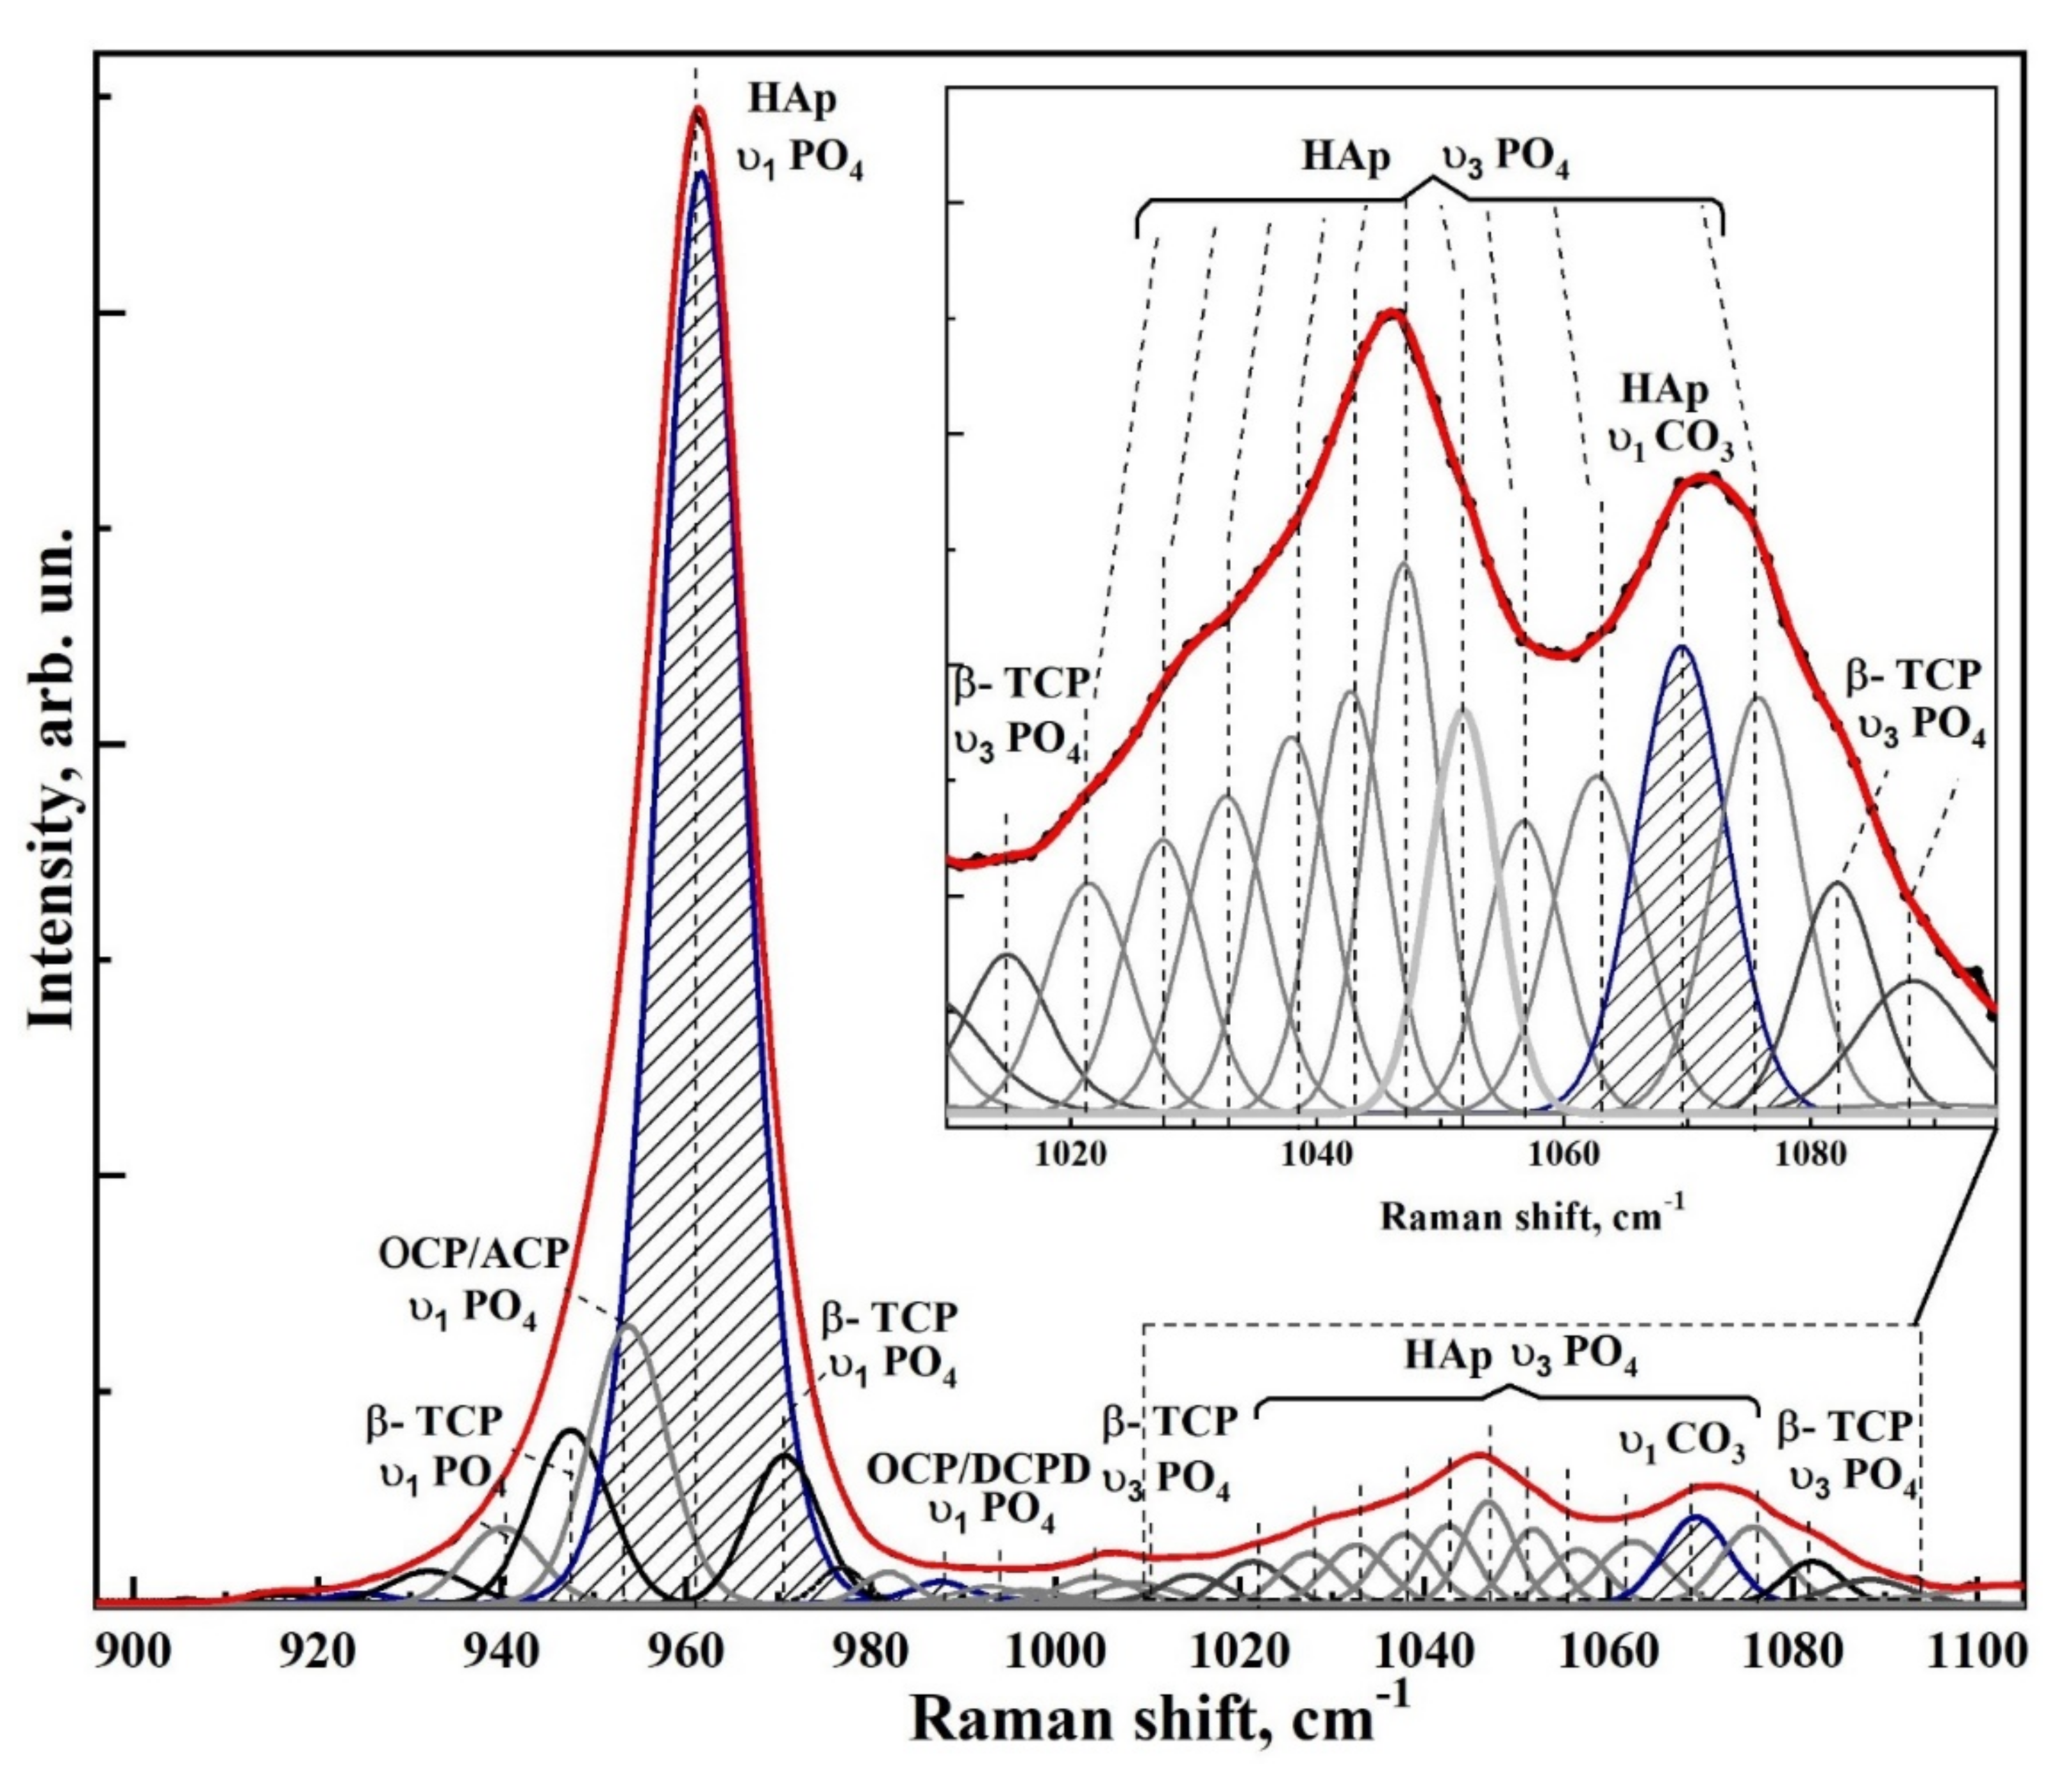
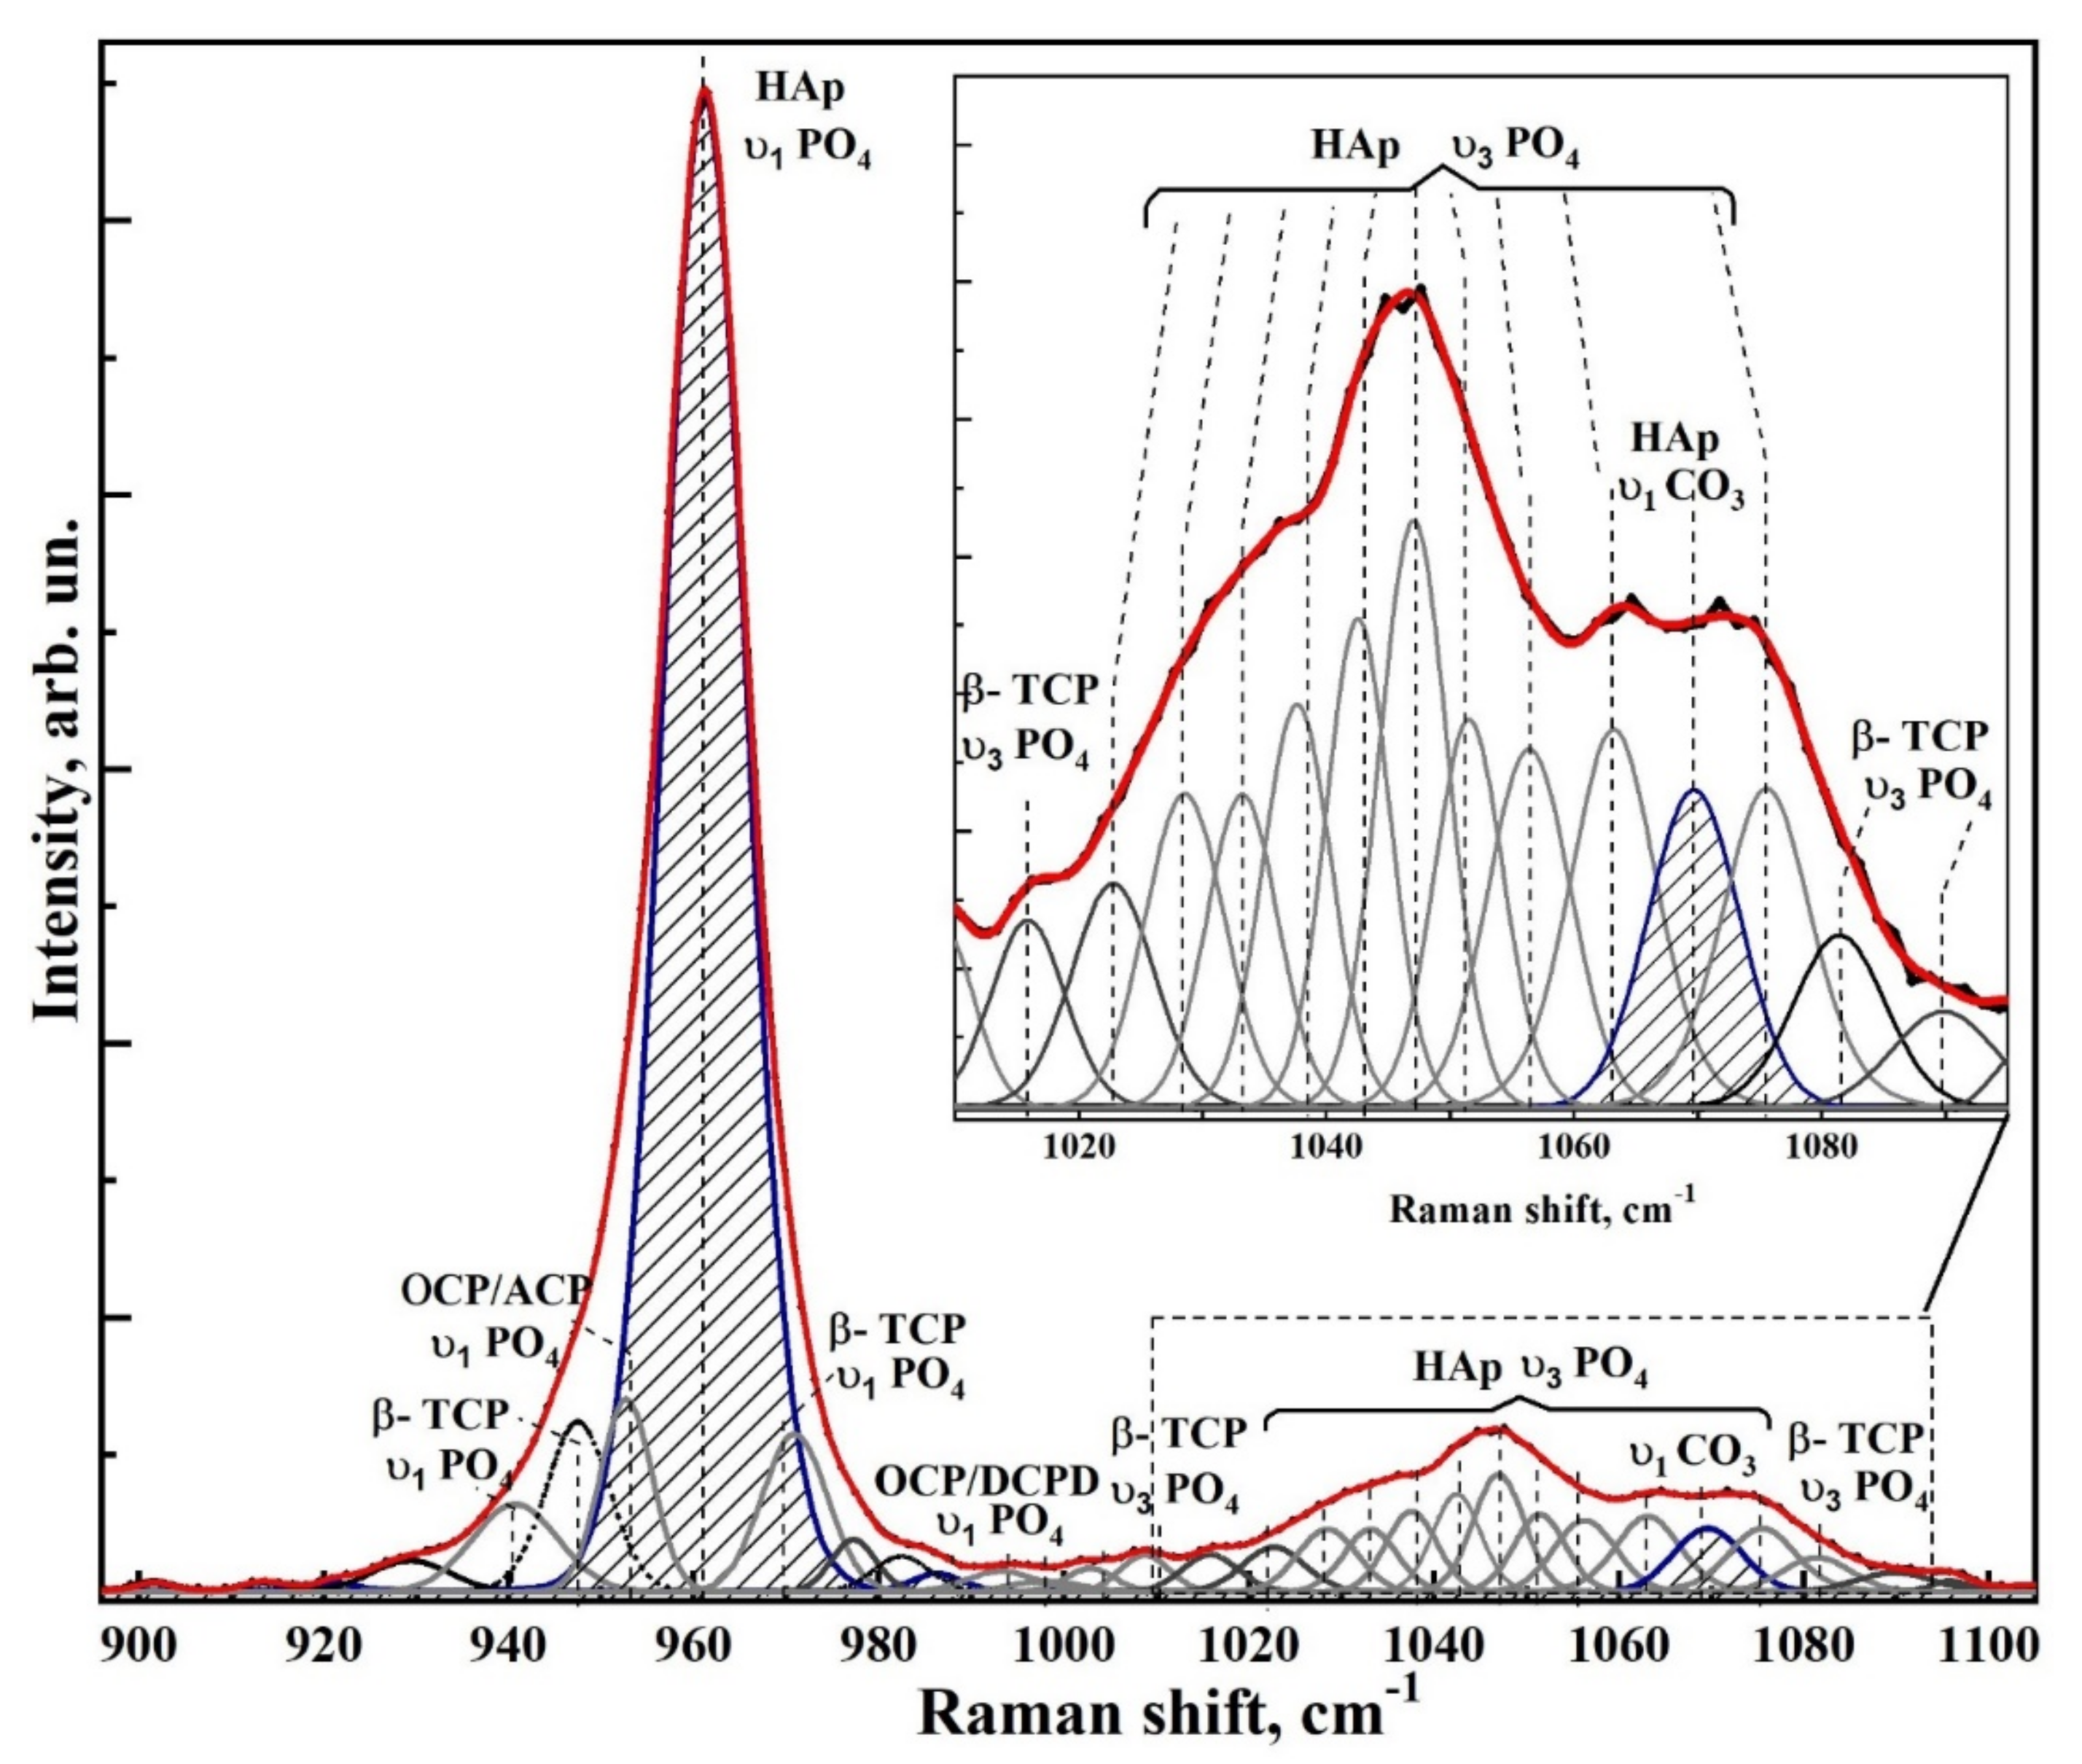
| Vibrations | Wavenumber, cm−1 | Assignment | References |
|---|---|---|---|
| υ2 PO43− HAp | 431 | O-P-O bending, υ2 | [25,28,29,59,64,65,67,68,69,70] |
| υ2 PO43− HAp | 447 | O-P-O bending, υ2 | [25,28,29,59,64,65,67,68,69,70] |
| υ4 PO43− HAp | 579 | O-P-O bending, υ4 | [25,28,29,59,64,65,67,68,69,70] |
| υ4 PO43− HAp | 590 | O-P-O bending, υ4 | [25,28,29,59,64,65,67,68,69,70] |
| υ4 PO43− HAp | 607 | O-P-O bending, υ4 | [25,28,29,59,64,65,67,68,69,70] |
| υ4 PO43− HAp | 614 | O-P-O bending, υ4 | [25,28,29,59,64,65,67,68,69,70] |
| υ1 PO43− ß-TCP | 938–940 | ß-tricalcium phosphate | [71,72] |
| υ1 PO43− ß-TCP | 948 | ß-tricalcium phosphate | [19,67,71,72,73] |
| υ1 PO43−ACP/OCP | 953–954 | amorphous calcium phosphate/octacalcium phosphate | [55,74,75,76] |
| υ1 PO43− HAp | 961–962 | P-O stretching | [25,28,29,59,64,65,67,68,69,70] |
| υ1 PO43− ß-TCP | 970–971 | ß-tricalcium phosphate (ß-TCP) | [19,67,71,72,73] |
| 977 | |||
| 982 | |||
| υ1 PO43−DCPD | 985–987 | Dicalcium phosphate dihydrate (DCPD) | [57,67,68,77] |
| υ1 PO43− OCPυ3 PO43− ß-TCP | 1004–1005 | octacalcium phosphate (OCP)/Dicalcium phosphate dihydrate (DCPD)/ß-tricalcium phosphate (ß-TCP) | [67,70,72,77] |
| υ1 PO43− OCP | 1009–1010 | octacalcium phosphate (OCP) | [67,68,77] |
| υ3 PO43− ß-TCP/OCP | 1014–1016 | octacalcium phosphate (OCP)/ß-tricalcium phosphate (ß-TCP) | [67] |
| υ3 PO43− HAp | 1025–1028 | P-O antysym stretching | [25,28,29,59,64,65,67,68,69,70] |
| υ3 PO43− HAp | 1033 | P-O antysym stretching | [25,28,29,59,64,65,67,68,69,70] |
| υ3 PO43− HAp | 1038–1040 | P-O antysym stretching | [25,28,29,59,64,65,67,68,69,70] |
| υ3 PO43− HAp | 1042 | P-O antysym stretching | [25,28,29,59,64,65,67,68,69,70] |
| υ3 PO43− HAp | 1047 | P-O antysym stretching | [25,28,29,59,64,65,67,68,69,70] |
| υ3 PO43− | 1051–1052 | P-O antysym stretching | [25,28,29,59,64,65,67,68,69,70] |
| υ3 PO43−ß-TCP/HAp | 1055 | P-O antysym stretching | [57,67,68,77] |
| υ3 PO43−ß-TCP/HAp | 1062–1063 | P-O antysym stretching | [25,28,29,59,64,65,67,68,69,70] |
| υ1 СO3 B-type | 1069–1070 | PO4 by CO3 substitution | [25,28,29,59,64,65,67,68,69,70] |
| υ3 PO43− | 1075–1076 | P-O antysym stretching | [25,28,29,59,64,65,67,68,69,70] |
| υ3 PO43−ß-TCP | 1081–1082 | P-O antysym stretching | [19,67,68,71,72,73] |
| υ3 PO43−DCPD | 1087–1088 | P-O antysym stretching | [67,77] |
| CH2 | 2870–2880 | Amino acid buster | [78,79] |
| CH3 | 2915–2935 | Amino acid buster | [78,79] |
| CH | 2960–2970 | Amino acid buster | [78,79] |
| hydroxyl OH group | 3570 | OH stretching | [25,28,29,59,64,65,67,68,69,70] |
| Sample | Raman Line Positions, cm−1 | υ1 PO43− Peak FWHM, cm−1 | Wt% (CO3) | |
|---|---|---|---|---|
| υ1 PO43− | υ1 CO3 B-type | |||
| CHAp-1 | 961.6 | 1069.3 | 9.97 | 1.85 |
| CHAp-2 | 961.7 | 1069.3 | 9.87 | 1.80 |
| CHAp-3 | 961.1 | 1069.5 | 9.70 | 1.71 |
| BHN-1 | 961.6 | 1069.5 | 11.1 | 1.84 |
| BHN-2 | 961.2 | 1069.7 | 10.7 | 1.75 |
Publisher’s Note: MDPI stays neutral with regard to jurisdictional claims in published maps and institutional affiliations. |
© 2022 by the authors. Licensee MDPI, Basel, Switzerland. This article is an open access article distributed under the terms and conditions of the Creative Commons Attribution (CC BY) license (https://creativecommons.org/licenses/by/4.0/).
Share and Cite
Seredin, P.; Goloshchapov, D.; Buylov, N.; Kashkarov, V.; Emelyanova, A.; Eremeev, K.; Ippolitov, Y. Compositional Analysis of the Dental Biomimetic Hybrid Nanomaterials Based on Bioinspired Nonstoichiometric Hydroxyapatite with Small Deviations in the Carbonate Incorporation. Nanomaterials 2022, 12, 4453. https://doi.org/10.3390/nano12244453
Seredin P, Goloshchapov D, Buylov N, Kashkarov V, Emelyanova A, Eremeev K, Ippolitov Y. Compositional Analysis of the Dental Biomimetic Hybrid Nanomaterials Based on Bioinspired Nonstoichiometric Hydroxyapatite with Small Deviations in the Carbonate Incorporation. Nanomaterials. 2022; 12(24):4453. https://doi.org/10.3390/nano12244453
Chicago/Turabian StyleSeredin, Pavel, Dmitry Goloshchapov, Nikita Buylov, Vladimir Kashkarov, Anna Emelyanova, Konstantin Eremeev, and Yuri Ippolitov. 2022. "Compositional Analysis of the Dental Biomimetic Hybrid Nanomaterials Based on Bioinspired Nonstoichiometric Hydroxyapatite with Small Deviations in the Carbonate Incorporation" Nanomaterials 12, no. 24: 4453. https://doi.org/10.3390/nano12244453