Article

Facile Synthesis and Characterizations of Mixed Metal Oxide Nanoparticles for the Efficient Photocatalytic Degradation of Rhodamine B and Congo Red Dyes

by
Ehab A. Abdelrahman
1,2,* and
Eida S. Al-Farraj
1
1
Department of Chemistry, College of Science, Imam Mohammad Ibn Saud Islamic University (IMSIU), Riyadh 11623, Saudi Arabia
2
Chemistry Department, Faculty of Science, Benha University, Benha 13518, Egypt
*
Author to whom correspondence should be addressed.
Nanomaterials 2022, 12(22), 3992; https://doi.org/10.3390/nano12223992
Submission received: 24 October 2022 / Revised: 7 November 2022 / Accepted: 8 November 2022 / Published: 12 November 2022

Abstract

:
Photocatalytic degradation has been suggested to be a cheap and efficient way to dispose of organic pollutants, such as dyes. Therefore, our research team strives to produce nanophotocatalysts in a simple and inexpensive way. In this work, the Pechini sol–gel technique was employed for the facile synthesis of Mn0.5Zn0.5Fe2O4/Fe2O3 and Fe0.5Mn0.5Co2O4/Fe2O3 as mixed metal oxide nanoparticles for the efficient photocatalytic degradation of Rhodamine B and Congo Red dyes. XRD, FT-IR, a N2 adsorption/desorption analyzer, EDS, FE-SEM, and an UV–Vis diffuse reflectance spectrophotometer were used to characterize the produced samples. The XRD patterns revealed that the average crystallite size of the Fe0.5Mn0.5Co2O4/Fe2O3 and Mn0.5Zn0.5Fe2O4/Fe2O3 samples is 90.25 and 80.62 nm, respectively. The FE-SEM images revealed that the Fe0.5Mn0.5Co2O4/Fe2O3 sample consists of cubic and irregular shapes with an average diameter of 1.71 µm. Additionally, the Mn0.5Zn0.5Fe2O4/Fe2O3 sample consists of spherical shapes with an average diameter of 0.26 µm. The energy gaps of the Fe0.5Mn0.5Co2O4/Fe2O3 and Mn0.5Zn0.5Fe2O4/Fe2O3 samples are 3.50 and 4.3 eV and 3.52 and 4.20 eV, respectively. In the presence of hydrogen peroxide, the complete degradation of 100 mL of 20 mg/L of Rhodamine B and Congo Red dyes occurred at pH = 8 and 3, respectively, within 50 min, using 0.1 g of the synthesized samples.

1. Introduction

Organic dyes are present in water sources due to their many industrial uses, such as in paper, textiles, food, cosmetics, and plastics. Because they can cause cancer and make cells change, these dye molecules are harmful to living things. Throwing liquid waste containing dyes into water leads to severe health risks for humans [1,2,3,4,5]. Therefore, effective strategies must be found to dispose of these pollutants.
Many methods are used to remove these pollutants, such as microfiltration, precipitation, reverse osmosis, chemical coagulation, photocatalytic degradation, and adsorption [6,7,8,9,10,11,12,13,14,15]. The recently arising solar-driven interfacial evaporation and photocatalysis method is a new strategy to remove organic pollutants from water with catalysts at the air–water interface [16,17,18].
Photocatalytic degradation has been suggested to be a cheap and efficient way to dispose of dye molecules. The absorption of photons by a photocatalyst results in the transmission of some electrons from the valence band to the conduction band. Hence, this simultaneously generates electrons and holes in the conduction and valence bands, respectively. Electrons and holes can produce hydroxyl free radicals when reacting with water. Organic dye pollutants can be quickly degraded by hydroxyl free radicals and converted into volatile gases, such as CO2 and H2O [19,20].
Congo Red and Rhodamine B dyes are utilized in numerous industries, such as the textile, chemical, pharmaceutical, paper, and cosmetic sectors. Consequently, a substantial quantity of these compounds contaminate water and enter normal water foundations. Due to the presence of aromatic amines in the composition of these compounds, ingestion of these dyes can cause cancer. This is why environmental rules require enterprises to remove these harmful compounds from polluted industrial fluids before releasing them into the environment [21,22,23].
There are many nanomaterials that are used as catalysts for the degradation of many organic dyes, such as CuO/TiO2/VO2, MgAlTi, ZnAlTi, perovskites, graphene oxide/silver nanocomposites, ZnO/montmorillonite nanocomposites, TiO2-impregnated activated carbon, titanium oxo ethoxo clusters, nitrogen-doped TiO2 nanotubes, and TiO2/Fe2O3 nanocomposites [24,25,26,27,28,29,30,31,32]. Nanomaterials are characterized by a large surface area, high stability, and high efficiency in producing free radicals.
Several methods have been used to synthesize nanomaterials with a wide range of morphologies and sizes. The Pechini sol–gel method is widely used in the preparation of many nanomaterials, such as CdTiO3, Y2O3, SrTiO3, and BaTiO3 [33,34,35,36]. However, most of the chemicals used to prepare these materials are very expensive. Therefore, our research team strives to produce nanophotocatalysts in a simple and inexpensive way.
Hence, in this work, the Pechini sol–gel technique was utilized for the facile synthesis of Mn0.5Zn0.5Fe2O4/Fe2O3 and Fe0.5Mn0.5Co2O4/Fe2O3 as mixed metal oxide nanoparticles for the efficient photocatalytic degradation of Rhodamine B and Congo Red dyes. The first innovative aspect of our research comes from the use of cheap salts, such as cobalt(II) chloride hexahydrate, iron(III) chloride hexahydrate, and manganese(II) acetate tetrahydrate to obtain these mixed nano-oxides for the first time. The other innovative aspect of our research comes from the ability of these nanomaterials to degrade a large concentration and a large volume of the Congo Red and Rhodamine B dyes in a short time. XRD, FT-IR, a N2 adsorption/desorption analyzer, EDS, field-emission scanning electron microscopy, transmission electron microscopy, and an UV–Vis diffuse reflectance spectrophotometer were used to characterize the produced samples. In addition, the factors impacting the degradation of Rhodamine B and Congo Red dyes, such as pH, time, concentration, and catalyst quantity, were investigated.

2. Experimental Section

2.1. Chemicals

Ethylene glycol (C2H6O2), cobalt(II) chloride hexahydrate (CoCl2.6H2O), hydrogen peroxide (H2O2), iron(III) chloride hexahydrate (FeCl3.6H2O), hydrochloric acid (HCl), manganese(II) acetate tetrahydrate (Mn(CH3COO)2.4H2O), zinc(II) sulfate heptahydrate (ZnSO4.7H2O), sodium hydroxide (NaOH), Rhodamine B dye (C28H31ClN2O3), Congo Red dye (C32H22N6Na2O6S2), and tartaric acid (C4H6O6) were purchased from Sigma Aldrich Company and used as received without further purification.

2.2. Synthesis of Mn0.5Zn0.5Fe2O4/Fe2O3 and Fe0.5Mn0.5Co2O4/Fe2O3 Samples

In 60 mL of distilled water, 8.33 g of FeCl3.6H2O, 4.43 g of ZnSO4.7H2O, 3.79 g of Mn(CH3COO)2.4H2O, and 1.47 g of CoCl2.6H2O were dissolved separately. Additionally, 13.25 g of tartaric acid was dissolved in 60 mL of distilled water. Fe(III), Zn(II), and Mn(II) solutions were mixed and stirred for 20 min to create the Mn0.5Zn0.5Fe2O4/Fe2O3 product. Moreover, Fe(III), Co(II), and Mn(II) solutions were mixed and stirred for 20 min to create the Fe0.5Mn0.5Co2O4/Fe2O3 product. Afterward, a tartaric acid solution was added to each system with continuous stirring for 20 min. Additionally, 3.33 mL of ethylene glycol was added to each system with continuous stirring. Furthermore, each system was heated at 150 °C until the solution was dried. Finally, the formed powder was ignited at 800 °C for 5 h. Scheme 1 summarizes the synthesizing steps of the nanomaterials.

2.3. Instrumentation

An X-ray diffraction (XRD) instrument was used to study the crystalline structure of the synthesized nanomaterials. The diffractograms were collected using a D8 Advance X-ray diffractometer equipped with KαCu radiation (λ = 0.15 nm). A Thermo Scientific Nicolet iS50 Fourier-transform infrared spectrometer (FT-IR) was used to study the functional groups of the synthesized nanomaterials. A Jasco V-750 UV–Vis diffuse reflectance spectrophotometer (DRS) and an integrating sphere, calibrated with barium sulfate, were used to determine the band gap of the synthesized nanomaterials. A Quantachrome NOVA Touch LX2 nitrogen-gas-sorption analyzer was used to study the surface textures (BET surface area, total pore volume, and average pore radius) of the synthesized nanomaterials. The synthesized nanomaterials were degassed at 110 °C for 24 h before analyses. A Quanta 250 FEG scanning electron microscope (SEM) attached with an energy dispersive X-ray unit was used to study the surface morphology and elemental analysis of the synthesized nanomaterials. The morphologies of the nanomaterials were obtained using a Talos F200iS transmission electron microscope (TEM). The concentration of Rhodamine B and Congo Red dyes was determined using a Jasco V-750 UV–Vis spectrophotometer. The maximum wavelengths of the Rhodamine B and Congo Red dyes were 554 and 497 nm, respectively.

2.4. Photocatalytic Degradation of Rhodamine B and Congo Red Dyes

For every experiment, a specified amount of the Mn0.5Zn0.5Fe2O4/Fe2O3 or Fe0.5Mn0.5Co2O4/Fe2O3 samples was dispersed in a 100 mL aqueous solution of Rhodamine B or Congo Red dyes. The suspension was then agitated magnetically in the dark for 60 min. The solution was then irradiated with three UV lamps (30 cm, 8 watt, and 225 nm) located 8 cm away from the dye solution. In addition, the nanomaterials were separated by centrifugation, and the remaining concentration of the Rhodamine B or Congo Red dyes in the filtrate was measured using a Jasco V-750 UV–Vis spectrophotometer. The same tests were conducted again, but this time 2 mL of 2 M hydrogen peroxide was added. The photodegradation efficiency (% D) of the nanomaterials against Rhodamine B or Congo Red dyes was determined using Equation (1).
%   D = X d X e X d × 100
Xd (mg/L) is the remaining concentration of the Rhodamine B or Congo Red dyes after the process of stirring in the dark. Xe (mg/L) is the remaining concentration of the Rhodamine B or Congo Red dyes after exposure to ultraviolet rays.

3. Results and Discussion

3.1. Characterization of the Synthesized Nanocomposites

3.1.1. X-ray Diffraction

X-ray powder diffraction (XRD) is a rapid analytical technique primarily used for the phase identification of a crystalline material, and it can provide information on the average crystallite size. Figure 1A,B displays the X-ray diffraction patterns of the Fe0.5Mn0.5Co2O4/Fe2O3 and Mn0.5Zn0.5Fe2O4/Fe2O3 samples, respectively. The results reveal that the Fe0.5Mn0.5Co2O4/Fe2O3 sample consisted of hematite (Fe2O3) and cobalt manganese iron oxide (Fe0.5Mn0.5Co2O4), as indicated by JCPDS Nos. 00-024-0072 and 01-086-8898, respectively. Additionally, the Mn0.5Zn0.5Fe2O4/Fe2O3 sample consisted of hematite (Fe2O3) and manganese zinc iron oxide (Mn0.5Zn0.5Fe2O4), as indicated by JCPDS Nos. 00-024-0072 and 01-086-8880, respectively. The peaks of cobalt manganese iron oxide or manganese zinc iron oxide at 2Ɵ = 74.17°, 62.66°, 57.16°, 53.85°, 43.38°, 37.06°, 35.45°, 30.10°, and 18.38° corresponded to lattice plans (533), (440), (511), (422), (400), (222), (311), (220), and (111), respectively, as obtained from JCPDS Nos. 01-086-8898 and 01-086-8880. The peaks of hematite at 2Ɵ = 75.40°, 71.83°, 64.01°, 49.54°, 40.84°, 33.14°, and 24.07° corresponded to lattice plans (220), (1 0 10), (300), (024), (113), (104), and (012), respectively, as obtained from JCPDS No. 00-024-0072. The average crystallite size of the Fe0.5Mn0.5Co2O4/Fe2O3 and Mn0.5Zn0.5Fe2O4/Fe2O3 samples was 90.25 and 80.62 nm, respectively. This confirms the success of the Pechini sol–gel method in synthesizing new mixed nano-oxides. In this method, an aqueous solution of metal salts is mixed with tartaric acid. Chelation, or the formation of complex ring-shaped compounds around the metal cations, takes place in the solution. Ethylene glycol is then added, and the liquid is heated to 150 °C to allow the chelates to polymerize, or form large, cross-linked networks. As excess water is removed by heating, a solid polymeric resin is achieved. Eventually, at a higher temperature of 800 °C for 5 h, the resin is decomposed, and ultimately, mixed metal oxides are obtained. Hence, this explains the proportions of the elements in Table 1 [33].

3.1.2. Energy Dispersive X-ray Spectroscopy

Energy dispersive X-ray spectroscopy (EDX) is an analytical method which yields a spectrum that displays the peaks correlated to the elemental composition of the investigated sample. Figure 2A,B displays the energy dispersive X-ray patterns of the Fe0.5Mn0.5Co2O4/Fe2O3 and Mn0.5Zn0.5Fe2O4/Fe2O3 samples, respectively. The results reveal that the Fe0.5Mn0.5Co2O4/Fe2O3 sample consisted of manganese, oxygen, cobalt, and iron as displayed in Table 1. Additionally, the Mn0.5Zn0.5Fe2O4/Fe2O3 sample consisted of manganese, oxygen, zinc, and iron as displayed in Table 1. Hence, the absence of other elements confirms the success of the method in obtaining pure nano-oxides. The high percentage of iron in the Fe0.5Mn0.5Co2O4/Fe2O3 sample confirms the high percentage of Fe2O3 compared to Fe0.5Mn0.5Co2O4.

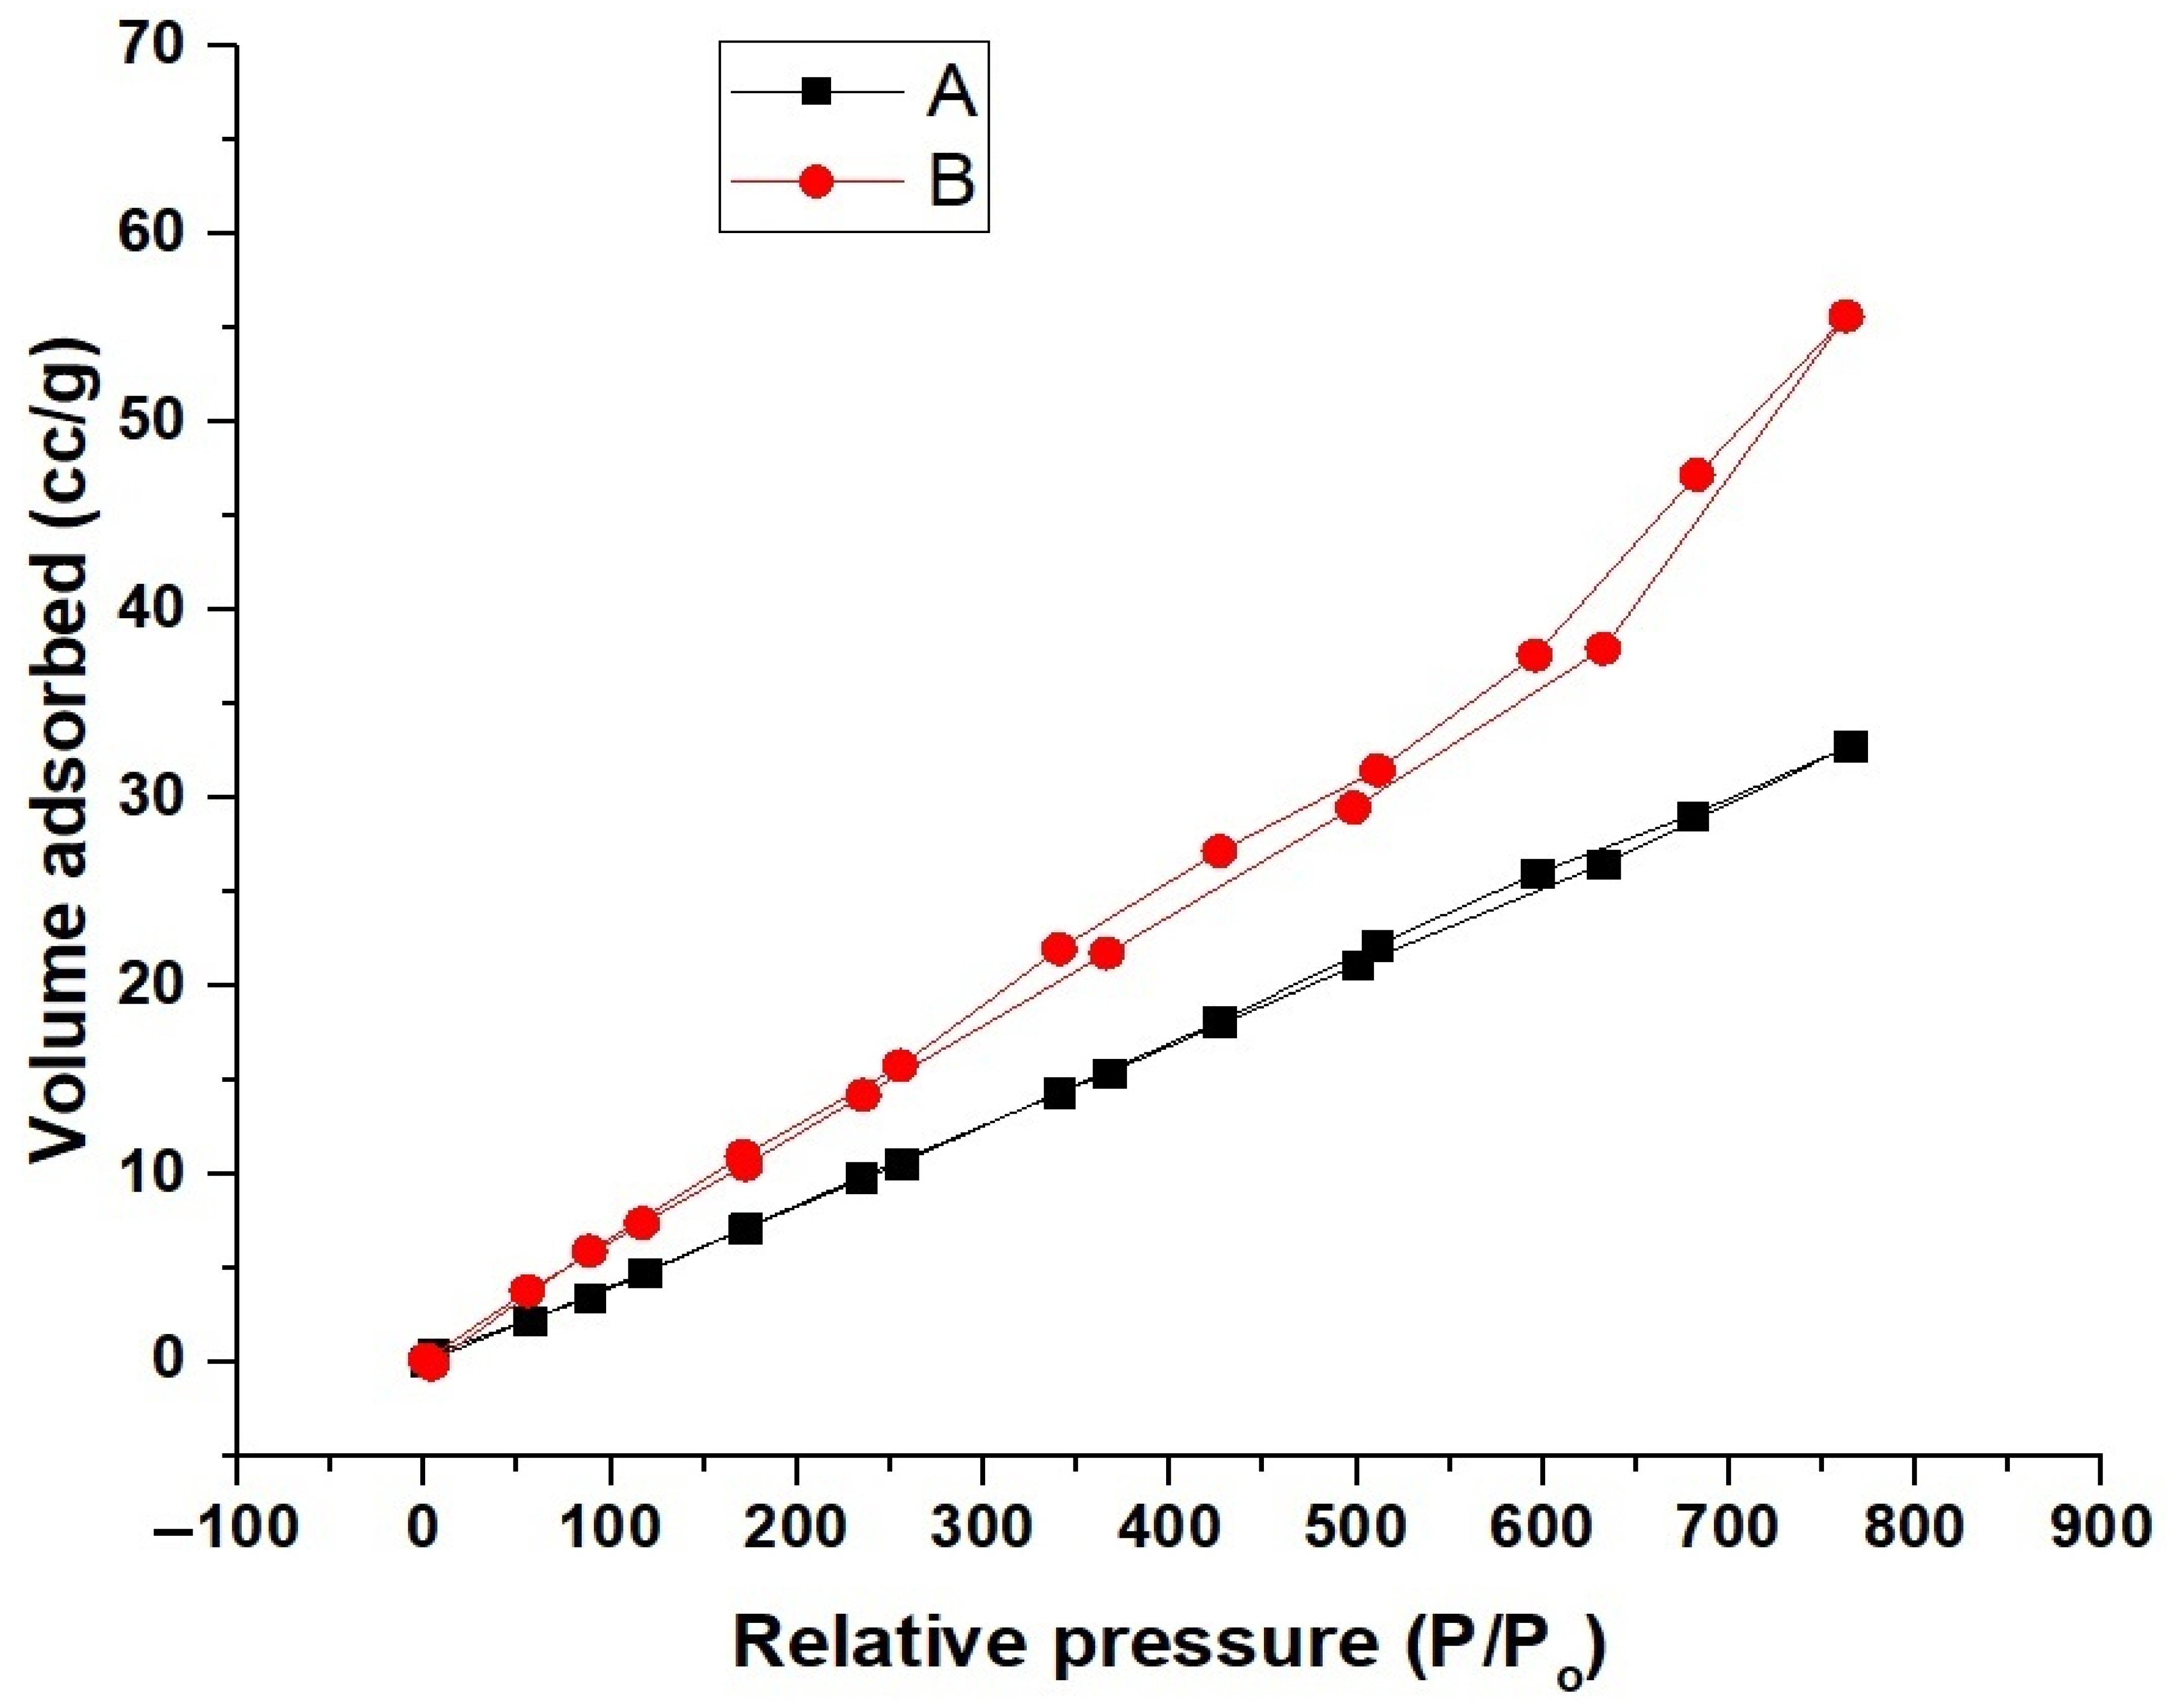
3.1.3. N2 Adsorption/Desorption Analyzer

Figure 3A,B displays the plot of the volume adsorbed against the relative pressure of the Fe0.5Mn0.5Co2O4/Fe2O3 and Mn0.5Zn0.5Fe2O4/Fe2O3 samples, respectively. The results reveal that all curves belong to the IV types [37,38,39]. In addition, Table 2 displays the surface parameters, such as the BET surface area, total pore volume, and average pore size, of the produced samples. Moreover, the BET surface area of the Mn0.5Zn0.5Fe2O4/Fe2O3 sample is greater than that of the Fe0.5Mn0.5Co2O4/Fe2O3 sample. Hence, it was expected that the Mn0.5Zn0.5Fe2O4/Fe2O3 sample would outperform the Fe0.5Mn0.5Co2O4/Fe2O3 sample in the photocatalytic degradation efficiency of the dyes under study.

3.1.4. Field-Emission Scanning Electron Microscopy and Transmission Electron Microscopy
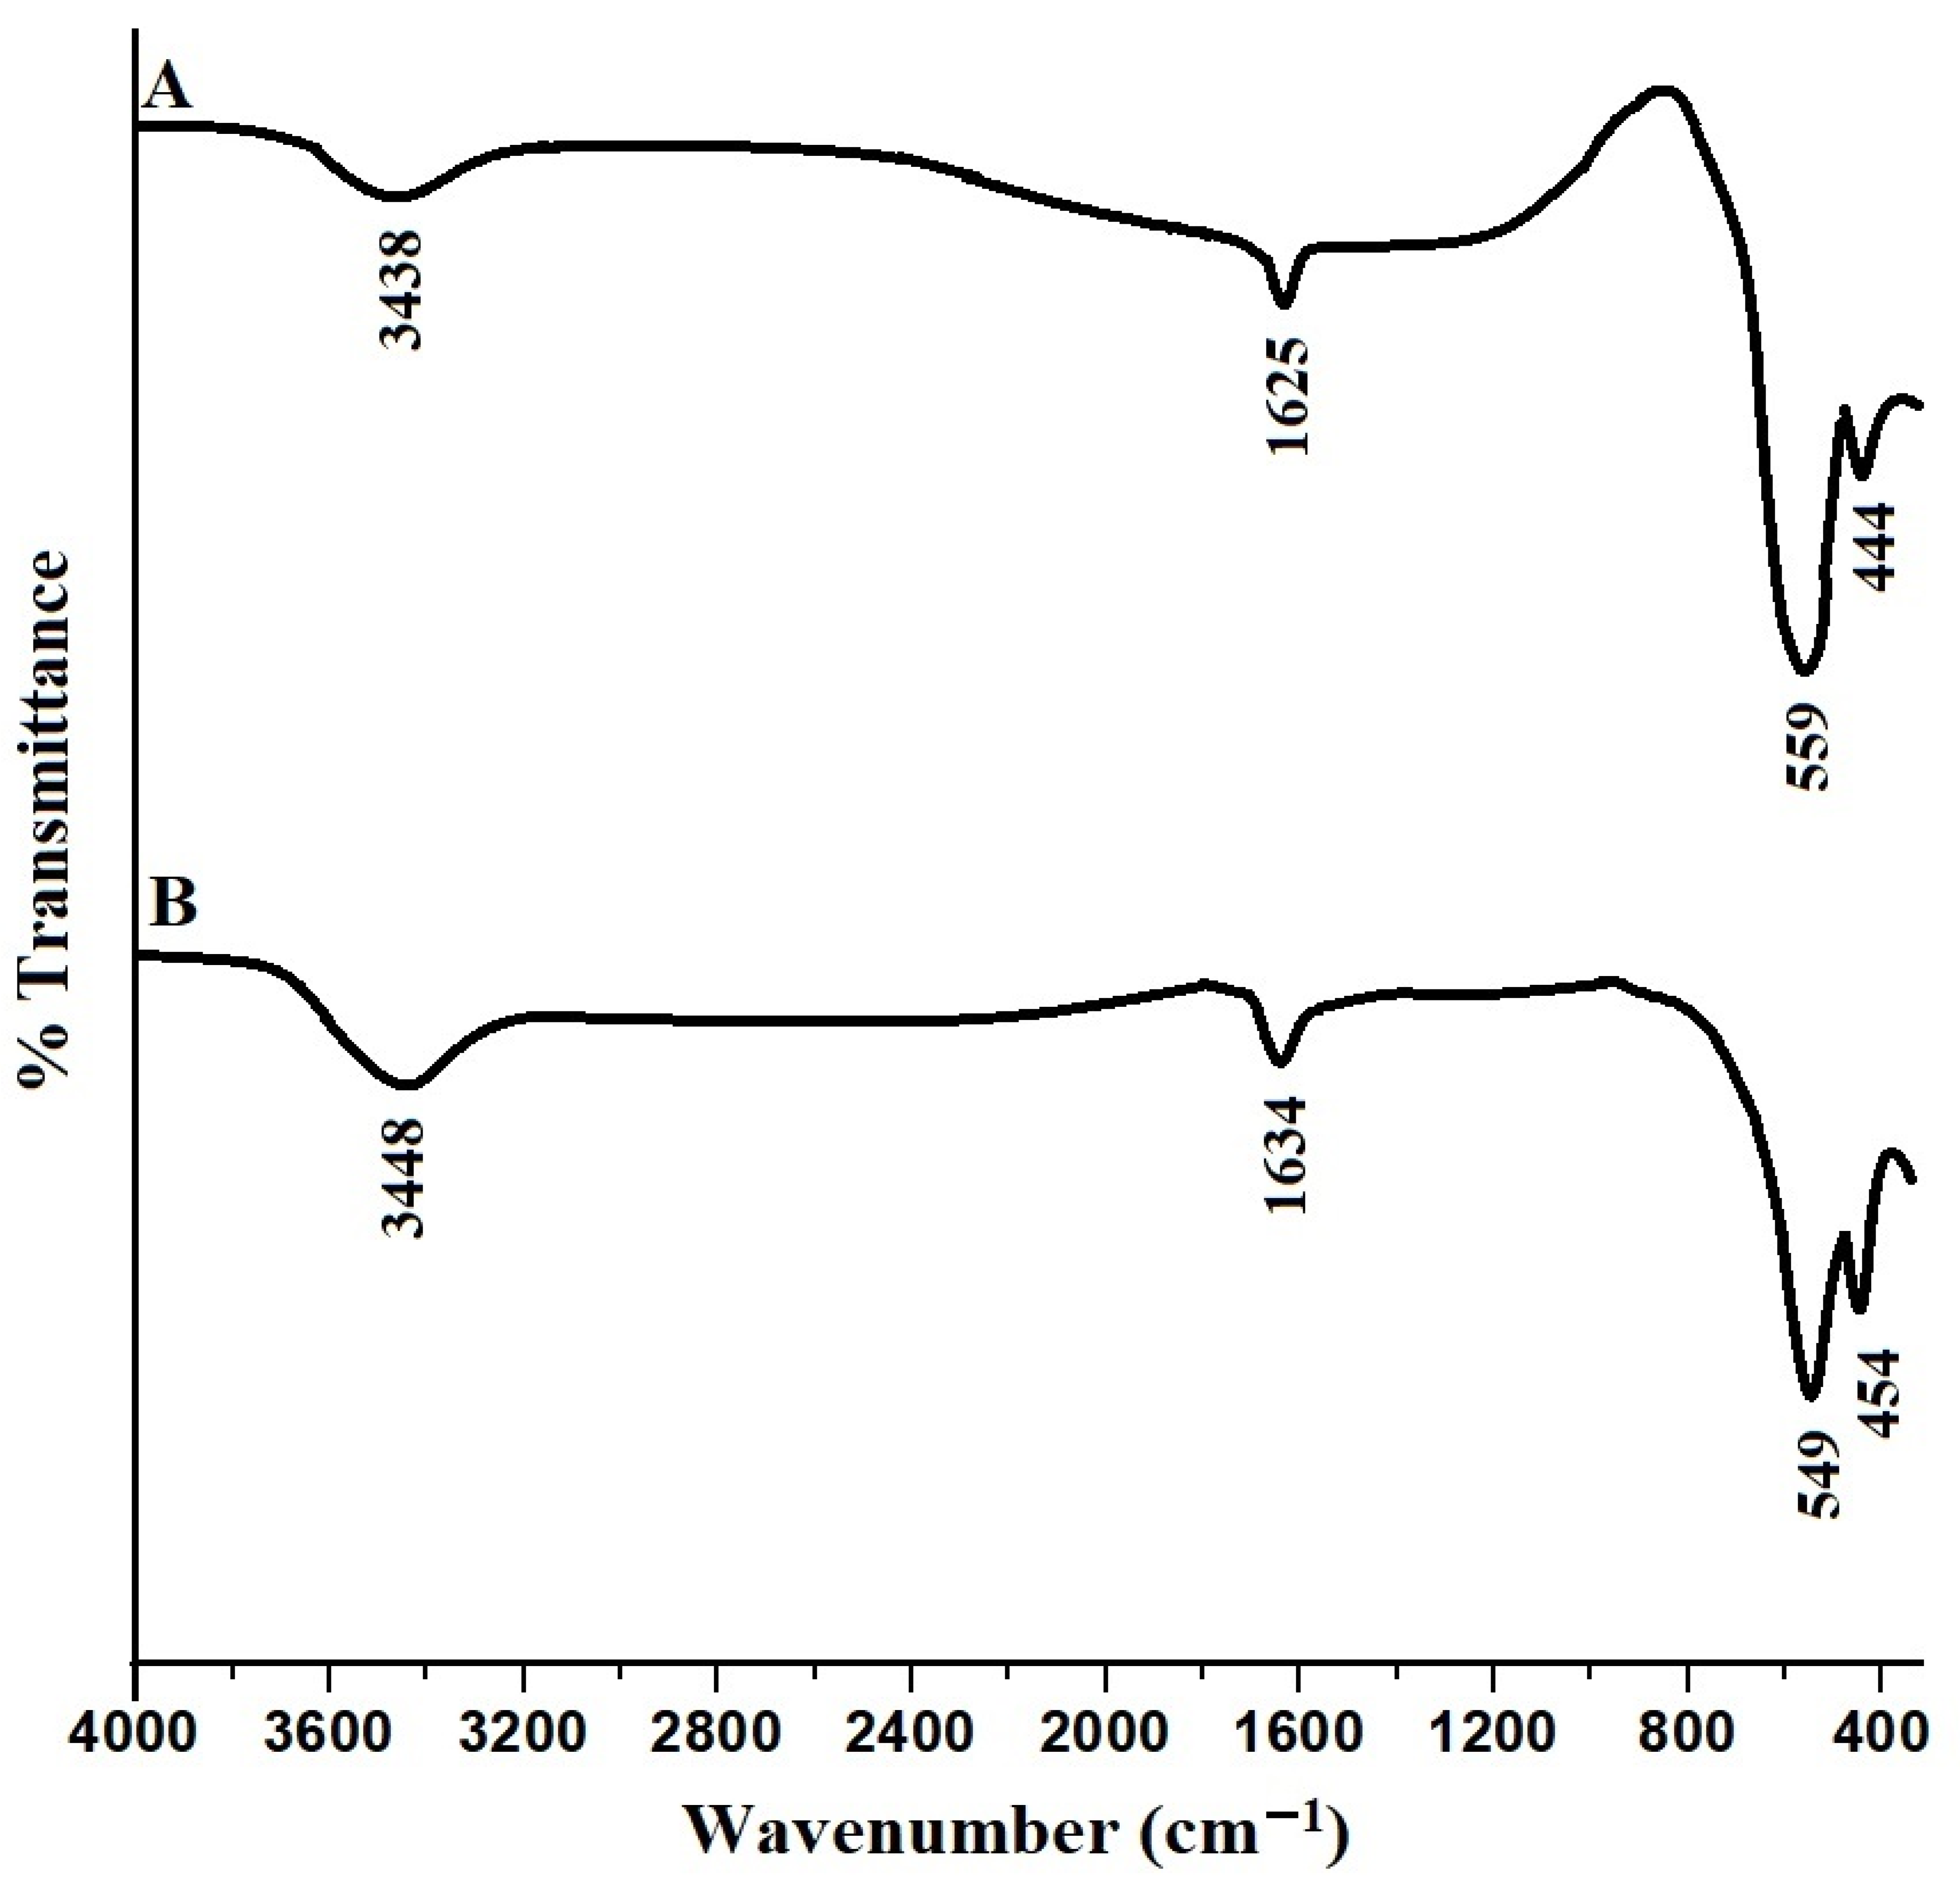
Figure 4A,B displays the scanning electron microscopy images of the Fe0.5Mn0.5Co2O4/Fe2O3 and Mn0.5Zn0.5Fe2O4/Fe2O3 samples, respectively. The results reveal that the surface of the Fe0.5Mn0.5Co2O4/Fe2O3 sample consisted of cubic and irregular shapes with an average grain size of 1.71 µm. Additionally, the surface of the Mn0.5Zn0.5Fe2O4/Fe2O3 sample consists of spherical shapes with an average grain size of 0.26 µm. XRD can determine the crystallite size, but SEM can determine the grain size, and the surface particles might consist of many aggregates of crystallites, which should be bigger than the crystallite size obtained from XRD.
Figure 5A,B displays the transmission electron microscopy images of the Fe0.5Mn0.5Co2O4/Fe2O3 and Mn0.5Zn0.5Fe2O4/Fe2O3 samples, respectively. The results reveal that the Fe0.5Mn0.5Co2O4/Fe2O3 and Mn0.5Zn0.5Fe2O4/Fe2O3 samples consisted of cubic and irregular shapes with an average diameter of 100.27 and 84.29 nm, respectively. The average particle size determined from the TEM images is slightly larger than that estimated from the XRD technique as a result of the presence of the agglomeration.

3.1.5. FT-IR

Figure 6A,B displays the FT-IR spectra of the Fe0.5Mn0.5Co2O4/Fe2O3 and Mn0.5Zn0.5Fe2O4/Fe2O3 samples, respectively. The bands at 559 and 549 cm−1 in the Fe0.5Mn0.5Co2O4/Fe2O3 and Mn0.5Zn0.5Fe2O4/Fe2O3 samples were attributed to the bending vibrational modes of Fe-O, Mn-O, Co-O, and Zn-O in the Fe0.5Mn0.5Co2O4 and Mn0.5Zn0.5Fe2O4/Fe2O3 samples, respectively. The bands at 444 and 454 cm−1 in the Fe0.5Mn0.5Co2O4/Fe2O3 and Mn0.5Zn0.5Fe2O4/Fe2O3 samples were attributed to the bending vibrations of the Fe–O bond in the Fe2O3, respectively. The bands at 1625 and 1634 cm−1 in the Fe0.5Mn0.5Co2O4/Fe2O3 and Mn0.5Zn0.5Fe2O4/Fe2O3 samples, respectively, were attributed to the bending vibrations of the adsorbed water. The bands at 3433 and 3448 cm−1 in the Fe0.5Mn0.5Co2O4/Fe2O3 and Mn0.5Zn0.5Fe2O4/Fe2O3 nanocomposites, respectively, were attributed to the stretching vibrations of the adsorbed water [40].

3.1.6. Energy Gap

The energy gap (Eg) was determined using the diffuse reflectance spectra of the Fe0.5Mn0.5Co2O4/Fe2O3 and Mn0.5Zn0.5Fe2O4/Fe2O3 samples and Equation (2) [19].
(F(R)hυ)Z = K (hυ − Eg)
F(R) is a constant, while K is the Kubelka–Munk function. Z is an integer based on the transition type. Z = 2 for the direct transitions that are permitted, while Z = 1/2 for the indirect transitions that are permitted. Figure 7A,B displays the plot of (F(R)hυ)2 against hυ for the Fe0.5Mn0.5Co2O4/Fe2O3 and Mn0.5Zn0.5Fe2O4/Fe2O3 samples, respectively. Therefore, the transitions that were most abundant in the synthesized nanocomposites were direct allowed transitions. The energy gap (Eg) is determined by extrapolating each graph until (F(R)hν)2 equals 0. The energy gap of the Fe0.5Mn0.5Co2O4/Fe2O3 and Mn0.5Zn0.5Fe2O4/Fe2O3 samples was 3.50 and 4.3 eV and 3.52 and 4.20 eV, respectively.

3.2. Photocatalytic Degradation of Rhodamine B and Congo Red Dyes

3.2.1. Effect of pH

Figure 8A,B displays the plot of % D against pH for the degradation of Rhodamine B and Congo Red dyes using the Fe0.5Mn0.5Co2O4/Fe2O3 and Mn0.5Zn0.5Fe2O4/Fe2O3 samples, respectively. It is noticeable that by increasing the pH, the degradation efficiency of the synthesized samples toward Rhodamine B dye increased, while the degradation efficiency of the synthesized samples toward Congo Red dye decreased. Rhodamine B dye is a cationic dye whose adsorption is increased in alkaline media, and thus the efficiency of its degradation in alkaline media is increased [19]. Congo Red dye is an anionic dye whose adsorption is increased in acidic media, and thus the efficiency of its degradation in acidic media is increased [19]. In the case of using the Fe0.5Mn0.5Co2O4/Fe2O3 sample, the degradation efficiency of the sample toward Rhodamine B dye without H2O2 (pH = 8), Rhodamine B dye with H2O2 (pH = 8), Congo Red dye without H2O2 (pH = 3), and Congo Red dye with H2O2 (pH = 3) was equal to 46.02, 100, 36.11, and 100 %, respectively. In the case of using the Mn0.5Zn0.5Fe2O4/Fe2O3 sample, the degradation efficiency of the sample toward Rhodamine B dye without H2O2 (pH = 8), Rhodamine B dye with H2O2 (pH = 8), Congo Red dye without H2O2 (pH = 3), and Congo Red dye with H2O2 (pH = 3) was equal to 47.14, 100, 47.53, and 100 %, respectively.

3.2.2. Effect of Time

Figure 9A,B displays the plot of % D against time for the degradation of Rhodamine B and Congo Red dyes using the Fe0.5Mn0.5Co2O4/Fe2O3 and Mn0.5Zn0.5Fe2O4/Fe2O3 samples, respectively. In the absence of hydrogen peroxide, it was observed that by increasing the time from 10 to 80 min, the degradation efficiency of the synthesized samples toward Rhodamine B and Congo Red dyes increased. Additionally, in the case of increasing the time from 80 to 120 min, there was no significant change in the degradation efficiency of the synthesized samples toward Rhodamine B and Congo Red dyes due to the saturation of the active sites of the samples [19]. In the presence of hydrogen peroxide, the complete degradation of Rhodamine B and Congo Red dyes occurred within 50 min. The Rhodamine B and Congo Red dyes were completely degraded under UV light using only hydrogen peroxide in the absence of the synthesized samples within 5 h, which is much larger than the consumed time (50 min) in the presence of the synthesized samples.
The degradation of Rhodamine B and Congo Red dyes using the synthesized samples is compatible with the first-order kinetic model as indicated by Equation (3) [19].
ln (Xd/Xe) = k t
k (1/min) represents the first-order constant. Figure 10A,B displays the plot of ln (Xd/Xe) against t for the degradation of the Rhodamine B and Congo Red dyes using the Fe0.5Mn0.5Co2O4/Fe2O3 and Mn0.5Zn0.5Fe2O4/Fe2O3 samples, respectively. Table 3 and Table 4 display the values for k and R2 in the case of using the Fe0.5Mn0.5Co2O4/Fe2O3 and Mn0.5Zn0.5Fe2O4/Fe2O3 samples, respectively. Hydrogen peroxide increases the efficiency of dye degradation, and thus the k value increases when using hydrogen peroxide compared to when it is absent.

3.2.3. Effect of Quantity of Catalyst

Figure 11A,B displays the plot of % D against the quantity of the Fe0.5Mn0.5Co2O4/Fe2O3 and Mn0.5Zn0.5Fe2O4/Fe2O3 samples for the degradation of the Rhodamine B and Congo Red dyes, respectively. It has been observed that by increasing the quantity of samples from 0.025 to 0.1 g, the degradation efficiency of the synthesized samples toward Rhodamine B and Congo Red dyes increases because of the increase in active sites [19]. Additionally, when the quantity of the samples was increased from 0.1 to 0.2 g, there was a significant decrease in the degradation efficiency of the synthesized samples toward Rhodamine B and Congo Red dyes because of the turbidity caused by the particles of the catalyst, which impedes the arrival of light to it [19].

3.2.4. Effect of Concentration

Figure 12A,B displays the plot of the % D of the Rhodamine B and Congo Red dyes against the concentration of the dyes, using the Fe0.5Mn0.5Co2O4/Fe2O3 and Mn0.5Zn0.5Fe2O4/Fe2O3 samples, respectively. It has been observed that by increasing the concentration of the Rhodamine B and Congo Red dyes from 10 to 30 mg/L, the degradation efficiency of the synthesized nanocomposites toward the Rhodamine B and Congo Red dyes decreases because the high concentration makes the dye particles block light from reaching the samples [19].

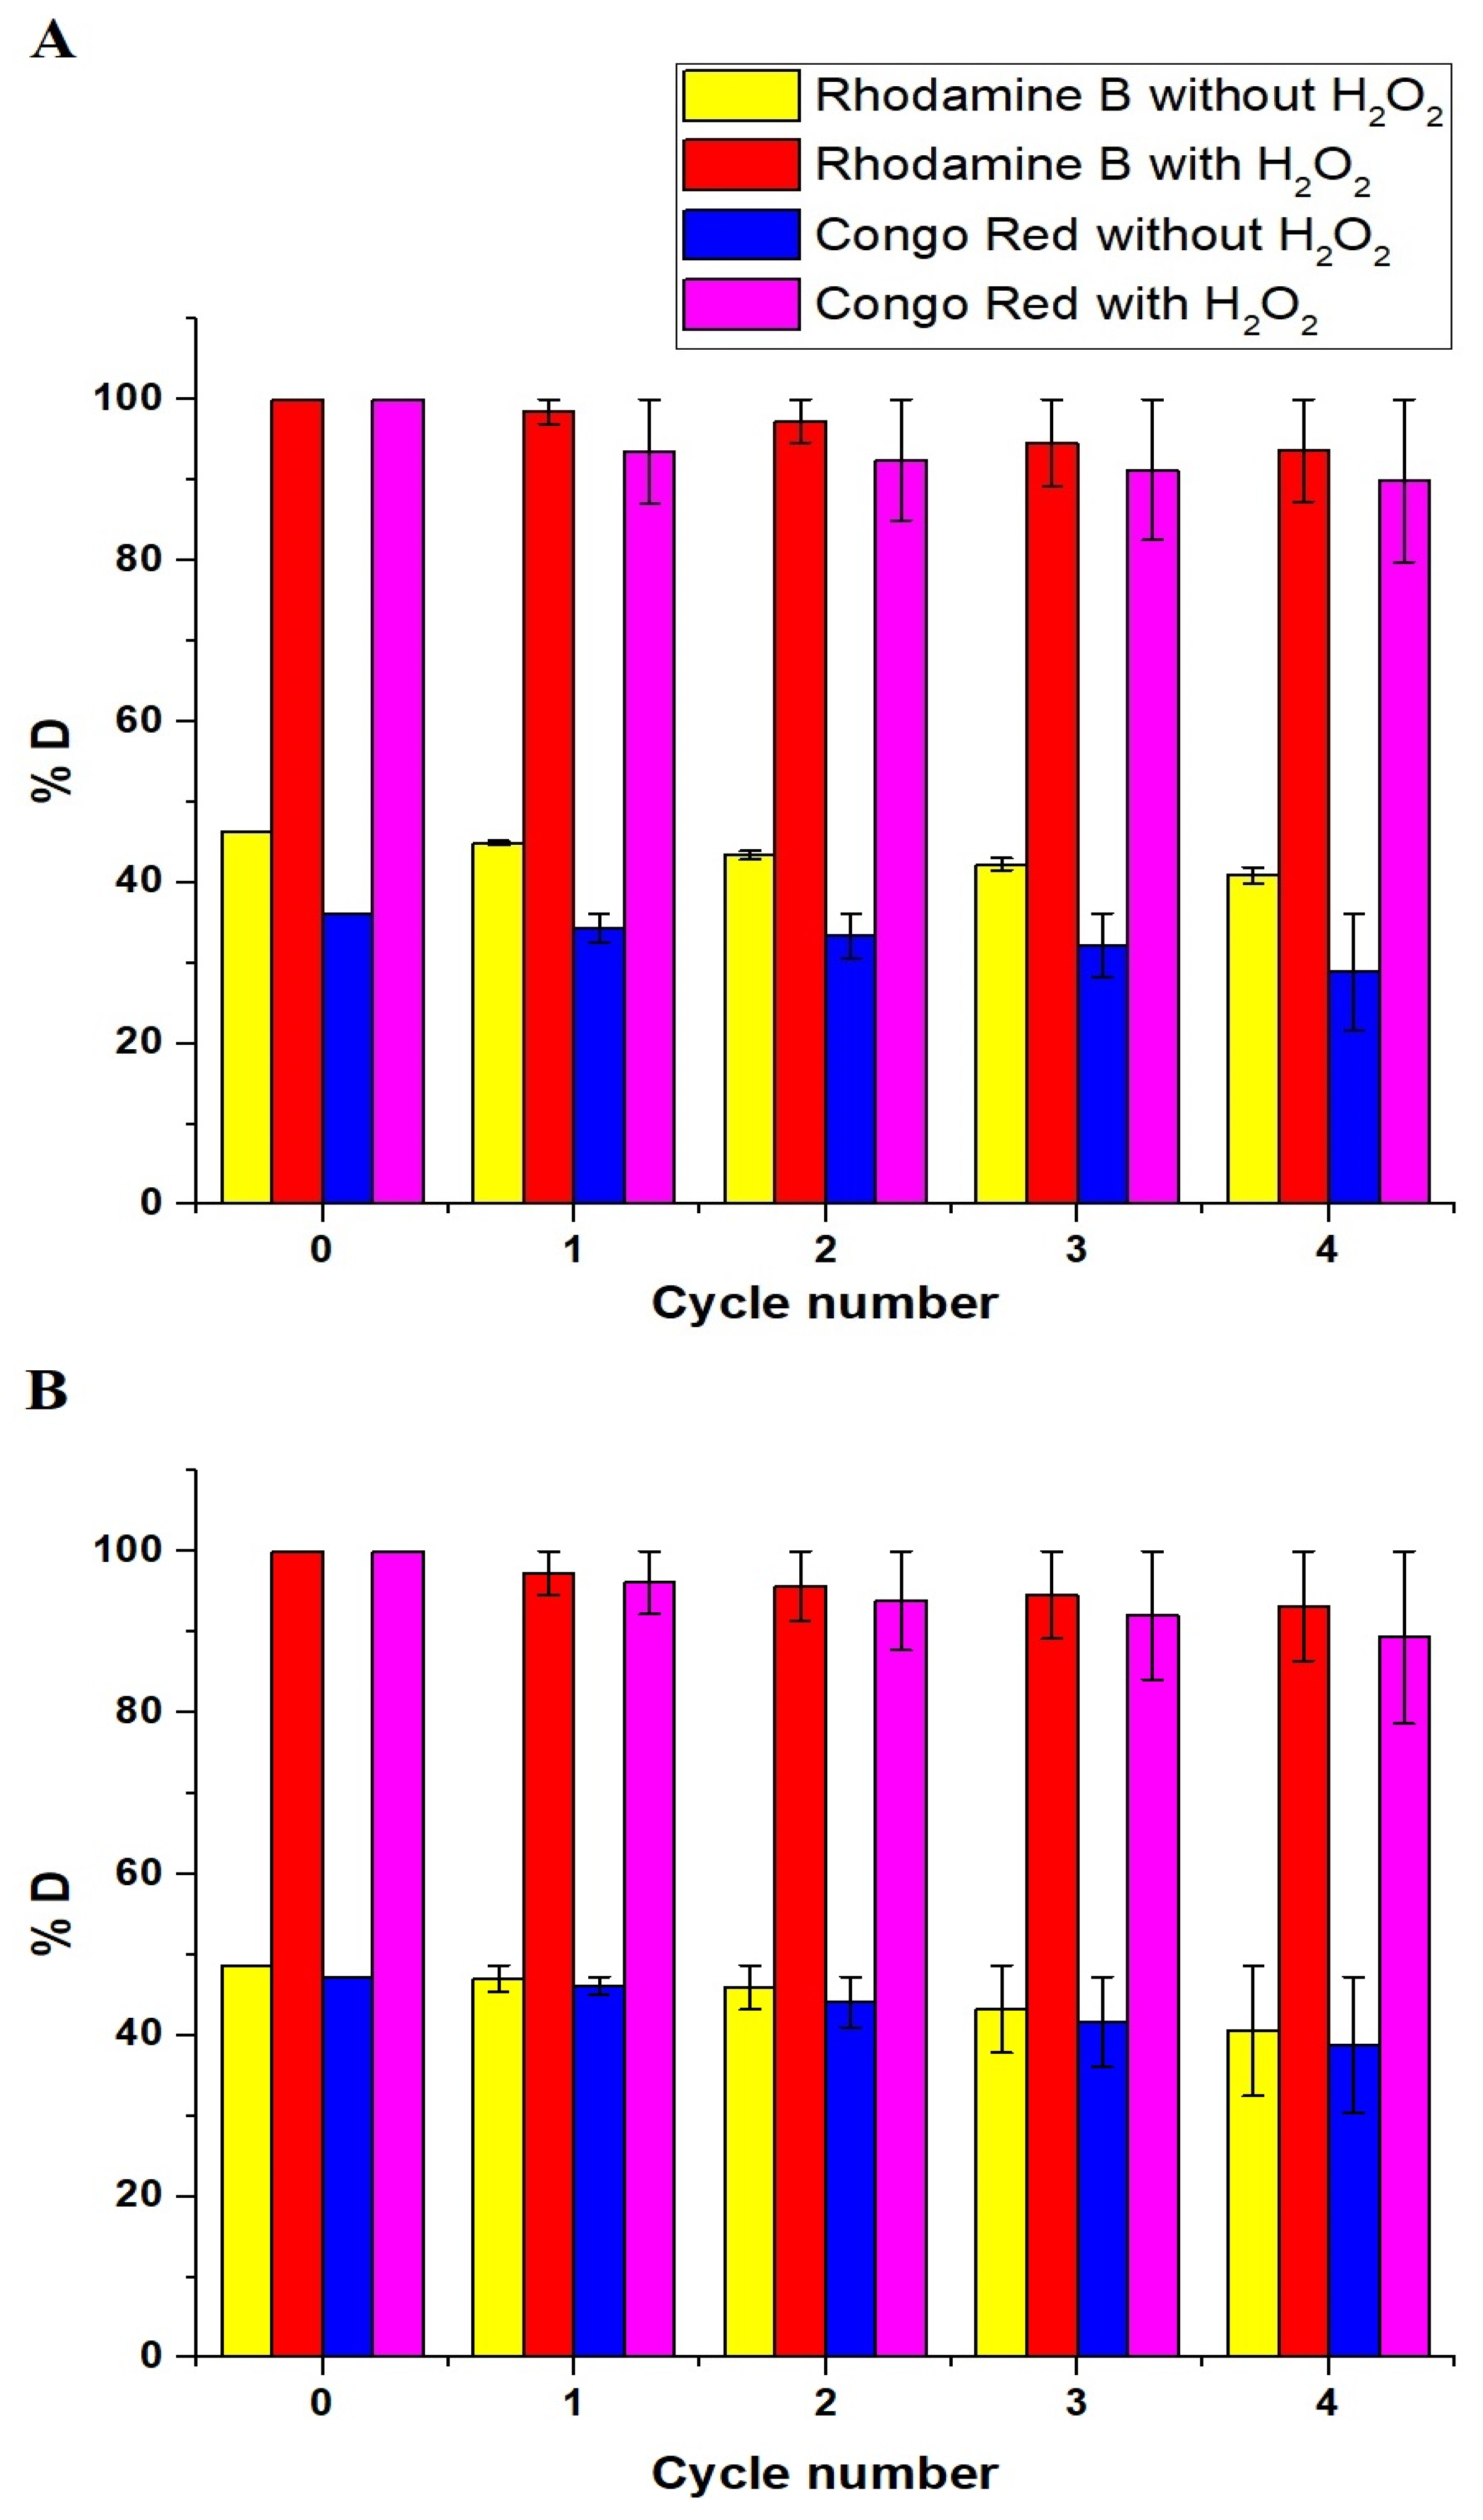
3.2.5. Effect of Reusability

Figure 13A,B displays the plot of % D against the cycle number for the degradation of the Rhodamine B and Congo Red dyes using the Fe0.5Mn0.5Co2O4/Fe2O3 and Mn0.5Zn0.5Fe2O4/Fe2O3 samples, respectively. The results demonstrate a minor variation in the value of % D after four cycles, confirming the efficacy of the synthesized samples and their reusability with nearly the same efficiency in degrading the Rhodamine B and Congo Red dyes.

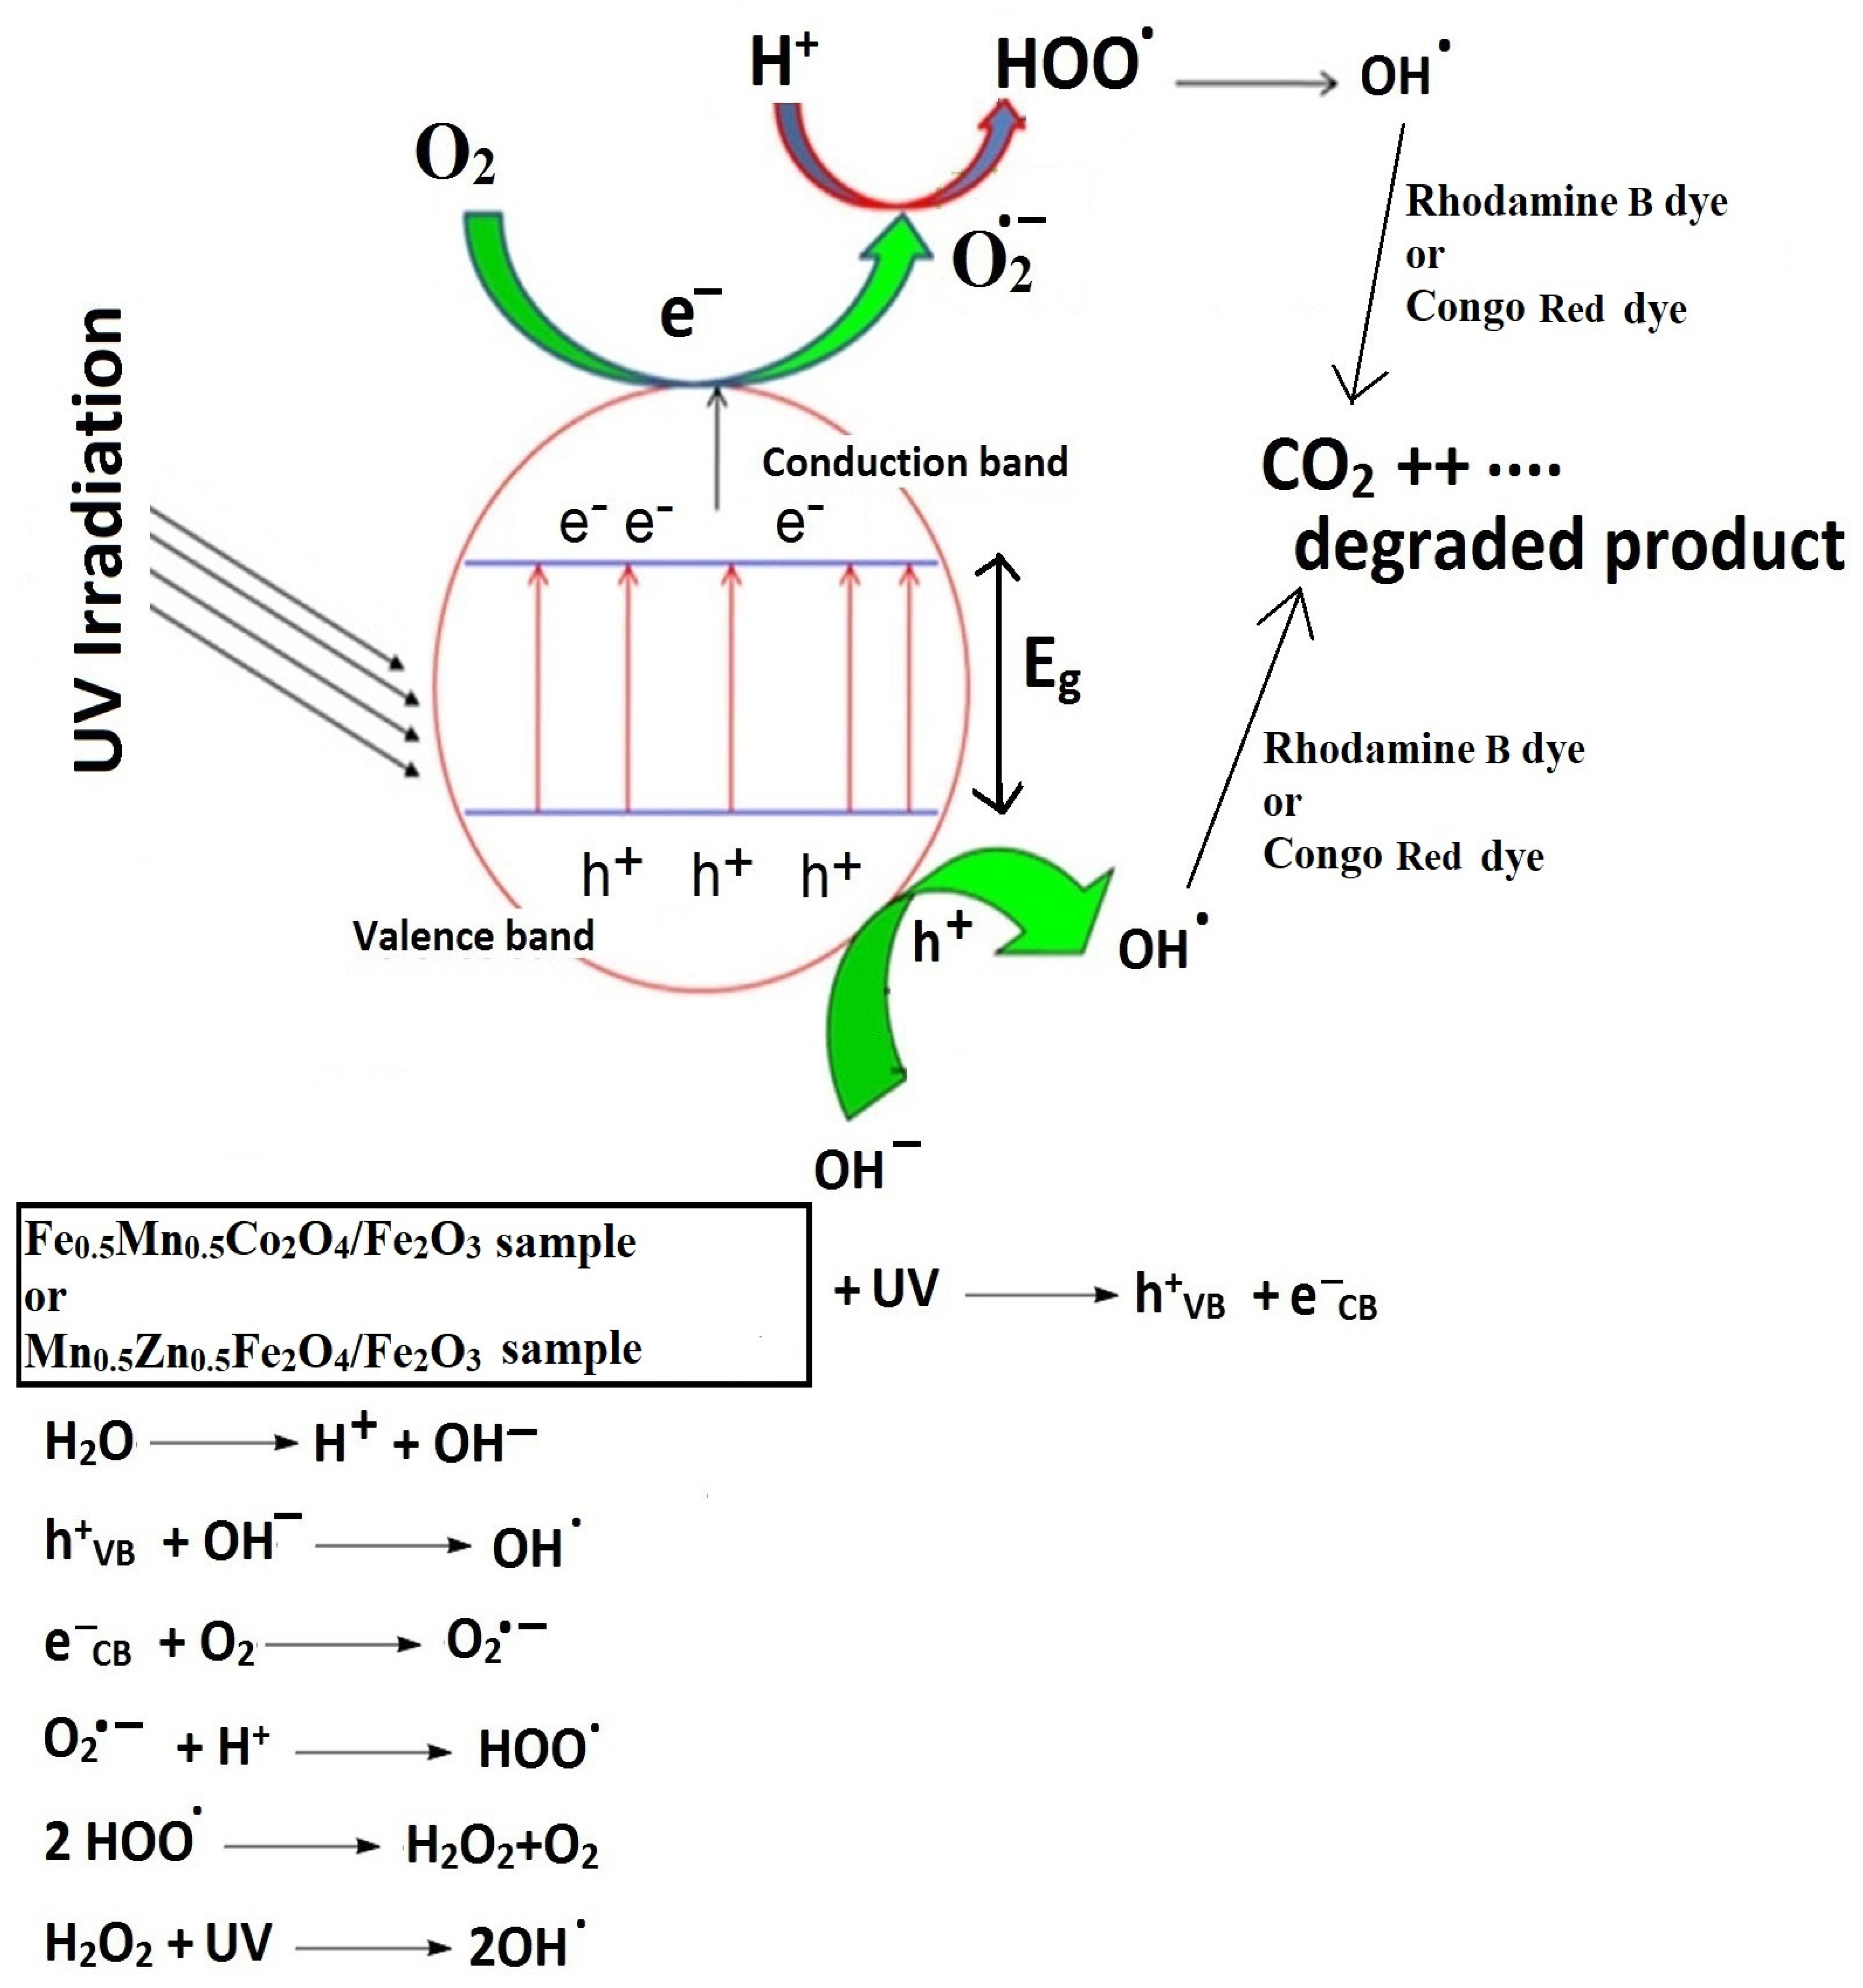
3.3. Mechanism of Photocatalytic Degradation

Figure 14 displays the suggested mechanism for the degradation of Rhodamine B and Congo Red dyes using the Fe0.5Mn0.5Co2O4/Fe2O3 and Mn0.5Zn0.5Fe2O4/Fe2O3 samples. The absorption of photons by a photocatalyst results in the transmission of some electrons from the valence band to the conduction band. Hence, this simultaneously generates electrons and holes in the conduction and valence bands, respectively. Electrons and holes can produce hydroxyl free radicals when reacting with water. Rhodamine B and Congo Red dyes can be quickly degraded by hydroxyl free radicals and converted into volatile gases, such as CO2 and H2O [19,20].

3.4. A Comparison between the Synthesized Nanocomposites and other Catalysts in the Literature for the Degradation of Rhodamine B and Congo Red Dyes

The % D of the Rhodamine B dye utilizing the Fe0.5Mn0.5Co2O4/Fe2O3 and Mn0.5Zn0.5Fe2O4/Fe2O3 samples was compared to that of other catalysts used in earlier studies, including the ZnO/SnO2 composite, Fe/SnO2 composite, Fe3O4/TiO2/CoMoO4 composite, Fe3O4/TiO2 composite, chitosan/SnO2 composite, Fe3O4/SiO2/TiO2 composite, BiOI/BiOCl composite, and ZnO/PbCrO4 composite as displayed in Table 5 [41,42,43,44,45,46,47,48]. The % D of the Congo Red dye utilizing the Fe0.5Mn0.5Co2O4/Fe2O3 and Mn0.5Zn0.5Fe2O4/Fe2O3 samples was compared to that of other catalysts used in earlier studies, including the ZrO2/CeO2/ZnO, Au/ZnO, Ag/ZnO, magnetic silica-coated Ag2WO4/Ag2S, and TiO2-doped cobalt ferrite as displayed in Table 6 [49,50,51,52]. The results demonstrate the photocatalytic superiority of the Fe0.5Mn0.5Co2O4/Fe2O3 and Mn0.5Zn0.5Fe2O4/Fe2O3 samples over other photocatalysts used in previous studies because they degrade a large volume of a high concentration of Rhodamine B and Congo Red dyes in a short period of time with high efficiency. Thus, these synthesized catalysts are joined to a series of active materials for the degradation of organic materials [53,54]. Feng et al. utilized a new dual-mode-driven micromotor based on foam-like carbon nitride (f-C3N4) with precipitated Fe3O4 nanoparticles, namely Fe3O4/f-C3N4, powered by chemical/magnetic stimuli for a rapid reduction in organic pollutants [55]. Li et al. prepared an ordered Schottky heterojunction of heptazine-based crystalline carbon nitride (HCN) and Ti3C2 MXene through the ionothermal method. The HCN/Ti3C2 composites exhibit higher photocatalytic performance than pristine HCN [56].

4. Conclusions

The Pechini sol–gel technique was employed for the facile synthesis of Mn0.5Zn0.5Fe2O4/Fe2O3 and Fe0.5Mn0.5Co2O4/Fe2O3 as mixed metal oxide nanoparticles for the efficient photocatalytic degradation of Rhodamine B and Congo Red dyes. The XRD patterns revealed that the average crystallite size of the Fe0.5Mn0.5Co2O4/Fe2O3 and Mn0.5Zn0.5Fe2O4/Fe2O3 samples was 90.25 and 80.62 nm, respectively. In the presence of hydrogen peroxide, the complete degradation of 100 mL of 20 mg/L of Rhodamine B and Congo Red dyes occurred at pH = 8 and 3, respectively, within 50 min and using 0.1 g of the synthesized samples.

Author Contributions

Conceptualization, E.A.A.; methodology, E.A.A.; validation, E.A.A. and E.S.A.-F.; formal analysis, E.A.A.; resources, E.A.A.; data curation, E.S.A.-F.; writing—original draft preparation, E.S.A.-F.; writing—review and editing, E.A.A. and E.S.A.-F.; visualization, E.S.A.-F. All authors have read and agreed to the published version of the manuscript.

Funding

This research received no external funding.

Data Availability Statement

Not applicable.

Conflicts of Interest

The authors declare no conflict of interest.

References

  1. Aly, H.M.; Moustafa, M.E.; Nassar, M.Y.; Abdelrahman, E.A. Synthesis and Characterization of Novel Cu (II) Complexes with 3-Substituted-4-Amino-5-Mercapto-1,2,4-Triazole Schiff Bases: A New Route to CuO Nanoparticles. J. Mol. Struct. 2015, 1086, 223–231. [Google Scholar] [CrossRef]
  2. Nassar, M.Y.; Aly, H.M.; Abdelrahman, E.A.; Moustafa, M.E. Synthesis, Characterization, and Biological Activity of Some Novel Schiff Bases and Their Co(II) and Ni(II) Complexes: A New Route for Co3O4 and NiO Nanoparticles for Photocatalytic Degradation of Methylene Blue Dye. J. Mol. Struct. 2017, 1143, 462–471. [Google Scholar] [CrossRef]
  3. Nassar, M.Y.; Aly, H.M.; Moustafa, M.E.; Abdelrahman, E.A. Synthesis, Characterization and Biological Activity of New 3-Substitued-4-Amino-5-Hydrazino-1,2,4-Triazole Schiff Bases and Their Cu(II) Complexes: A New Approach to CuO Nanoparticles for Photocatalytic Degradation of Methylene Blue Dye. J. Inorg. Organomet. Polym. Mater. 2017, 27, 1220–1233. [Google Scholar] [CrossRef]
  4. Nataraj, S.K.; Hosamani, K.M.; Aminabhavi, T.M. Nanofiltration and Reverse Osmosis Thin Film Composite Membrane Module for the Removal of Dye and Salts from the Simulated Mixtures. Desalination 2009, 249, 12–17. [Google Scholar] [CrossRef]
  5. Al-Bastaki, N. Removal of Methyl Orange Dye and Na2so4 Salt from Synthetic Waste Water Using Reverse Osmosis. Chem. Eng. Process. Process Intensif. 2004, 43, 1561–1567. [Google Scholar] [CrossRef]
  6. Ihaddaden, S.; Aberkane, D.; Boukerroui, A.; Robert, D. Removal of Methylene Blue (Basic Dye) by Coagulation-Flocculation with Biomaterials (Bentonite and Opuntia Ficus Indica). J. Water Process Eng. 2022, 49, 102952. [Google Scholar] [CrossRef]
  7. Mcyotto, F.; Wei, Q.; Macharia, D.K.; Huang, M.; Shen, C.; Chow, C.W.K. Effect of Dye Structure on Color Removal Efficiency by Coagulation. Chem. Eng. J. 2021, 405, 126674. [Google Scholar] [CrossRef]
  8. Abdelrahman, E.A. Synthesis of Zeolite Nanostructures from Waste Aluminum Cans for Efficient Removal of Malachite Green Dye from Aqueous Media. J. Mol. Liq. 2018, 253, 72–82. [Google Scholar] [CrossRef]
  9. Nassar, M.Y.; Abdelrahman, E.A. Hydrothermal Tuning of the Morphology and Crystallite Size of Zeolite Nanostructures for Simultaneous Adsorption and Photocatalytic Degradation of Methylene Blue Dye. J. Mol. Liq. 2017, 242, 364–374. [Google Scholar] [CrossRef]
  10. Abdelrahman, E.A.; Hegazey, R.M.; Kotp, Y.H.; Alharbi, A. Spectrochimica Acta Part A: Molecular and Biomolecular Spectroscopy Facile Synthesis of Fe2O3 Nanoparticles from Egyptian Insecticide Cans for Ef Fi Cient Photocatalytic Degradation of Methylene Blue and Crystal Violet Dyes. Spectrochim. Acta Part A Mol. Biomol. Spectrosc. 2019, 222, 117195. [Google Scholar] [CrossRef]
  11. Nassar, M.Y.; Abdelrahman, E.A.; Aly, A.A.; Mohamed, T.Y. A Facile Synthesis of Mordenite Zeolite Nanostructures for Efficient Bleaching of Crude Soybean Oil and Removal of Methylene Blue Dye from Aqueous Media. J. Mol. Liq. 2017, 248, 302–313. [Google Scholar] [CrossRef]
  12. Abdelrahman, E.A.; Hegazey, R.M. Facile Synthesis of HgO Nanoparticles Using Hydrothermal Method for Efficient Photocatalytic Degradation of Crystal Violet Dye Under UV and Sunlight Irradiation. J. Inorg. Organomet. Polym. Mater. 2019, 29, 346–358. [Google Scholar] [CrossRef]
  13. Alharbi, A.; Abdelrahman, E.A. Spectrochimica Acta Part A: Molecular and Biomolecular Spectroscopy Ef Fi Cient Photocatalytic Degradation of Malachite Green Dye Using Facilely Synthesized Hematite Nanoparticles from Egyptian Insecticide Cans. Spectrochim. Acta Part A Mol. Biomol. Spectrosc. 2020, 226, 117612. [Google Scholar] [CrossRef] [PubMed]
  14. Hegazey, R.M.; Abdelrahman, E.A.; Kotp, Y.H.; Hameed, A.M.; Subaihi, A. Facile Fabrication of Hematite Nanoparticles from Egyptian Insecticide Cans for Efficient Photocatalytic Degradation of Rhodamine B Dye. J. Mater. Res. Technol. 2020, 9, 1652–1661. [Google Scholar] [CrossRef]
  15. Abdelghany, M.M.; Ahmed, I.S.; Dessouki, H.A.; Abdelrahman, E.A. Facile Synthesis of CuO and Ag Nanoparticles by Thermal Decomposition of Novel Schiff Base Complexes. J. Inorg. Organomet. Polym. Mater. 2021, 31, 4281–4299. [Google Scholar] [CrossRef]
  16. Niu, R.; Ding, Y.; Hao, L.; Ren, J.; Gong, J.; Qu, J. Plant-Mimetic Vertical-Channel Hydrogels for Synergistic Water Purification and Interfacial Water Evaporation. ACS Appl. Mater. Interfaces 2022, 14, 45533–45544. [Google Scholar] [CrossRef]
  17. He, P.; Bai, H.; Fan, Z.; Hao, L.; Liu, N.; Chen, B.; Niu, R.; Gong, J. Controllable Synthesis of N/Co-Doped Carbon from Metal-Organic Frameworks for Integrated Solar Vapor Generation and Advanced Oxidation Processes. J. Mater. Chem. A 2022, 10, 13378–13392. [Google Scholar] [CrossRef]
  18. Fan, D.; Lu, Y.; Zhang, H.; Xu, H.; Lu, C.; Tang, Y.; Yang, X. Synergy of Photocatalysis and Photothermal Effect in Integrated 0D Perovskite Oxide/2D MXene Heterostructures for Simultaneous Water Purification and Solar Steam Generation. Appl. Catal. B Environ. 2021, 295, 120285. [Google Scholar] [CrossRef]
  19. Abdelwahab, M.A.; El Rayes, S.M.; Kamel, M.M.; Abdelrahman, E.A. Encapsulation of NiS and ZnS in Analcime Nanoparticles as Novel Nanocomposites for the Effective Photocatalytic Degradation of Orange G and Methylene Blue Dyes. Int. J. Environ. Anal. Chem. 2022, 1–18, in press. [Google Scholar] [CrossRef]
  20. Almehizia, A.A.; Al-Omar, M.A.; Naglah, A.M.; Hegazey, R.M.; Al-Wasidi, A.S.; Katouah, H.A.; Basha, M.T.; Alghanmi, R.M.; Khedr, A.M.; Algethami, F.K.; et al. Facile Synthesis of Copper Carbonate/Cobalt Carbonate/Manganese Carbonate and Copper Oxide/Cobalt Manganese Oxide/Manganese Oxide as Novel Nanocomposites for Efficient Photocatalytic Degradation of Crystal Violet Dye. Int. J. Environ. Anal. Chem. 2022, 1–21. [Google Scholar] [CrossRef]
  21. Amalina, F.; Syukor, A.; Razak, A.; Krishnan, S.; Zularisam, A.W.; Nasrullah, M. A Review of Eco-Sustainable Techniques for the Removal of Rhodamine B Dye Utilizing Biomass Residue Adsorbents. Phys. Chem. Earth 2022, 128, 103267. [Google Scholar] [CrossRef]
  22. Srivind, J.; Nagarethinam, V.S.; Suganya, M.; Balamurugan, S.; Prabha, D.; Balu, A.R. Visible Light Irradiated Photocatalytic Performance of SnS2-CdO Nanocomposite against the Degradation of Rhodamine B (Cationic) and Congo Red (Anionic) Dyes. Mater. Sci. Eng. B Solid-State Mater. Adv. Technol. 2020, 255, 114530. [Google Scholar] [CrossRef]
  23. Oladoye, P.O.; Bamigboye, M.O.; Ogunbiyi, O.D.; Akano, M.T. Toxicity and Decontamination Strategies of Congo Red Dye. Groundw. Sustain. Dev. 2022, 19, 100844. [Google Scholar] [CrossRef]
  24. In, S.-I.; Berg, R. Visible Light Induced Degradation of Methylene Blue on Titanium Oxo Ethoxo Clusters of Type Ti16O16(OEt)32. Asian J. Chem. 2012, 24, 428–432. [Google Scholar]
  25. In, S.; Vesborg, P.C.K.; Abrams, B.L.; Hou, Y.; Chorkendorff, I. A Comparative Study of Two Techniques for Determining Photocatalytic Activity of Nitrogen Doped TiO2 Nanotubes under Visible Light Irradiation: Photocatalytic Reduction of Dye and Photocatalytic O. J. Photochem. Photobiol. A Chem. 2011, 222, 258–262. [Google Scholar] [CrossRef]
  26. Shammi, Z.M.; Kianfar, A.; Momeni, M.M. Photocatalytic Degradation and Mineralization of Dye Pollutants from Wastewater under Visible Light Using Synthetic CuO-VO2/TiO2 Nanotubes/Nanosheets. J. Mater. Sci. Mater. Electron. 2021, 32, 20149–20163. [Google Scholar] [CrossRef]
  27. Castro, L.V.; Ortíz-Islas, E.; Manríquez, M.E.; Albiter, E.; Cabrera-Sierra, R.; Alvarado-Zavala, B. Photocatalytic Degradation of Mixed Dyes in Aqueous Phase by MgAlTi and ZnAlTi Mixed Oxides. Top. Catal. 2021, 64, 97–111. [Google Scholar] [CrossRef]
  28. Nasr, R.A.; Abbas, H.A.; Vannier, R.N.; Jamil, T.S. Preparation, Characterization and Photocatalytic Decolorization Process for the Removal of Orange-Green Dye Using Perovskites Ba1-XBixFeO3-δ (x = 0, 0.05, 0.1). Inorg. Nano-Metal Chem. 2022, 52, 1123–1133. [Google Scholar] [CrossRef]
  29. Sodeinde, K.O.; Olusanya, S.O.; Enogheghase, V.F.; Lawal, O.S. Photocatalytic Degradation of Janus Green Blue Dye in Wastewater by Green Synthesised Reduced Graphene Oxide-Silver Nanocomposite. Int. J. Environ. Anal. Chem. 2022, 1–17. [Google Scholar] [CrossRef]
  30. Patil, S.P.; Shrivastava, V.S.; Sonawane, G.H. Photocatalytic Degradation of Rhodamine 6G Using ZnO-Montmorillonite Nanocomposite: A Kinetic Approach. Desalination Water Treat. 2015, 54, 374–381. [Google Scholar] [CrossRef]
  31. Mahadwad, O.K.; Parikh, P.A.; Jasra, R.V.; Patil, C. Photocatalytic Degradation of Reactive Black-5 Dye Using TiO2-Impregnated Activated Carbon. Environ. Technol. 2012, 33, 307–312. [Google Scholar] [CrossRef] [PubMed]
  32. Amoli, A.E.; Masoumi, M.; Sharifzadeh, M.; Babaei, F.; Firouzzade Pasha, G. Synthesis of TiO2-Fe2O3 Nanocomposite for the Photocatalytic Degradation of Direct Blue 199 and Basic Yellow 28 Dyes under Visible Light Irradiation. J. Dispers. Sci. Technol. 2021, 1–9. [Google Scholar] [CrossRef]
  33. Salavati-Niasari, M.; Soofivand, F.; Sobhani-Nasab, A.; Shakouri-Arani, M.; Hamadanian, M.; Bagheri, S. Facile Synthesis and Characterization of CdTiO3 Nanoparticles by Pechini Sol–Gel Method. J. Mater. Sci. Mater. Electron. 2017, 28, 14965–14973. [Google Scholar] [CrossRef]
  34. Hajizadeh-Oghaz, M.; Razavi, R.S.; Barekat, M.; Naderi, M.; Malekzadeh, S.; Rezazadeh, M. Synthesis and Characterization of Y2O3 Nanoparticles by Sol–Gel Process for Transparent Ceramics Applications. J. Sol-Gel Sci. Technol. 2016, 78, 682–691. [Google Scholar] [CrossRef]
  35. Potůček, Z.; Trepakov, V.A.; Makarova, M.V.; Sazama, P.; Badalyan, A.G.; Dejneka, A.; Jastrabik, L. Luminescent Impurity Ion Probe and Low Temperature Phase of SrTiO3 Nanoparticles. Mater. Sci. Technol. 2009, 25, 1334–1340. [Google Scholar] [CrossRef]
  36. Wu, Y.T.; Wang, X.F.; Yu, C.L.; Li, E.Y. Preparation and Characterization of Barium Titanate (BaTiO3) Nano-Powders by Pechini Sol-Gel Method. Mater. Manuf. Process. 2012, 27, 1329–1333. [Google Scholar] [CrossRef]
  37. Abdelrahman, E.A.; Hegazey, R.M. Utilization of Waste Aluminum Cans in the Fabrication of Hydroxysodalite Nanoparticles and Their Chitosan Biopolymer Composites for the Removal of Ni(II) and Pb(II) Ions from Aqueous Solutions: Kinetic, Equilibrium, and Reusability Studies. Microchem. J. 2019, 145, 18–25. [Google Scholar] [CrossRef]
  38. Abdelrahman, E.A.; Hegazey, R.M. Exploitation of Egyptian Insecticide Cans in the Fabrication of Si/Fe Nanostructures and Their Chitosan Polymer Composites for the Removal of Ni(II), Cu(II), and Zn(II) Ions from Aqueous Solutions. Compos. Part B Eng. 2019, 166, 382–400. [Google Scholar] [CrossRef]
  39. Abdelrahman, E.A.; Abou El-Reash, Y.G.; Youssef, H.M.; Kotp, Y.H.; Hegazey, R.M. Utilization of Rice Husk and Waste Aluminum Cans for the Synthesis of Some Nanosized Zeolite, Zeolite/Zeolite, and Geopolymer/Zeolite Products for the Efficient Removal of Co(II), Cu(II), and Zn(II) Ions from Aqueous Media. J. Hazard. Mater. 2021, 401, 123813. [Google Scholar] [CrossRef]
  40. Krishnan, S.G.; Harilal, M.; Arshid, N.; Jagadish, P.; Khalid, M.; Li, L.P. Rapid Microwave-Assisted Synthesis of MnCo2O4 Nanoflakes as a Cathode for Battery-Supercapacitor Hybrid. J. Energy Storage 2021, 44, 103566. [Google Scholar] [CrossRef]
  41. Chakraborty, M.; Bera, K.K.; Chatterjee, S.; Ghosh, A.; Bhattacharya, S.K. Synthesis of Mesoporous BiOI Flower and Facile In-Situ Preparation of BiOI/BiOCl Mixture for Enhanced Photocatalytic Degradation of Toxic Dye, Rhodamine-B. J. Photochem. Photobiol. 2021, 8, 100077. [Google Scholar] [CrossRef]
  42. Hamza, M.A.; Abd El-Rahman, S.A.; Abou-Gamra, Z.M. Facile One-Pot Solid-State Fabrication of a Novel Binary Nanocomposite of Commercial ZnO and Commercial PbCrO4 with Enhanced Photocatalytic Degradation of Rhodamine B Dye. Opt. Mater. 2022, 124, 111987. [Google Scholar] [CrossRef]
  43. Maruthupandy, M.; Muneeswaran, T.; Chackaravarthi, G.; Vennila, T.; Anand, M.; Cho, W.S.; Quero, F. Synthesis of Chitosan/SnO2 Nanocomposites by Chemical Precipitation for Enhanced Visible Light Photocatalytic Degradation Efficiency of Congo Red and Rhodamine-B Dye Molecules. J. Photochem. Photobiol. A Chem. 2022, 430, 113972. [Google Scholar] [CrossRef]
  44. Bilgic, A. Fabrication of MonoBODIPY-Functionalized Fe3O4@SiO2@TiO2 Nanoparticles for the Photocatalytic Degradation of Rhodamine B under UV Irradiation and the Detection and Removal of Cu(II) Ions in Aqueous Solutions. J. Alloys Compd. 2022, 899, 163360. [Google Scholar] [CrossRef]
  45. Rafieezadeh, M.; Kianfar, A.H. Fabrication of Heterojunction Ternary Fe3O4/TiO2/CoMoO4 as a Magnetic Photocatalyst for Organic Dyes Degradation under Sunlight Irradiation. J. Photochem. Photobiol. A Chem. 2022, 423, 113596. [Google Scholar] [CrossRef]
  46. Madima, N.; Kefeni, K.K.; Mishra, S.B.; Mishra, A.K.; Kuvarega, A.T. Fabrication of Magnetic Recoverable Fe3O4/TiO2 Heterostructure for Photocatalytic Degradation of Rhodamine B Dye. Inorg. Chem. Commun. 2022, 145, 109966. [Google Scholar] [CrossRef]
  47. Jansanthea, P.; Kanthabangharn, J.; Chomkitichai, W.; Ketwaraporn, J. Temperature-Controlled Synthesis and Photocatalytic Properties of ZnO-SnO2 Nanocomposites. J. Aust. Ceram. Soc. 2021, 57, 579–588. [Google Scholar] [CrossRef]
  48. Davis, M.; Hung-Low, F.; Hikal, W.M.; Hope-Weeks, L.J. Enhanced Photocatalytic Performance of Fe-Doped SnO2 Nanoarchitectures under UV Irradiation: Synthesis and Activity. J. Mater. Sci. 2013, 48, 6404–6409. [Google Scholar] [CrossRef]
  49. Hokonya, N.; Mahamadi, C.; Mukaratirwa-Muchanyereyi, N.; Gutu, T.; Zvinowanda, C. Green Synthesis of P − ZrO2CeO2ZnO Nanoparticles Using Leaf Extracts of Flacourtia Indica and Their Application for the Photocatalytic Degradation of a Model Toxic Dye, Congo Red. Heliyon 2022, 8, e10277. [Google Scholar] [CrossRef]
  50. Güy, N.; Özacar, M. The Influence of Noble Metals on Photocatalytic Activity of ZnO for Congo Red Degradation. Int. J. Hydrogen Energy 2016, 41, 20100–20112. [Google Scholar] [CrossRef]
  51. Jabbar, Z.H.; Graimed, B.H.; Issa, M.A.; Ammar, S.H.; Ebrahim, S.E.; Khadim, H.J.; Okab, A.A. Photocatalytic Degradation of Congo Red Dye Using Magnetic Silica-Coated Ag2WO4/Ag2S as Type I Heterojunction Photocatalyst: Stability and Mechanisms Studies. Mater. Sci. Semicond. Process. 2023, 153, 107151. [Google Scholar] [CrossRef]
  52. Magdalane, C.M.; Priyadharsini, G.M.A.; Kaviyarasu, K.; Jothi, A.I.; Simiyon, G.G. Synthesis and Characterization of TiO2 Doped Cobalt Ferrite Nanoparticles via Microwave Method: Investigation of Photocatalytic Performance of Congo Red Degradation Dye. Surf. Interfaces 2021, 25, 101296. [Google Scholar] [CrossRef]
  53. Feng, K.; Zhang, L.; Gong, J.; Qu, J.; Niu, R. Visible Light Triggered Exfoliation of COF Micro/Nanomotors for Efficient Photocatalysis. Green Energy Environ. 2021; in press. [Google Scholar] [CrossRef]
  54. Maggard, P.A. Capturing Metastable Oxide Semiconductors for Applications in Solar Energy Conversion. Acc. Chem. Res. 2021, 54, 3160–3171. [Google Scholar] [CrossRef] [PubMed]
  55. Feng, K.; Gong, J.; Qu, J.; Niu, R. Dual-Mode-Driven Micromotor Based on Foam-like Carbon Nitride and Fe3O4 with Improved Manipulation and Photocatalytic Performance. ACS Appl. Mater. Interfaces 2022. [Google Scholar] [CrossRef]
  56. Li, J.; Li, J.; Wu, C.; Li, Z.; Cai, L.; Tang, H.; Zhou, Z.; Wang, G.; Wang, J.; Zhao, L.; et al. Crystalline Carbon Nitride Anchored on MXene as an Ordered Schottky Heterojunction Photocatalyst for Enhanced Visible-Light Hydrogen Evolution. Carbon. 2021, 179, 387–399. [Google Scholar] [CrossRef]
Scheme 1. The synthesizing steps of the nanomaterials.
Nanomaterials 12 03992 sch001
Figure 1. The X-ray diffraction patterns of the Fe0.5Mn0.5Co2O4/Fe2O3 (A) and Mn0.5Zn0.5Fe2O4/Fe2O3 (B) samples.
Nanomaterials 12 03992 g001
Figure 2. The energy dispersive X-ray patterns of the Fe0.5Mn0.5Co2O4/Fe2O3 (A) and Mn0.5Zn0.5Fe2O4/Fe2O3 (B) samples.
Nanomaterials 12 03992 g002
Figure 3. The plot of the volume adsorbed against the relative pressure for the Fe0.5Mn0.5Co2O4/Fe2O3 (A) and Mn0.5Zn0.5Fe2O4/Fe2O3 (B) samples.
Nanomaterials 12 03992 g003
Figure 4. The scanning electron microscopy images of the Fe0.5Mn0.5Co2O4/Fe2O3 (A) and Mn0.5Zn0.5Fe2O4/Fe2O3 (B) samples.
Nanomaterials 12 03992 g004
Figure 5. The transmission electron microscopy images of the Fe0.5Mn0.5Co2O4/Fe2O3 (A) and Mn0.5Zn0.5Fe2O4/Fe2O3 (B) samples.
Nanomaterials 12 03992 g005
Figure 6. The FT-IR spectra of the Fe0.5Mn0.5Co2O4/Fe2O3 (A) and Mn0.5Zn0.5Fe2O4/Fe2O3 (B) samples.
Nanomaterials 12 03992 g006
Figure 7. The plot of (F(R)hυ)2 against hυ for the Fe0.5Mn0.5Co2O4/Fe2O3 (A) and Mn0.5Zn0.5Fe2O4/Fe2O3 (B) samples.
Nanomaterials 12 03992 g007
Figure 8. The plot of % D against pH for the degradation of Rhodamine B and Congo Red dyes using the Fe0.5Mn0.5Co2O4/Fe2O3 (A) and Mn0.5Zn0.5Fe2O4/Fe2O3 (B) samples. Experimental parameters: Concentration of dye = 20 mg/L; Volume of dye = 100 mL; Quantity of catalyst = 0.1 g; UV irradiation time = 100 min.
Nanomaterials 12 03992 g008
Figure 9. The plot of % D against time for the degradation of Rhodamine B and Congo Red dyes using the Fe0.5Mn0.5Co2O4/Fe2O3 (A) and Mn0.5Zn0.5Fe2O4/Fe2O3 (B) samples. Experimental parameters: Concentration of dye = 20 mg/L; Volume of dye = 100 mL; Quantity of catalyst = 0.1 g; pH = 8 and 3 in the case of Rhodamine B and Congo Red dyes, respectively.
Nanomaterials 12 03992 g009
Figure 10. The plot of ln (Xd/Xe) against t for the degradation of Rhodamine B and Congo Red dyes using the Fe0.5Mn0.5Co2O4/Fe2O3 (A) and Mn0.5Zn0.5Fe2O4/Fe2O3 (B) samples.
Nanomaterials 12 03992 g010
Figure 11. The plot of % D against the quantity of the Fe0.5Mn0.5Co2O4/Fe2O3 (A) and Mn0.5Zn0.5Fe2O4/Fe2O3 (B) samples for the degradation of Rhodamine B and Congo Red dyes. Experimental parameters: Concentration of dye = 20 mg/L; Volume of dye = 100 mL; pH = 8 and 3 in the case of Rhodamine B and Congo Red dyes, respectively. Time = 80 and 50 min in the absence and presence of H2O2, respectively.
Nanomaterials 12 03992 g011
Figure 12. The plot of % D against the concentration of Rhodamine B and Congo Red dyes using the Fe0.5Mn0.5Co2O4/Fe2O3 (A) and Mn0.5Zn0.5Fe2O4/Fe2O3 (B) samples. Experimental parameters: Volume of dye = 100 mL; Quantity of catalyst = 0.1 g; pH = 8 and 3 in the case of Rhodamine B and Congo Red dyes, respectively. Time = 80 and 50 min in the absence and presence of H2O2, respectively.
Nanomaterials 12 03992 g012
Figure 13. The plot of % D against cycle number for the degradation of Rhodamine B and Congo Red dyes using the Fe0.5Mn0.5Co2O4/Fe2O3 (A) and Mn0.5Zn0.5Fe2O4/Fe2O3 (B) samples.
Nanomaterials 12 03992 g013
Figure 14. The suggested mechanism for the degradation of Rhodamine B and Congo Red dyes using the Fe0.5Mn0.5Co2O4/Fe2O3 and Mn0.5Zn0.5Fe2O4/Fe2O3 samples.
Nanomaterials 12 03992 g014
Table 1. The weight percentages of the elements in the synthesized samples.
ElementsWt %
Fe0.5Mn0.5Co2O4/Fe2O3Mn0.5Zn0.5Fe2O4/Fe2O3
Fe75.1069.51
Mn6.064.52
Co8.24----
Zn----10.29
O10.6015.68
Table 2. The BET surface area, total pore volume, and average pore size of the synthesized samples.
Surface PropertiesSample
Mn0.5Zn0.5Fe2O4/Fe2O3Fe0.5Mn0.5Co2O4/Fe2O3
BET surface area (m2/g)62.730544.2141
Total pore volume (cc/g)0.04900.0925
Average pore size (nm)1.72353.2579
Table 3. The k and R2 values for the degradation of Rhodamine B and Congo Red dyes using the Fe0.5Mn0.5Co2O4/Fe2O3 sample.
Dyek (1/min)R2
With H2O2Without H2O2With H2O2Without H2O2
Rhodamine B dye0.00760.04140.91390.9993
Congo Red dye0.00610.03420.94790.9939
Table 4. The k and R2 values for the degradation of Rhodamine B and Congo Red dyes using the Mn0.5Zn0.5Fe2O4/Fe2O3 sample.
Dyek (1/min)R2
With H2O2Without H2O2With H2O2Without H2O2
Rhodamine B dye0.00810.04750.00570.0303
Congo Red dye0.93180.96950.96960.9965
Table 5. Comparison between the photocatalytic activities of the Fe0.5Mn0.5Co2O4/Fe2O3 and Mn0.5Zn0.5Fe2O4/Fe2O3 samples and those of other catalysts in earlier studies toward the Rhodamine B dye.
CatalystConcentration of Dye (mg/L)Volume of Dye (mL)Amount of Catalyst (g)% DTime (min)Ref
BiOI/BiOCl composite5500.02599.260[41]
ZnO/PbCrO4 composite4.791000.19560[42]
Chitosan/SnO2 composite 4.791000.059560[43]
Fe3O4/SiO2/TiO2 composite30500.0529.560[44]
Fe3O4/TiO2/CoMoO4 composite20500.0598.717[45]
Fe3O4/TiO2 composite 101000.0591120[46]
ZnO/SnO2 composite0.958500.0580120[47]
Fe/SnO2 composite10500.02555120[48]
Fe0.5Mn0.5Co2O4/Fe2O3 composite201000.110050This study
Mn0.5Zn0.5Fe2O4/Fe2O3 nanocomposite201000.110050This study
Table 6. Comparison between the photocatalytic activities of the Fe0.5Mn0.5Co2O4/Fe2O3 and Mn0.5Zn0.5Fe2O4/Fe2O3 samples and those of other catalysts in earlier studies toward the Congo Red dye.
CatalystConcentration of Dye (mg/L)Volume of Dye (mL)Amount of Catalyst (g)% DTime (min)Ref
ZrO2/CeO2/ZnO101000.00586250[49]
Au/ZnO161000.0577.2150[50]
Ag/ZnO161000.0581.6150[50]
Magnetic silica-coated Ag2WO4/Ag2S 201000.199.5140[51]
TiO2-doped cobalt ferrite 101000.0885120[52]
Fe0.5Mn0.5Co2O4/Fe2O3 composite201000.110050This study
Mn0.5Zn0.5Fe2O4/Fe2O3 nanocomposite201000.110050This study
Publisher’s Note: MDPI stays neutral with regard to jurisdictional claims in published maps and institutional affiliations.

