
Highly Efficient Blood Protein Analysis Using Membrane Purification Technique and Super-Hydrophobic SERS Platform for Precise Screening and Staging of Nasopharyngeal Carcinoma

 , ,
, ,
Abstract
:1. Introduction
2. Materials and Methods
2.1. Collection of Human Blood Plasma
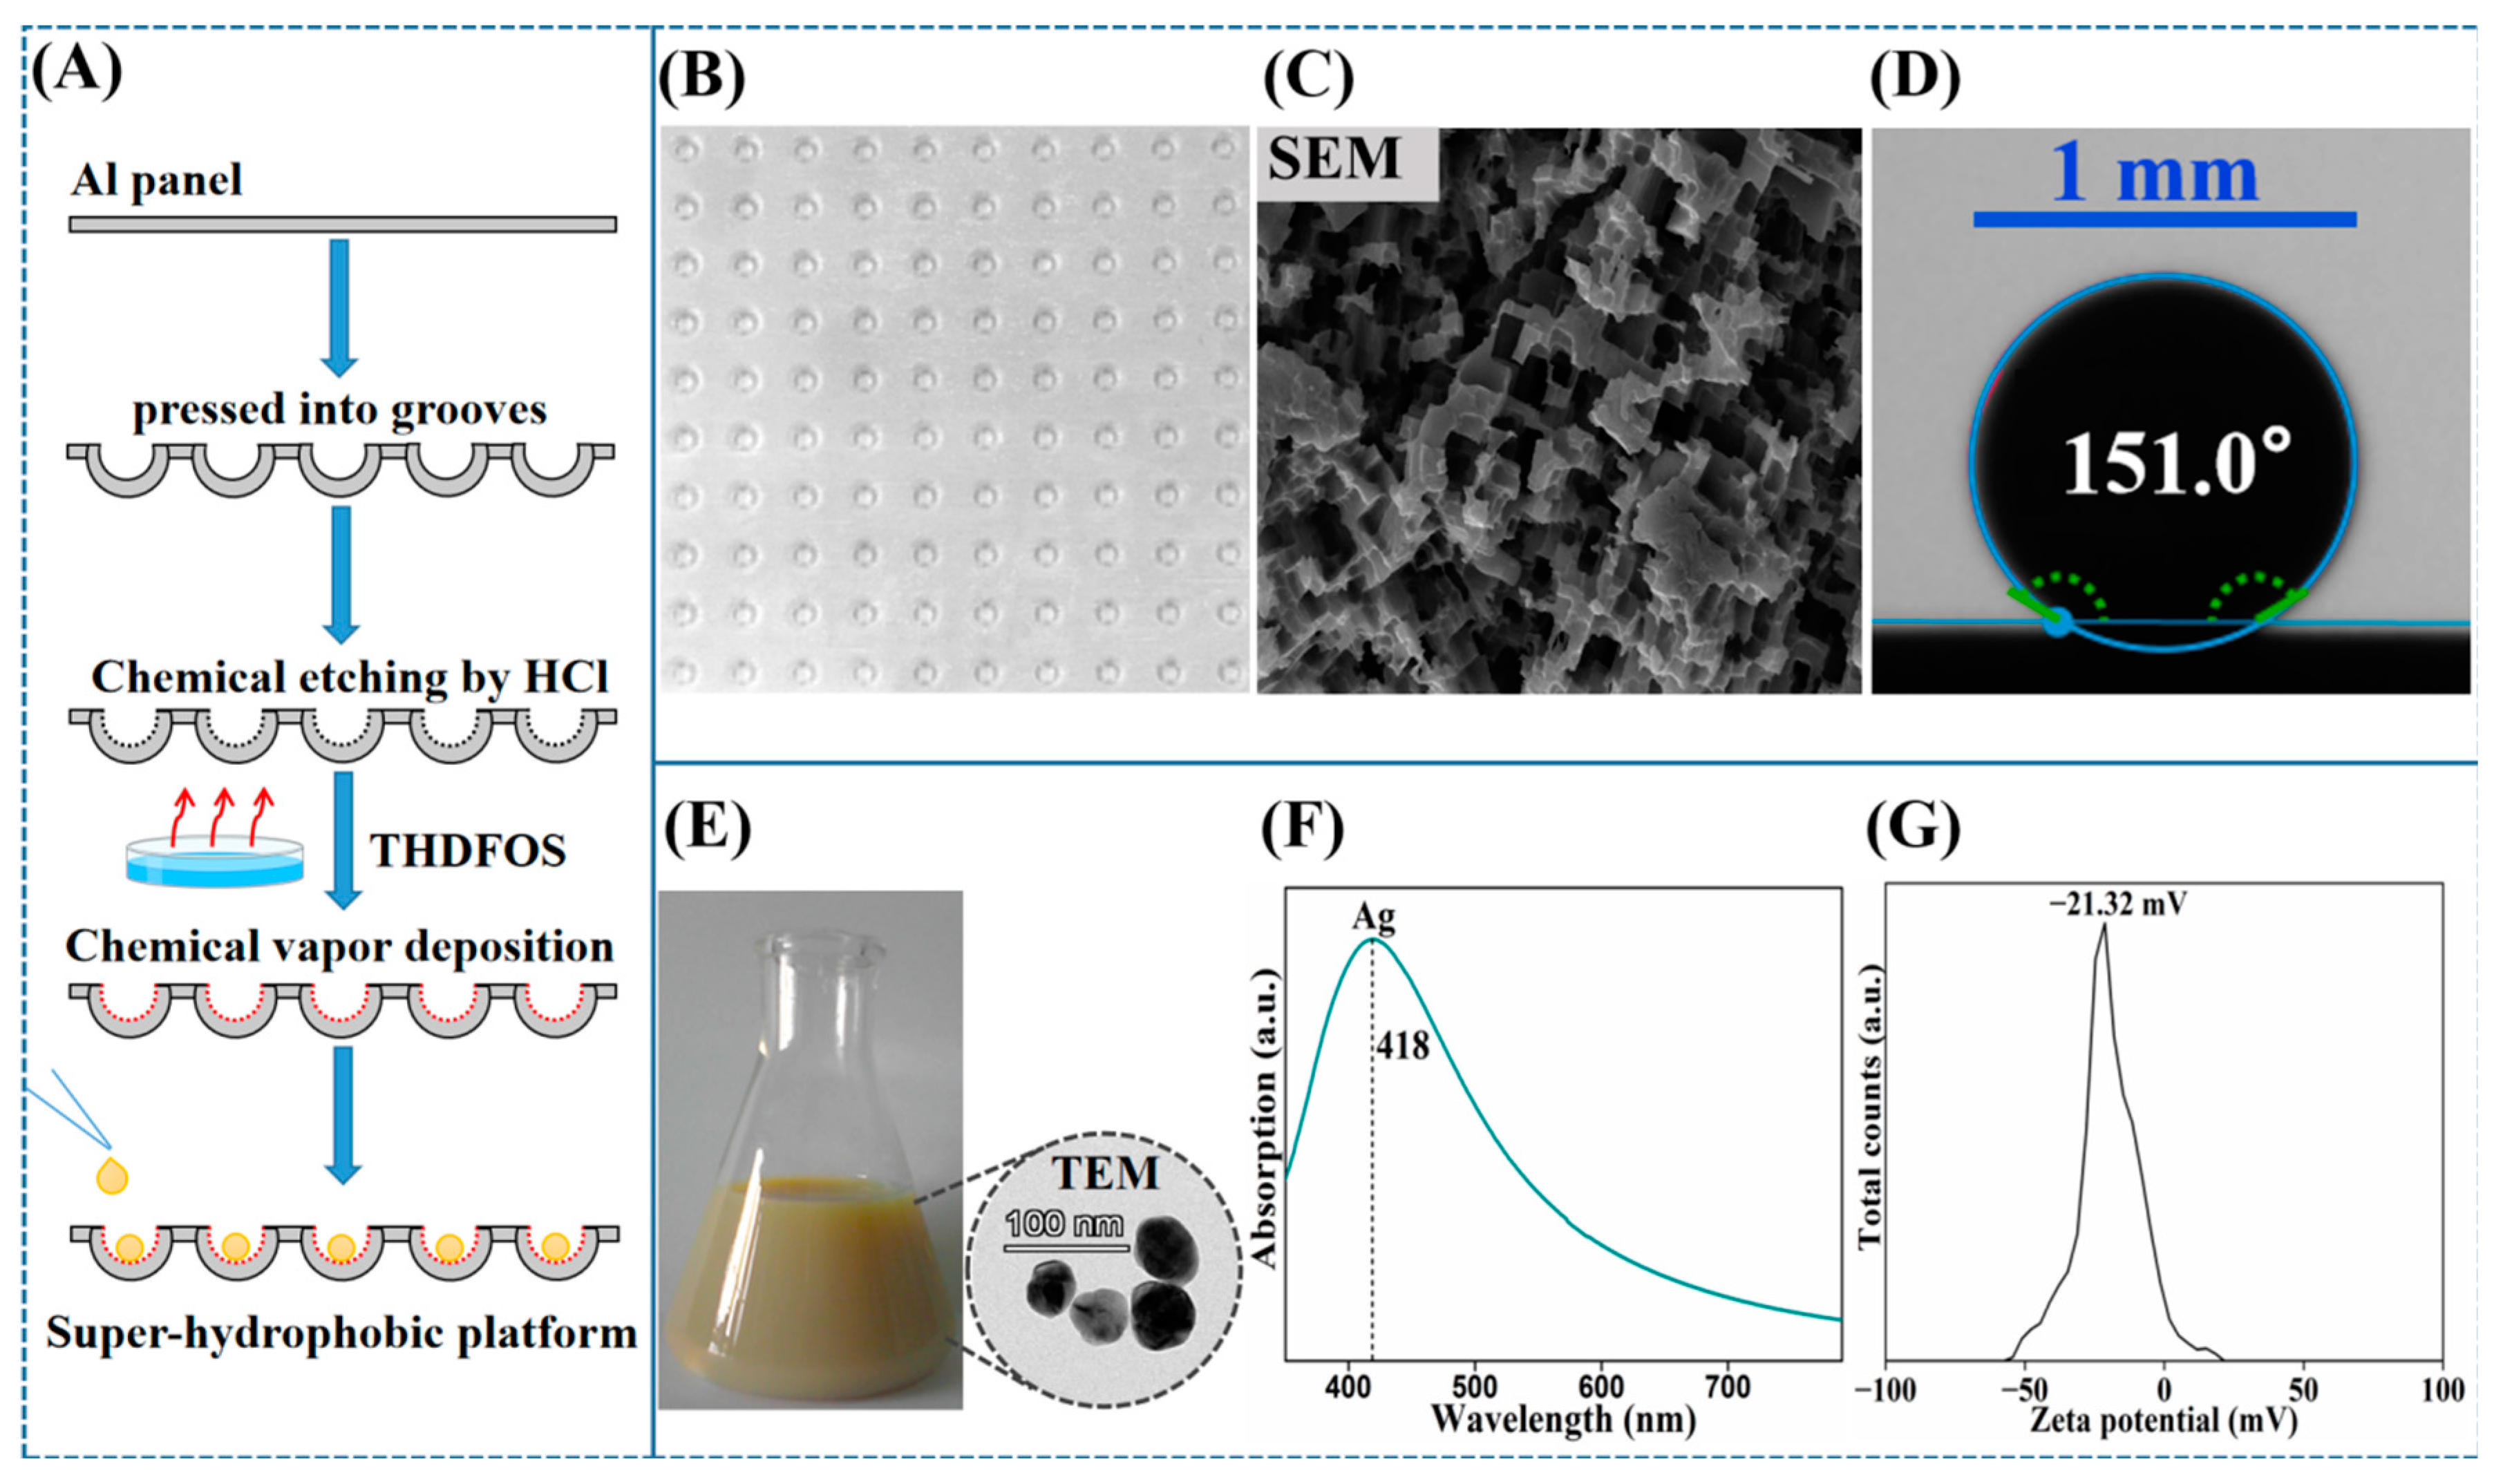
2.2. Preparation of Super-Hydrophobic Platform and Ag NPs
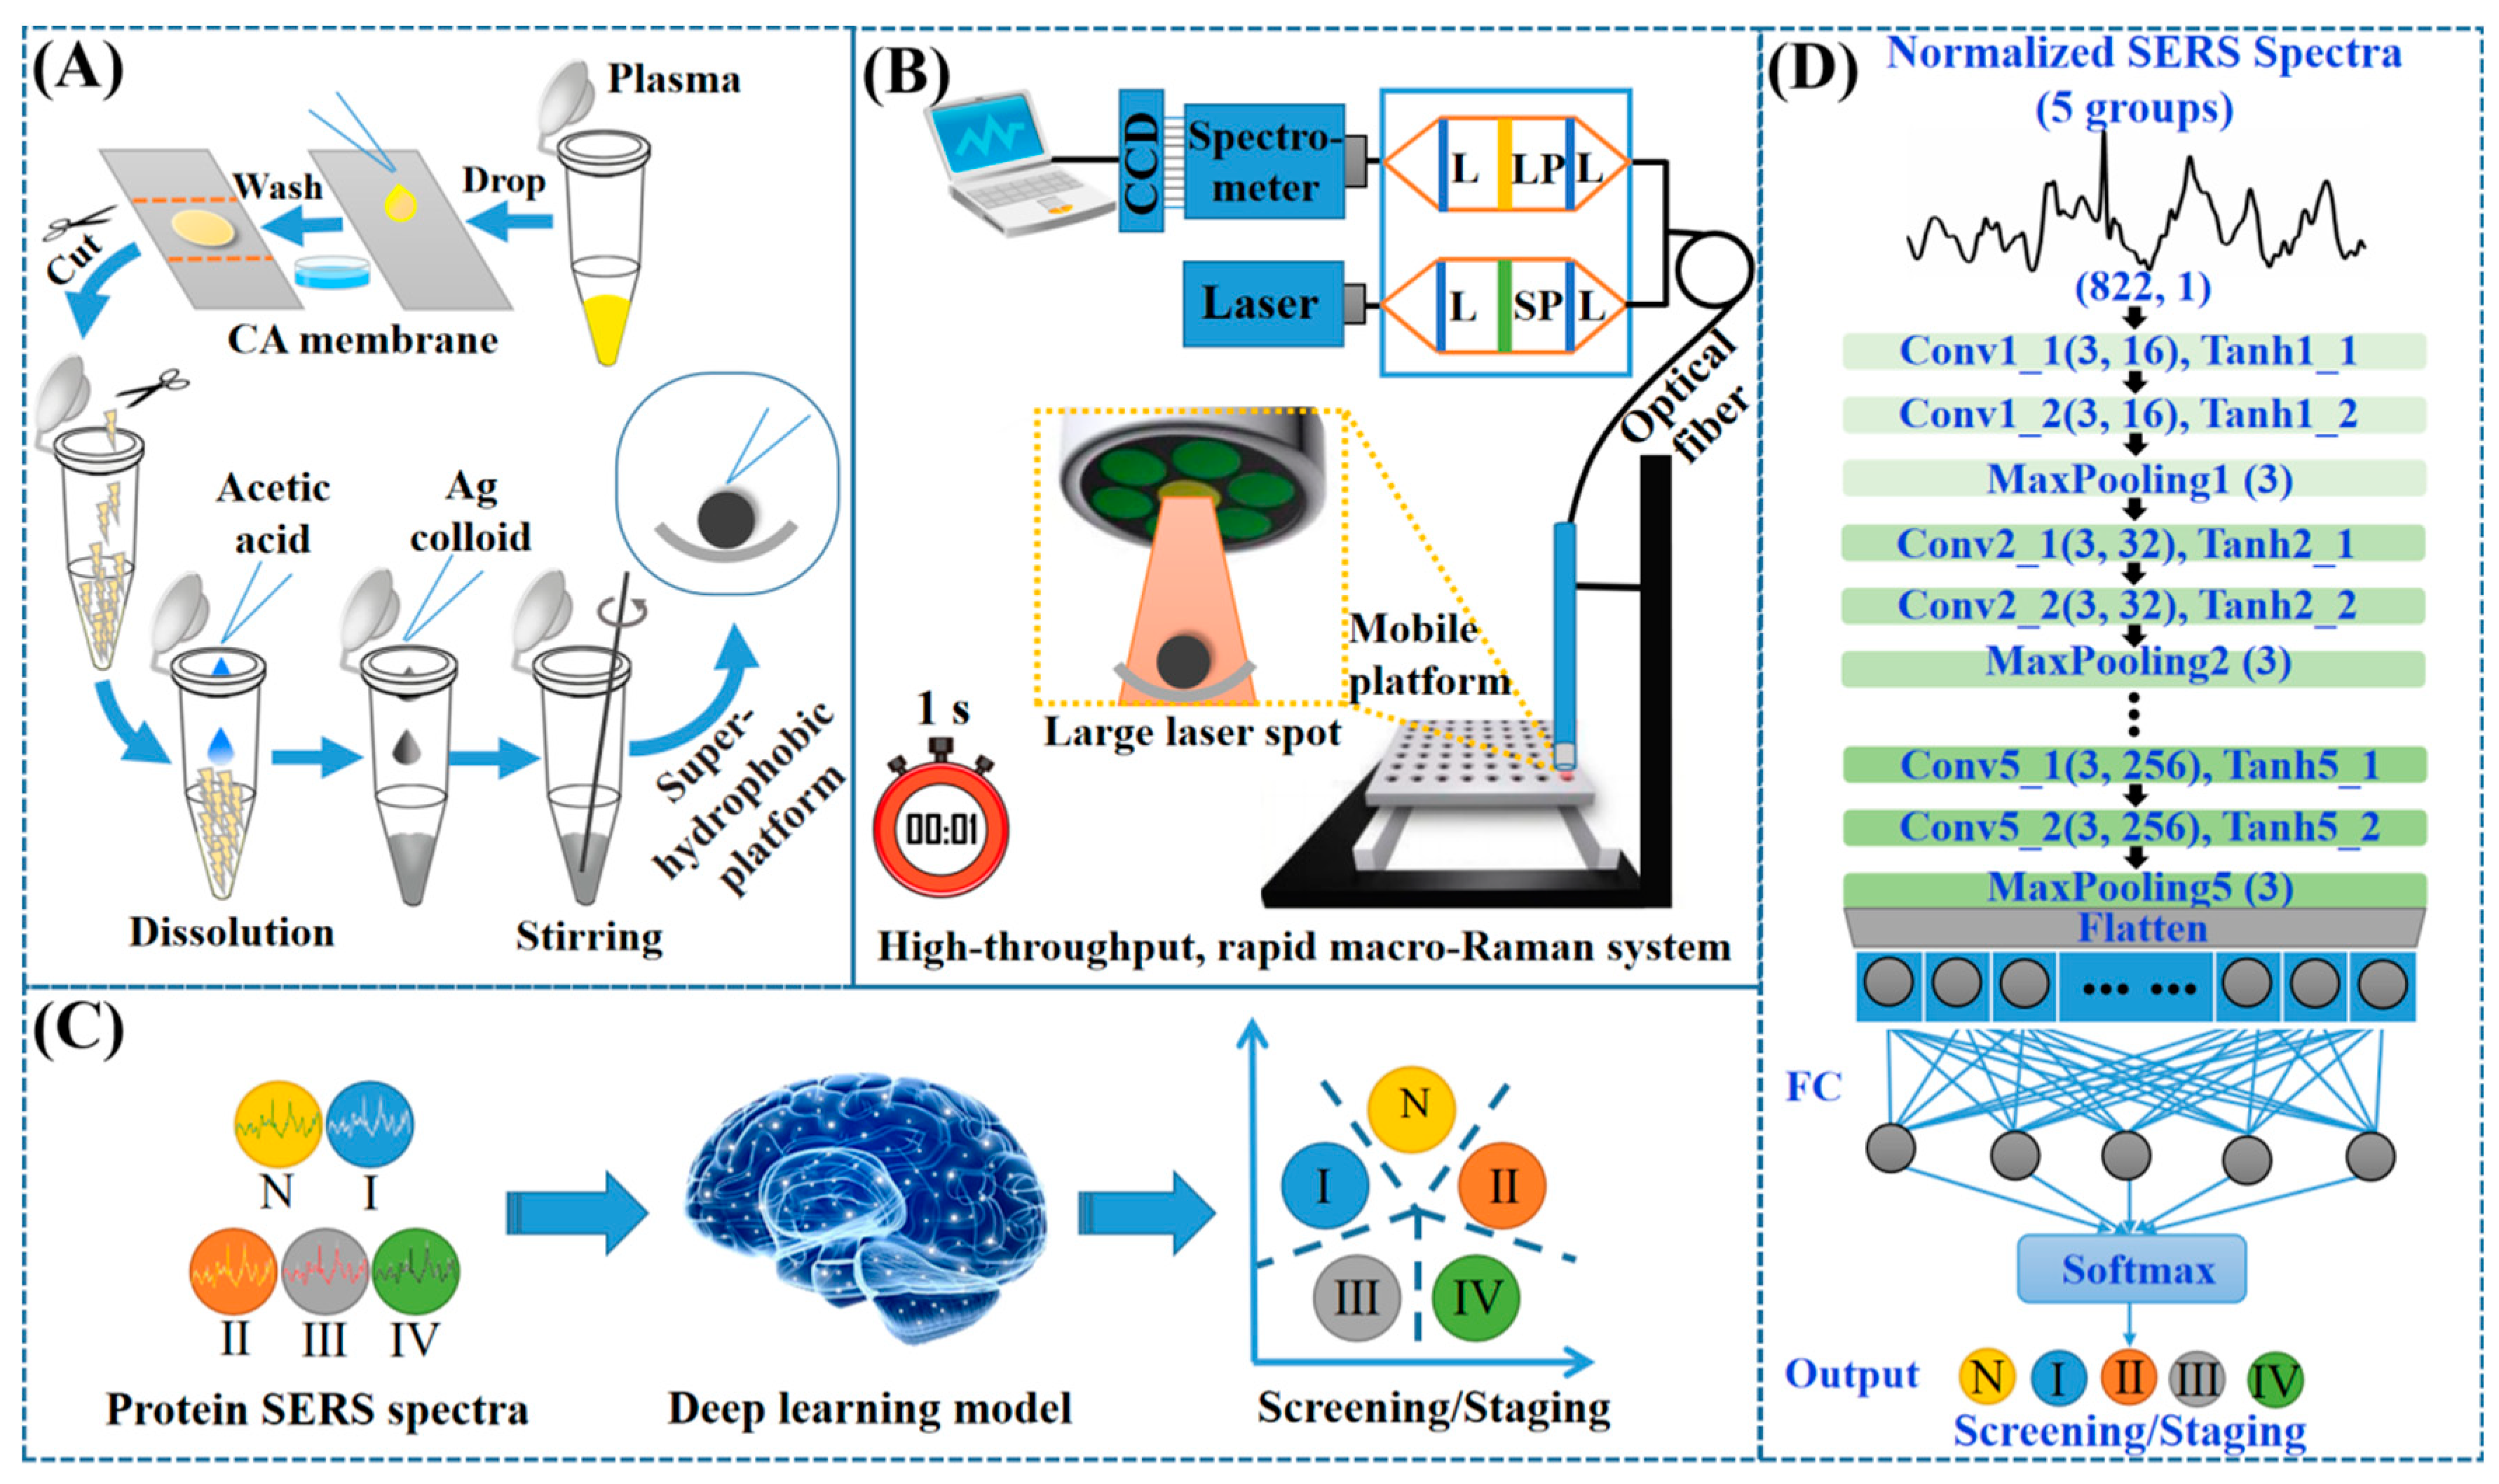
2.3. Purification of Plasma Protein
2.4. Construction of High-Throughput, Rapid Macro-Raman System
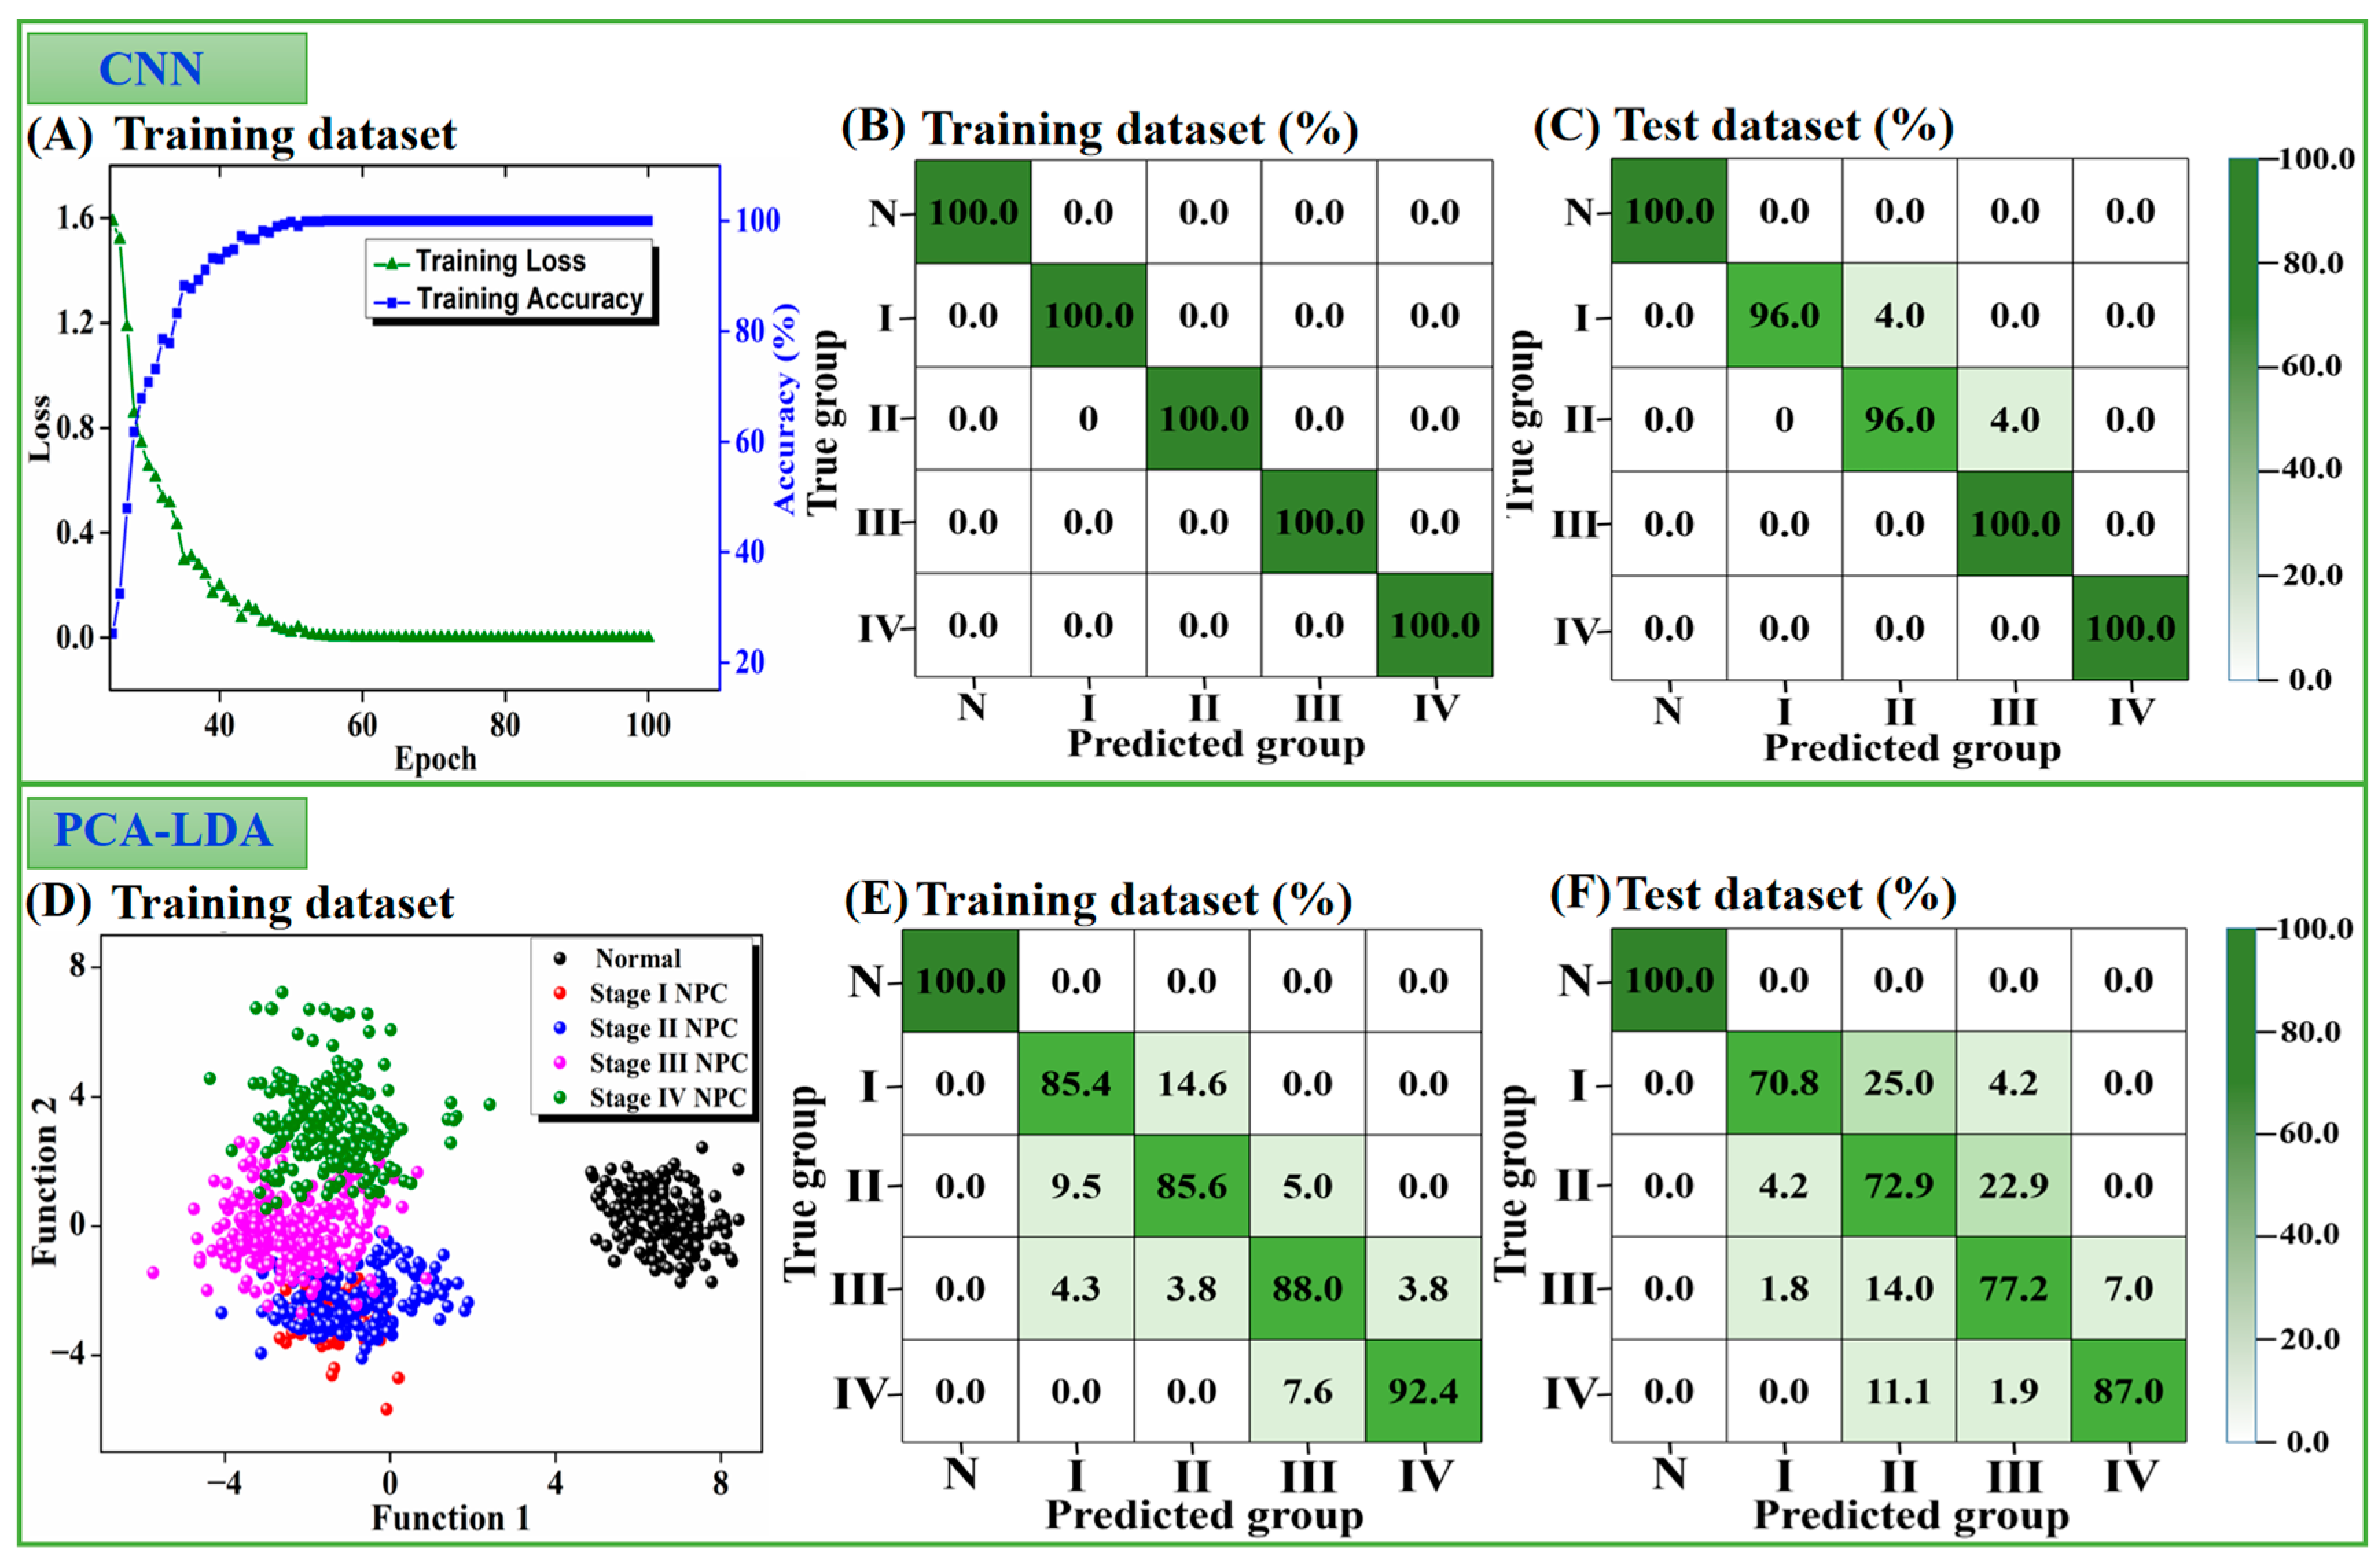
2.5. Construction of Deep-Learning Model
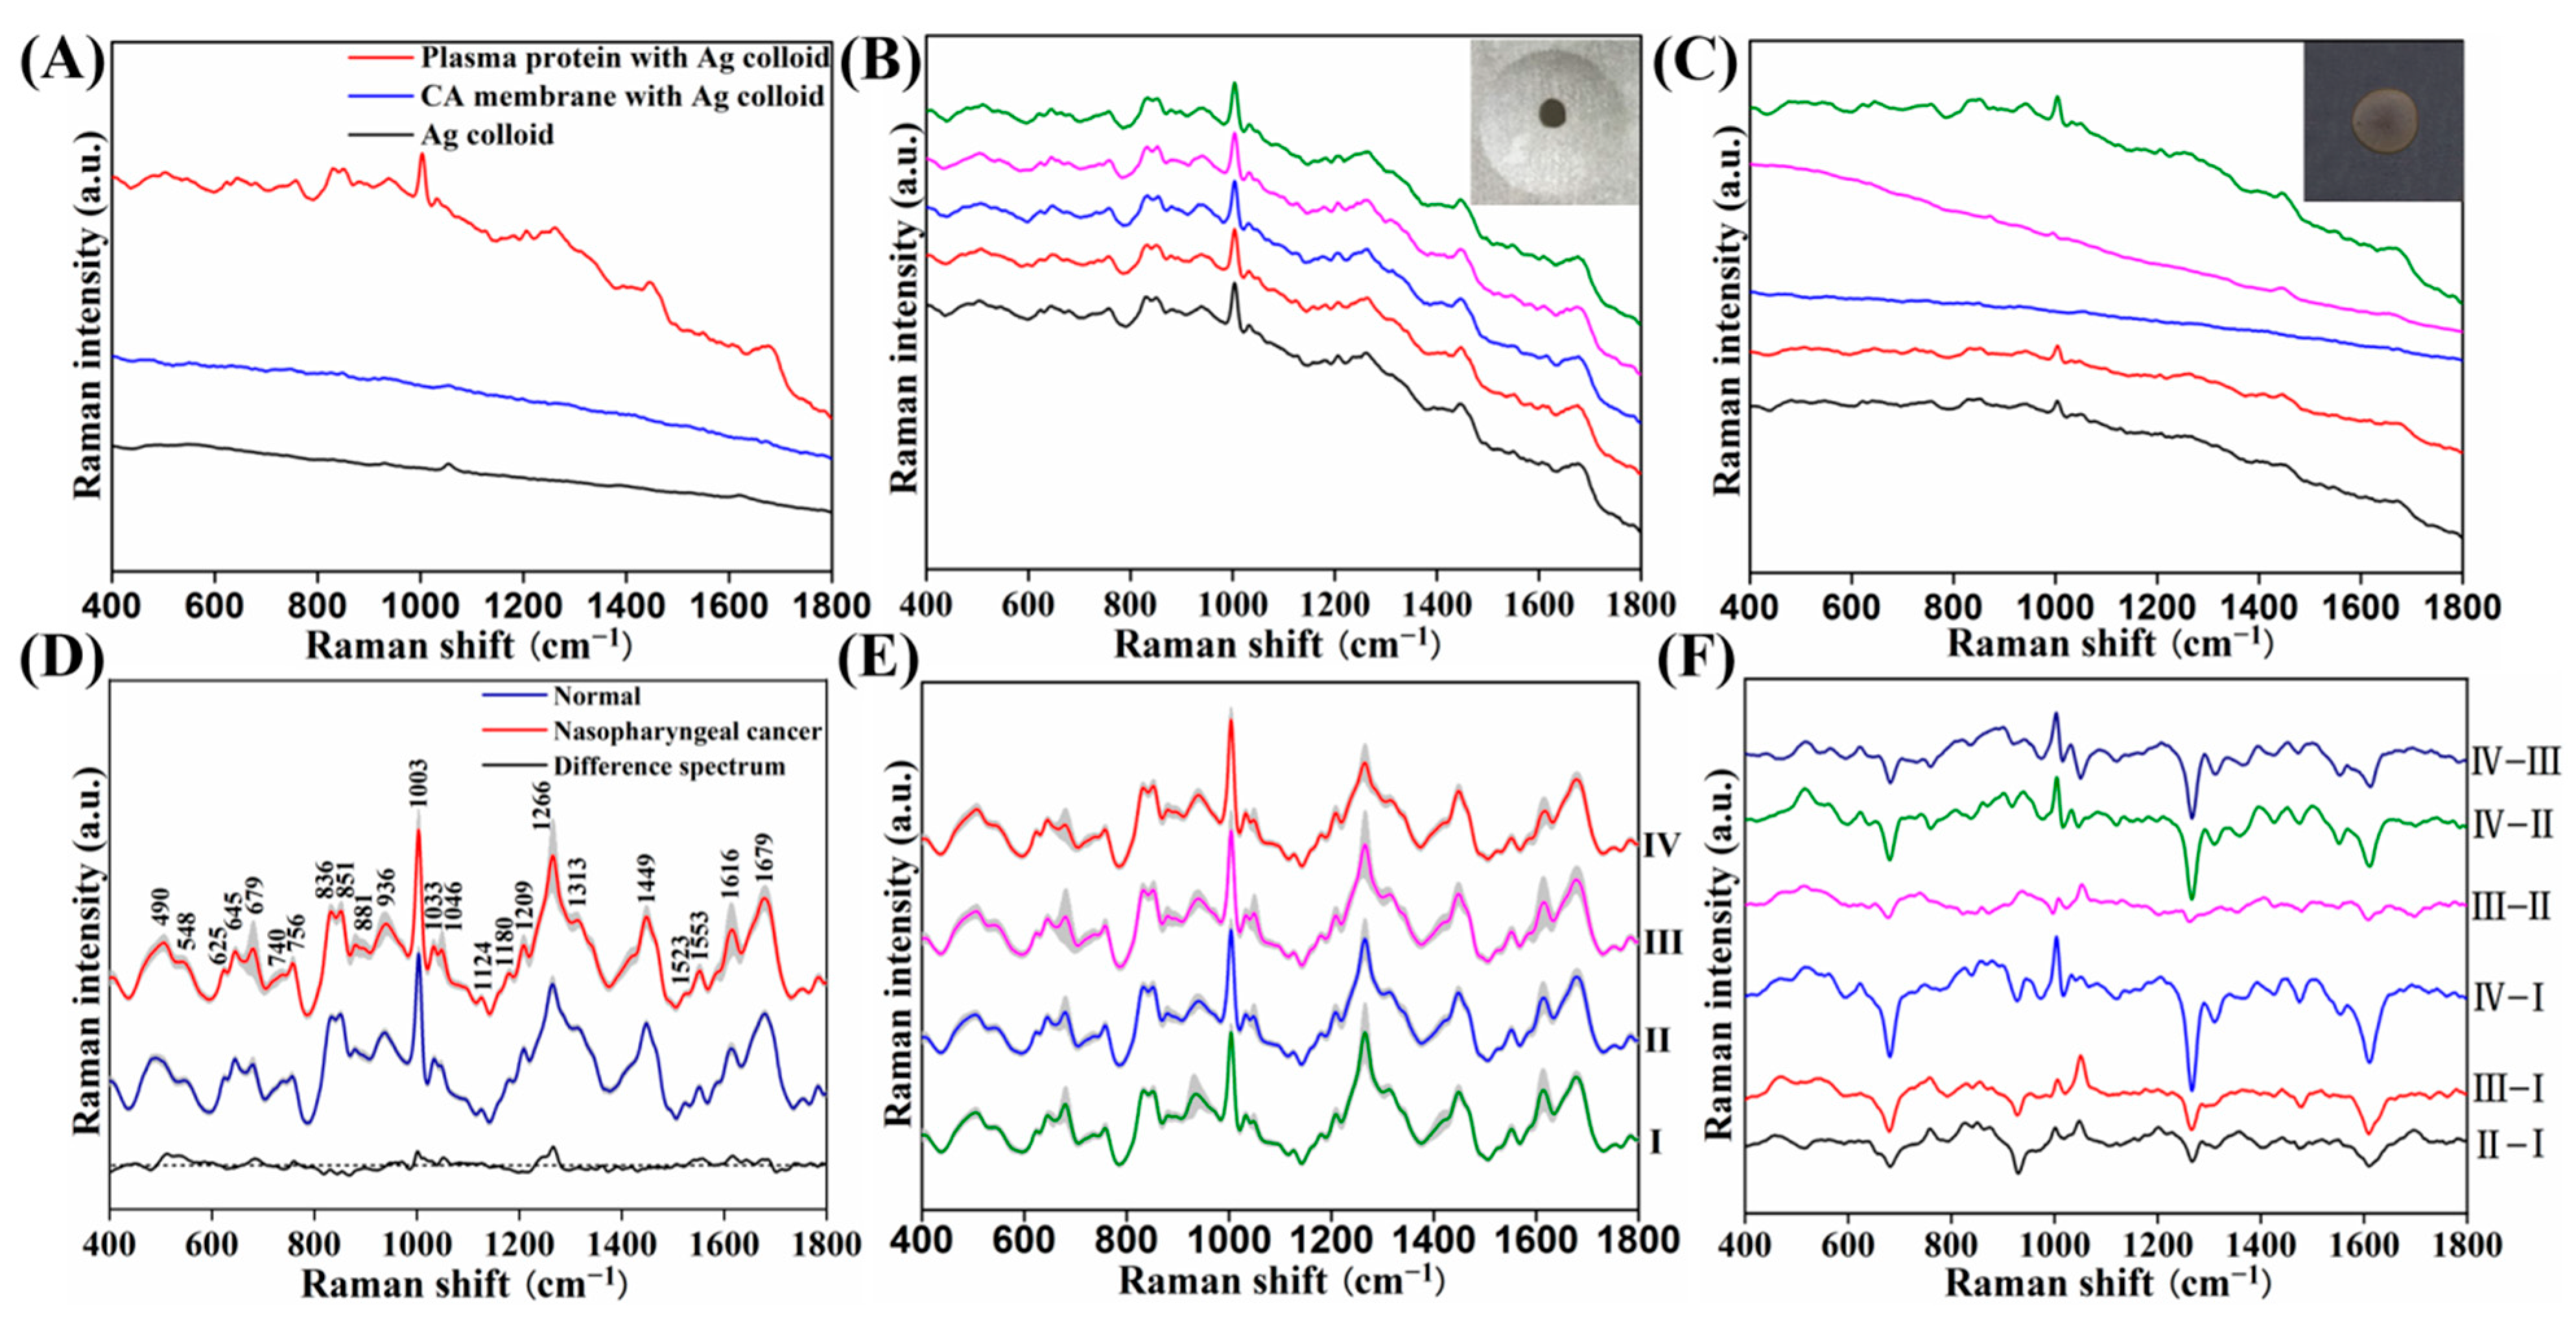
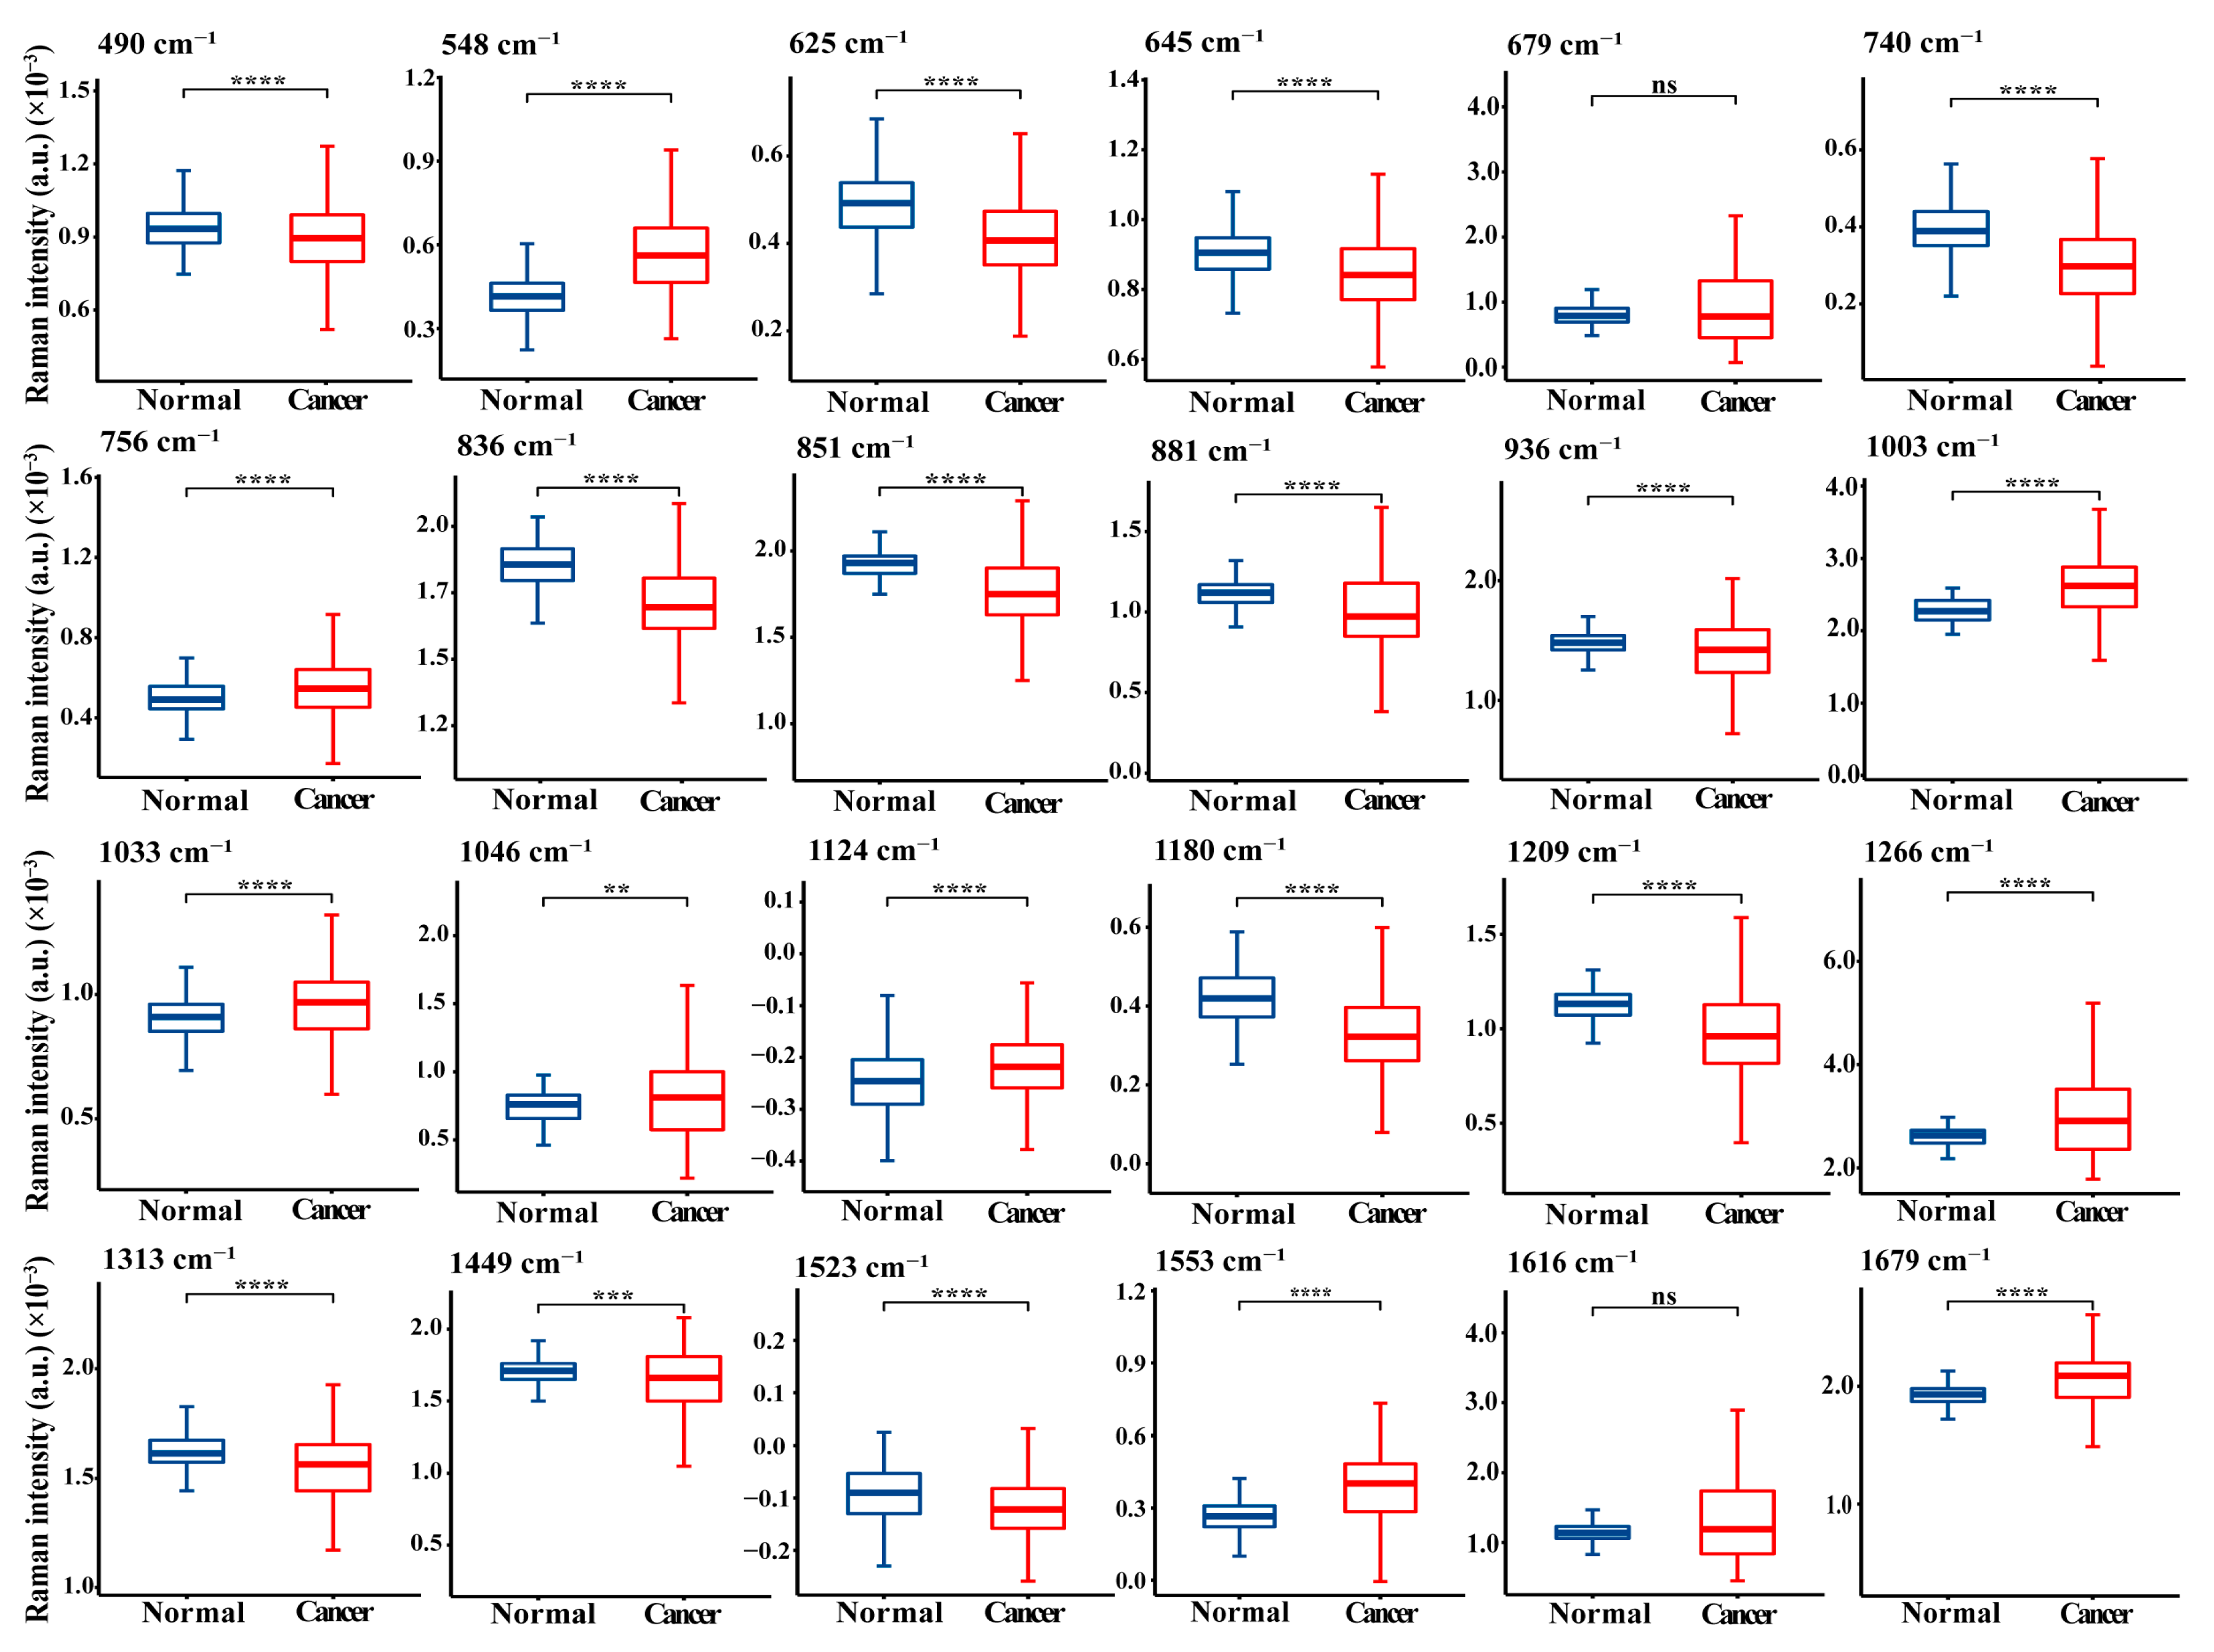
3. Results and Discussion
4. Conclusions
Supplementary Materials
Author Contributions
Funding
Institutional Review Board Statement
Informed Consent Statement
Data Availability Statement
Acknowledgments
Conflicts of Interest
References
- Wong, K.C.; Hui, E.P.; Lo, K.W.; Lam, W.K.J.; Johnson, D.; Li, L.; Tao, Q.; Chan, K.C.A.; To, K.F.; King, A.D.; et al. Nasopharyngeal carcinoma: An evolving paradigm. Nat. Rev. Clin. Oncol. 2021, 18, 679–695. [Google Scholar] [CrossRef] [PubMed]
- Sung, H.; Ferlay, J.; Siegel, R.L.; Laversanne, M.; Soerjomataram, I.; Jemal, A.; Bray, F. Global cancer statistics 2020: Globocan estimates of incidence and mortality worldwide for 36 cancers in 185 countries. CA Cancer J. Clin. 2021, 71, 209–249. [Google Scholar] [CrossRef] [PubMed]
- Guo, Q.; Lu, T.; Huang, S.H.; O’Sullivan, B.; Zong, J.; Xiao, Y.; Xu, W.; Chen, C.; Qiu, S.; Xu, L.; et al. Depicting distant metastatic risk by refined subgroups derived from the 8th edition nasopharyngeal carcinoma tnm. Oral Oncol. 2019, 91, 113–120. [Google Scholar] [CrossRef]
- Chen, Y.-P.; Ismaila, N.; Chua, M.L.K.; Colevas, A.D.; Haddad, R.; Huang, S.H.; Wee, J.T.S.; Whitley, A.C.; Yi, J.-L.; Yom, S.S.; et al. Chemotherapy in combination with radiotherapy for definitive-intent treatment of stage ii-iva nasopharyngeal carcinoma: Csco and asco guideline. J. Clin. Oncol. 2021, 39, 840–859. [Google Scholar] [CrossRef] [PubMed]
- Pan, J.; Ng, W.; Zong, J.; Chan, L.L.K.; O’Sullivan, B.; Lin, S.; Sze, H.C.K.; Chen, Y.; Choi, H.C.W.; Guo, Q.; et al. Proposal for the 8th edition of the ajcc/uicc staging system for nasopharyngeal cancer in the era of intensity-modulated radiotherapy. Cancer 2016, 122, 546–558. [Google Scholar] [CrossRef] [Green Version]
- Lin, D.; Pan, J.; Huang, H.; Chen, G.; Qiu, S.; Shi, H.; Chen, W.; Yu, Y.; Feng, S.; Chen, R. Label-free blood plasma test based on surface-enhanced raman scattering for tumor stages detection in nasopharyngeal cancer. Sci. Rep. 2014, 4, 4751. [Google Scholar] [CrossRef] [Green Version]
- Lu, T.; Guo, Q.; Lin, K.; Chen, H.; Chen, Y.; Xu, Y.; Lin, C.; Su, Y.; Chen, Y.; Chen, M.; et al. Circulating epstein-barr virus micrornas bart7-3p and bart13-3p as novel biomarkers in nasopharyngeal carcinoma. Cancer Sci. 2020, 111, 1711–1723. [Google Scholar] [CrossRef]
- Liang, Y.; Li, J.; Li, Q.; Tang, L.; Chen, L.; Mao, Y.; He, Q.; Yang, X.; Lei, Y.; Hong, X.; et al. Plasma protein-based signature predicts distant metastasis and induction chemotherapy benefit in nasopharyngeal carcinoma. Theranostics 2020, 10, 9767–9778. [Google Scholar] [CrossRef]
- Armandas, B.; Yoshiaki, N.; Sivashankar, K.; Aleksandr, K.; Paul, R.S.; Raimondas, P.; Saulius, J. From fundamental toward applied sers: Shared principles and divergent approaches. Adv. Opt. Mater. 2018, 6, 1800292. [Google Scholar]
- Lin, T.; Song, Y.-L.; Liao, J.; Liu, F.; Zeng, T.-T. Applications of surface-enhanced raman spectroscopy in detection fields. Nanomedicine 2020, 15, 2971–2989. [Google Scholar] [CrossRef]
- Cai, R.; Yin, L.; Huang, Q.; You, R.; Feng, S.; Lu, Y. An endoscope-like sers probe based on the focusing effect of silica nanospheres for tyrosine and urea detection in sweat. Nanomaterials 2022, 12, 421. [Google Scholar] [CrossRef] [PubMed]
- Kamińska, A.; Szymborski, T.; Witkowska, E.; Kijeńska-Gawrońska, E.; Świeszkowski, W.; Niciński, K.; Trzcińska-Danielewicz, J.; Girstun, A. Detection of circulating tumor cells using membrane-based sers platform: A new diagnostic approach for ‘liquid biopsy’. Nanomaterials 2019, 9, 366. [Google Scholar] [CrossRef] [PubMed] [Green Version]
- Tahir, M.A.; Dina, N.E.; Cheng, H.; Valev, V.K.; Zhang, L. Surface-enhanced raman spectroscopy for bioanalysis and diagnosis. Nanoscale 2021, 13, 11593–11634. [Google Scholar] [CrossRef] [PubMed]
- Wang, J.; Koo, K.M.; Wee, E.J.; Wang, Y.; Trau, M. A nanoplasmonic label-free surface-enhanced raman scattering strategy for non-invasive cancer genetic subtyping in patient samples. Nanoscale 2017, 9, 3496–3503. [Google Scholar] [CrossRef]
- Feng, S.; Chen, R.; Lin, J.; Pan, J.; Chen, G.; Li, Y.; Cheng, M.; Huang, Z.; Chen, J.; Zeng, H. Nasopharyngeal cancer detection based on blood plasma surface-enhanced raman spectroscopy and multivariate analysis. Biosens. Bioelectron. 2010, 25, 2414–2419. [Google Scholar] [CrossRef]
- Feng, S.; Chen, R.; Lin, J.; Pan, J.; Wu, Y.; Li, Y.; Chen, J.; Zeng, H. Gastric cancer detection based on blood plasma surface-enhanced raman spectroscopy excited by polarized laser light. Biosens. Bioelectron. 2011, 26, 3167–3174. [Google Scholar] [CrossRef]
- Liang, X.; Miao, X.; Xiao, W.; Ye, Q.; Wang, S.; Lin, J.; Li, C.; Huang, Z. Filter-membrane-based ultrafiltration coupled with surface-enhanced raman spectroscopy for potential differentiation of benign and malignant thyroid tumors from blood plasma. Int. J. Nanomed. 2020, 15, 2303–2314. [Google Scholar] [CrossRef] [Green Version]
- Stefancu, A.; Moisoiu, V.; Couti, R.; Andras, I.; Rahota, R.; Crisan, D.; Pavel, I.E.; Socaciu, C.; Leopold, N.; Crisan, N. Combining sers analysis of serum with psa levels for improving the detection of prostate cancer. Nanomedicine 2018, 13, 2455–2467. [Google Scholar] [CrossRef] [Green Version]
- Zhang, K.; Liu, X.; Man, B.; Cheng, Y.; Zhang, C.; Liu, M.; Zhang, Y.; Liu, L.; Chen, C. Label-free and stable serum analysis based on ag-nps/psi surface-enhanced raman scattering for noninvasive lung cancer detection. Biomed. Opt. Express. 2018, 9, 4345–4358. [Google Scholar] [CrossRef]
- Știufiuc, G.F.; Toma, V.; Buse, M.; Mărginean, R.; Morar-Bolba, G.; Culic, B.; Tetean, R.; Leopold, N.; Pavel, I.; Lucaciu, C.M. Solid plasmonic substrates for breast cancer detection by means of sers analysis of blood plasma. Nanomaterials 2020, 10, 1212. [Google Scholar] [CrossRef]
- Mao, M.; Wang, X.; Sheng, H.; Li, H.; Liu, W.; Han, R.; Wen, W.; Liu, W. Heat shock protein 90α provides an effective and novel diagnosis strategy for nasopharyngeal carcinoma. Adv. Ther. 2021, 38, 413–422. [Google Scholar] [CrossRef] [PubMed]
- Zhang, D.; Peng, L.; Shang, X.; Zheng, W.; You, H.; Xu, T.; Ma, B.; Ren, B.; Fang, J. Buoyant particulate strategy for few-to-single particle-based plasmonic enhanced nanosensors. Nat. Commun. 2020, 11, 2603. [Google Scholar] [CrossRef] [PubMed]
- Doescher, J.; Veit, J.A.; Hoffmann, T.K. The 8th edition of the ajcc cancer staging manual. HNO 2017, 65, 956–961. [Google Scholar] [CrossRef] [PubMed]
- Lin, X.; Lin, D.; Chen, Y.; Lin, J.; Weng, S.; Song, J.; Feng, S. High throughput blood analysis based on deep learning algorithm and self-positioning super-hydrophobic sers platform for non-invasive multi-disease screening. Adv. Funct. Mater. 2021, 31, 2103382. [Google Scholar] [CrossRef]
- Luo, X.; Pan, R.; Cai, M.; Liu, W.; Chen, C.; Jiang, G.; Hu, X.; Zhang, H.; Zhong, M. Atto-molar raman detection on patterned superhydrophilic-superhydrophobic platform via localizable evaporation enrichment. Sens. Actuators B Chem. 2020, 326, 128826. [Google Scholar] [CrossRef]
- Leopold, N.; Lendl, B. A new method for fast preparation of highly surface-enhanced raman scattering (sers) active silver colloids at room temperature by reduction of silver nitrate with hydroxylamine hydrochloride. J. Phys. Chem. B 2003, 107, 5723–5727. [Google Scholar] [CrossRef]
- Zhao, J.; Lui, H.; McLean, D.I.; Zeng, H. Automated autofluorescence background subtraction algorithm for biomedical raman spectroscopy. Appl. Spectrosc. 2007, 61, 1225–1232. [Google Scholar] [CrossRef]
- Gelder, J.D.; Gussem, K.D.; Vandenabeele, P.; Moens, L. Reference database of raman spectra of biological molecules. J. Raman Spectrosc. 2007, 38, 1133–1147. [Google Scholar] [CrossRef]
- Movasaghi, Z.; Rehman, S.; Rehman, I.U. Raman spectroscopy of biological tissues. Appl. Spectrosc. Rev. 2007, 42, 493–541. [Google Scholar] [CrossRef]
- Lin, D.; Feng, S.; Pan, J.; Chen, Y.; Lin, J.; Chen, G.; Xie, S.; Zeng, H.; Chen, R. Colorectal cancer detection by gold nanoparticle based surface-enhanced raman spectroscopy of blood serum and statistical analysis. Opt. Express 2011, 19, 13565–13577. [Google Scholar] [CrossRef]
- Feng, S.; Lin, D.; Lin, J.; Huang, Z.; Chen, G.; Li, Y.; Huang, S.; Zhao, J.; Chen, R.; Zeng, H. Saliva analysis combining membrane protein purification with surface-enhanced raman spectroscopy for nasopharyngeal cancer detection. Appl. Phys. Lett. 2014, 104, 073702. [Google Scholar] [CrossRef]
- Huang, Z.; Mcwilliams, A.; Lui, H.; Mclean, D.I.; Lam, S.; Zeng, H. Near-infrared raman spectroscopy for optical diagnosis of lung cancer. Int. J. Cancer 2003, 107, 1047–1052. [Google Scholar] [CrossRef] [PubMed]
- Lei, J.; Yang, D.; Li, R.; Dai, Z.; Zhang, C.; Yu, Z.; Wu, S.; Pang, L.; Liang, S.; Zhang, Y. Label-free surface-enhanced raman spectroscopy for diagnosis and analysis of serum samples with different types lung cancer. Spectrochim. Acta Part A Mol. Biomol. Spectrosc. 2021, 261, 120021. [Google Scholar] [CrossRef] [PubMed]
- Jobard, E.; Pontoizeau, C.; Blaise, B.J.; Bachelot, T.; Elena-Herrmann, B.; Olivier, T. A serum nuclear magnetic resonance-based metabolomic signature of advanced metastatic human breast cancer. Cancer Lett. 2014, 343, 33–41. [Google Scholar] [CrossRef]
- Asantewaa, G.; Harris, I.S. Glutathione and its precursors in cancer. Curr. Opin. Biotechnol. 2021, 68, 292–299. [Google Scholar] [CrossRef]
- Kumar, A.; Sharma, S.; Pundir, C.S.; Sharma, A. Decreased plasma glutathione in cancer of the uterine cervix. Cancer Lett. 1995, 94, 107–111. [Google Scholar] [CrossRef]
- Salman, R.A.; AlBairuty, G.A.A.; Abdul-Rasheed, O.F. Decreased catalase activity and glutathione concentration levels in women patients with breast cancer. Ann. Trop. Med. Public Health 2020, 23, SP231371. [Google Scholar] [CrossRef]
- Yoshizaki, T.; Ito, M.; Murono, S.; Wakisaka, N.; Kondo, S.; Endo, K. Current understanding and management of nasopharyngeal carcinoma. Auris Nasus Larynx 2012, 39, 137–144. [Google Scholar] [CrossRef] [Green Version]
- Wang, J.; Feng, S.; Lin, J.; Zeng, Y.; Li, L.; Huang, Z.; Li, B.; Zeng, H.; Chen, R. Serum albumin and globulin analysis for hepatocellular carcinoma detection avoiding false-negative results from alpha-fetoprotein test negative subjects. Appl. Phys. Lett. 2013, 103, 204106. [Google Scholar] [CrossRef]
- Wang, J.; Lin, D.; Lin, J.; Yu, Y.; Huang, Z.; Chen, Y.; Lin, J.; Feng, S.; Li, B.; Liu, N.; et al. Label-free detection of serum proteins using surface-enhanced raman spectroscopy for colorectal cancer screening. J. Biomed. Opt. 2014, 19, 087003. [Google Scholar] [CrossRef]
- Cheng, N.; Chen, D.; Lou, B.; Fu, J.; Wang, H. A biosensing method for the direct serological detection of liver diseases by integrating a sers-based sensor and a cnn classifier. Biosens. Bioelectron. 2021, 186, 113246. [Google Scholar] [CrossRef]
- Esteva, A.; Kuprel, B.; Novoa, R.A.; Ko, J.; Swetter, S.M.; Blau, H.M.; Thrun, S. Dermatologist-level classification of skin cancer with deep neural networks. Nature 2017, 542, 115–118. [Google Scholar] [CrossRef]
- Shao, X.; Zhang, H.; Wang, Y.; Qian, H.; Zhu, Y.; Dong, B.; Xu, F.; Chen, N.; Liu, S.; Pan, J.; et al. Deep convolutional neural networks combine raman spectral signature of serum for prostate cancer bone metastases screening. Nanomedicine 2020, 29, 102245. [Google Scholar] [CrossRef]
- Ma, D.; Shang, L.; Tang, J.; Bao, Y.; Fu, J.; Yin, J. Classifying breast cancer tissue by raman spectroscopy with one-dimensional convolutional neural network. Spectrochim. Acta Part A Mol. Biomol. Spectrosc. 2021, 256, 119732. [Google Scholar] [CrossRef]
- Bulik-Sullivan, B.; Busby, J.; Palmer, C.D.; Davis, M.J.; Murphy, T.; Clark, A.; Busby, M.; Duke, F.; Yang, A.; Young, L.; et al. Deep learning using tumor hla peptide mass spectrometry datasets improves neoantigen identification. Nat. Biotechnol. 2019, 37, 55–63. [Google Scholar] [CrossRef]


| NPC Subjects (n = 939) | Healthy Subjects (n = 225) | |
|---|---|---|
| Age | ||
| Mean | 45 ± 8 | 41 ± 11 |
| Gender | ||
| Male | 490 | 123 |
| Female | 449 | 102 |
| TNM stage | ||
| I | 120 | N/A |
| II | 249 | N/A |
| III | 291 | N/A |
| IV | 279 | N/A |
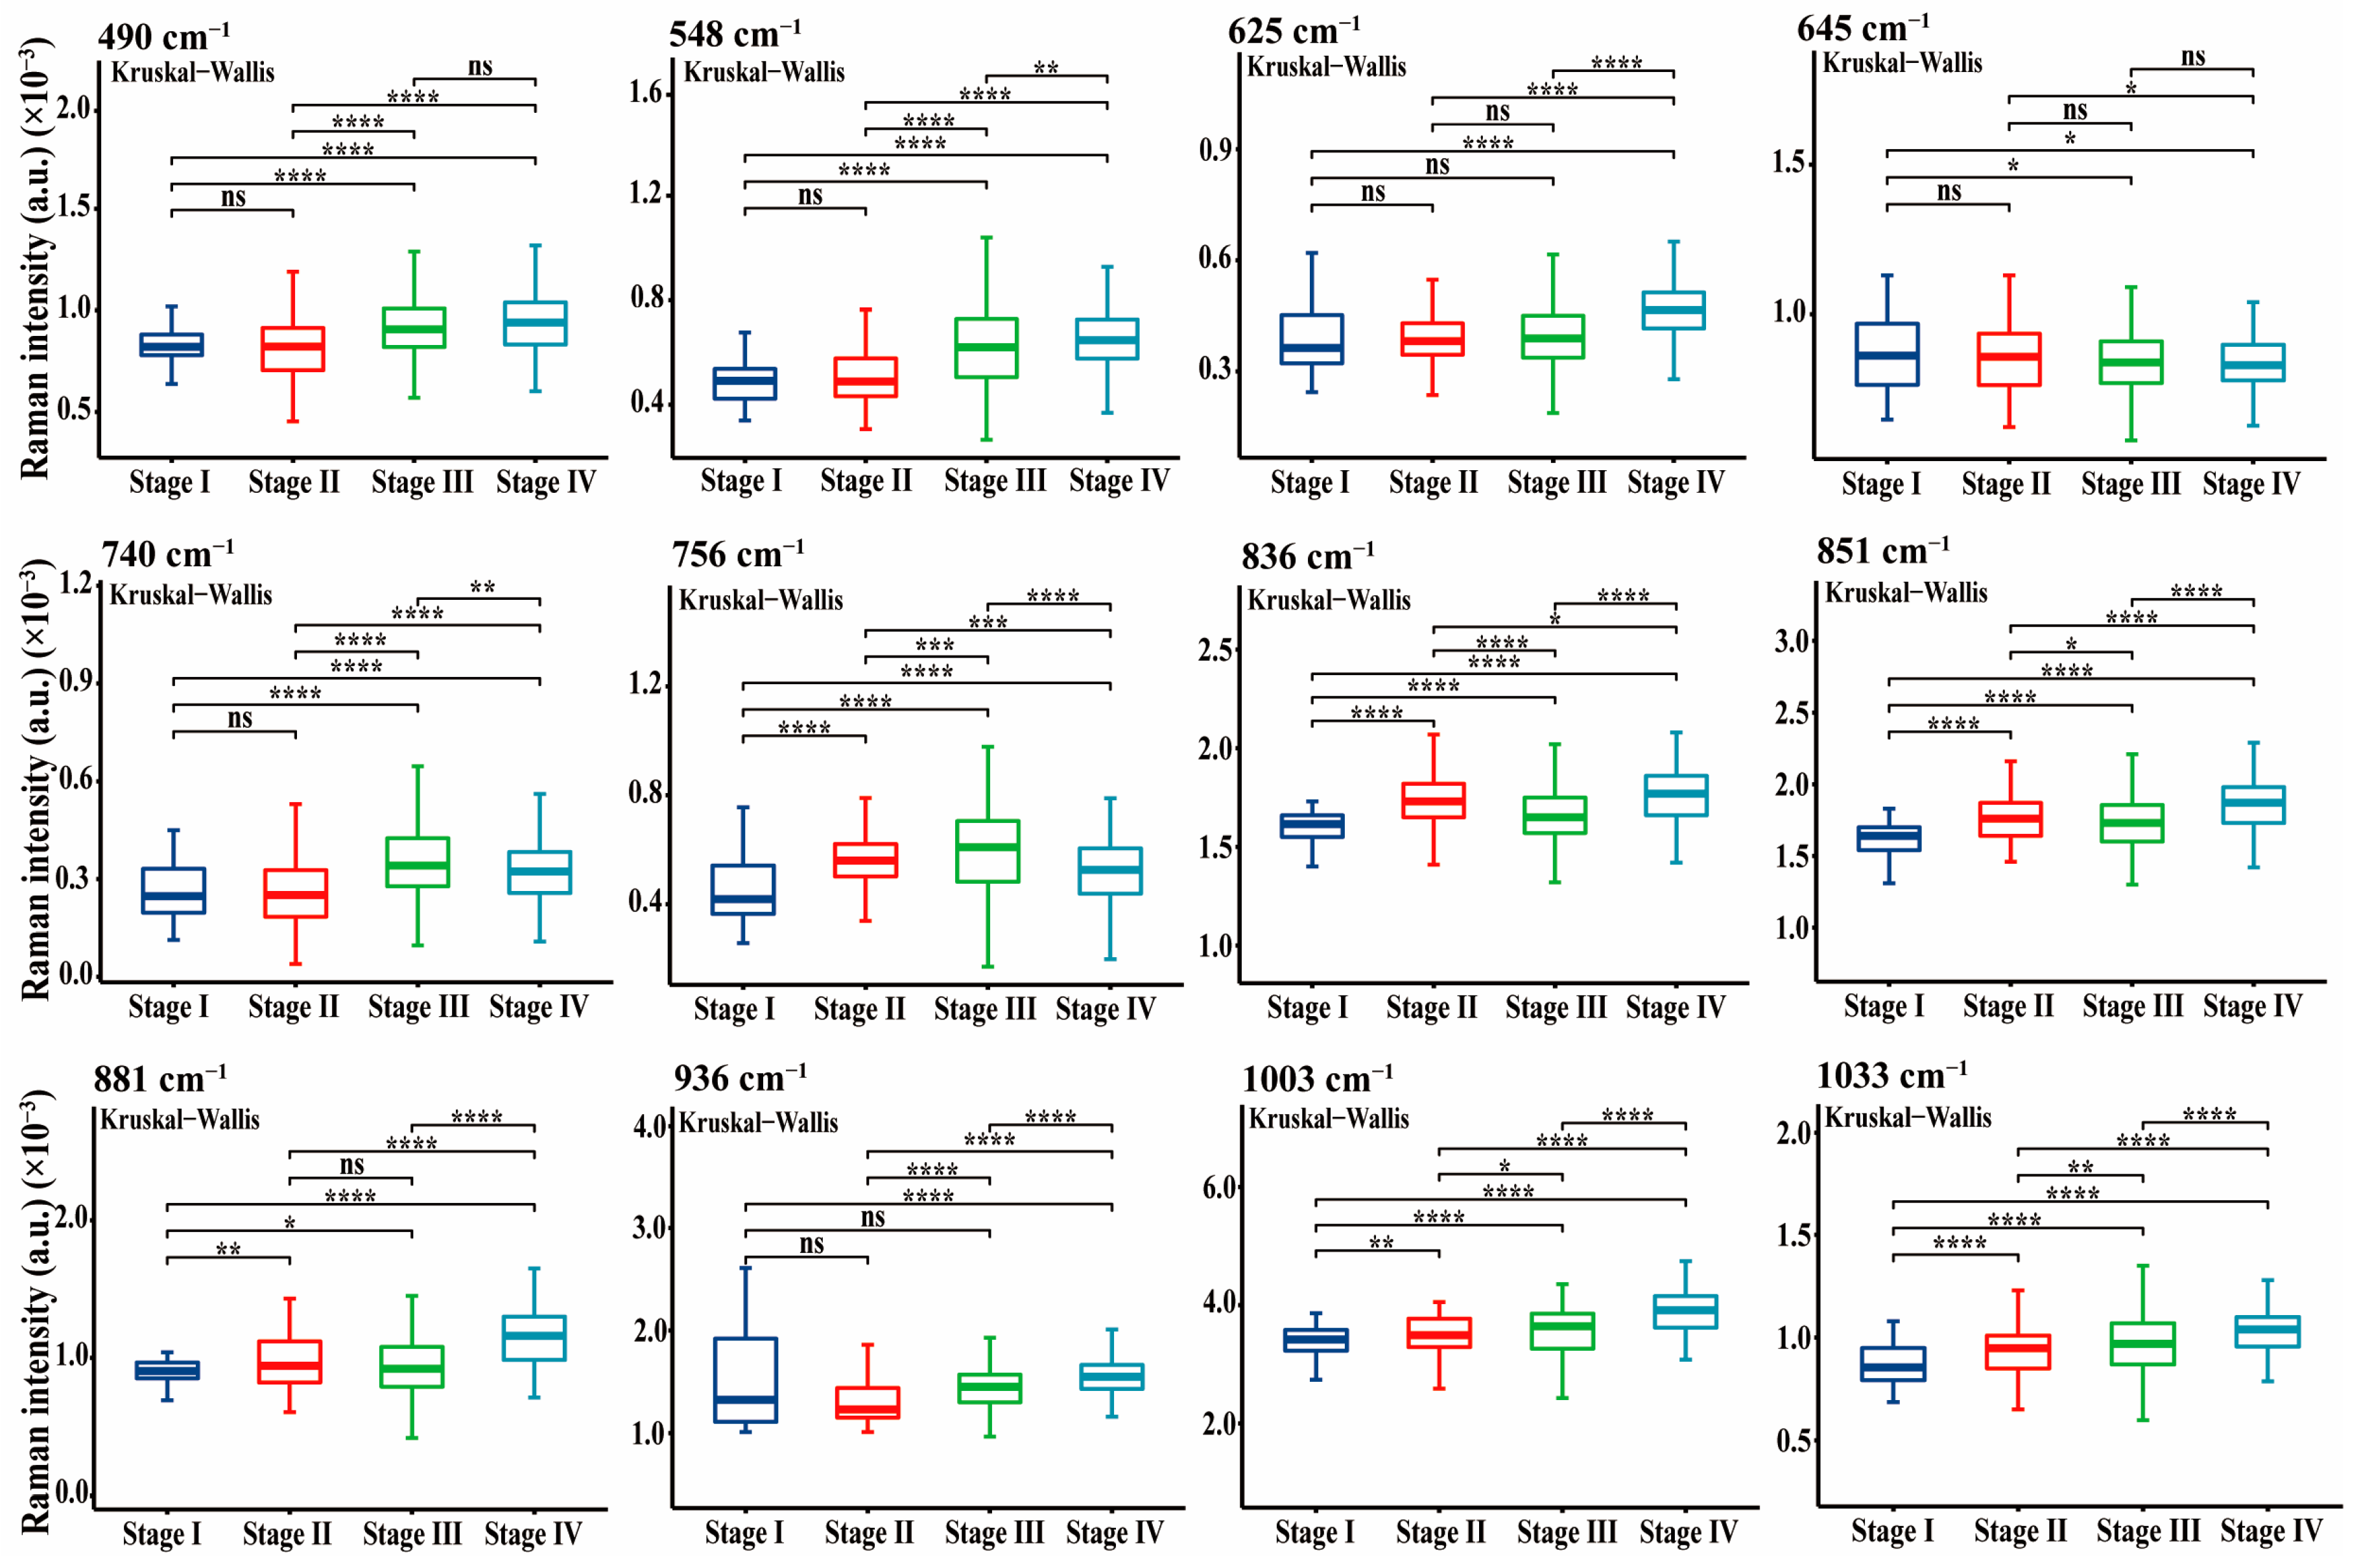
| Raman Shift (cm−1) | Tentative Assignment | Raman Shift (cm−1) | Tentative Assignment |
|---|---|---|---|
| 490 | Arginine | 1033 | Phenylalanine |
| 548 | Tryptophan | 1046 | Tryptophan |
| 625 | Glutathione | 1124 | Valine |
| 645 | Glutathione | 1180 | Tyrosine |
| 679 | Histidine | 1209 | Tyrosine |
| 740 | Glutamate | 1266 | Amide III, Tryptophan |
| 756 | Tryptophan | 1313 | Glutamate |
| 836 | Proline | 1449 | Alanine |
| 851 | Alanine, Proline, Arginine | 1523 | Glutamate |
| 881 | Arginine | 1553 | Tryptophan |
| 936 | Glycine | 1616 | Serine |
| 1003 | Phenylalanine | 1679 | Amide I |
Publisher’s Note: MDPI stays neutral with regard to jurisdictional claims in published maps and institutional affiliations. |
© 2022 by the authors. Licensee MDPI, Basel, Switzerland. This article is an open access article distributed under the terms and conditions of the Creative Commons Attribution (CC BY) license (https://creativecommons.org/licenses/by/4.0/).
Share and Cite
Lin, J.; Weng, Y.; Lin, X.; Qiu, S.; Huang, Z.; Pan, C.; Li, Y.; Kong, K.V.; Zhang, X.; Feng, S. Highly Efficient Blood Protein Analysis Using Membrane Purification Technique and Super-Hydrophobic SERS Platform for Precise Screening and Staging of Nasopharyngeal Carcinoma. Nanomaterials 2022, 12, 2724. https://doi.org/10.3390/nano12152724
Lin J, Weng Y, Lin X, Qiu S, Huang Z, Pan C, Li Y, Kong KV, Zhang X, Feng S. Highly Efficient Blood Protein Analysis Using Membrane Purification Technique and Super-Hydrophobic SERS Platform for Precise Screening and Staging of Nasopharyngeal Carcinoma. Nanomaterials. 2022; 12(15):2724. https://doi.org/10.3390/nano12152724
Chicago/Turabian StyleLin, Jinyong, Youliang Weng, Xueliang Lin, Sufang Qiu, Zufang Huang, Changbin Pan, Ying Li, Kien Voon Kong, Xianzeng Zhang, and Shangyuan Feng. 2022. "Highly Efficient Blood Protein Analysis Using Membrane Purification Technique and Super-Hydrophobic SERS Platform for Precise Screening and Staging of Nasopharyngeal Carcinoma" Nanomaterials 12, no. 15: 2724. https://doi.org/10.3390/nano12152724