
Cellular Mechanosensitivity: Validation of an Adaptable 3D-Printed Device for Microindentation

 , ,
, ,  ,
,  ,
,  ,
,  and
and 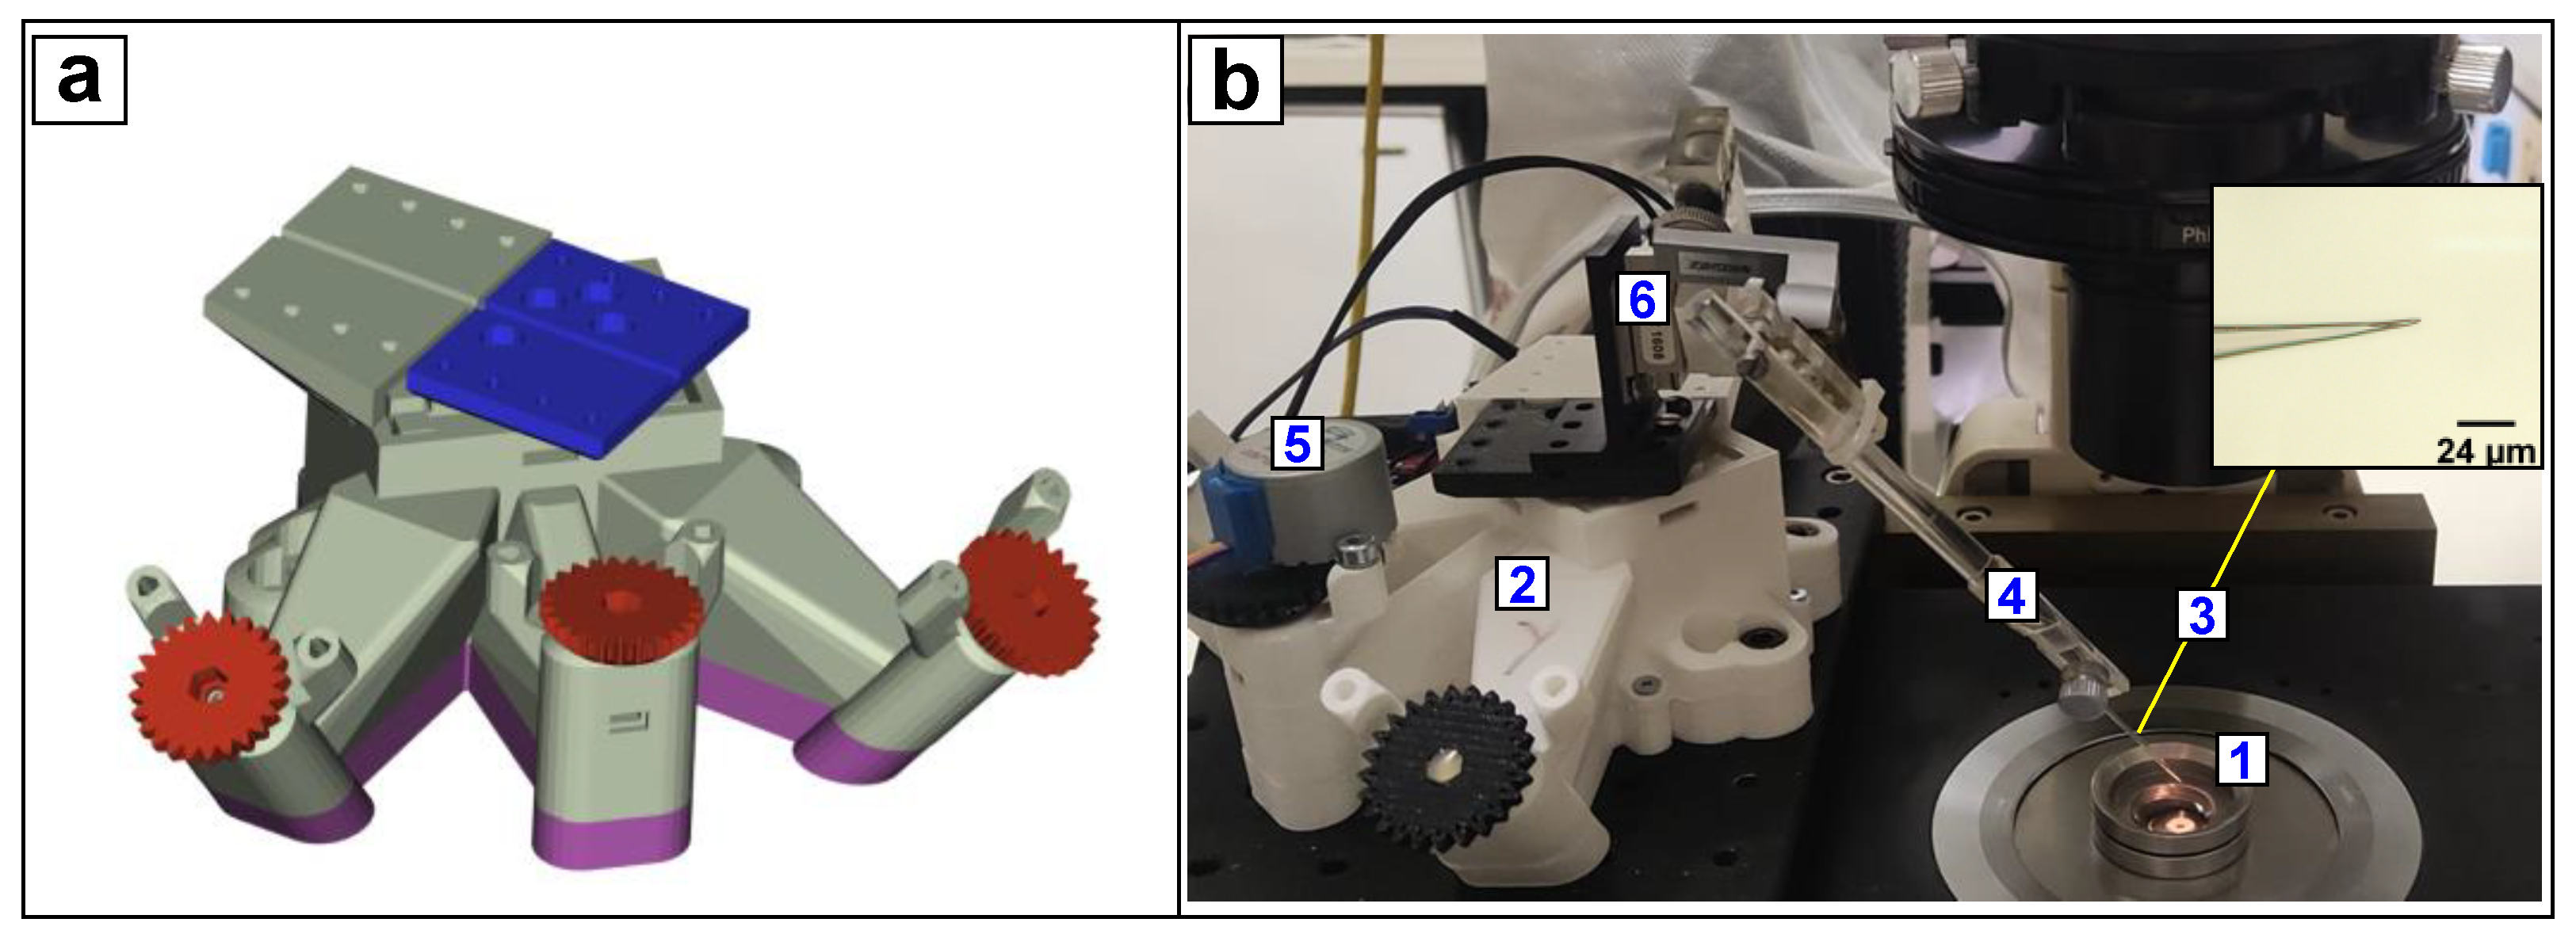
Abstract
:1. Introduction
2. Materials and Methods
2.1. Cell Culture
2.2. Calcium Imaging—Fluorescence Microscopy
2.3. Digital Holography
2.4. Glass Probe
2.5. Linear Translation Stage
2.6. Interferometry
2.7. Microindentation Assay
- -
- Positioning the focus plane of the microscope on the upper surface of the coverslip, i.e., the adhesion plane of the cells, we indicated the position of the Z motor in which the glass-tip is in focus as Z = 0 μm.
- -
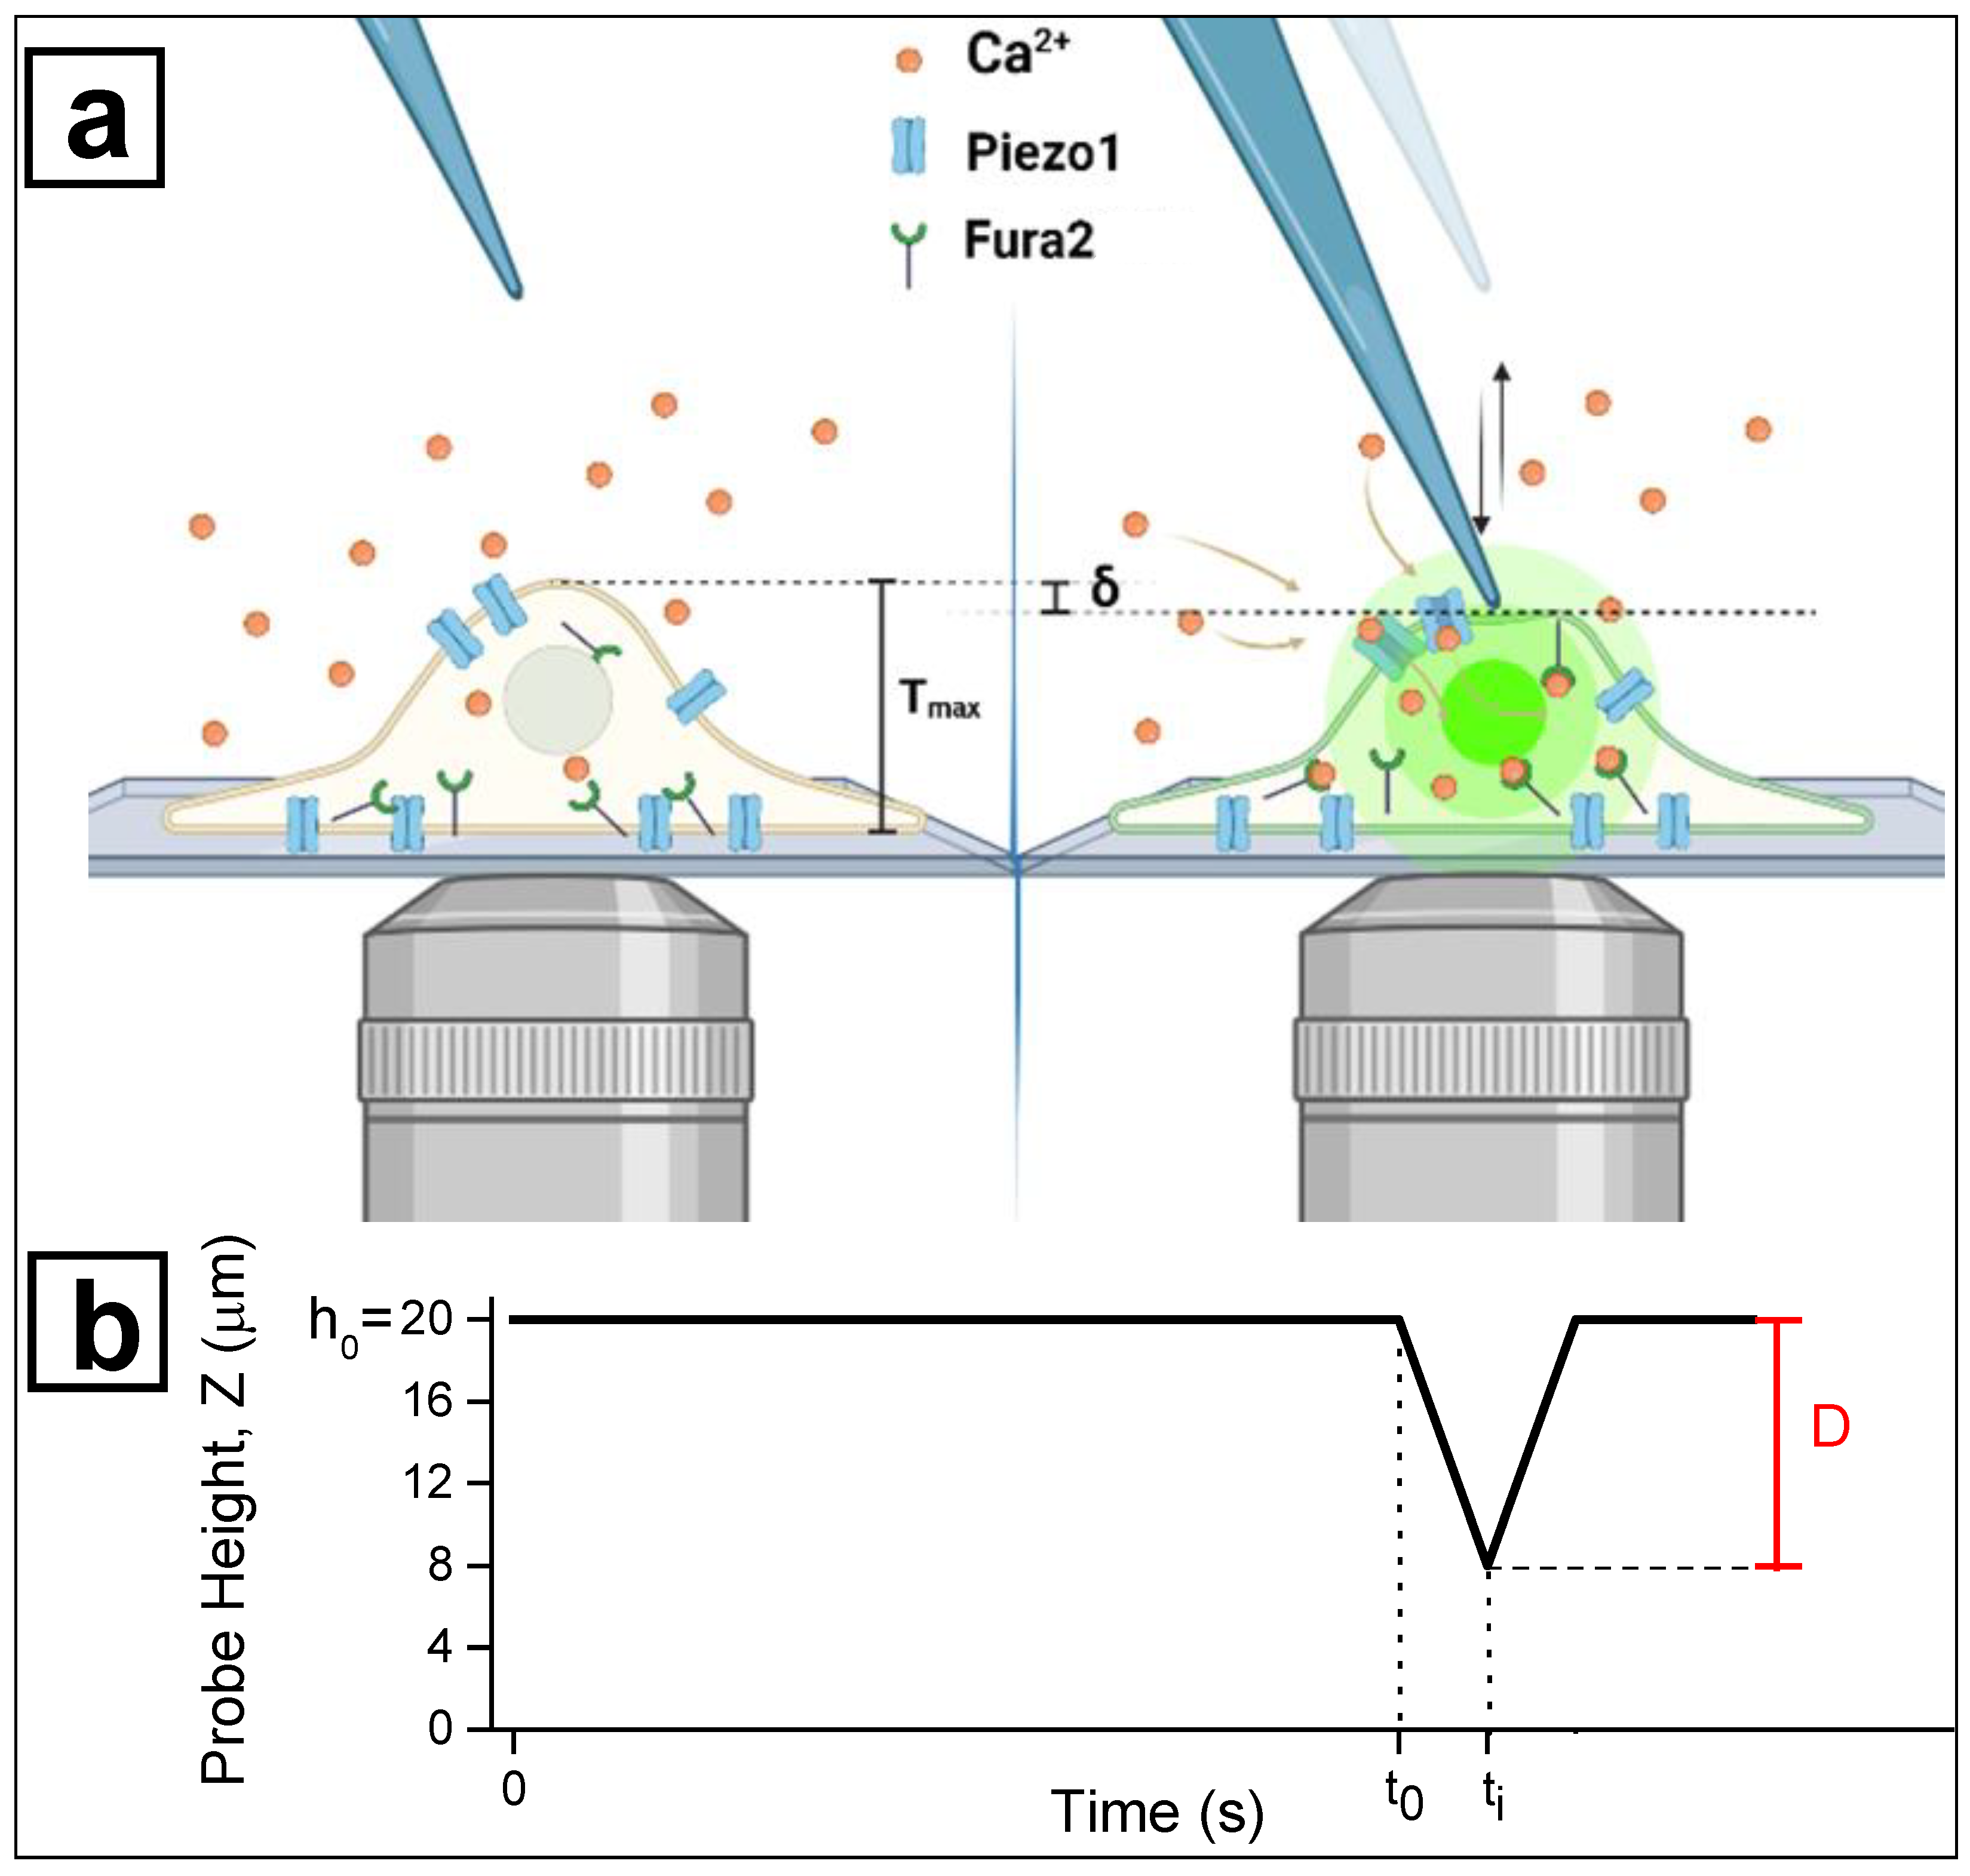
- The glass-tip was moved away from this position by a distance of 20 μm. This point was taken as the starting position for all successive indentations (h0 = 20 μm).
- -
- The investigated cells were positioned to have their central part (the nucleus) under the tip of the microindenter. This configuration is represented in the left panel of Figure 2.
- -
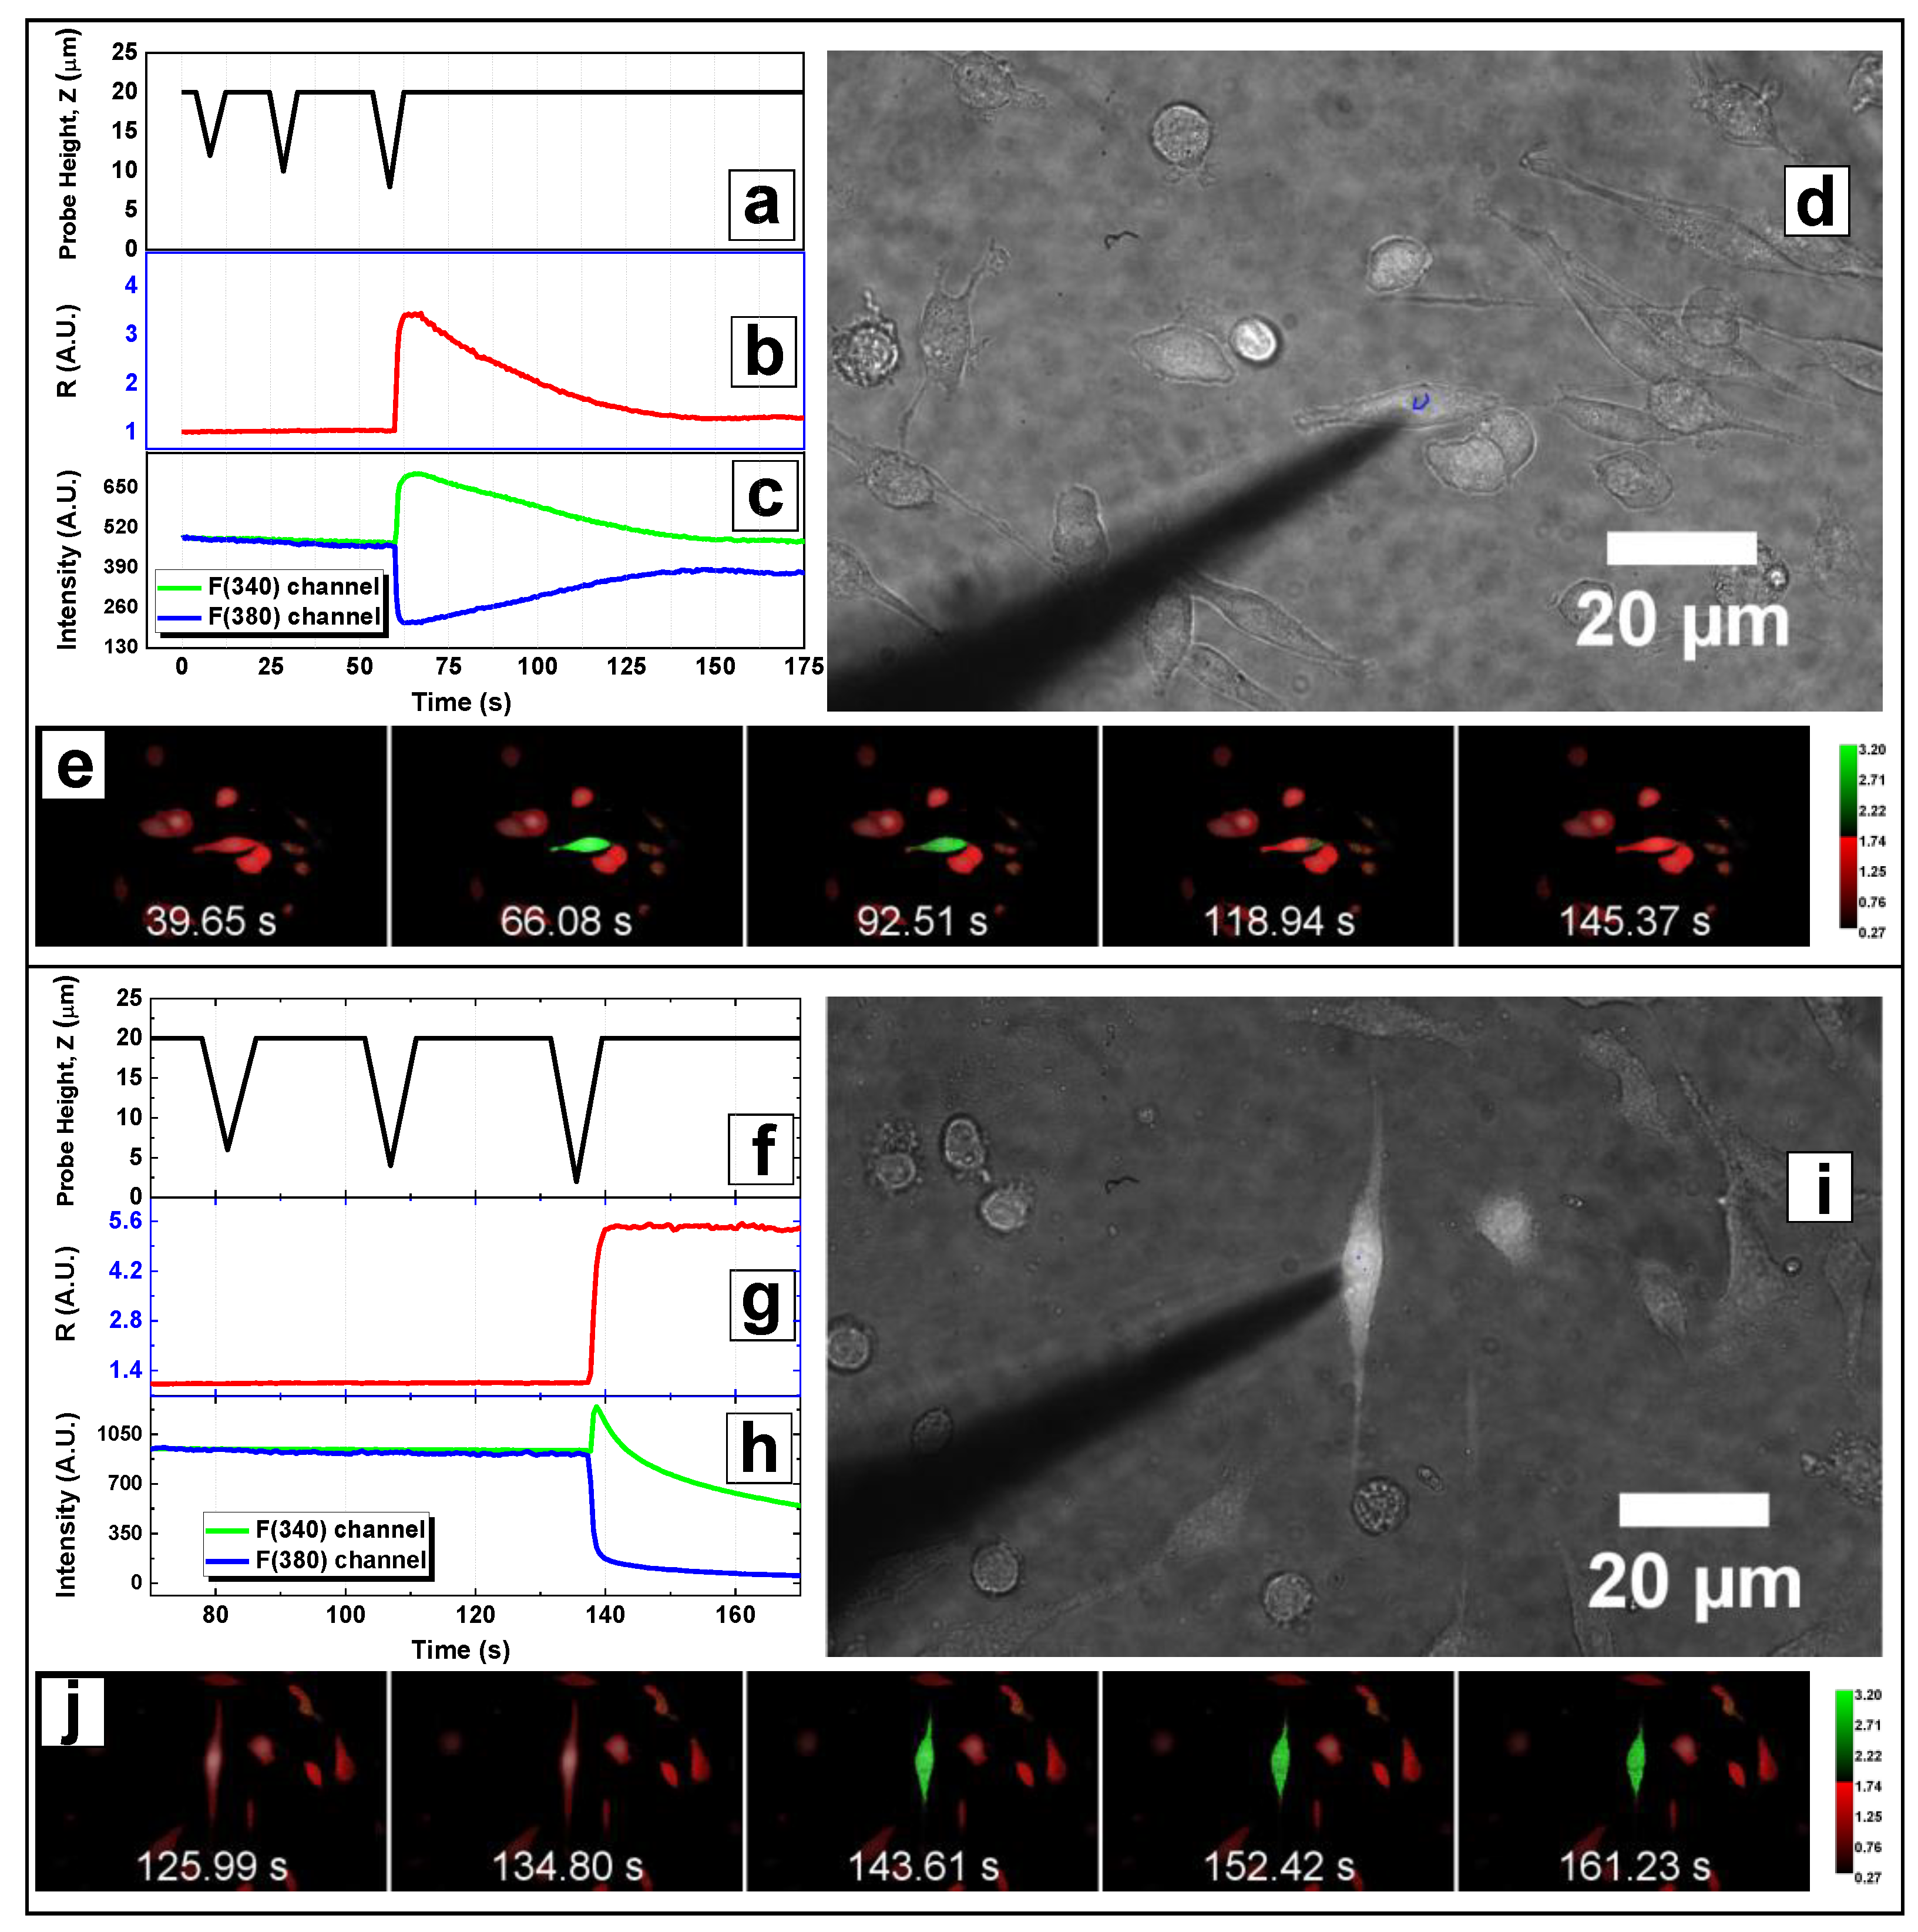
- To measure the indentation depth corresponding to cell activation, a train of 6 consecutive and progressive indentations was acquired for each cell. During the indentation train, the tip was moved towards the cell by a controlled distance D and further retracted to the rest position (h0 = 20 μm). The first travelled distance was set at D = 8 μm (corresponding to 12 μm above the coverslip surface) and in every successive movement the travelled distance was increased by 2 μm, up to a maximum value of 18 μm (2 μm above the coverslip surface). Thus, the vertical position Z of the probe tip was defined as Z = h0 – D. The actuator calibration and the backlash correction were used to estimate the actual position during the whole indentation protocol (see Section 3.2). The indentation depth δ corresponding to each distance D was estimated by taking into account the average thickness of each cell <Tmax> as measured via digital holography (see Section 3.3) and the rest position h0:
- -
- The activation of mechanosensitive channels resulted in a transient peak of R as the indicator of intracellular increase in calcium concentration, requiring approximately 40 s to recover the baseline level. Therefore, during the indentation protocol, the R signal was monitored by fluorescence microscopy and a time of 40 s was allowed to pass between two successive indentations in order to appreciate any late activation events.
- -
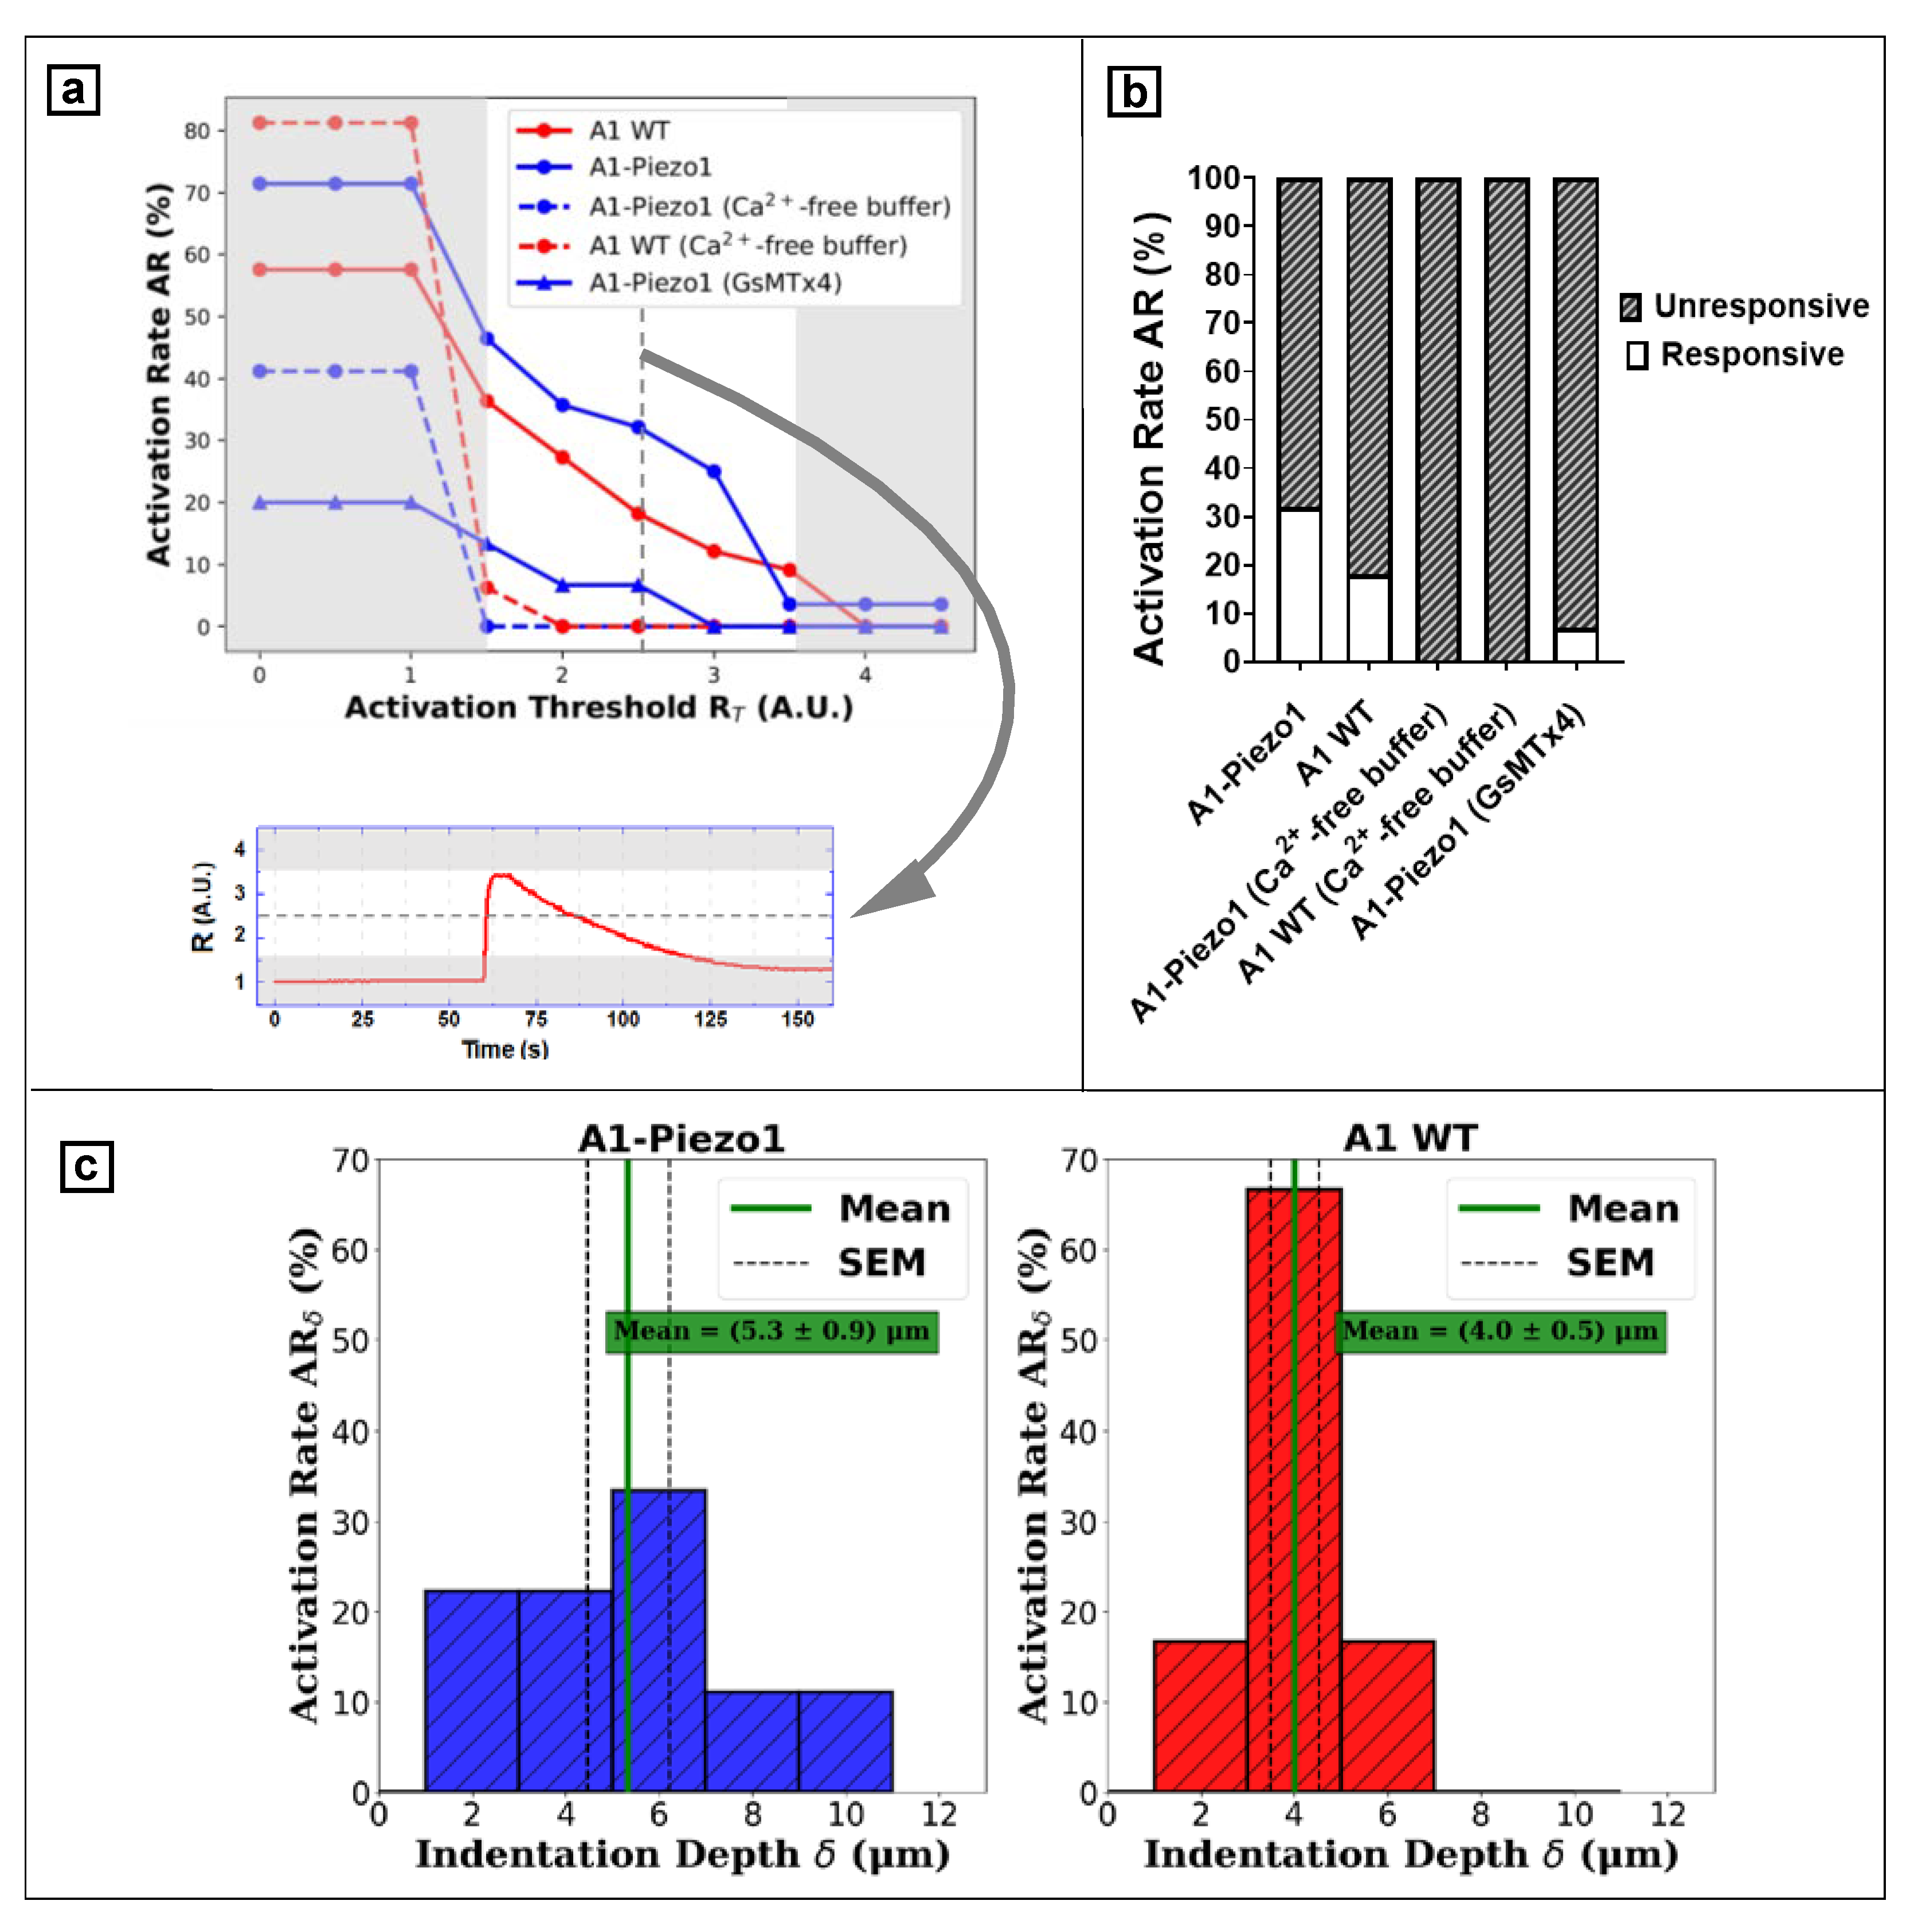
- The value δ at which the signal R overcame a given threshold from the baseline was defined as the indentation at which the cell responded (see Section 3.4 for threshold evaluation): a transient peak in the R signal was related to the influx of Ca2+ ions into the cytoplasm, corresponding to the activation of the mechanosensitive channels. On the other hand, a plateau in R signal indicated the rapid decrease of F340 and F380, i.e., the rupture of the membrane. Every cell was indented through 8 to 18 μm of probe displacement D: if the R peak was observed ahead of cell disruption, the cell was classified as responsive at the corresponding δ. Otherwise, cells were classified as unresponsive.
- -
- We defined the activation rate AR as the ratio between the number of responsive cells to the mechanical stimulus and the total tested ones:
3. Results and Discussion
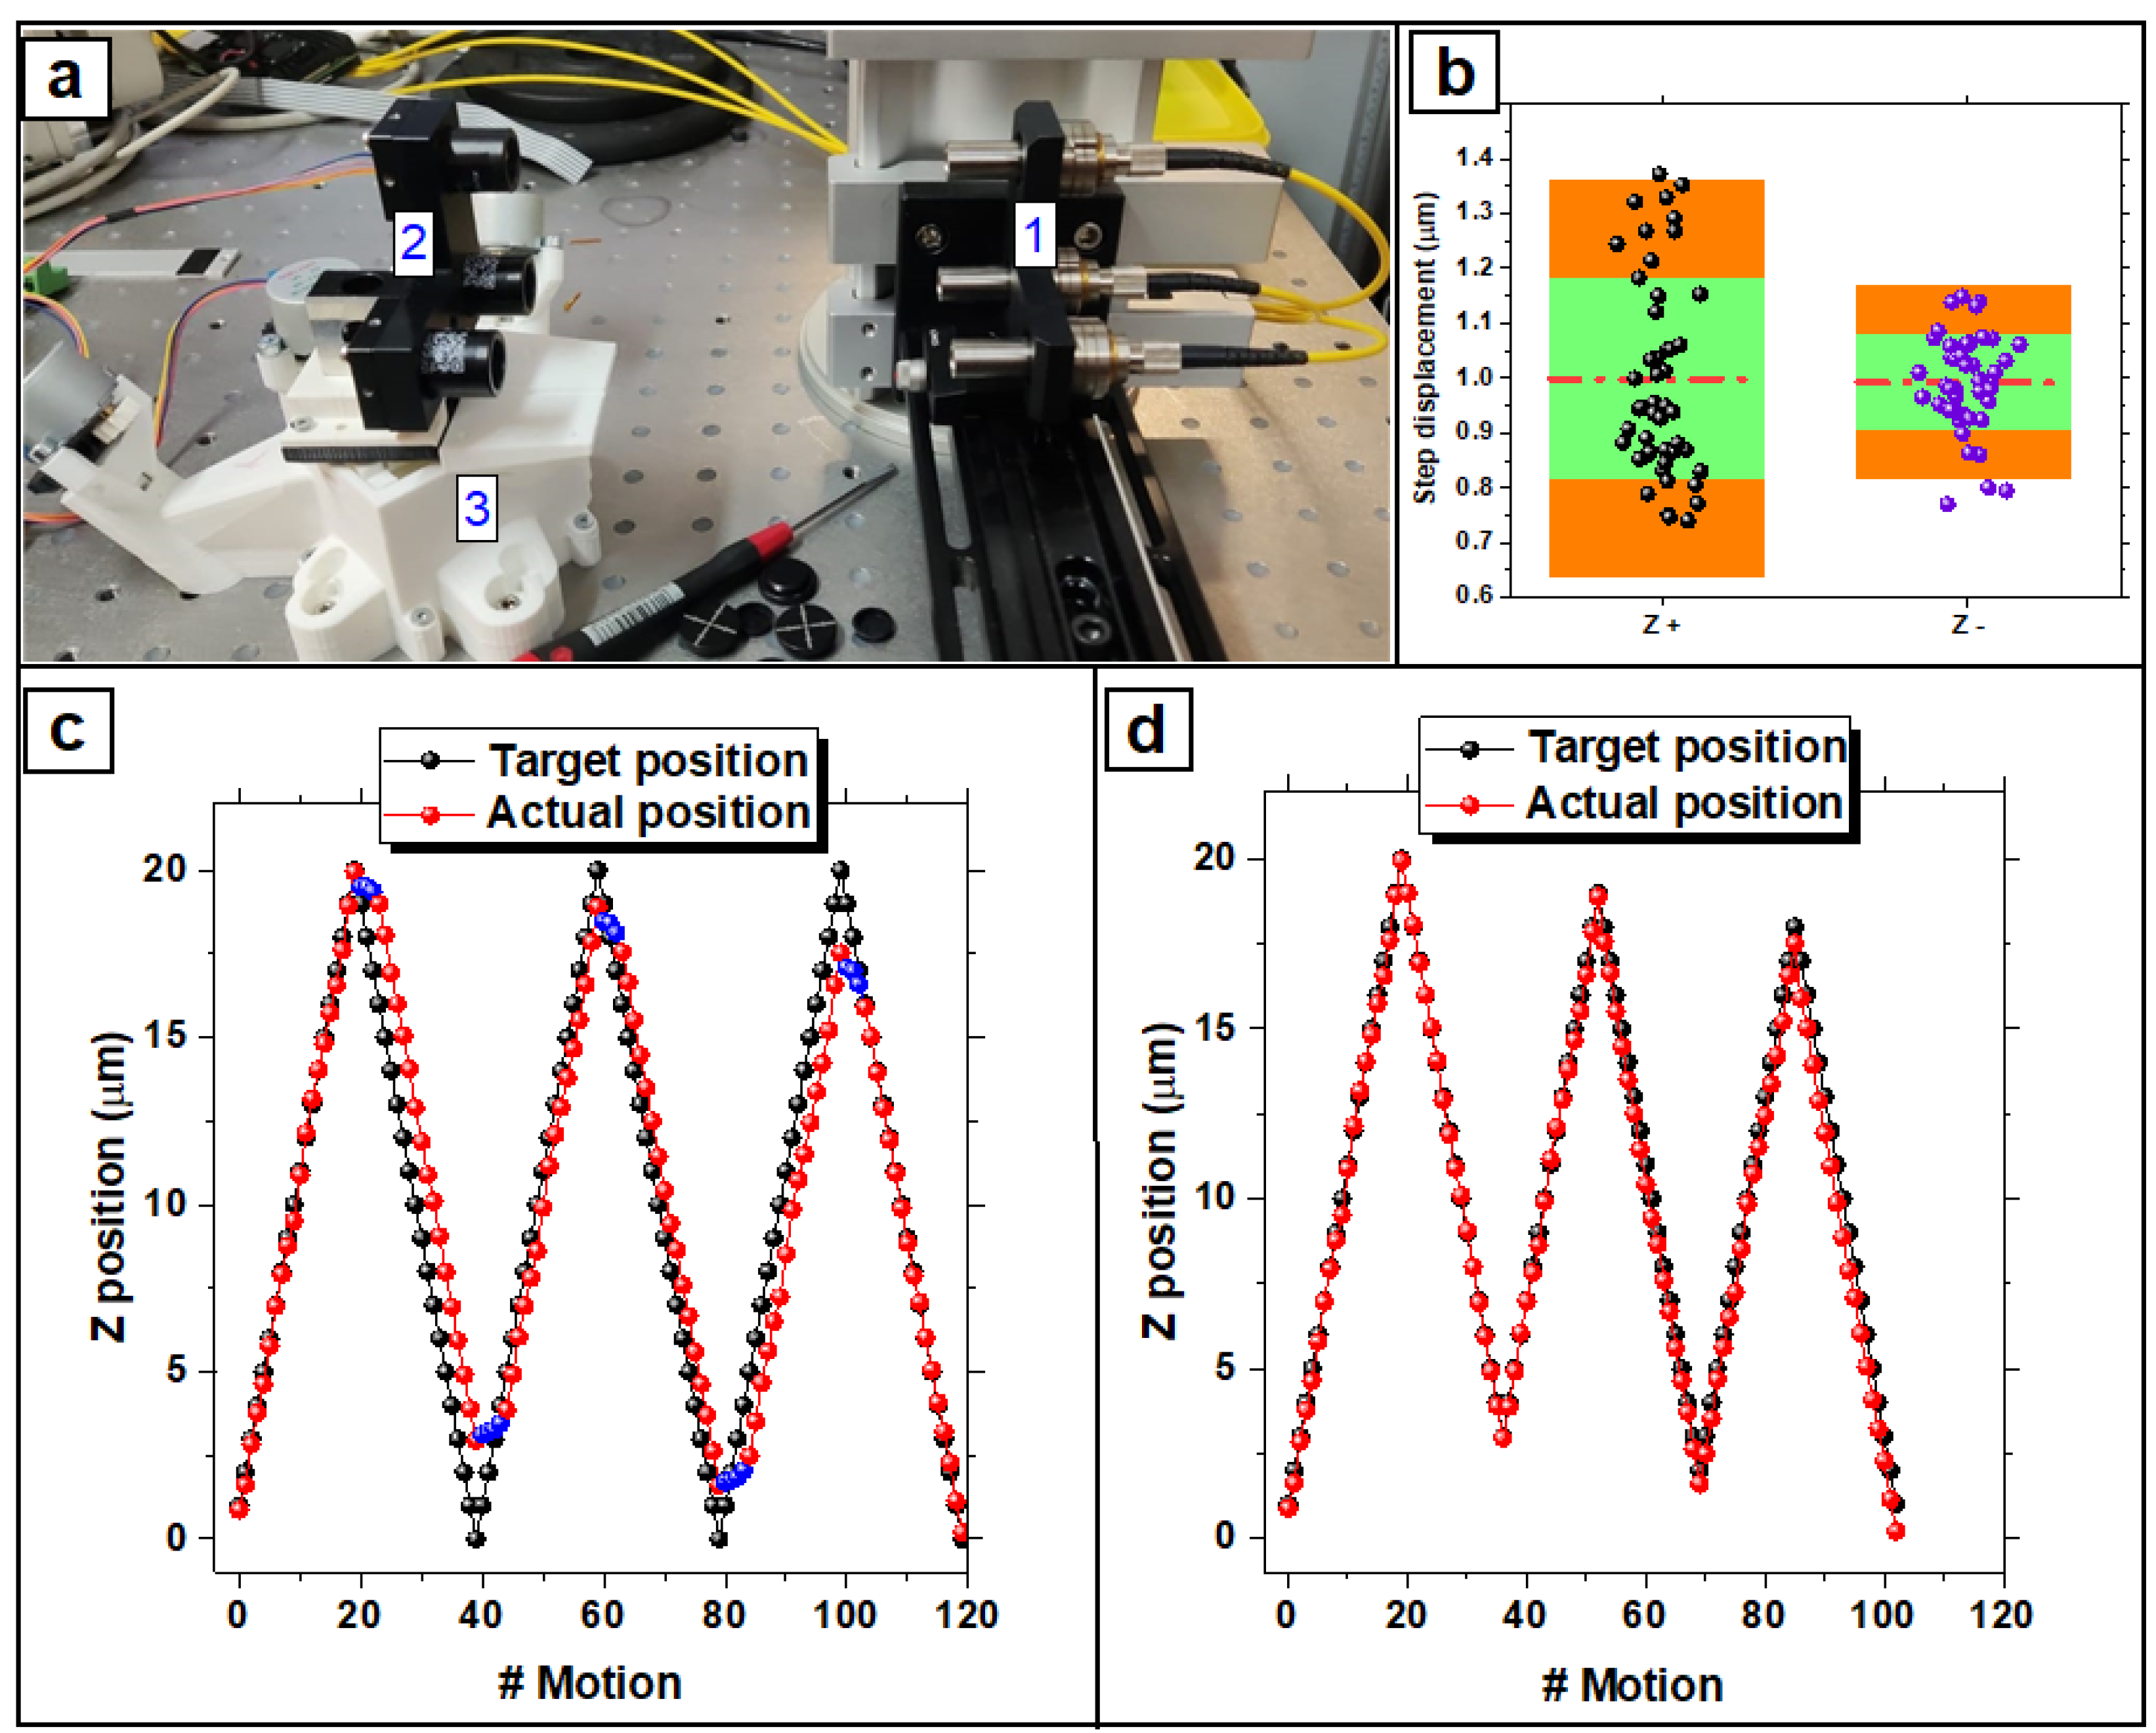
3.1. Stage Calibration
3.1.1. Bidirectional Systematic Error
3.1.2. Backlash Evaluation and Correction
3.1.3. Bidirectional Positioning Accuracy of Axis
3.1.4. Uncertainty of Probe Positioning
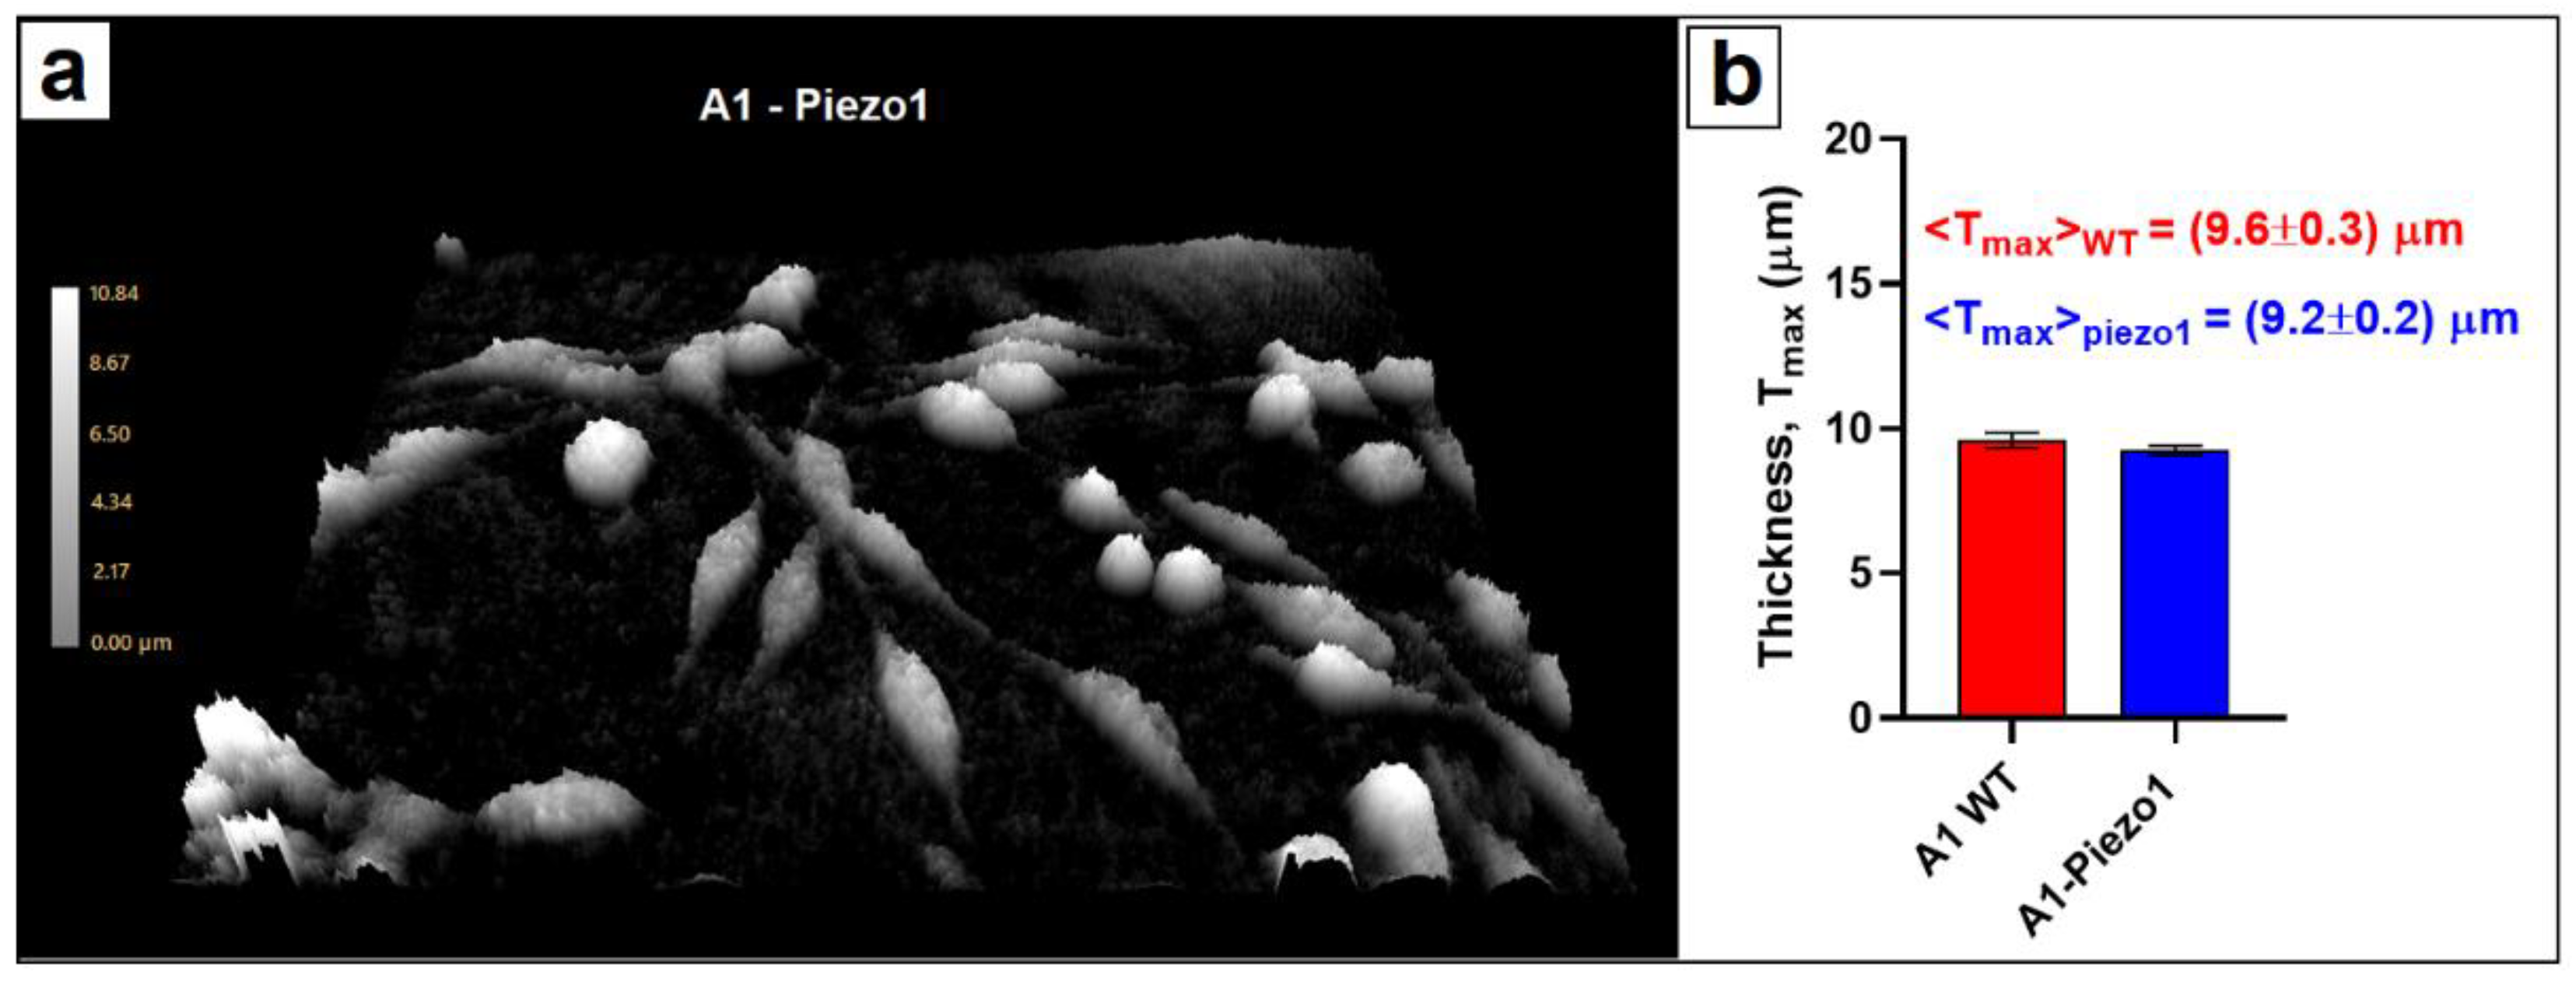
3.2. Cellular Morphometry
3.3. Microindentation: Data Acquisition
3.4. Data Analysis
4. Conclusions
Supplementary Materials
Author Contributions
Funding
Data Availability Statement
Acknowledgments
Conflicts of Interest
References
- Liu, H.; Hu, J.; Zheng, Q.; Feng, X.; Zhan, F.; Wang, X.; Xu, G.; Hua, F. Piezo1 Channels as Force Sensors in Mechanical Force-Related Chronic Inflammation. Front. Immunol. 2022, 13, 816149. [Google Scholar] [CrossRef]
- Chen, X.; Wanggou, S.; Bodalia, A.; Zhu, M.; Dong, W.; Fan, J.J.; Yin, W.C.; Min, H.K.; Hu, M.; Draghici, D.; et al. A Feedforward Mechanism Mediated by Mechanosensitive Ion Channel PIEZO1 and Tissue Mechanics Promotes Glioma Aggression. Neuron 2018, 100, 799–815.e7. [Google Scholar] [CrossRef] [Green Version]
- Solis, A.G.; Bielecki, P.; Steach, H.R.; Sharma, L.; Harman, C.C.D.; Yun, S.; de Zoete, M.R.; Warnock, J.N.; To, S.D.F.; York, A.G.; et al. Mechanosensation of cyclical force by PIEZO1 is essential for innate immunity. Nature 2019, 573, 69–74. [Google Scholar] [CrossRef]
- Ranade, S.S.; Qiu, Z.; Woo, S.H.; Hur, S.S.; Murthy, S.E.; Cahalan, S.M.; Xu, J.; Mathur, J.; Bandell, M.; Coste, B.; et al. Piezo1, a mechanically activated ion channel, is required for vascular development in mice. Proc. Natl. Acad. Sci. USA 2014, 111, 10347–10352. [Google Scholar] [CrossRef] [Green Version]
- Alcaino, C.; Knutson, K.R.; Treichel, A.J.; Yildiz, G.; Strege, P.R.; Linden, D.R.; Li, J.H.; Leiter, A.B.; Szurszewski, J.H.; Farrugia, G.; et al. A population of gut epithelial enterochromaffin cells is mechanosensitive and requires Piezo2 to convert force into serotonin release. Proc. Natl. Acad. Sci. USA 2018, 115, E7632–E7641. [Google Scholar] [CrossRef] [Green Version]
- Soattin, L.; Fiore, M.; Gavazzo, P.; Viti, F.; Facci, P.; Raiteri, R.; Difato, F.; Pusch, M.; Vassalli, M. The biophysics of piezo1 and piezo2 mechanosensitive channels. Biophys. Chem. 2015, 208, 26–33. [Google Scholar] [CrossRef]
- Fang, X.Z.; Zhou, T.; Xu, J.Q.; Wang, Y.X.; Sun, M.M.; He, Y.J.; Pan, S.W.; Xiong, W.; Peng, Z.K.; Gao, X.H.; et al. Structure, kinetic properties and biological function of mechanosensitive Piezo channels. Cell Biosci. 2021, 11, 13. [Google Scholar] [CrossRef]
- Coste, B.; Mathur, J.; Schmidt, M.; Earley, T.J.; Ranade, S.; Petrus, M.J.; Dubin, A.E.; Patapoutian, A. Piezo1 and Piezo2 Are Essential Components of Distinct Mechanically Activated Cation Channels. Science 2010, 330, 55–60. [Google Scholar] [CrossRef] [Green Version]
- Sun, W.; Chi, S.; Li, Y.; Ling, S.; Tan, Y.; Xu, Y.; Jiang, F.; Li, J.; Liu, C.; Zhong, G.; et al. The mechanosensitive Piezo1 channel is required for bone formation. elife 2019, 8, e47454. [Google Scholar] [CrossRef]
- Wang, L.; You, X.; Lotinun, S.; Zhang, L.; Wu, N.; Zou, W. Mechanical sensing protein PIEZO1 regulates bone homeostasis via osteoblast-osteoclast crosstalk. Nat. Commun. 2020, 11, 282. [Google Scholar] [CrossRef] [Green Version]
- Wang, S.P.; Cao, S.; Arhatte, M.; Li, D.; Shi, Y.; Kurz, S.; Hu, J.; Wang, L.; Shao, J.; Atzberger, A.; et al. Adipocyte Piezo1 mediates obesogenic adipogenesis through the FGF1/FGFR1 signaling pathway in mice. Nat. Commun. 2020, 11, 2303. [Google Scholar] [CrossRef]
- Glogowska, E.; Arhatte, M.; Chatelain, F.C.; Lesage, F.; Xu, A.; Grashoff, C.; Discher, D.E.; Patel, A.; Honoré, E. Piezo1 and Piezo2 foster mechanical gating of K2P channels. Cell Rep. 2021, 37, 110070. [Google Scholar] [CrossRef]
- Shi, J.; Hyman, A.J.; De Vecchis, D.; Chong, J.; Lichtenstein, L.; Futers, T.S.; Rouahi, M.; Salvayre, A.N.; Auge, N.; Kalli, A.C.; et al. Sphingomyelinase Disables Inactivation in Endogenous PIEZO1 Channels. Cell Rep. 2020, 33, 108225. [Google Scholar] [CrossRef]
- Gottlieb, P.A.; Bae, C.; Sachs, F. Gating the mechanical channel Piezo1: A comparison between whole-cell and patch recording. Channels 2012, 6, 282–289. [Google Scholar] [CrossRef] [Green Version]
- Yajuan, X.; Xin, L.; Zhiyuan, L. A Comparison of the Performance and Application Differences Between Manual and Automated Patch-Clamp Techniques. Curr. Chem. Genom. 2013, 6, 87–92. [Google Scholar] [CrossRef]
- Yaganoglu, S.; Helassa, N.; Gaub, B.M.; Welling, M.; Shi, J.; Müller, D.J.; Török, K.; Pantazis, P. GenEPi: Piezo1-based fluorescent reporter for visualizing mechanical stimuli with high spatiotemporal resolution. bioRxiv 2019, 702423. [Google Scholar] [CrossRef]
- Chubinskiy-Nadezhdin, V.; Semenova, S.; Vasileva, V.; Shatrova, A.; Pugovkina, N.; Negulyaev, Y. Store-Operated Ca2+ Entry Contributes to Piezo1-Induced Ca2+ Increase in Human Endometrial Stem Cells. Int. J. Mol. Sci. 2022, 23, 3763. [Google Scholar] [CrossRef]
- Romac, J.M.J.; Shahid, R.A.; Swain, S.M.; Vigna, S.R.; Liddle, R.A. Piezo1 is a mechanically activated ion channel and mediates pressure induced pancreatitis. Nat. Commun. 2018, 9, 1715. [Google Scholar] [CrossRef]
- Gaub, B.M.; Müller, D.J. Mechanical Stimulation of Piezo1 Receptors Depends on Extracellular Matrix Proteins and Directionality of Force. Nano Lett. 2017, 17, 2064–2072. [Google Scholar] [CrossRef]
- Zhang, G.; Li, X.; Wu, L.; Qin, Y.X. Piezo1 channel activation in response to mechanobiological acoustic radiation force in osteoblastic cells. Bone Res. 2021, 9, 16. [Google Scholar] [CrossRef]
- Zhang, L.; Liu, X.; Gao, L.; Ji, Y.; Wang, L.; Zhang, C.; Dai, L.; Liu, J.; Ji, Z. Activation of Piezo1 by ultrasonic stimulation and its effect on the permeability of human umbilical vein endothelial cells. Biomed. Pharmacother. 2020, 131, 110796. [Google Scholar] [CrossRef]
- Colucci-D’Amato, G.L.; Tino, A.; Pernas-Alonso, R.; Ffrench-Mullen, J.M.H.; Di Porzio, U. Neuronal and glial properties coexist in a novel mouse CNS immortalized cell line. Exp. Cell Res. 1999, 252, 383–391. [Google Scholar] [CrossRef]
- Gentile, M.T.; Nawa, Y.; Lunardi, G.; Florio, T.; Matsui, H.; Colucci-D’Amato, L. Tryptophan hydroxylase 2 (TPH2) in a neuronal cell line: Modulation by cell differentiation and NRSF/rest activity. J. Neurochem. 2012, 123, 963–970. [Google Scholar] [CrossRef]
- Grynkiewicz, G.; Poenie, M.; Tsien, R.Y. A new generation of Ca2+ indicators with greatly improved fluorescence properties. J. Biol. Chem. 1985, 260, 3440–3450. [Google Scholar] [CrossRef]
- Tsien, R.Y. A non-disruptive technique for loading calcium buffers and indicators into cells. Nature 1981, 290, 527–528. [Google Scholar] [CrossRef]
- Florio, T.; Casagrande, S.; Diana, F.; Bajetto, A.; Porcile, C.; Zona, G.; Thellung, S.; Arena, S.; Pattarozzi, A.; Corsaro, A.; et al. Chemokine Stromal Cell-Derived Factor 1α Induces Proliferation and Growth Hormone Release in GH4C1 Rat Pituitary Adenoma Cell Line through Multiple Intracellular Signals. Mol. Pharmacol. 2006, 69, 539–546. [Google Scholar] [CrossRef]
- Wu, J.; Young, M.; Lewis, A.H.; Martfeld, A.N.; Kalmeta, B.; Grandl, J. Inactivation of Mechanically Activated Piezo1 Ion Channels Is Determined by the C-Terminal Extracellular Domain and the Inner Pore Helix. Cell Rep. 2017, 21, 2357–2366. [Google Scholar] [CrossRef] [Green Version]
- Brini, M.; Carafoli, E. Calcium pumps in health and disease. Physiol. Rev. 2009, 89, 1341–1378. [Google Scholar] [CrossRef] [Green Version]
- Schindelin, J.; Arganda-Carreras, I.; Frise, E.; Kaynig, V.; Longair, M.; Pietzsch, T.; Preibisch, S.; Rueden, C.; Saalfeld, S.; Schmid, B.; et al. Fiji: An open-source platform for biological-image analysis. Nat. Methods 2012, 9, 676–682. [Google Scholar] [CrossRef] [Green Version]
- Rappaz, B.; Marquet, P.; Cuche, E.; Emery, Y.; Magistretti, P.J. Measurement of the integral refractive index and dynamic cell morphometry of living cells with digital holographic microscopy. Opt. Express 2005, 13, 9361–9373. [Google Scholar] [CrossRef] [Green Version]
- Hao, J.; Ruel, J.; Coste, B.; Roudaut, Y.; Crest, M.; Delmas, P. Piezo-electrically driven mechanical stimulation of sensory neurons. Methods Mol. Biol. 2013, 998, 159–170. [Google Scholar] [CrossRef] [PubMed]
- Hao, J.; Delmas, P. Recording of mechanosensitive currents using piezoelectrically driven mechanostimulator. Nat. Protoc. 2011, 6, 979–990. [Google Scholar] [CrossRef] [PubMed]
- Meng, Q.; Harrington, K.; Stirling, J.; Bowman, R. The OpenFlexure Block Stage: Sub-100 nm fibre alignment with a monolithic plastic flexure stage. Opt. Express 2020, 28, 4763–4772. [Google Scholar] [CrossRef]
- GitLab Repository of the OpenFlexure Block Stage. Available online: https://gitlab.com/openflexure/openflexure-block-stage (accessed on 24 October 2021).
- 28BYJ-48 Bipolar Mod. Available online: https://ardufocus.com/howto/28byj-48-bipolar-hw-mod/ (accessed on 24 October 2021).
- Universal-G-Code-Sender. Available online: https://github.com/winder/Universal-G-Code-Sender (accessed on 24 October 2021).
- ISO. Test Code for Machine Tools—Part 2: Determination of Accuracy and Repeatability of Positioning of Numerically Controlled Axes; ISO: Geneva, Switzerland, 2014; ISBN 2831886376. [Google Scholar]
- Molder, A.; Sebesta, M.; Gustaffson, M.; Gisselson, L.; Gjorloff Wingren, A.; Alm, K. Non-invasive, label-free cell counting and quantitative analysis of adherent cells using digital holography. J. Microsc. 2008, 232, 240–247. [Google Scholar] [CrossRef] [PubMed]
- Cuche, E.; Bevilacqua, F.; Depeursinge, C. Digital holography for quantitative phase-contrast imaging. Opt. Lett. 1999, 24, 291–293. [Google Scholar] [CrossRef] [PubMed]
- Farinas, J.; Verkman, A.S. Cell Volume and Plasma Membrane Osmotic Water Permeability in Epithelial Cell Layers Measured by Interferometry Interference microscopy. Biophys. J. 1996, 71, 3511–3522. [Google Scholar] [CrossRef] [Green Version]
- Dunn, A.; Richards-kortum, R. Three-Dimensional Computation of Light Scattering from Cells. IEEE J. Sel. Top. Quantum Electron. 1996, 2, 898–905. [Google Scholar] [CrossRef]
- Kemper, B.; Bauwens, A.; Vollmer, A.; Ketelhut, S.; Langehanenberg, P.; Müthing, J.; Karch, H.; von Bally, G. Label-free quantitative cell division monitoring of endothelial cells by digital holographic microscopy. J. Biomed. Opt. 2010, 15, 036009. [Google Scholar] [CrossRef] [Green Version]
- Virtanen, P.; Gommers, R.; Oliphant, T.E.; Haberland, M.; Reddy, T.; Cournapeau, D.; Burovski, E.; Peterson, P.; Weckesser, W.; Bright, J.; et al. SciPy 1.0: Fundamental algorithms for scientific computing in Python. Nat. Methods 2020, 17, 261–272. [Google Scholar] [CrossRef] [Green Version]
- Ridone, P.; Pandzic, E.; Vassalli, M.; Cox, C.D.; Macmillan, A.; Gottlieb, P.A.; Martinac, B. Disruption of membrane cholesterol organization impairs the activity of PIEZO1 channel clusters. J. Gen. Physiol. 2020, 152, e201912515. [Google Scholar] [CrossRef]
- Jiang, W.; Del Rosario, J.S.; Botello-Smith, W.; Zhao, S.; Lin, Y.C.; Zhang, H.; Lacroix, J.; Rohacs, T.; Luo, Y.L. Crowding-induced opening of the mechanosensitive Piezo1 channel in silico. Commun. Biol. 2021, 4, 84. [Google Scholar] [CrossRef] [PubMed]


Publisher’s Note: MDPI stays neutral with regard to jurisdictional claims in published maps and institutional affiliations. |
© 2022 by the authors. Licensee MDPI, Basel, Switzerland. This article is an open access article distributed under the terms and conditions of the Creative Commons Attribution (CC BY) license (https://creativecommons.org/licenses/by/4.0/).
Share and Cite
Capponi, G.; Zambito, M.; Neri, I.; Cottone, F.; Mattarelli, M.; Vassalli, M.; Caponi, S.; Florio, T. Cellular Mechanosensitivity: Validation of an Adaptable 3D-Printed Device for Microindentation. Nanomaterials 2022, 12, 2691. https://doi.org/10.3390/nano12152691
Capponi G, Zambito M, Neri I, Cottone F, Mattarelli M, Vassalli M, Caponi S, Florio T. Cellular Mechanosensitivity: Validation of an Adaptable 3D-Printed Device for Microindentation. Nanomaterials. 2022; 12(15):2691. https://doi.org/10.3390/nano12152691
Chicago/Turabian StyleCapponi, Giulio, Martina Zambito, Igor Neri, Francesco Cottone, Maurizio Mattarelli, Massimo Vassalli, Silvia Caponi, and Tullio Florio. 2022. "Cellular Mechanosensitivity: Validation of an Adaptable 3D-Printed Device for Microindentation" Nanomaterials 12, no. 15: 2691. https://doi.org/10.3390/nano12152691