
Mechanical Properties and Characterization of Epoxy Composites Containing Highly Entangled As-Received and Acid Treated Carbon Nanotubes


 ,
,
Abstract
:1. Introduction
2. Materials and Methods
2.1. Materials
2.2. CNT Acid Treatment Methods
2.2.1. Nitric/Sulfuric Acid Treatment at 23 °C
2.2.2. Nitric Acid Treatment at 90 °C and 120 °C
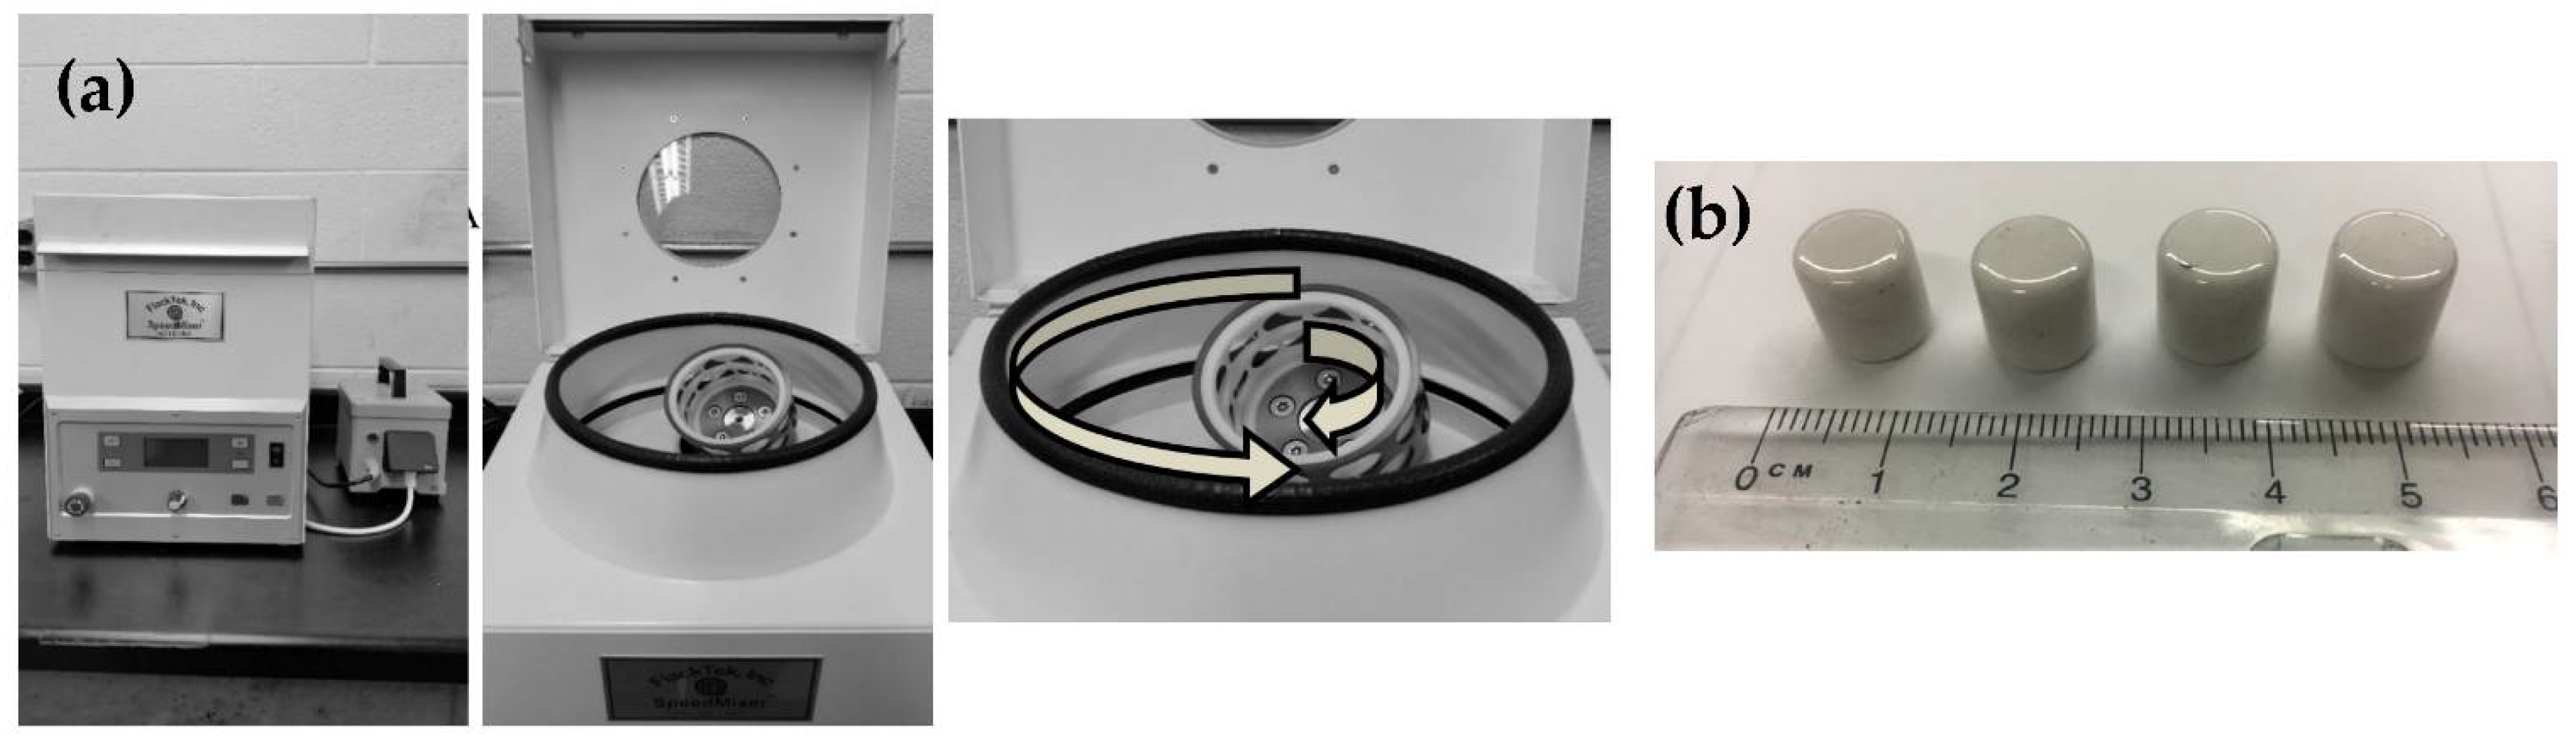
2.3. Specimen Fabrication
2.4. Flexural 3-Point Bend Test Method
2.5. Dynamic Mechanical Analysis (DMA) Test Method
2.6. Field Emission Scanning Electron Microscope (FE-SEM) Test Method
2.7. Transmission Electron Microscope (TEM) Test Method
2.8. Thermogravimetric Analysis (TGA) Test Method
2.9. Raman Spectroscopy Test Method
2.10. X-ray Photon Spectroscopy (XPS) Test Method
3. Results
3.1. Flexural 3-Point Bend Results
3.2. DMA Results
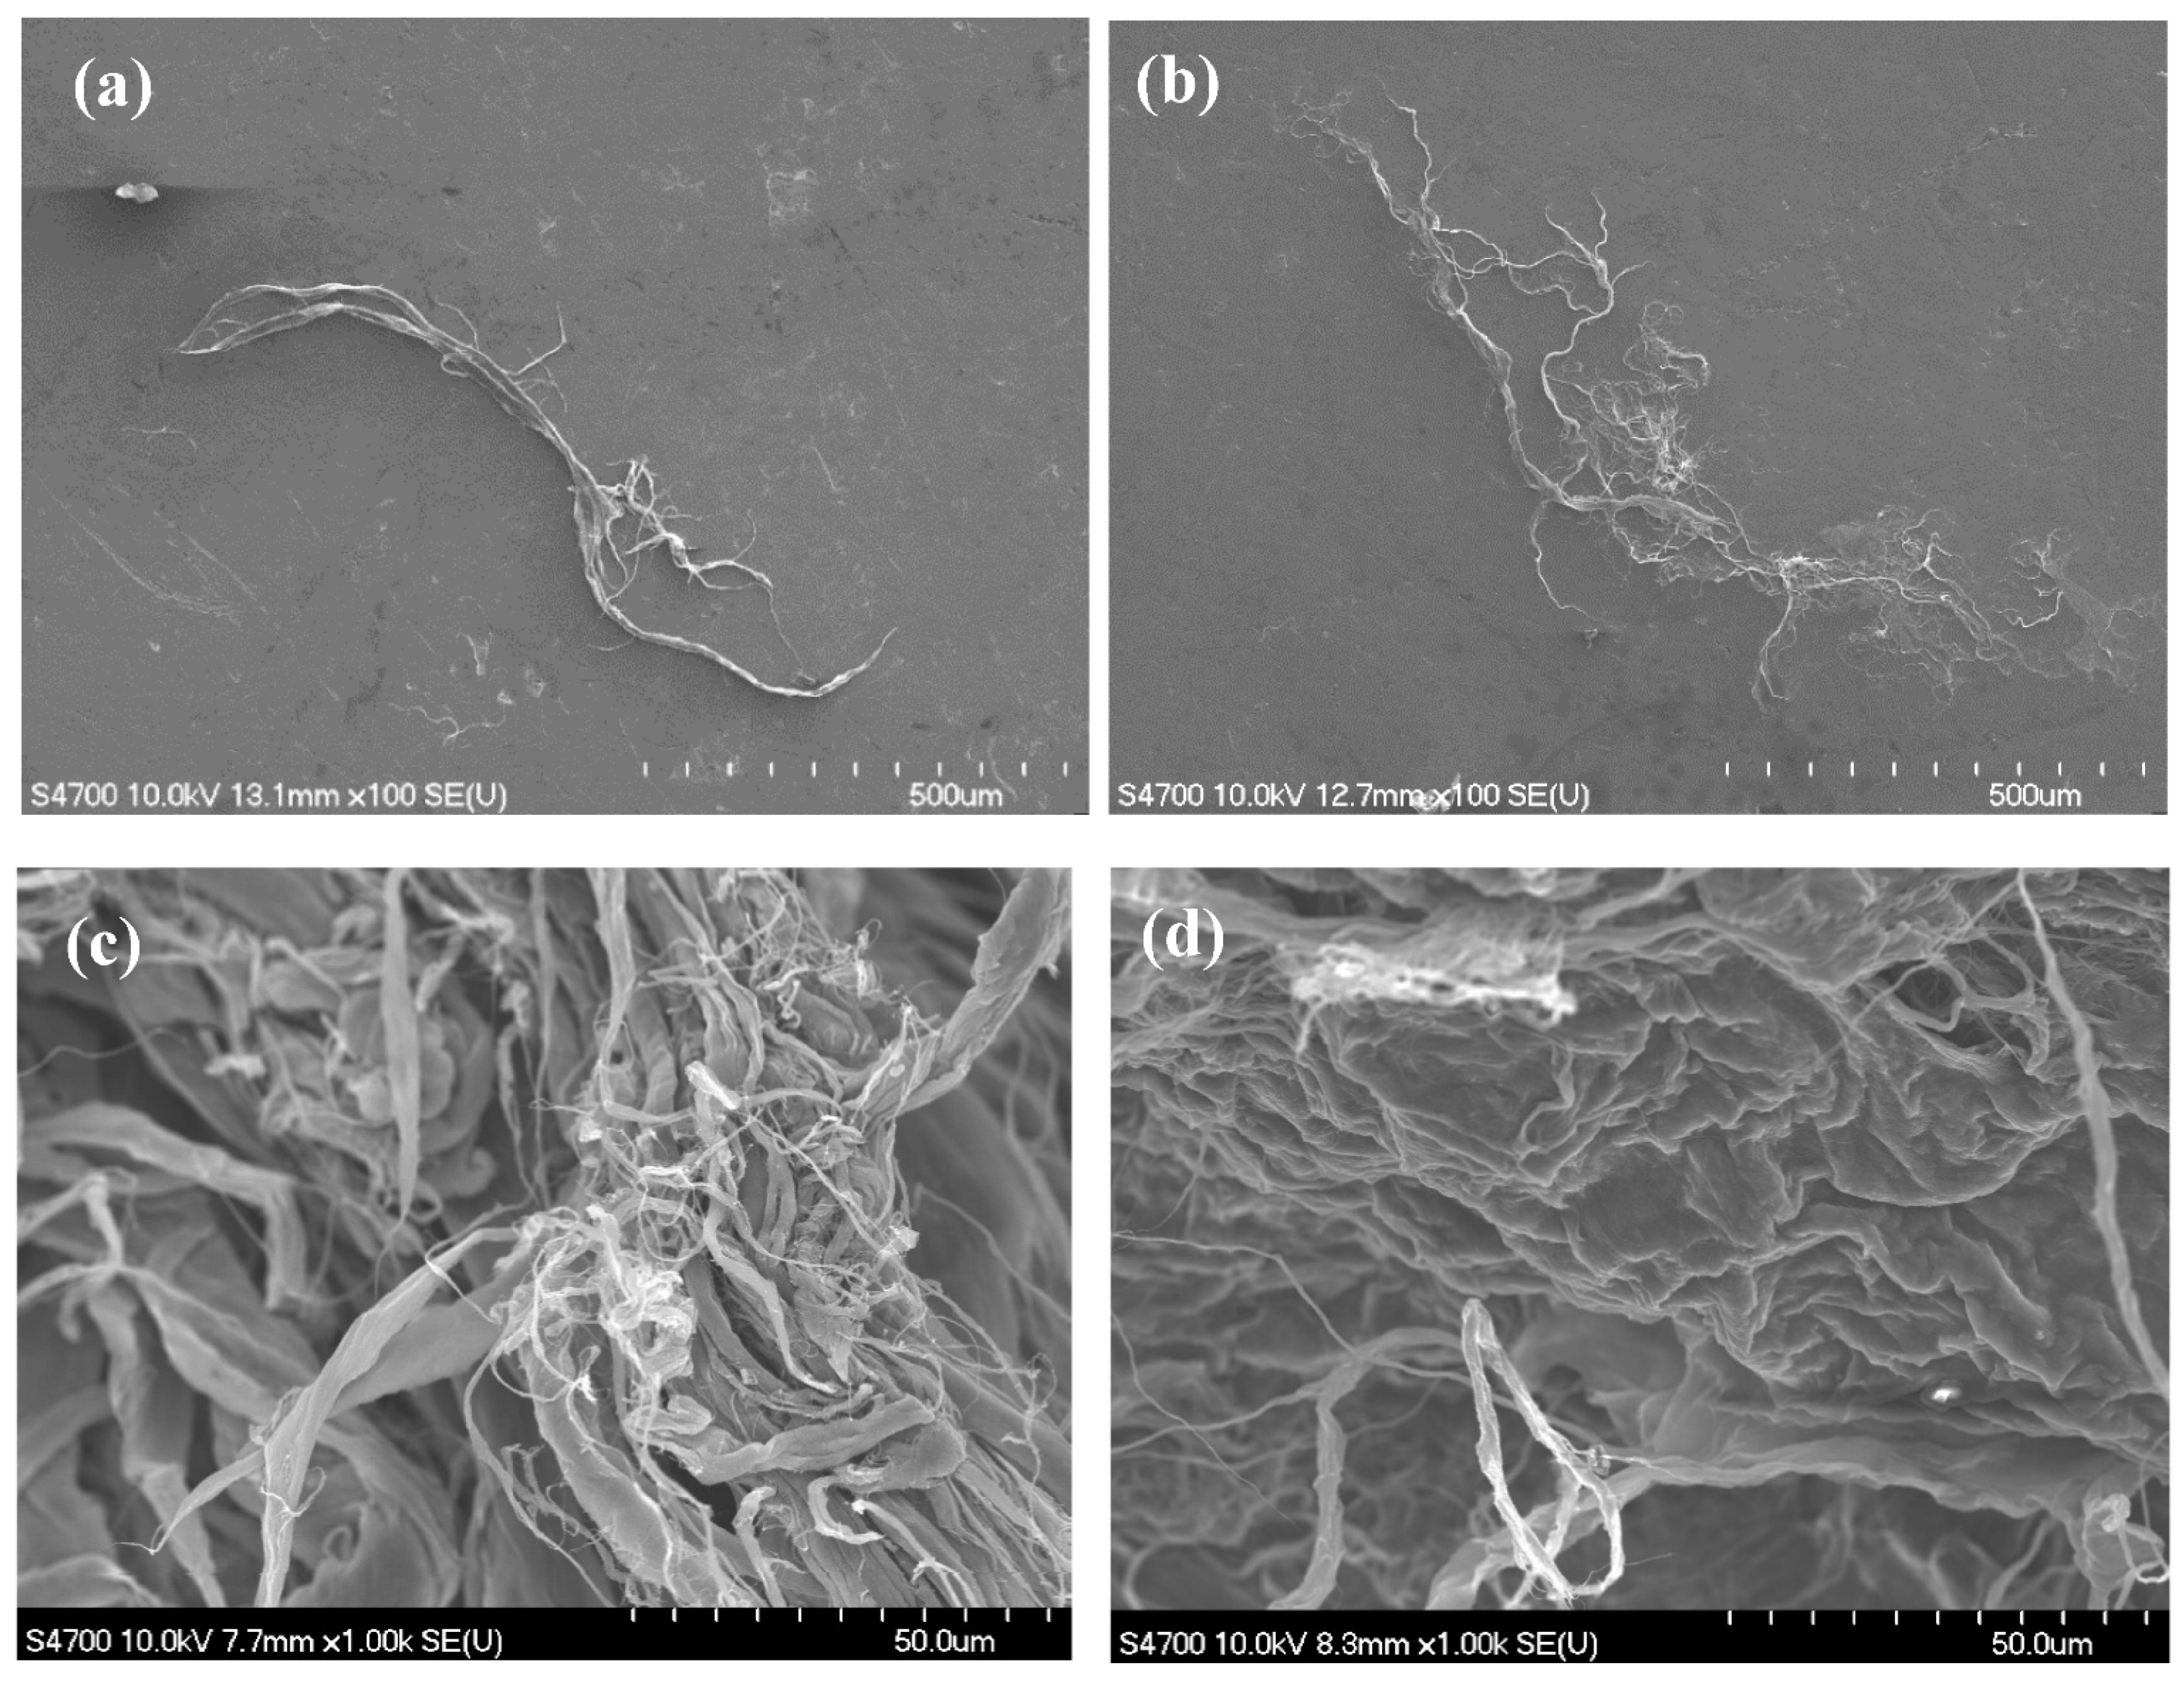
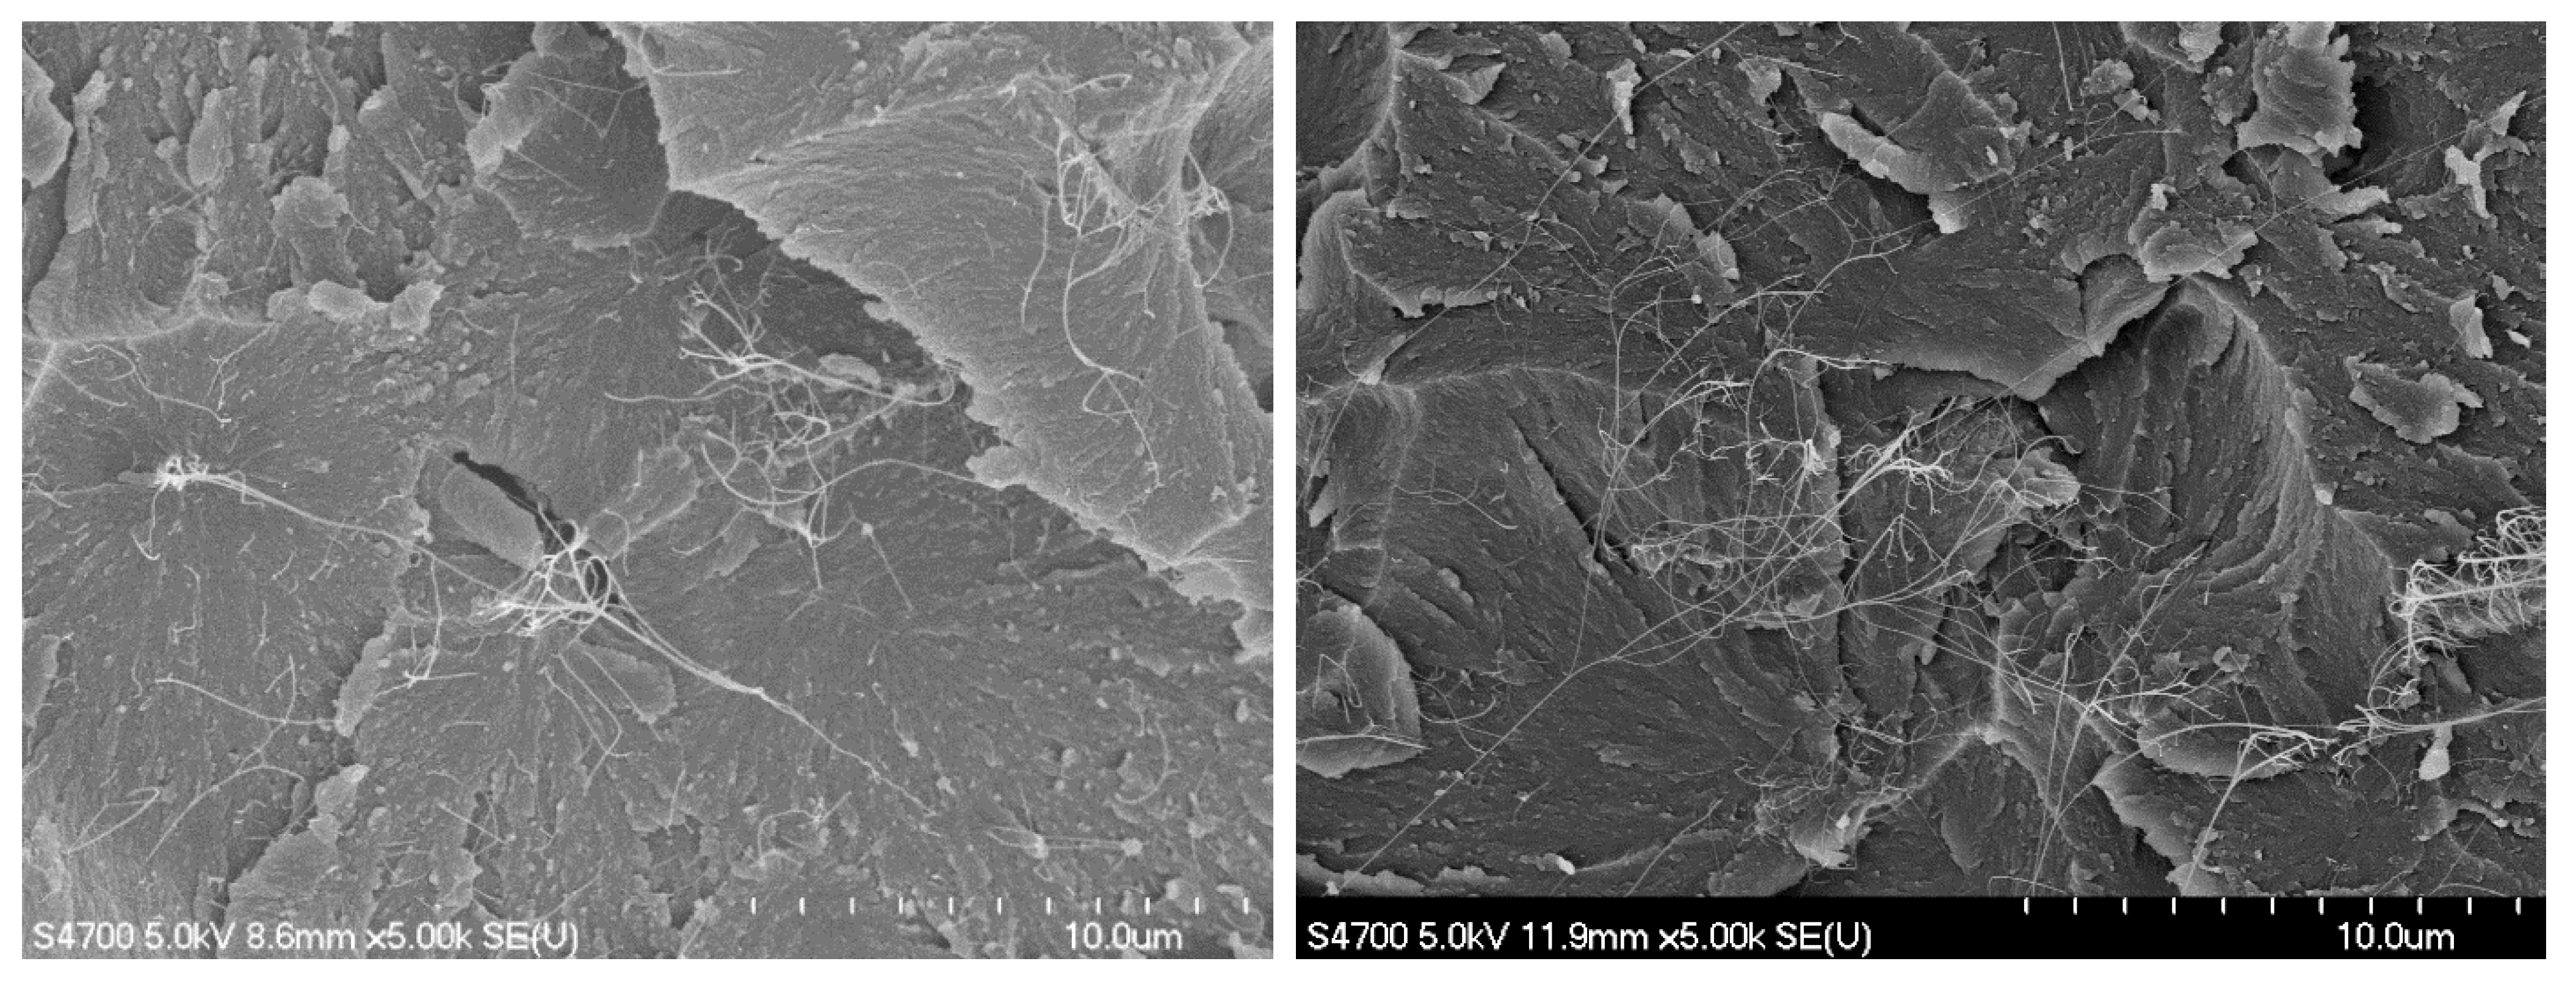
3.3. FE-SEM Results
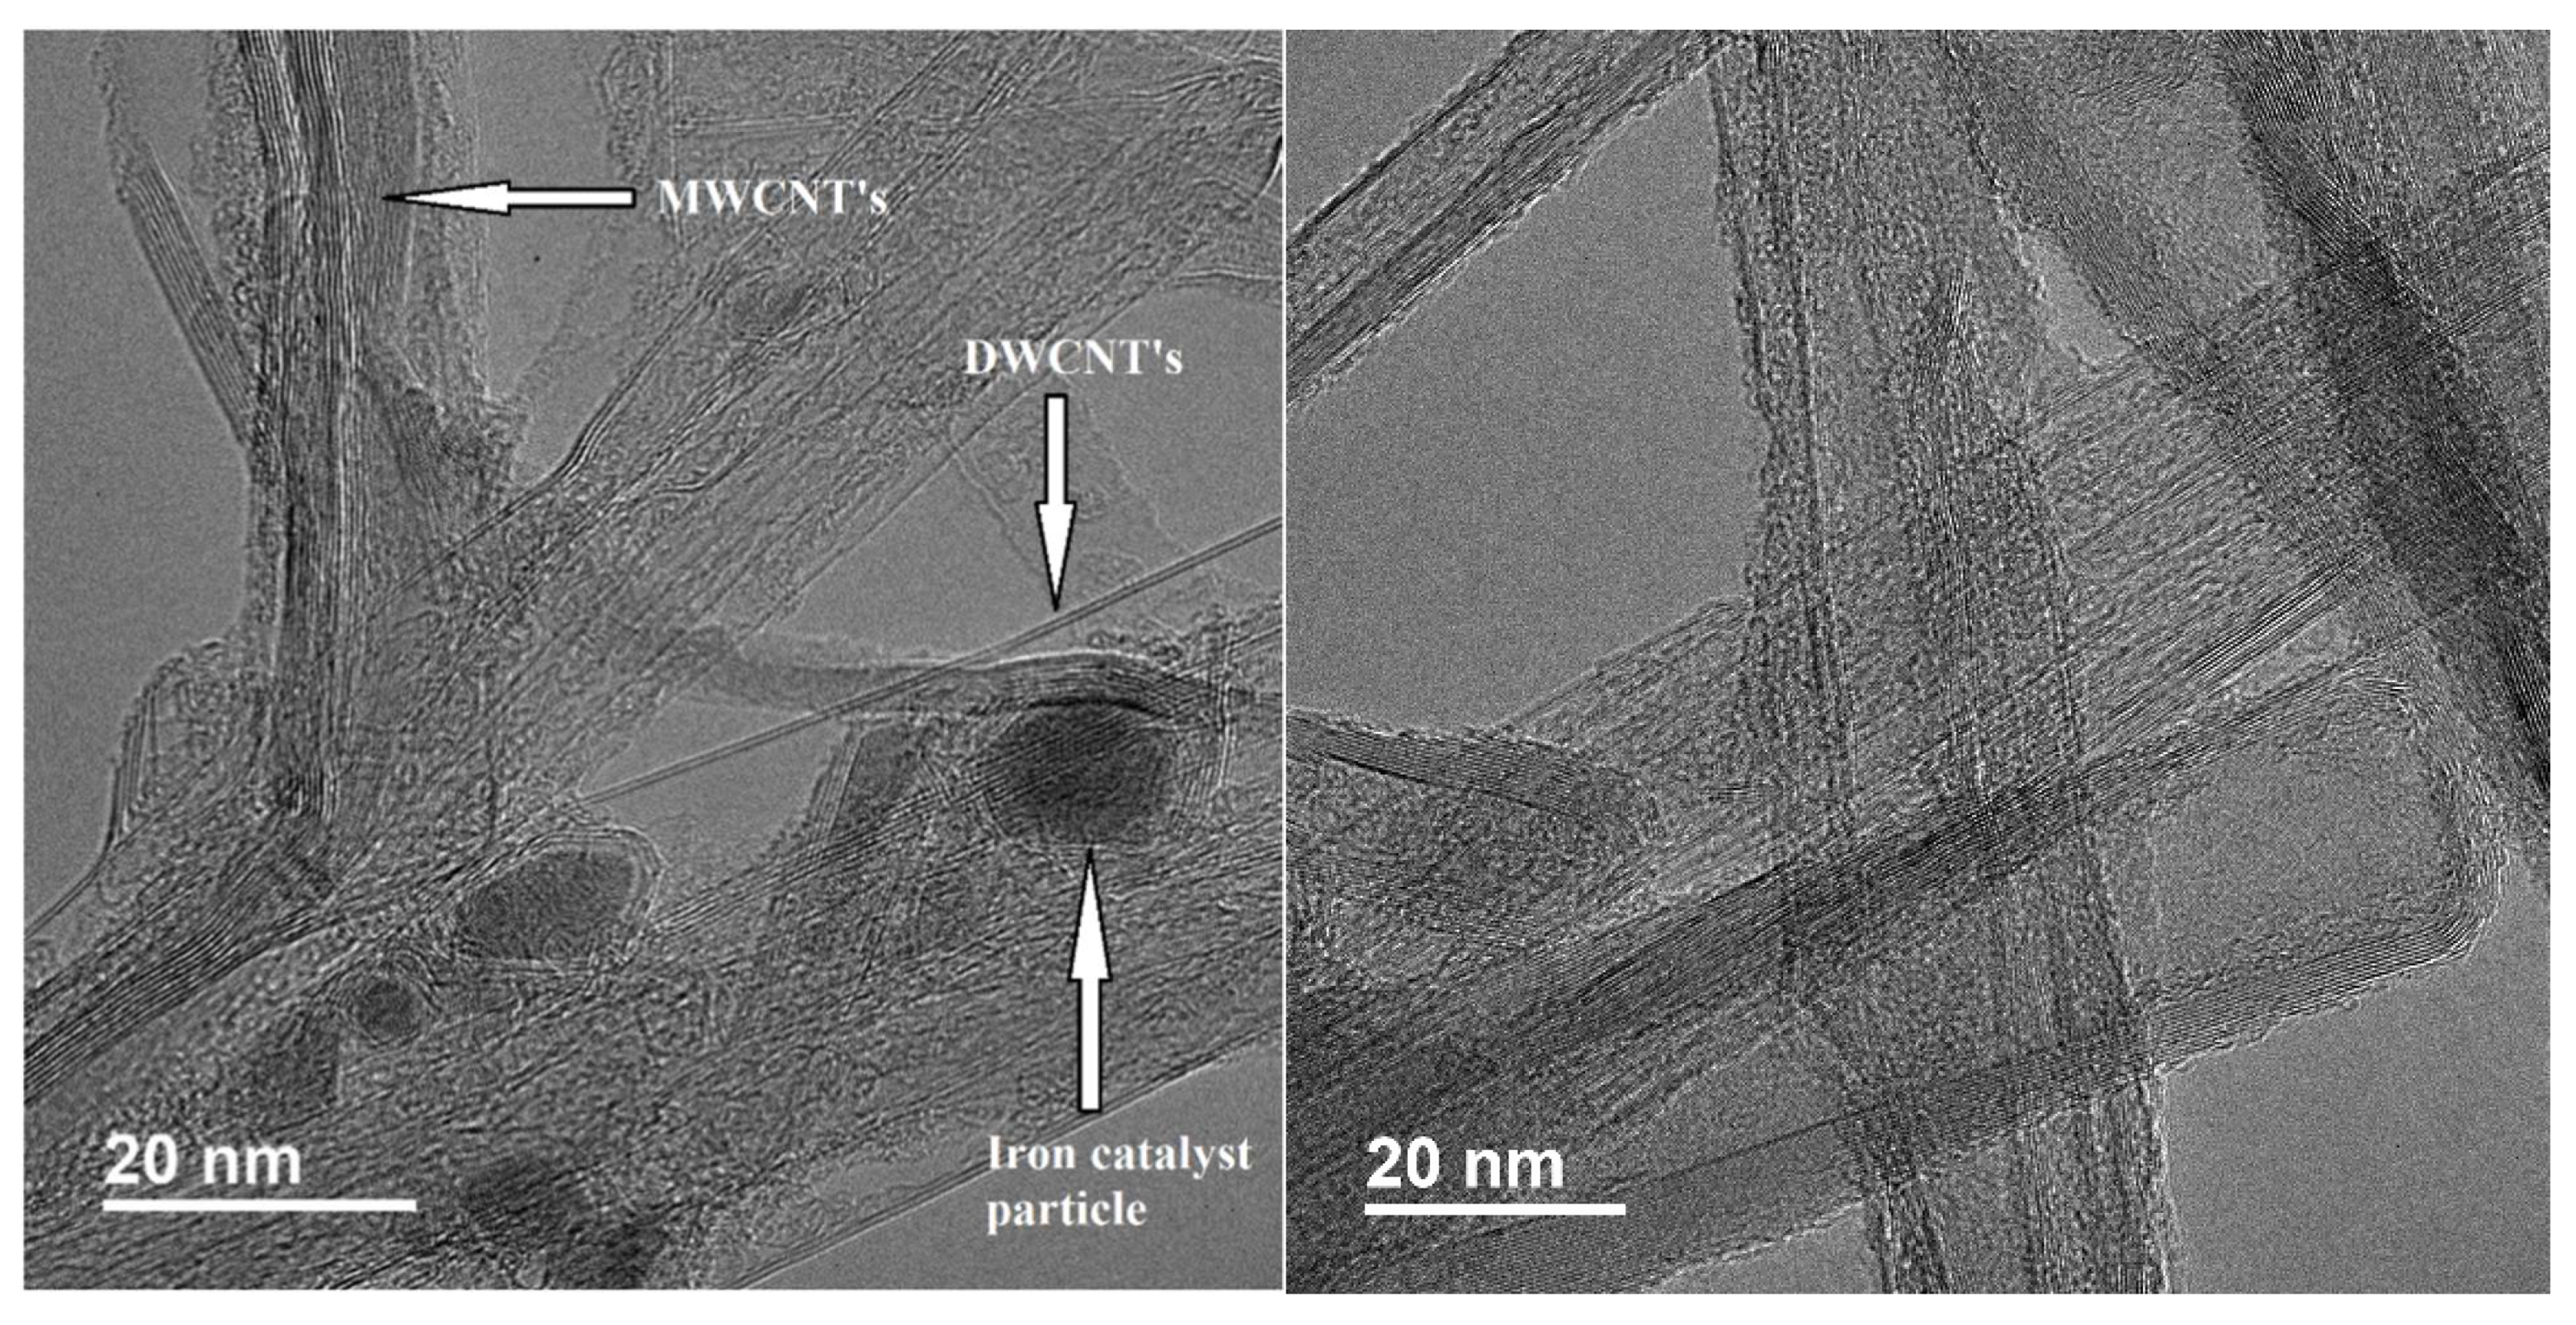
3.4. TEM Results
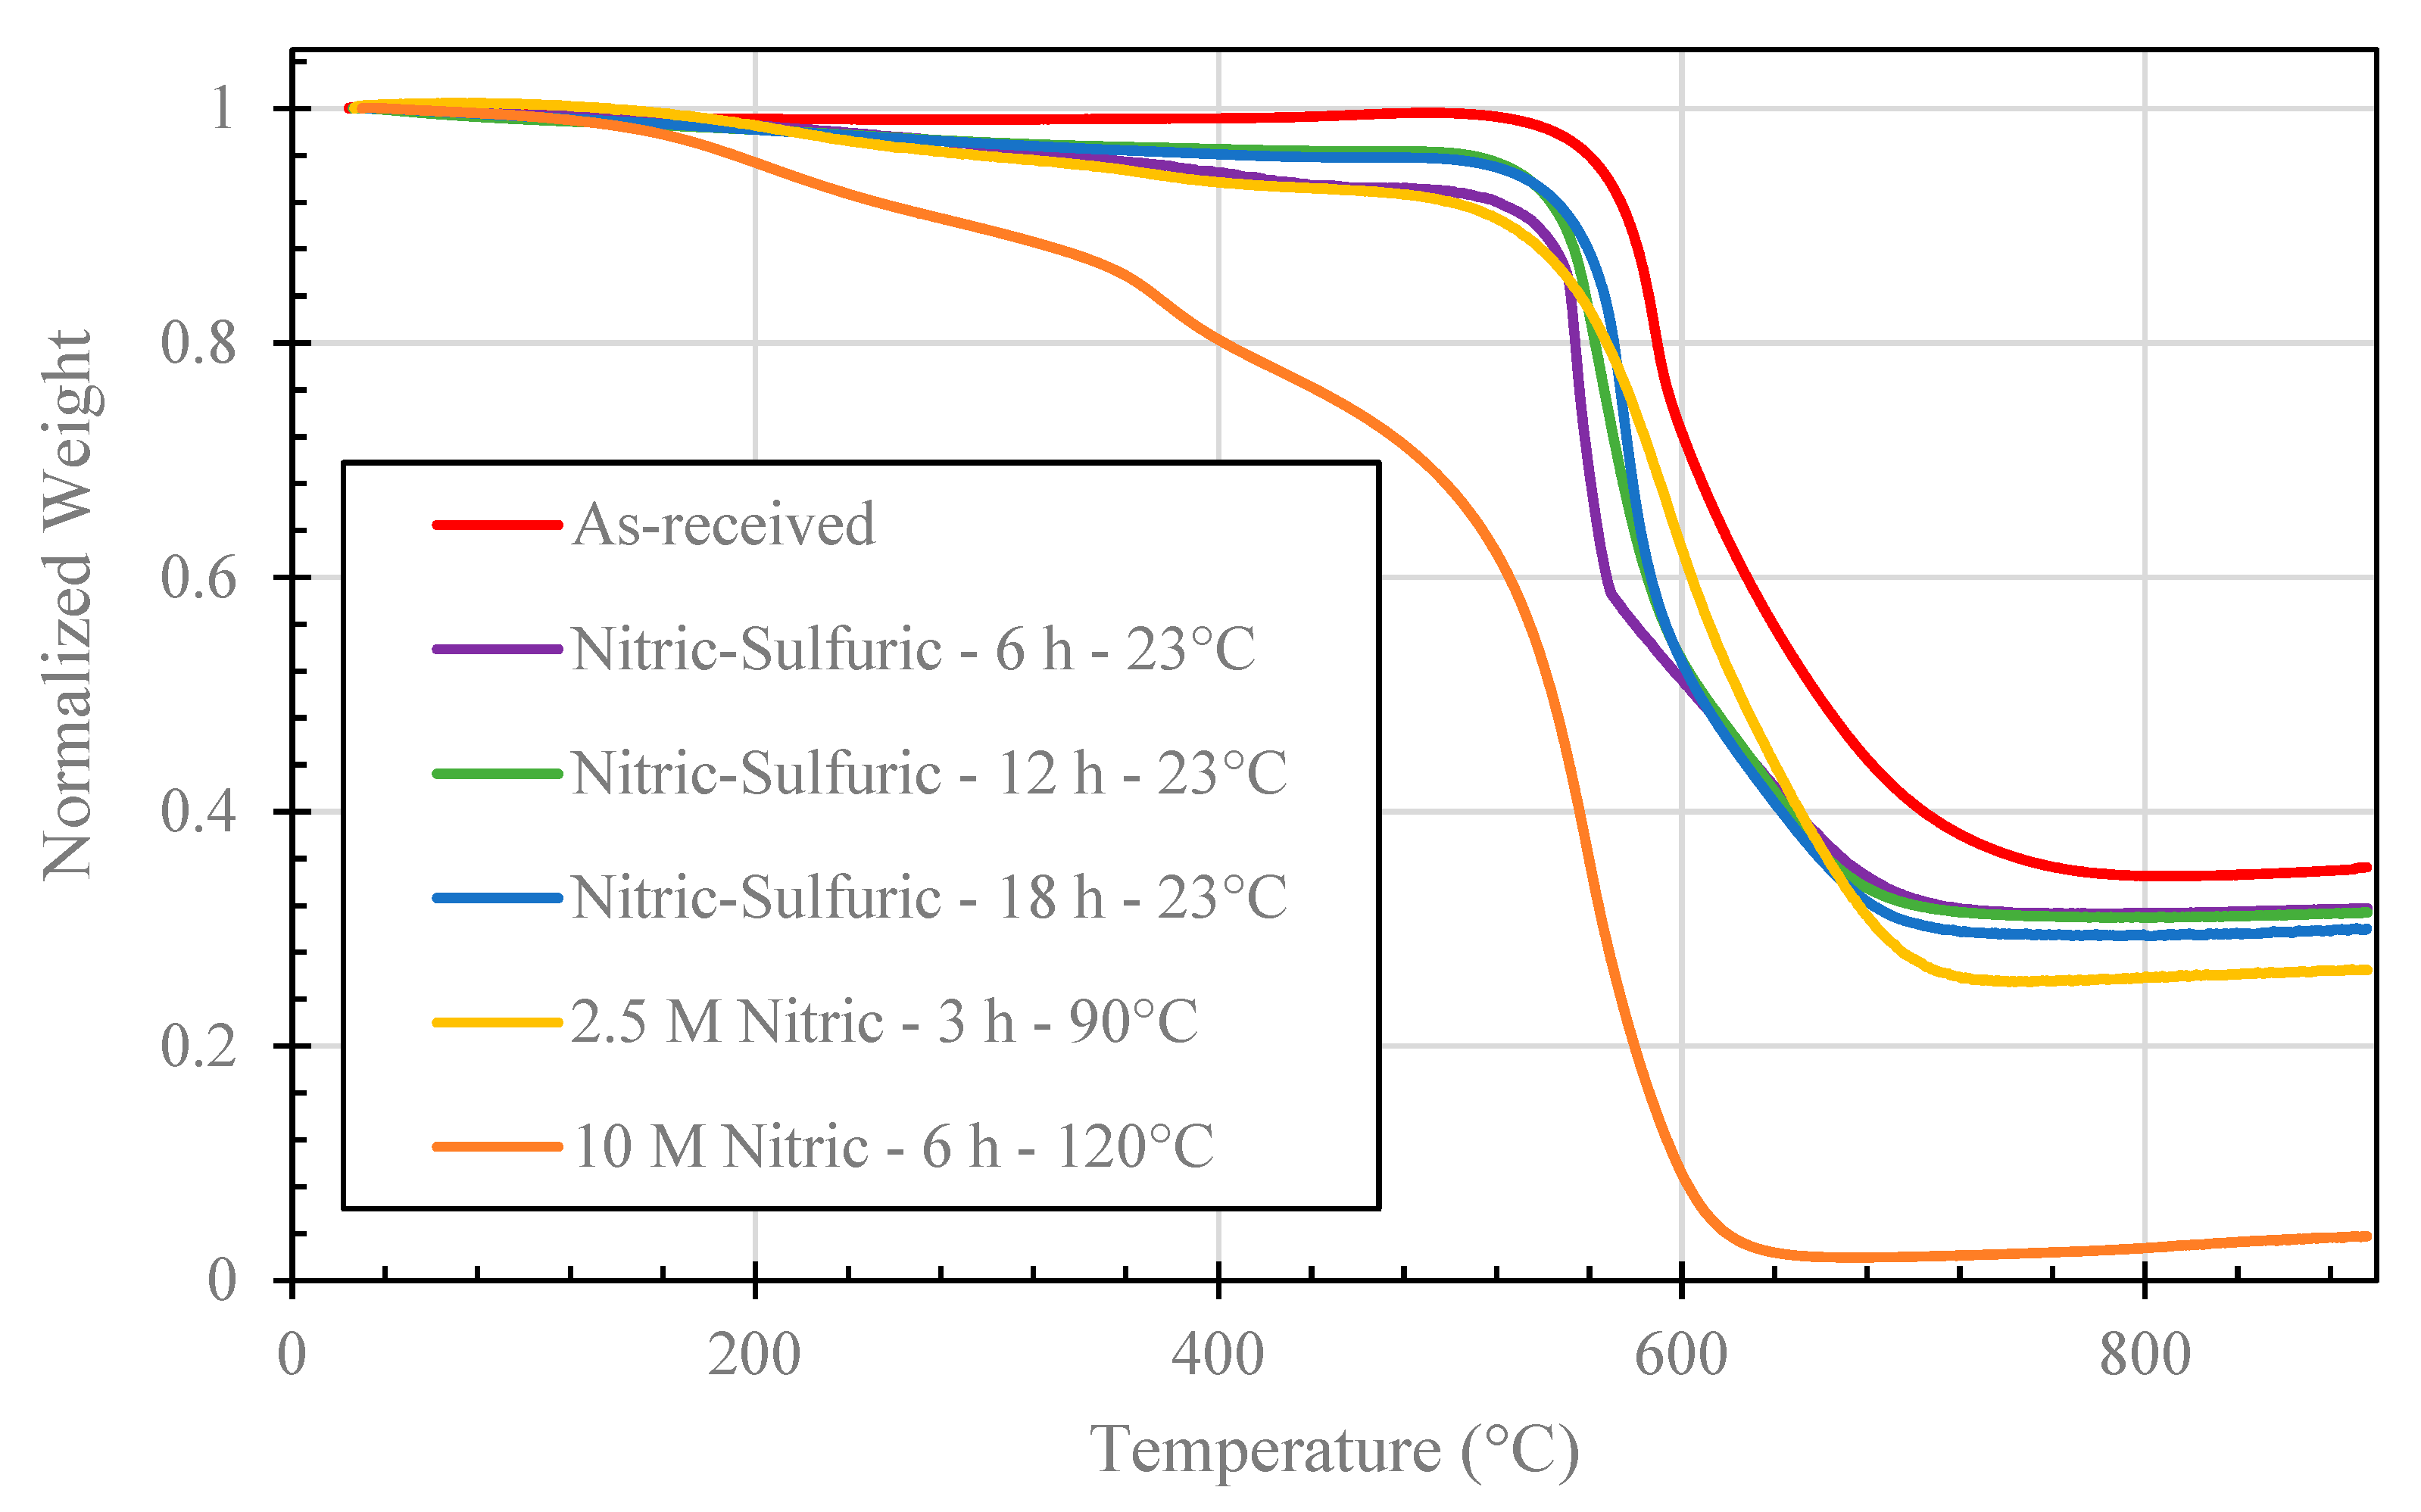
3.5. TGA Results
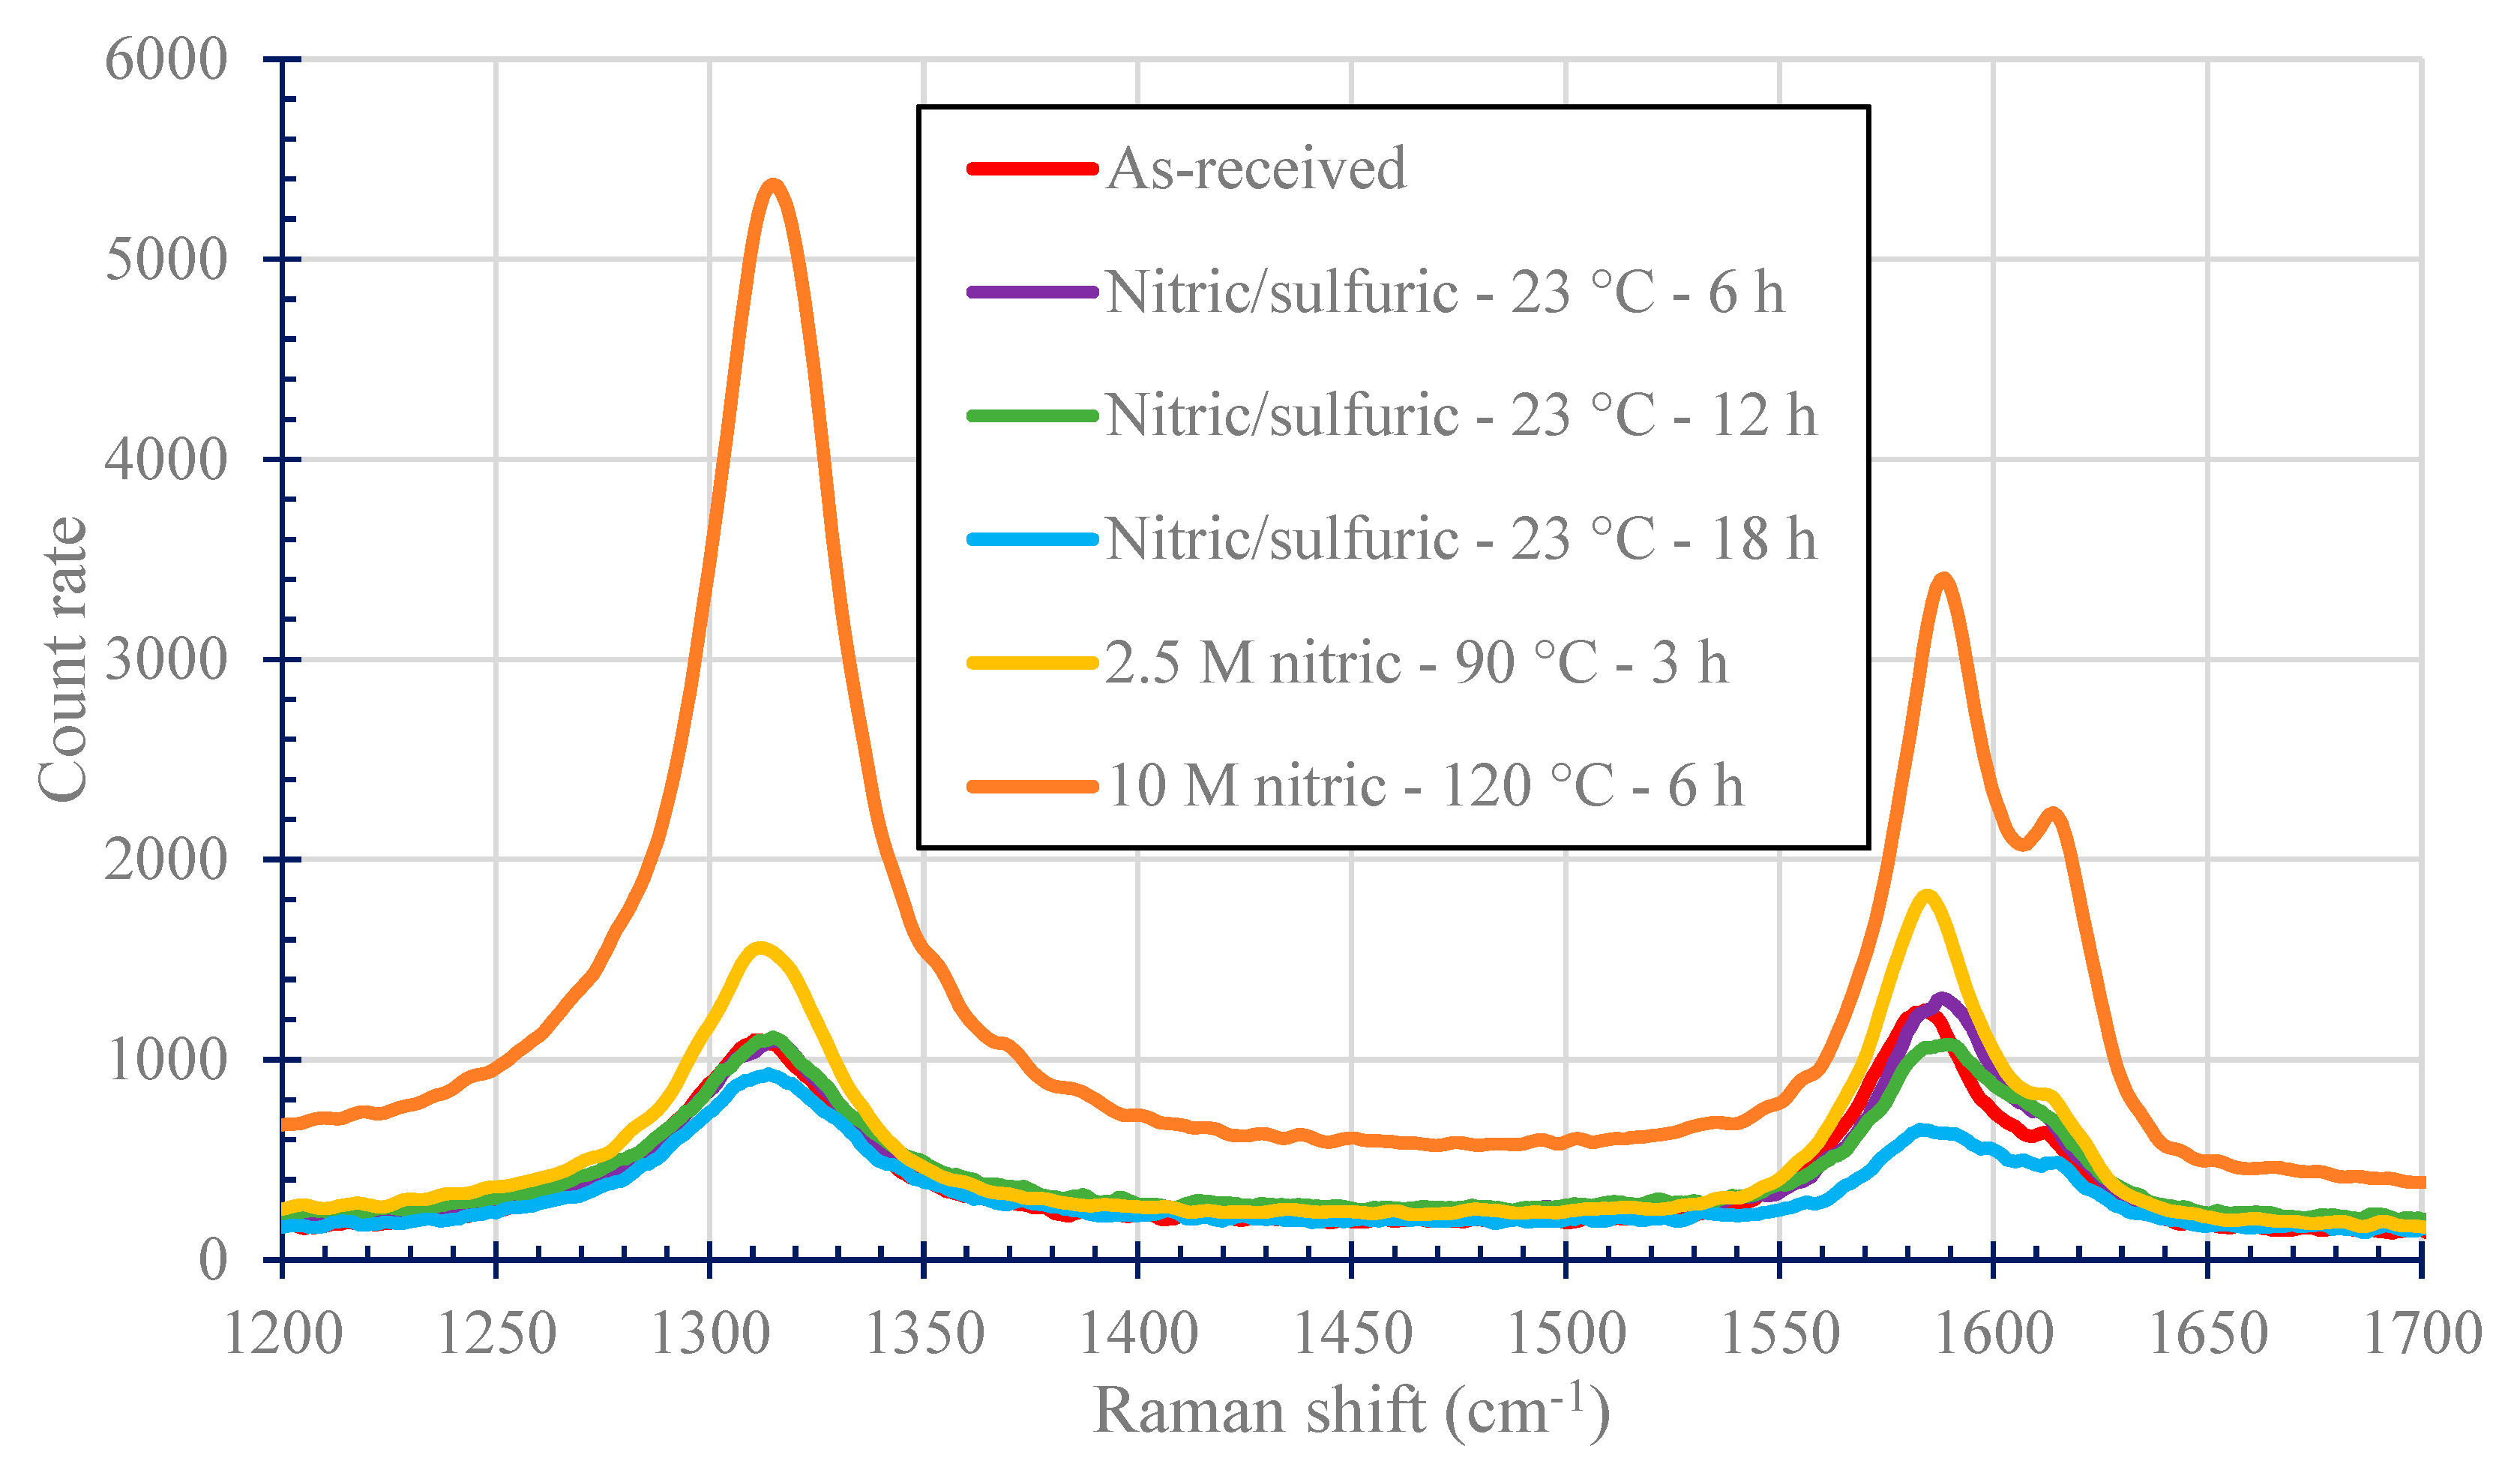
3.6. Raman Spectroscopy Results
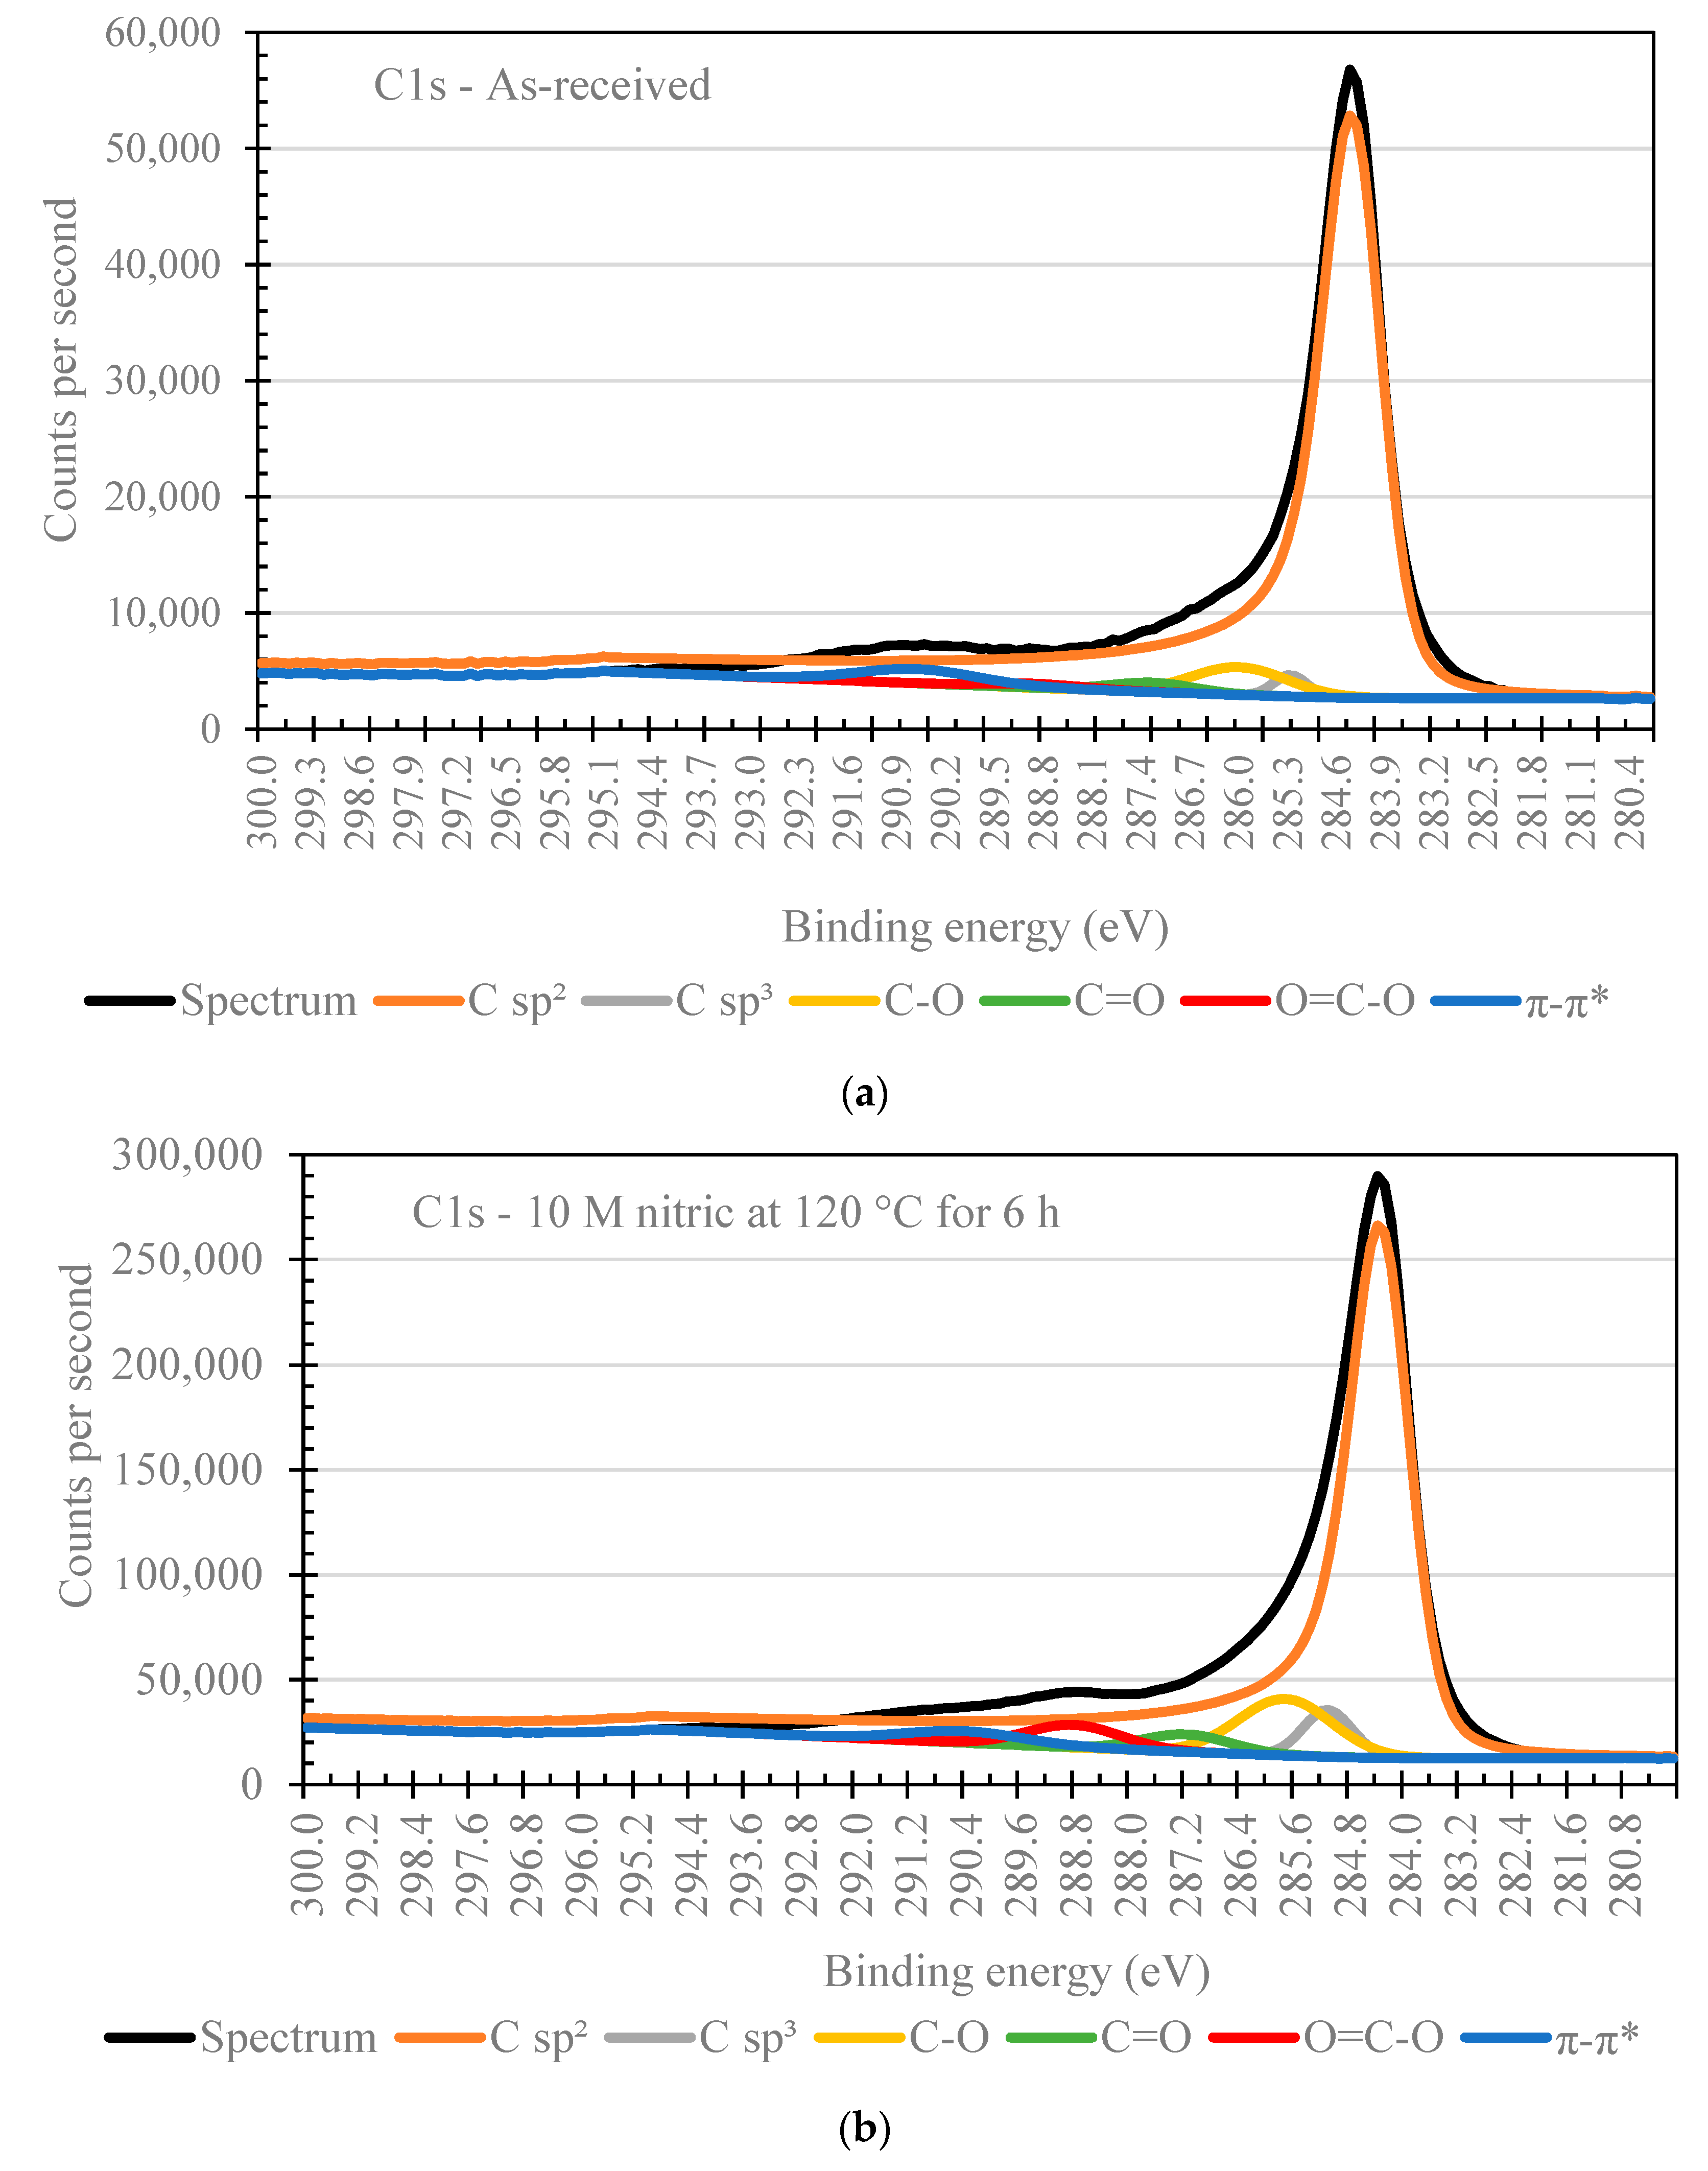
3.7. XPS Results
4. Conclusions
Author Contributions
Funding
Data Availability Statement
Acknowledgments
Conflicts of Interest
References
- Yu, M.-F. Fundamental Mechanical Properties of Carbon Nanotubes: Current Understanding and the Related Experimental Studies. J. Eng. Mater. Technol. 2004, 126, 271–278. [Google Scholar] [CrossRef]
- Ruoff, R.S.; Qian, D.; Liu, W.K. Mechanical properties of carbon nanotubes: Theoretical predictions and experimental measurements. Comptes rendus. Physique 2003, 4, 993–1008. [Google Scholar] [CrossRef]
- Ferreira, F.V.; Cividanes, L.D.S.; Brito, F.S.; Menezes, B.R.C.D.; Franceschi, W.; Simonetti, E.A.N.; Thim, G.P. Functionalizing Graphene and Carbon Nanotubes: A Review. In Springer Briefs in Applied Sciences and Technology; Springer: Cham, Switzerland, 2016. [Google Scholar]
- Randjbaran, E.; Zahari, R.; Majid, D.L.; Sultan, M.T.; Mazlan, N. Reasons of adding carbon nanotubes into composite systems-review paper. Mech. Mech. Eng. 2017, 21, 549–568. [Google Scholar]
- Du, J.H.; Bai, J.; Cheng, H.M. The present status and key problems of carbon nanotube based polymer composites. Express Polym. Lett. 2007, 1, 253–273. [Google Scholar] [CrossRef]
- Gojny, F.H.; Wichmann, M.H.G.; Fiedler, B.; Schulte, K. Influence of different carbon nanotubes on the mechanical properties of epoxy matrix composites—A comparative study. Compos. Sci. Technol. 2005, 65, 2300–2313. [Google Scholar] [CrossRef]
- Yu, M.-F. Fundamental Aspects of Nano-Reinforced Composites. Compos. Sci. Technol. 2006, 66, 3115–3125. [Google Scholar]
- Arash, B.; Wang, Q.; Varadan, V.K. Mechanical properties of carbon nanotube/polymer composites. Sci. Rep. 2014, 4, 6479. [Google Scholar] [CrossRef]
- Peng, H.; Alemany, L.B.; Margrave, J.L.; Khabashesku, V.N. Sidewall Carboxylic Acid Functionalization of Single-Walled Carbon Nanotubes. J. Am. Chem. Soc. 2003, 125, 15174–15182. [Google Scholar] [CrossRef]
- Sezer, N.; Koç, M. Oxidative acid treatment of carbon nanotubes. Surf. Interfaces 2019, 14, 1–8. [Google Scholar] [CrossRef]
- Wang, S.; Liang, Z.; Liu, T.; Wang, B.; Zhang, C. Effective amino-functionalization of carbon nanotubes for reinforcing epoxy polymer composites. Nanotechnology 2006, 17, 1551–1557. [Google Scholar] [CrossRef]
- Khabashesku, V.N. Covalent functionalization of carbon nanotubes: Synthesis, properties and applications of fluorinated derivatives. Russ. Chem. Rev. 2011, 80, 705–725. [Google Scholar] [CrossRef]
- Turgunov, M.A.; Oh, J.O.; Yoon, S.H. Surface modification of multiwall carbon nanotubes by sulfuric acid and nitric acid. Materials 2014, 64, 22–25. [Google Scholar]
- Datsyuk, V.; Kalyva, M.; Papagelis, K.; Parthenios, J.; Tasis, D.; Siokou, A.; Kallitsis, I.; Galiotis, C. Chemical oxidation of multiwalled carbon nanotubes. Carbon 2008, 46, 833–840. [Google Scholar] [CrossRef]
- Pumera, M.; Šmíd, B.; Veltruská, K. Influence of nitric acid treatment of carbon nanotubes on their physico-chemical properties. J. Nanosci. Nanotechnol. 2009, 9, 2671–2676. [Google Scholar] [CrossRef]
- Radovic, L.R.; Mora-Vilches, C.V.; Salgado-Casanova, A.J.A.; Buljan, A. Graphene functionalization: Mechanism of carboxyl group formation. Carbon 2018, 130, 340–349. [Google Scholar] [CrossRef]
- Gerber, I.; Oubenali, M.; Bacsa, R.; Durand, J.; Gonçalves, A.; Pereira, M.F.R.; Jolibois, F.; Perrin, L.; Poteau, R.; Serp, P. Theoretical and Experimental Studies on the Carbon-Nanotube Surface Oxidation by Nitric Acid: Interplay between Functionalization and Vacancy Enlargement. Chem. A Eur. J. 2011, 17, 11467–11477. [Google Scholar] [CrossRef] [PubMed]
- Zhang, J.; Zou, H.; Qing, Q.; Yang, Y.; Li, Q.; Liu, Z.; Guo, X.; Du, Z. Effect of Chemical Oxidation on the Structure of Single-Walled Carbon Nanotubes. J. Phys. Chem. B 2003, 107, 3712–3718. [Google Scholar] [CrossRef]
- Solvay. CYCOM® 977-3 Product Literature; Five Garret Mountain Plaza: Woodland Park, NJ, USA, 2015; p. 07424. [Google Scholar]
- Huntsman-Merrimack. MIRALON® Product Literature. 57 Daniel Webster Hwy #65; Huntsman-Merrimack: Merrimack, NH, USA, 2016; p. 03054. [Google Scholar]
- ASTM Standard D790. Standard Test Method for Flexural Properties of Unreinforced and Reinforced Plastics and Electrical Insulating Materials; American Society for Testing and Materials: Philadelphia, PA, USA, 2003.
- ASTM D7028 Standard Test Method for Glass Transition Temperature of Polymer Matrix Composites by Dynamic Mechanical Analysis; American Society for Testing and Materials: Philadelphia, PA, USA, 2007.
- ASTM E2550 Standard Test Method for Thermal Stability by Thermogravimetry; American Society for Testing and Materials: Philadelphia, PA, USA, 2011.
- Jeong Tai, K.; Kim, H.-C.; Kim, S.-K.; Kathi, J.; Rhee, K.-Y. 3-Aminopropyltriethoxysilane Effect on Thermal and Mechanical Properties of Multi-walled Carbon Nanotubes Reinforced Epoxy Composites. J. Compos. Mater. 2009, 43, 2533–2541. [Google Scholar] [CrossRef]
- Garg, P.; Singh, B.P.; Kumar, G.; Gupta, T.; Pandey, I.; Seth, R.K.; Tandon, R.P.; Mathur, R.B. Effect of dispersion conditions on the mechanical properties of multi-walled carbon nanotubes based epoxy resin composites. J. Polym. Res. 2010, 18, 1397–1407. [Google Scholar] [CrossRef]
- Seyler, R.J. (Ed.) Assignment of the Glass Transition; American Society for Testing & Materials: West Conshohocken, PA, USA, 1994. [Google Scholar]
- Koo, J.H. Polymer Nanocomposites: Processing, Characterization, and Applications; McGraw-Hill Education: New York, NY, USA, 2010. [Google Scholar]
- Kumar, S.; Kumar, M. Enhanced property analysis of MWCNT epoxy composite. Mater. Today Proc. 2018, 5, 27965–27973. [Google Scholar] [CrossRef]
- Valentini, L.; Puglia, D.; Carniato, F.; Boccaleri, E.; Marchese, L.; Kenny, J.M. Use of plasma fluorinated single-walled carbon nanotubes for the preparation of nanocomposites with epoxy matrix. Compos. Sci. Technol. 2008, 68, 1008–1014. [Google Scholar] [CrossRef] [Green Version]
- Fronczak, M.; Łabędź, O.; Kaszuwara, W.; Bystrzejewski, M. Corrosion resistance studies of carbon-encapsulated iron nanoparticles. J. Mater. Sci. 2018, 53, 3805–3816. [Google Scholar] [CrossRef] [Green Version]
- Edwards, E.R.; Antunes, E.F.; Botelho, E.C.; Baldan, M.R.; Corat, E.J. Evaluation of residual iron in carbon nanotubes purified by acid treatments. Appl. Surf. Sci. 2011, 258, 641–648. [Google Scholar] [CrossRef] [Green Version]
- Hoa, L.T.M. Characterization of multi-walled carbon nanotubes functionalized by a mixture of HNO3/H2SO4. Diam. Relat. Mater. 2018, 89, 43–51. [Google Scholar]
- Malard, L.M.; Pimenta, M.A.; Dresselhaus, G.; Dresselhaus, M.S. Raman spectroscopy in graphene. Phys. Rep. 2009, 473, 51–87. [Google Scholar] [CrossRef]
- Liu, H.; Wang, J.; Wang, J.; Cui, S. Sulfonitric Treatment of Multiwalled Carbon Nanotubes and Their Dispersibility in Water. Materials 2018, 11, 2442. [Google Scholar] [CrossRef] [PubMed] [Green Version]
- Kadhim, N.; Mei, Y.; Wang, Y.; Li, Y.; Meng, F.; Jiang, M.; Zhou, Z. Remarkable Improvement in the Mechanical Properties of Epoxy Composites Achieved by a Small Amount of Modified Helical Carbon Nanotubes. Polymers 2018, 10, 1103. [Google Scholar] [CrossRef] [Green Version]
- Wepasnick, K.A.; Smith, B.A.; Bitter, J.L.; Fairbrother, D.H. Chemical and structural characterization of carbon nanotube surfaces. Anal. Bioanal. Chem. 2010, 396, 1003–1014. [Google Scholar] [CrossRef] [PubMed]


| As-Received MIRALON® CNTs wt% | Flexural Modulus (GPa) | Flexural Strength (MPa) | Strain (%) | n |
|---|---|---|---|---|
| 0 (Vendor) | 3.80 ± 0.07 | 144 ± 30 | - | - |
| 0 | 3.88 ± 0.16 | 136.9 ± 5.0 | 4.11 ± 0.24 | 7 |
| 0.4 | 3.85 ± 0.09 | 147.5 ± 4.0 | 4.27 ± 0.22 | 8 |
| 0.8 | 3.93 ± 0.08 | 142.9 ± 9.3 | 4.49 ± 0.46 | 7 |
| 1.5 | 3.93 ± 0.11 | 140.0 ± 4.7 | 4.31 ± 0.26 | 7 |
| 2.0 | 4.24 ± 0.08 | 141.2 ± 6.4 | 4.01 ± 0.24 | 7 |
| 3.0 1 | 4.54 ± 0.07 | 116.4 ± 10.9 | 2.90 ± 0.30 | 7 |
| MIRALON® CNTs wt% | Flexural Modulus (GPa) | Flexural Strength (MPa) | Strain (%) | n |
|---|---|---|---|---|
| 0 (Vendor) | 3.80 ± 0.07 | 144 ± 30 | - | - |
| 0 | 3.88 ± 0.16 | 136.9 ± 5.0 | 4.11 ± 0.24 | 7 |
| 0.4 as-received | 3.85 ± 0.09 | 147.5 ± 4.0 | 4.27 ± 0.22 | 8 |
| 0.4 acid treated (Nitric/Sulfuric—23 °C—6 h) | 3.79 ± 0.11 | 125.2 ± 6.6 | 3.54 ± 0.23 | 10 |
| 0.4 acid treated (Nitric/Sulfuric—23 °C—12 h) | 3.64 ± 0.05 | 124.6 ± 6.2 | 3.69 ± 0.27 | 9 |
| 0.4 acid treated (Nitric/Sulfuric—23 °C—18 h) | 3.77 ± 0.07 | 115.1 ± 7.7 | 3.27 ± 0.23 | 9 |
| 0.4 acid treated (2.5 M Nitric—90 °C—3 h) | 3.71 ± 0.07 | 132.7 ± 10.7 | 3.91 ± 0.43 | 8 |
| 0.4 acid treated (2.5 M Nitric—120 °C—6 h) | 3.74 ± 0.06 | 130.2 ± 14.1 | 3.72 ± 0.56 | 7 |
| s-Received MIRALON® CNTs wt% | tanδ Tg (°C) | n |
|---|---|---|
| 0 | 249.55 ± 0.60 | 3 |
| 0.4 | 250.99 ± 0.33 | 3 |
| 0.8 | 249.42 ± 0.24 | 3 |
| 2.0 | 251.63 ± 0.32 | 3 |
| Sample | Iron Content (wt%) |
|---|---|
| As-received | 35.2 |
| Nitric-Sulfuric—6 h—23 °C | 31.7 |
| Nitric-Sulfuric—12 h—23 °C | 31.4 |
| Nitric-Sulfuric—18 h—23 °C | 30.0 |
| 2.5 M Nitric—3 h—90 °C | 26.5 |
| 10 M Nitric—6 h—120 °C | 3.8 |
| Sample | D Band (Intensity) | G Band (Intensity) | D/G Ratio |
|---|---|---|---|
| As-received | 1099.3 | 1247.2 | 0.88 |
| Nitric/Sulfuric 6 h at 23 °C | 1170.5 | 1319.7 | 0.89 |
| Nitric/Sulfuric 12 h at 23 °C | 1112.1 | 1077.3 | 1.03 |
| Nitric/Sulfuric 18 h at 23 °C | 1047.8 | 821.4 | 1.28 |
| 2.5 M Nitric 3 h at 90 °C | 1559.1 | 1823.9 | 0.85 |
| 10 M Nitric 6 h at 120 °C | 5375.4 | 3405.8 | 1.58 |
| Sample | Carbon (Atomic%) | Oxygen (Atomic%) | Iron (Atomic%) |
|---|---|---|---|
| As-received | 98.5 | 1.1 | 0.4 |
| 10 M Nitric 6 h at 120 °C | 91.6 | 8.4 | ~0 |
| Sample | C sp2 (%) | C sp3 (%) | C–O (%) | C=O (%) | O=C–O (%) | π-π* (%) |
|---|---|---|---|---|---|---|
| As-received | 92.5 | 0.9 | 3.2 | 0.9 | 0.4 | 2.0 |
| 10 M Nitric 6 h at 120 °C | 84.8 | 2.8 | 6.4 | 1.9 | 2.5 | 1.6 |
Publisher’s Note: MDPI stays neutral with regard to jurisdictional claims in published maps and institutional affiliations. |
© 2021 by the authors. Licensee MDPI, Basel, Switzerland. This article is an open access article distributed under the terms and conditions of the Creative Commons Attribution (CC BY) license (https://creativecommons.org/licenses/by/4.0/).
Share and Cite
Krieg, A.S.; King, J.A.; Odegard, G.M.; Leftwich, T.R.; Odegard, L.K.; Fraley, P.D.; Miskioglu, I.; Jolowsky, C.; Lundblad, M.; Park, J.G.; et al. Mechanical Properties and Characterization of Epoxy Composites Containing Highly Entangled As-Received and Acid Treated Carbon Nanotubes. Nanomaterials 2021, 11, 2445. https://doi.org/10.3390/nano11092445
Krieg AS, King JA, Odegard GM, Leftwich TR, Odegard LK, Fraley PD, Miskioglu I, Jolowsky C, Lundblad M, Park JG, et al. Mechanical Properties and Characterization of Epoxy Composites Containing Highly Entangled As-Received and Acid Treated Carbon Nanotubes. Nanomaterials. 2021; 11(9):2445. https://doi.org/10.3390/nano11092445
Chicago/Turabian StyleKrieg, Aaron S., Julia A. King, Gregory M. Odegard, Timothy R. Leftwich, Leif K. Odegard, Paul D. Fraley, Ibrahim Miskioglu, Claire Jolowsky, Matthew Lundblad, Jin Gyu Park, and et al. 2021. "Mechanical Properties and Characterization of Epoxy Composites Containing Highly Entangled As-Received and Acid Treated Carbon Nanotubes" Nanomaterials 11, no. 9: 2445. https://doi.org/10.3390/nano11092445