
Antioxidant Capacity Assessment of Plant Extracts for Green Synthesis of Nanoparticles

 ,
,
Abstract
: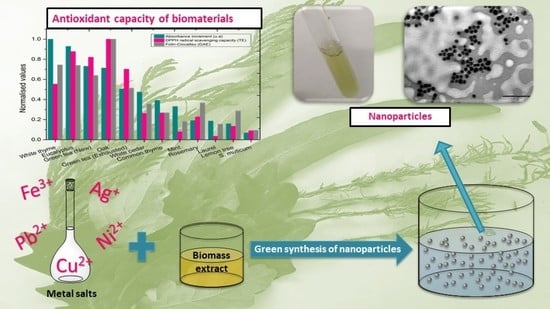
1. Introduction
2. Materials and Methods
2.1. Preparation of Plant Extracts
2.2. Total Antioxidant Capacity Determination
2.2.1. Folin–Ciocalteu Method
2.2.2. DPPH Radical Scavenging Capacity
2.2.3. Silver Nanoparticle Antioxidant Capacity (SNPAC) Method
2.3. Nanoparticle Characterization
2.4. Synthesis of Metal Nanoparticles
3. Results and Discussion
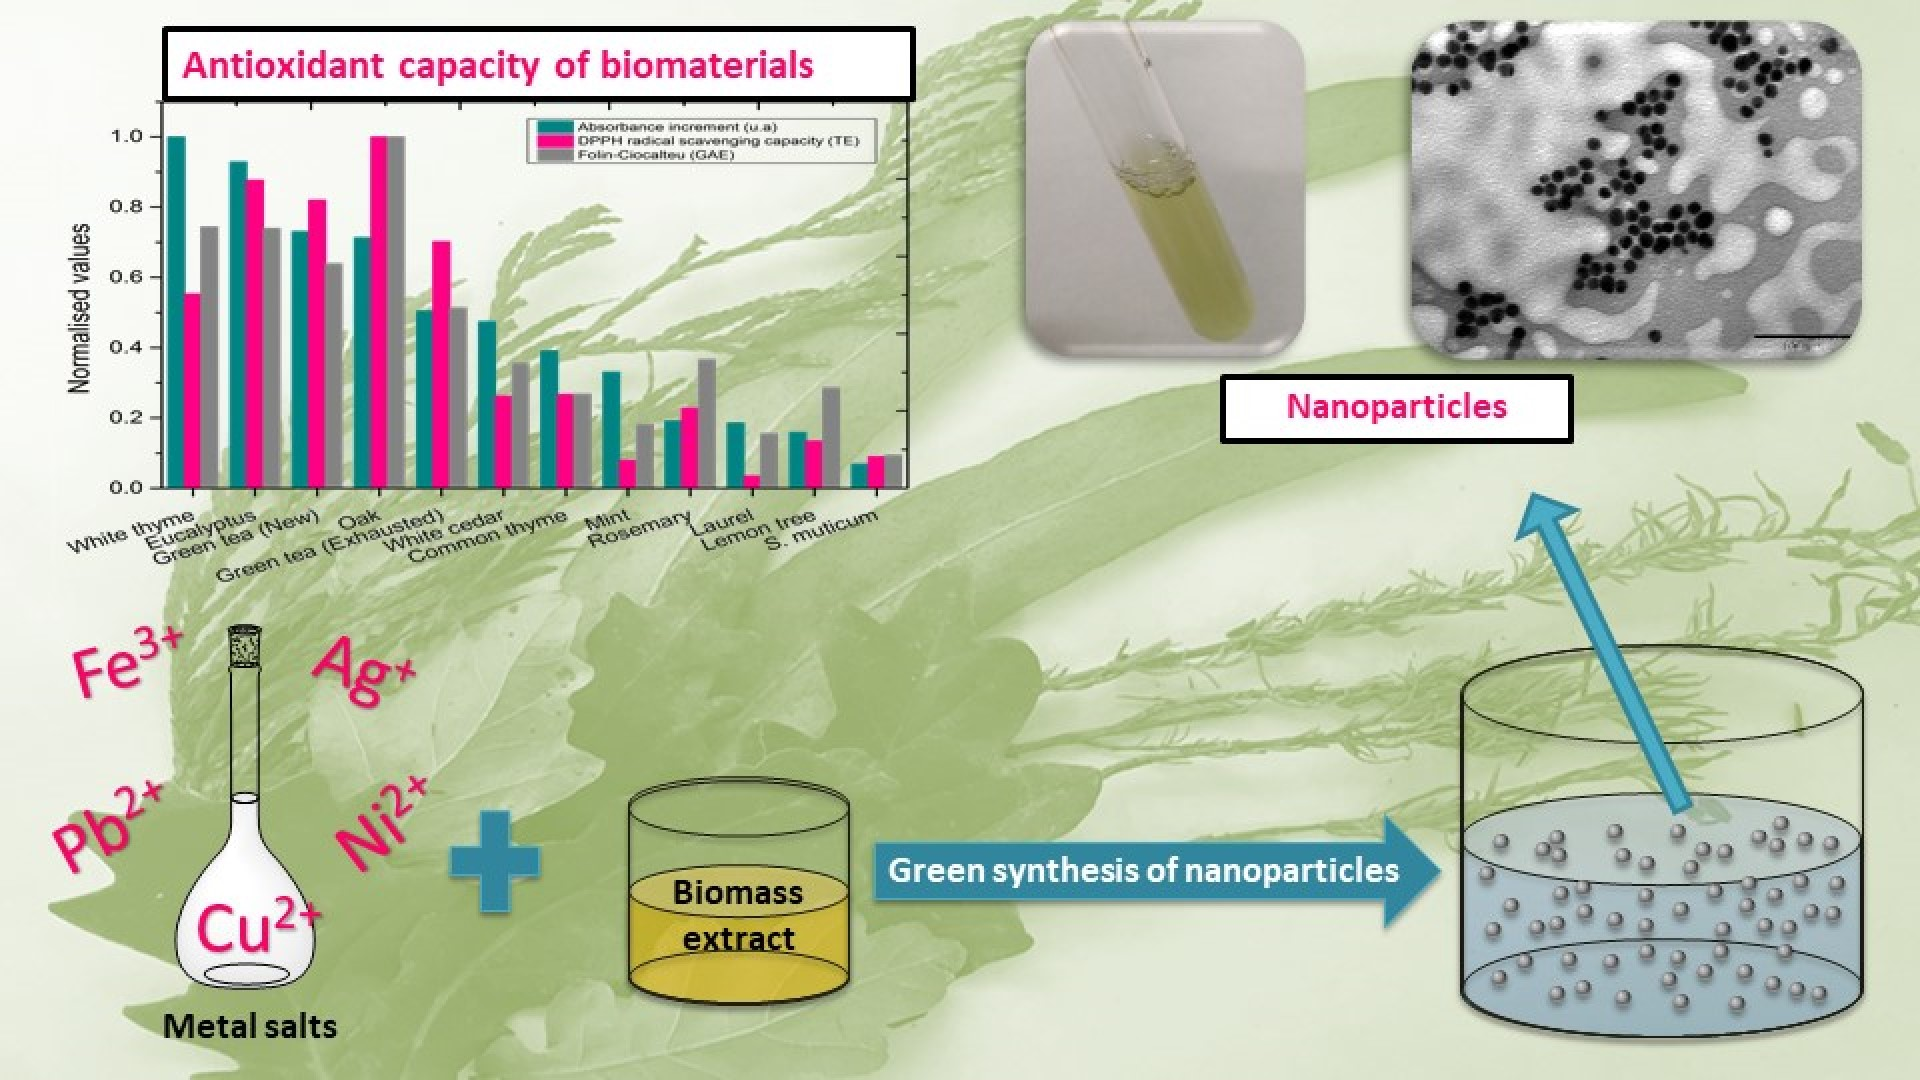
3.1. Determination of the Total Antioxidant Capacity of the Extracts
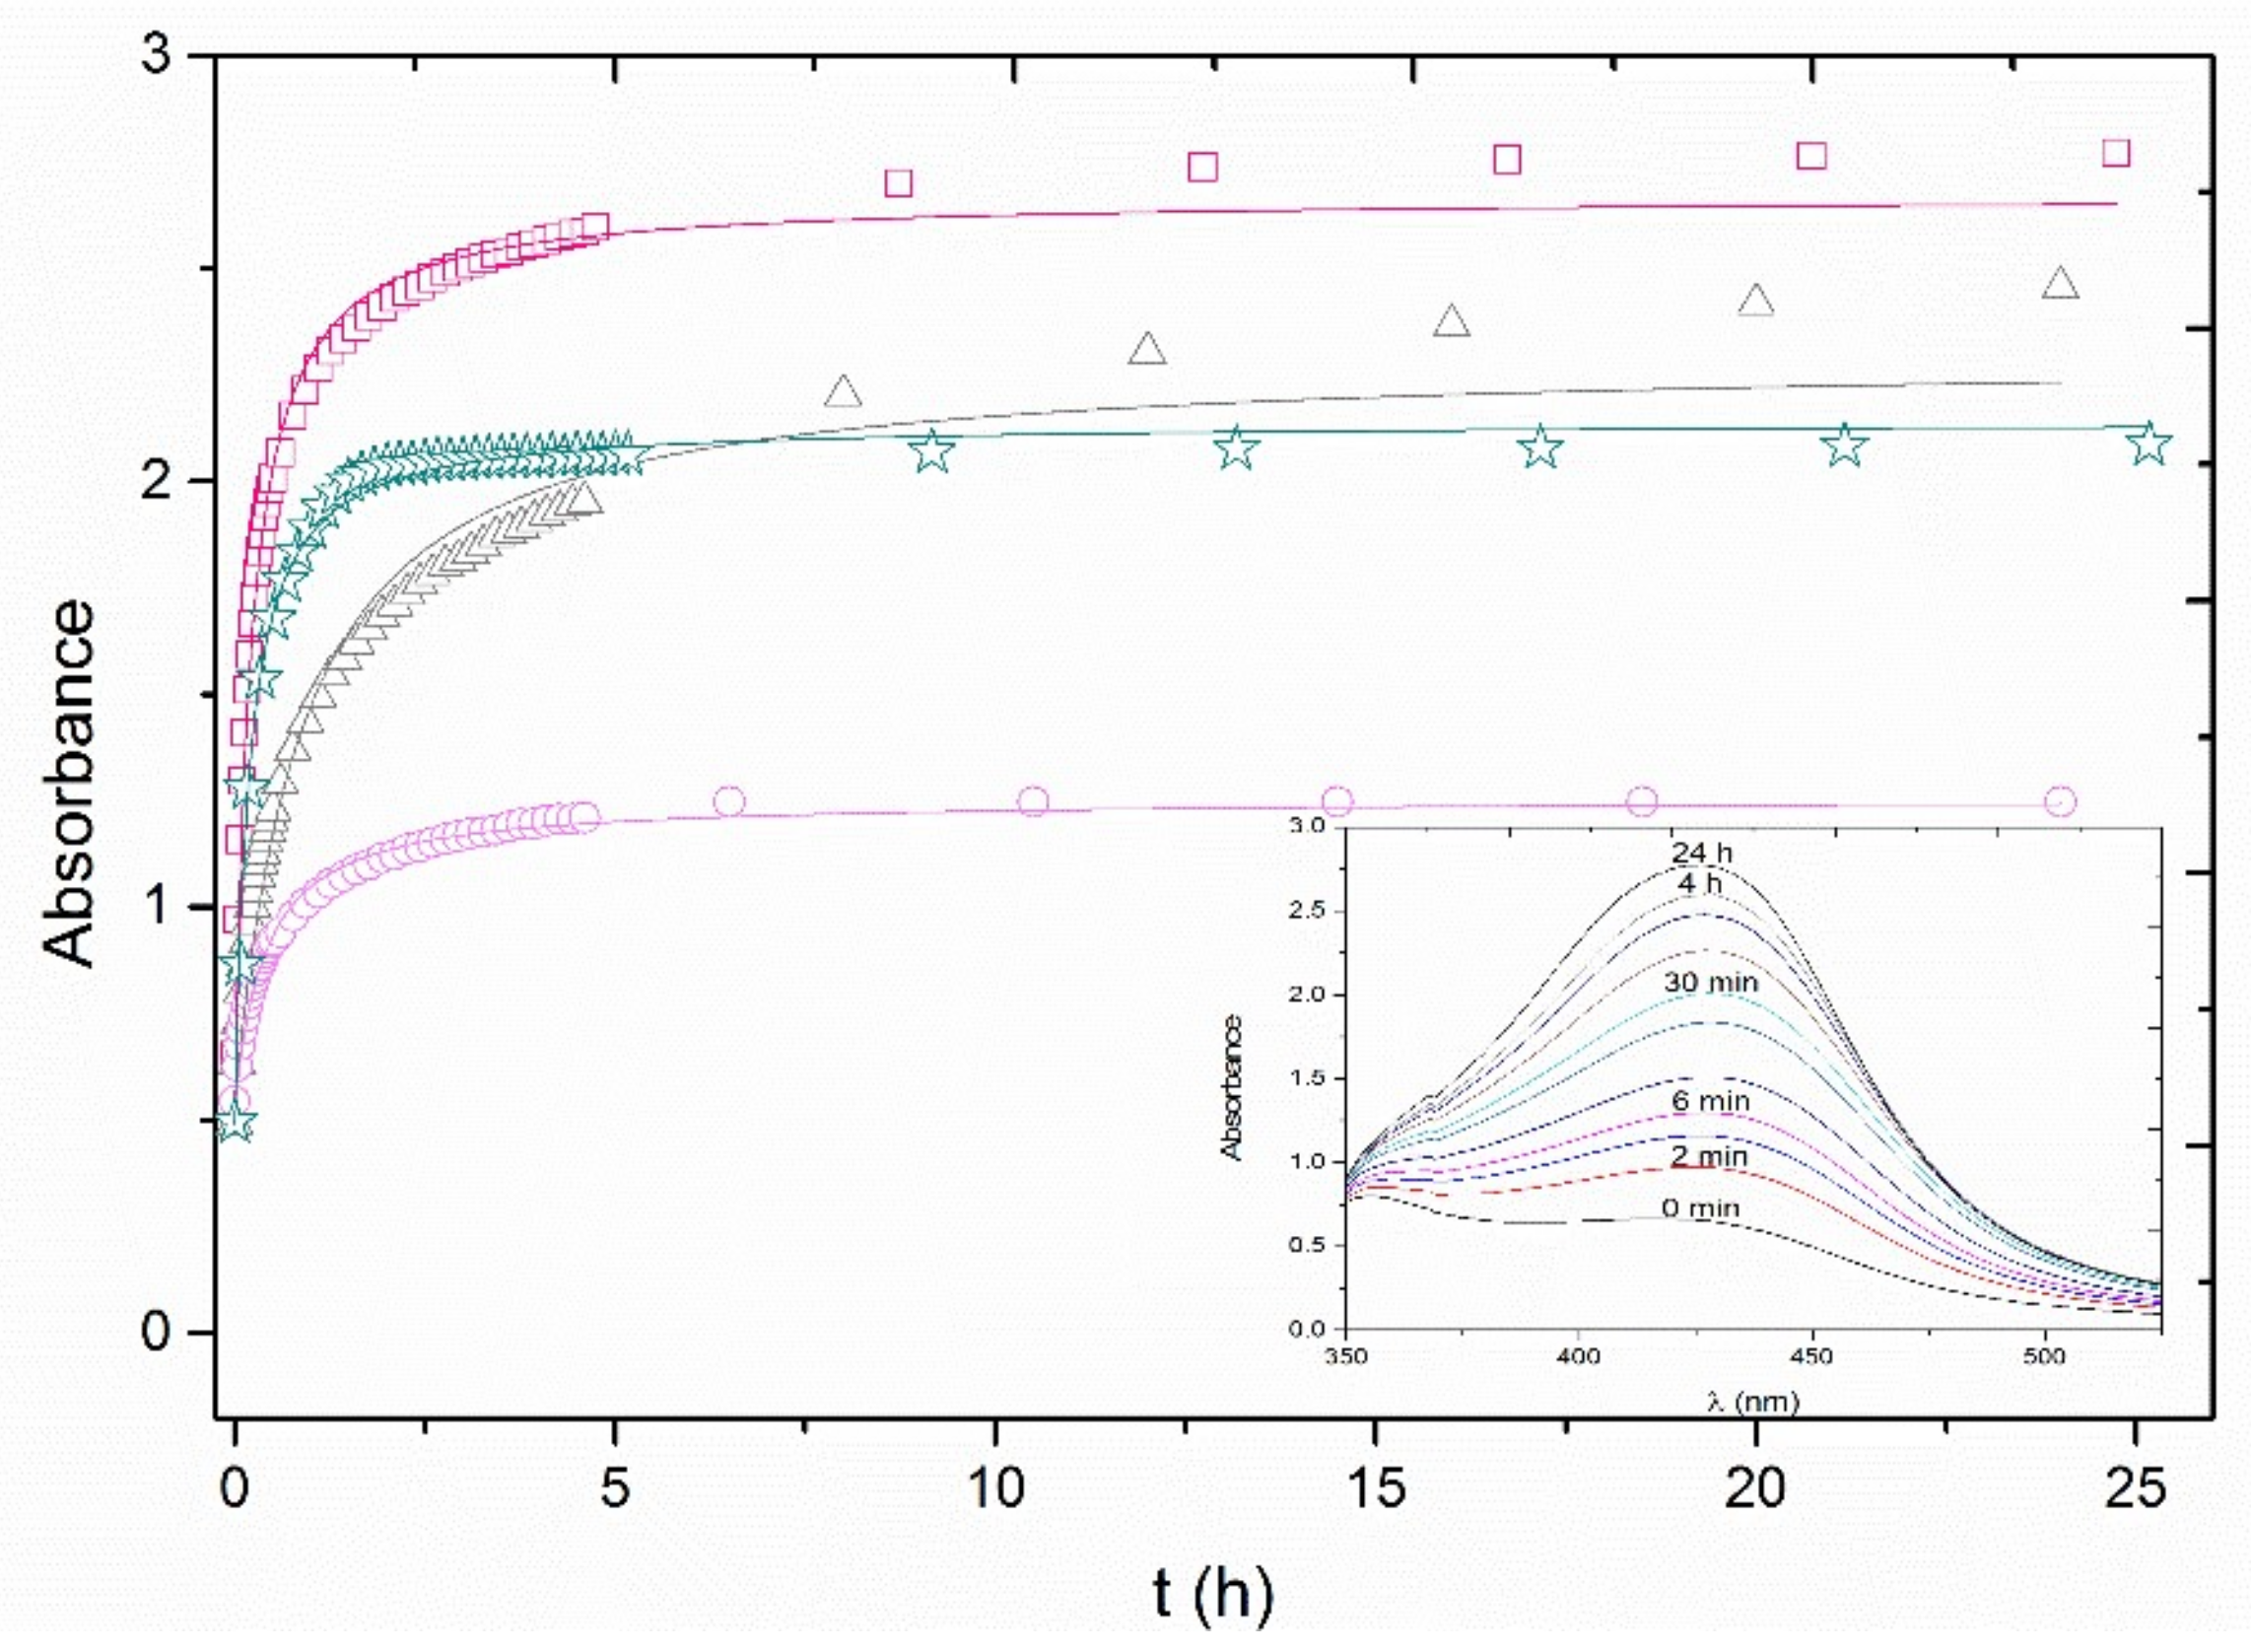
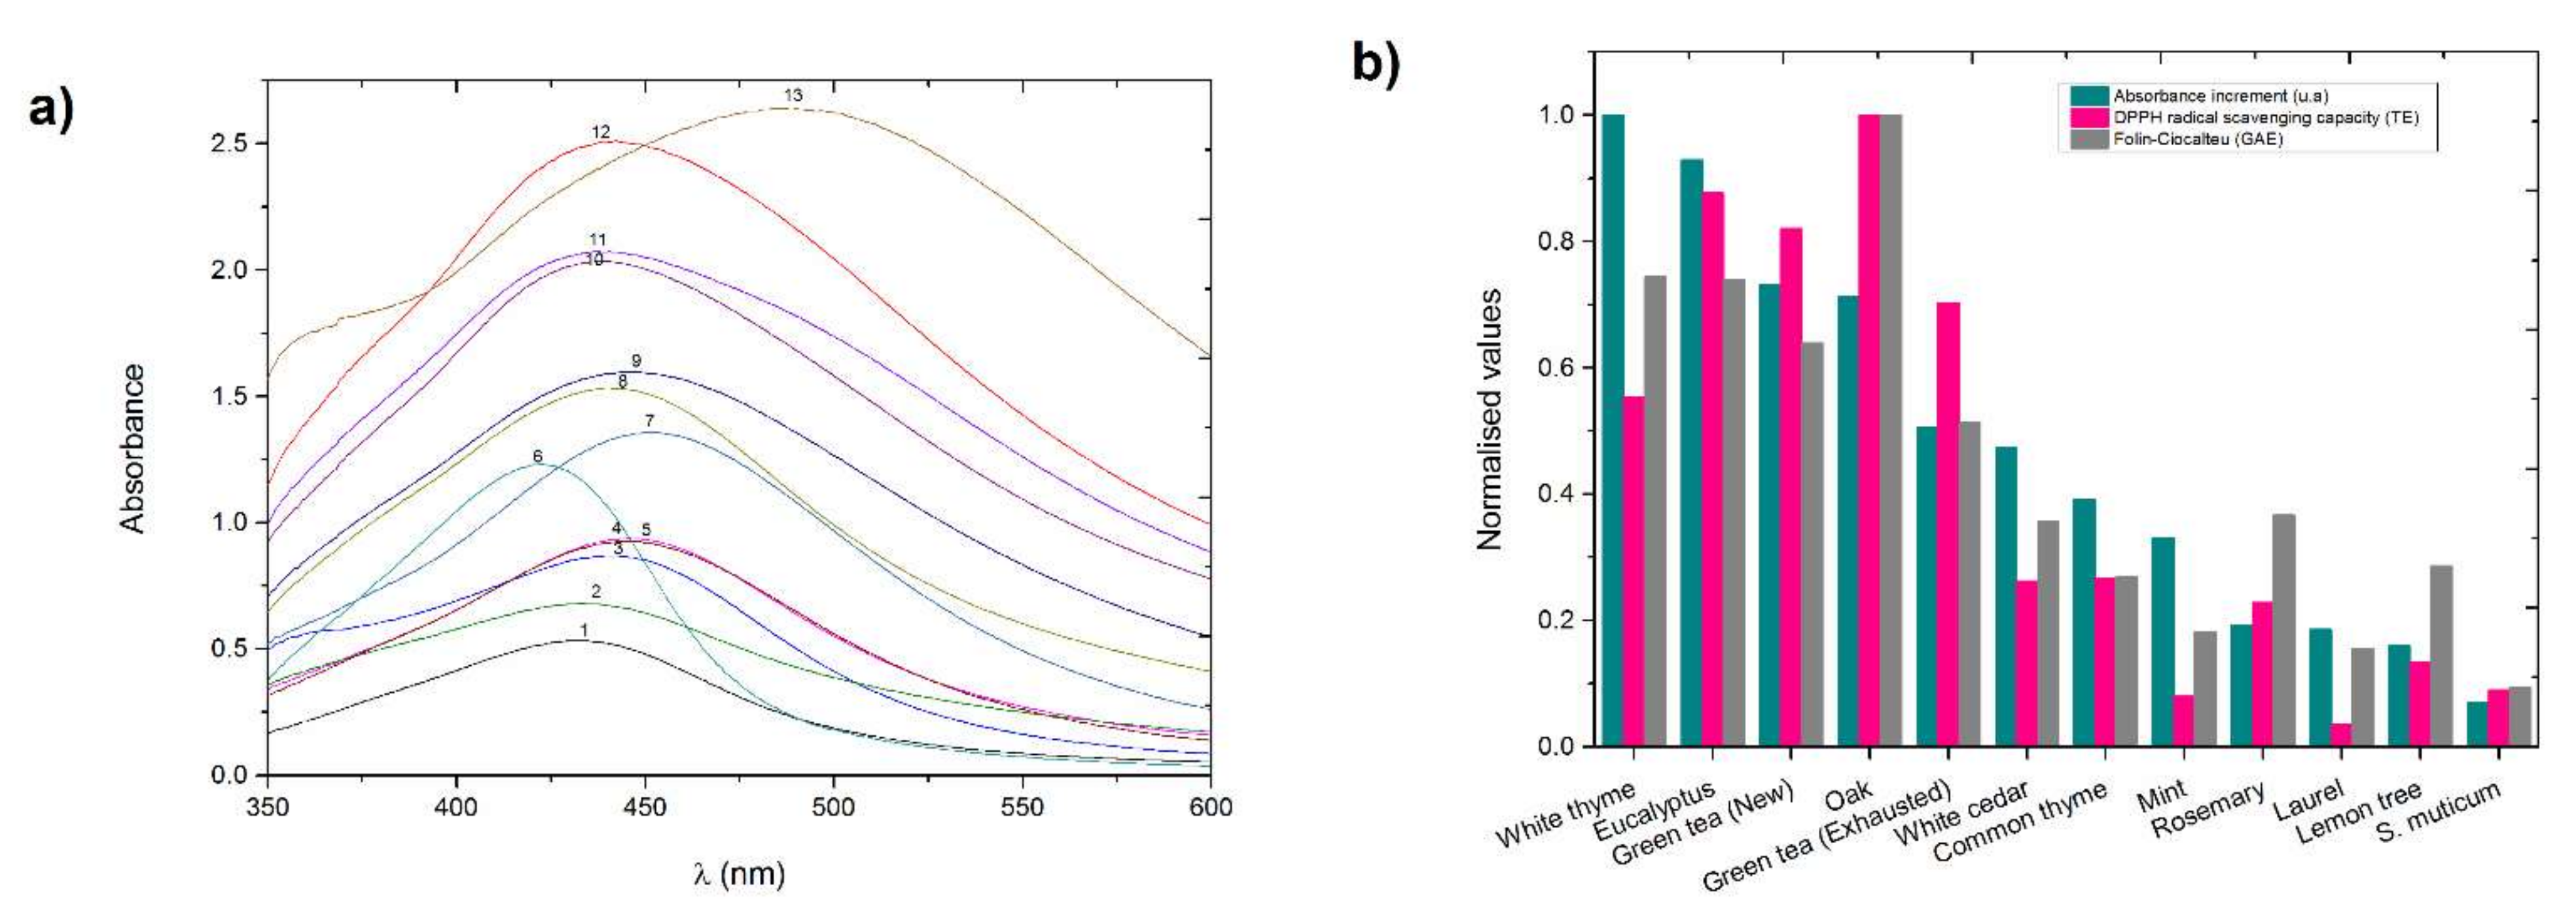
3.1.1. DPPH Radical Scavenging Capacity and Folin–Ciocalteu Methods
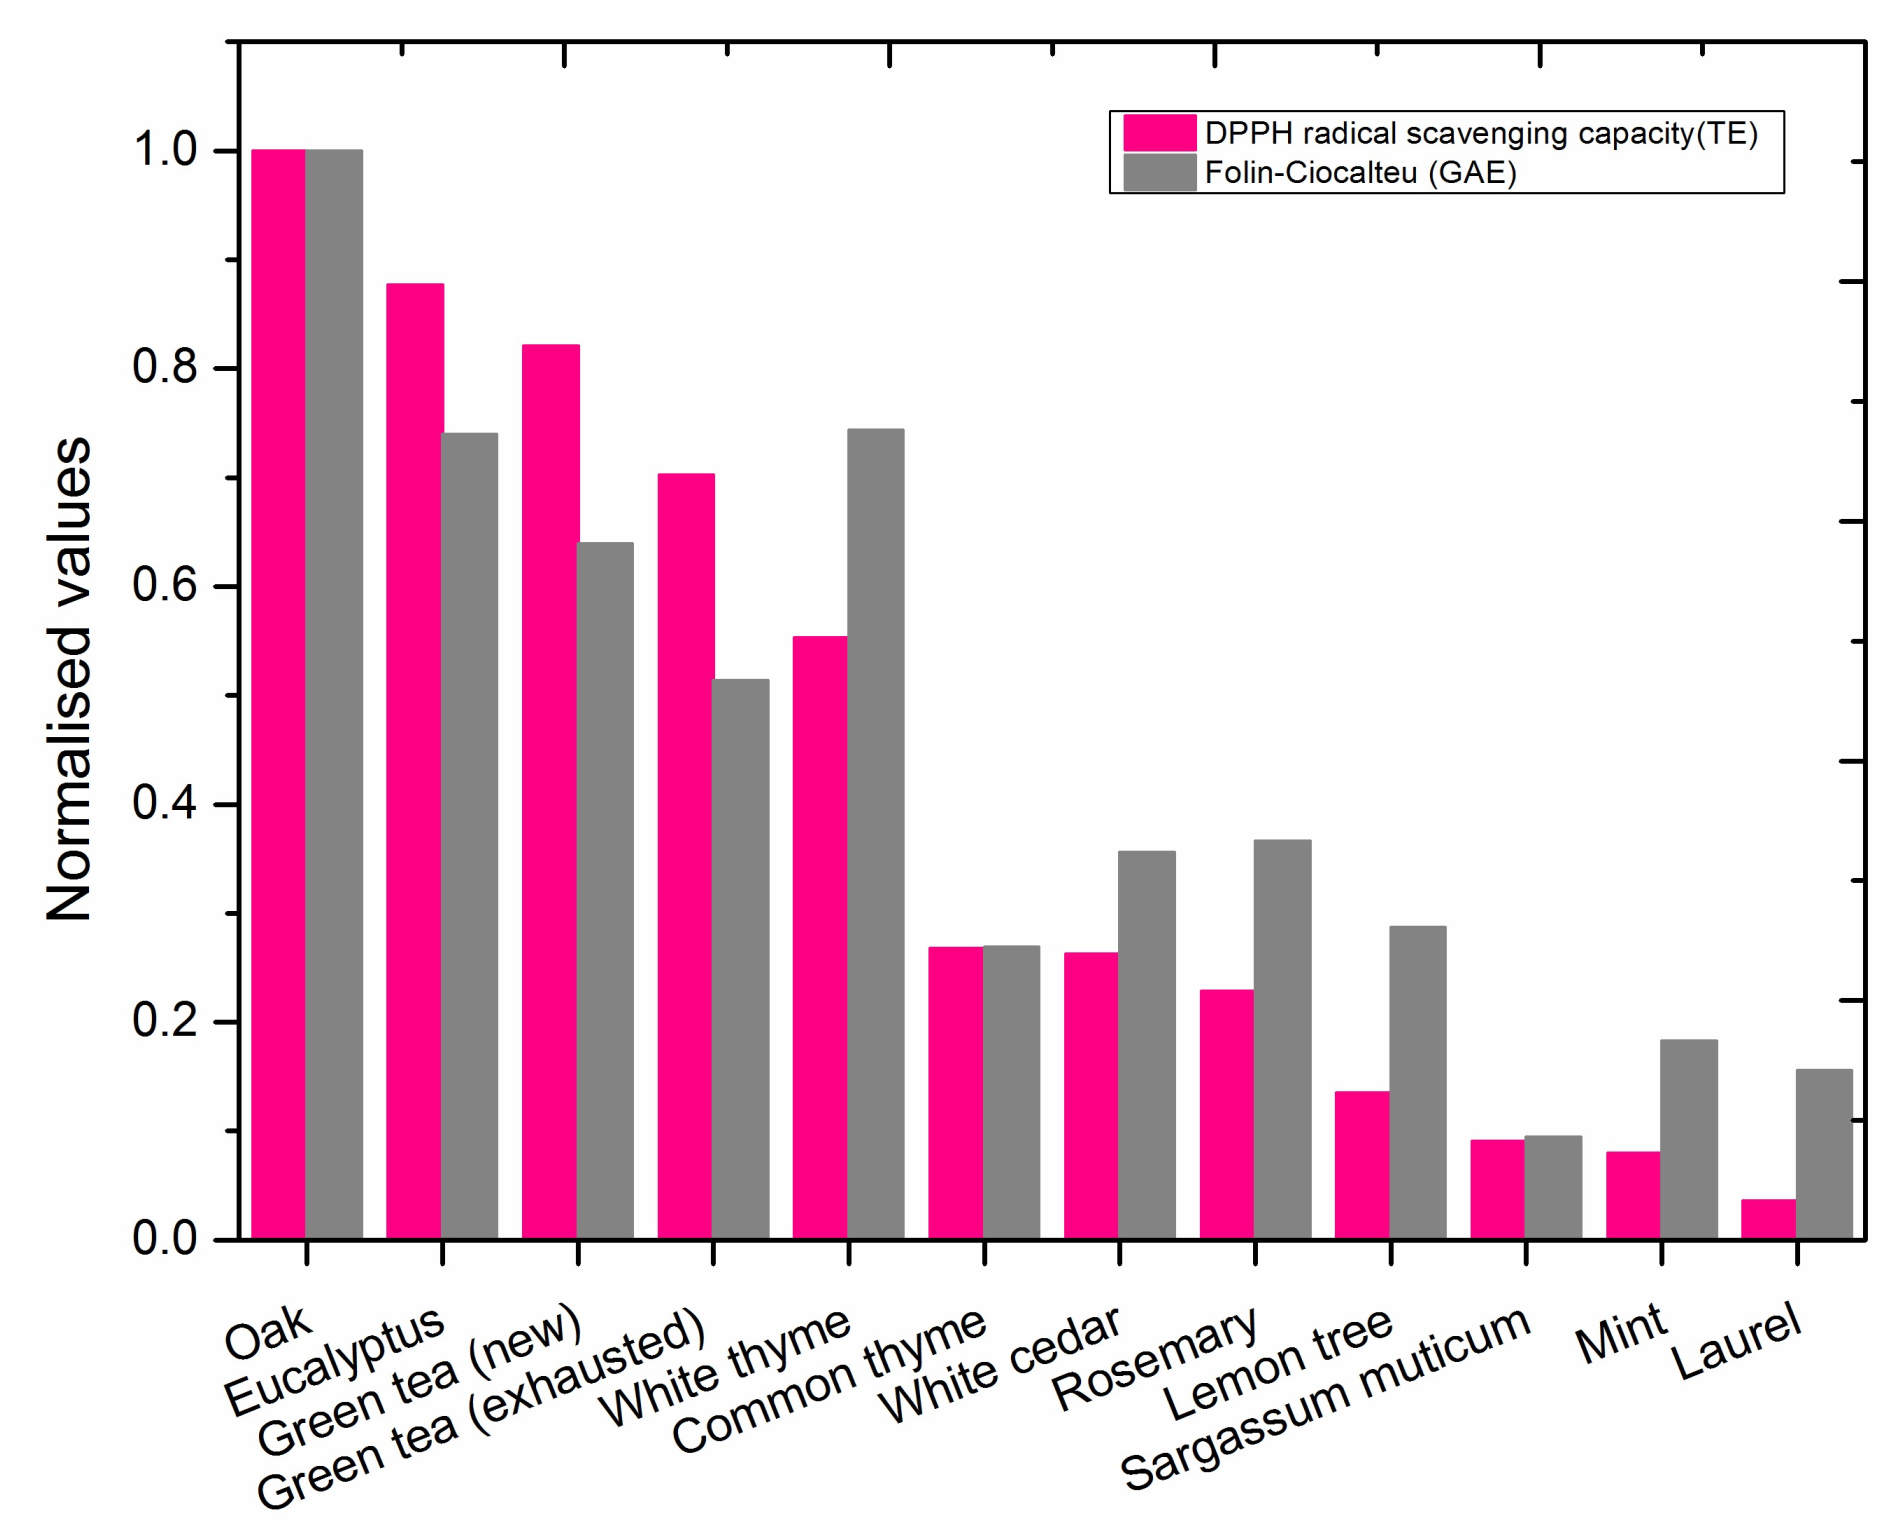
3.1.2. Antioxidant Capacity Determination by Synthesis of Silver Nanoparticles
- (a)
- Kinetics of nanoparticles growth
- (b)
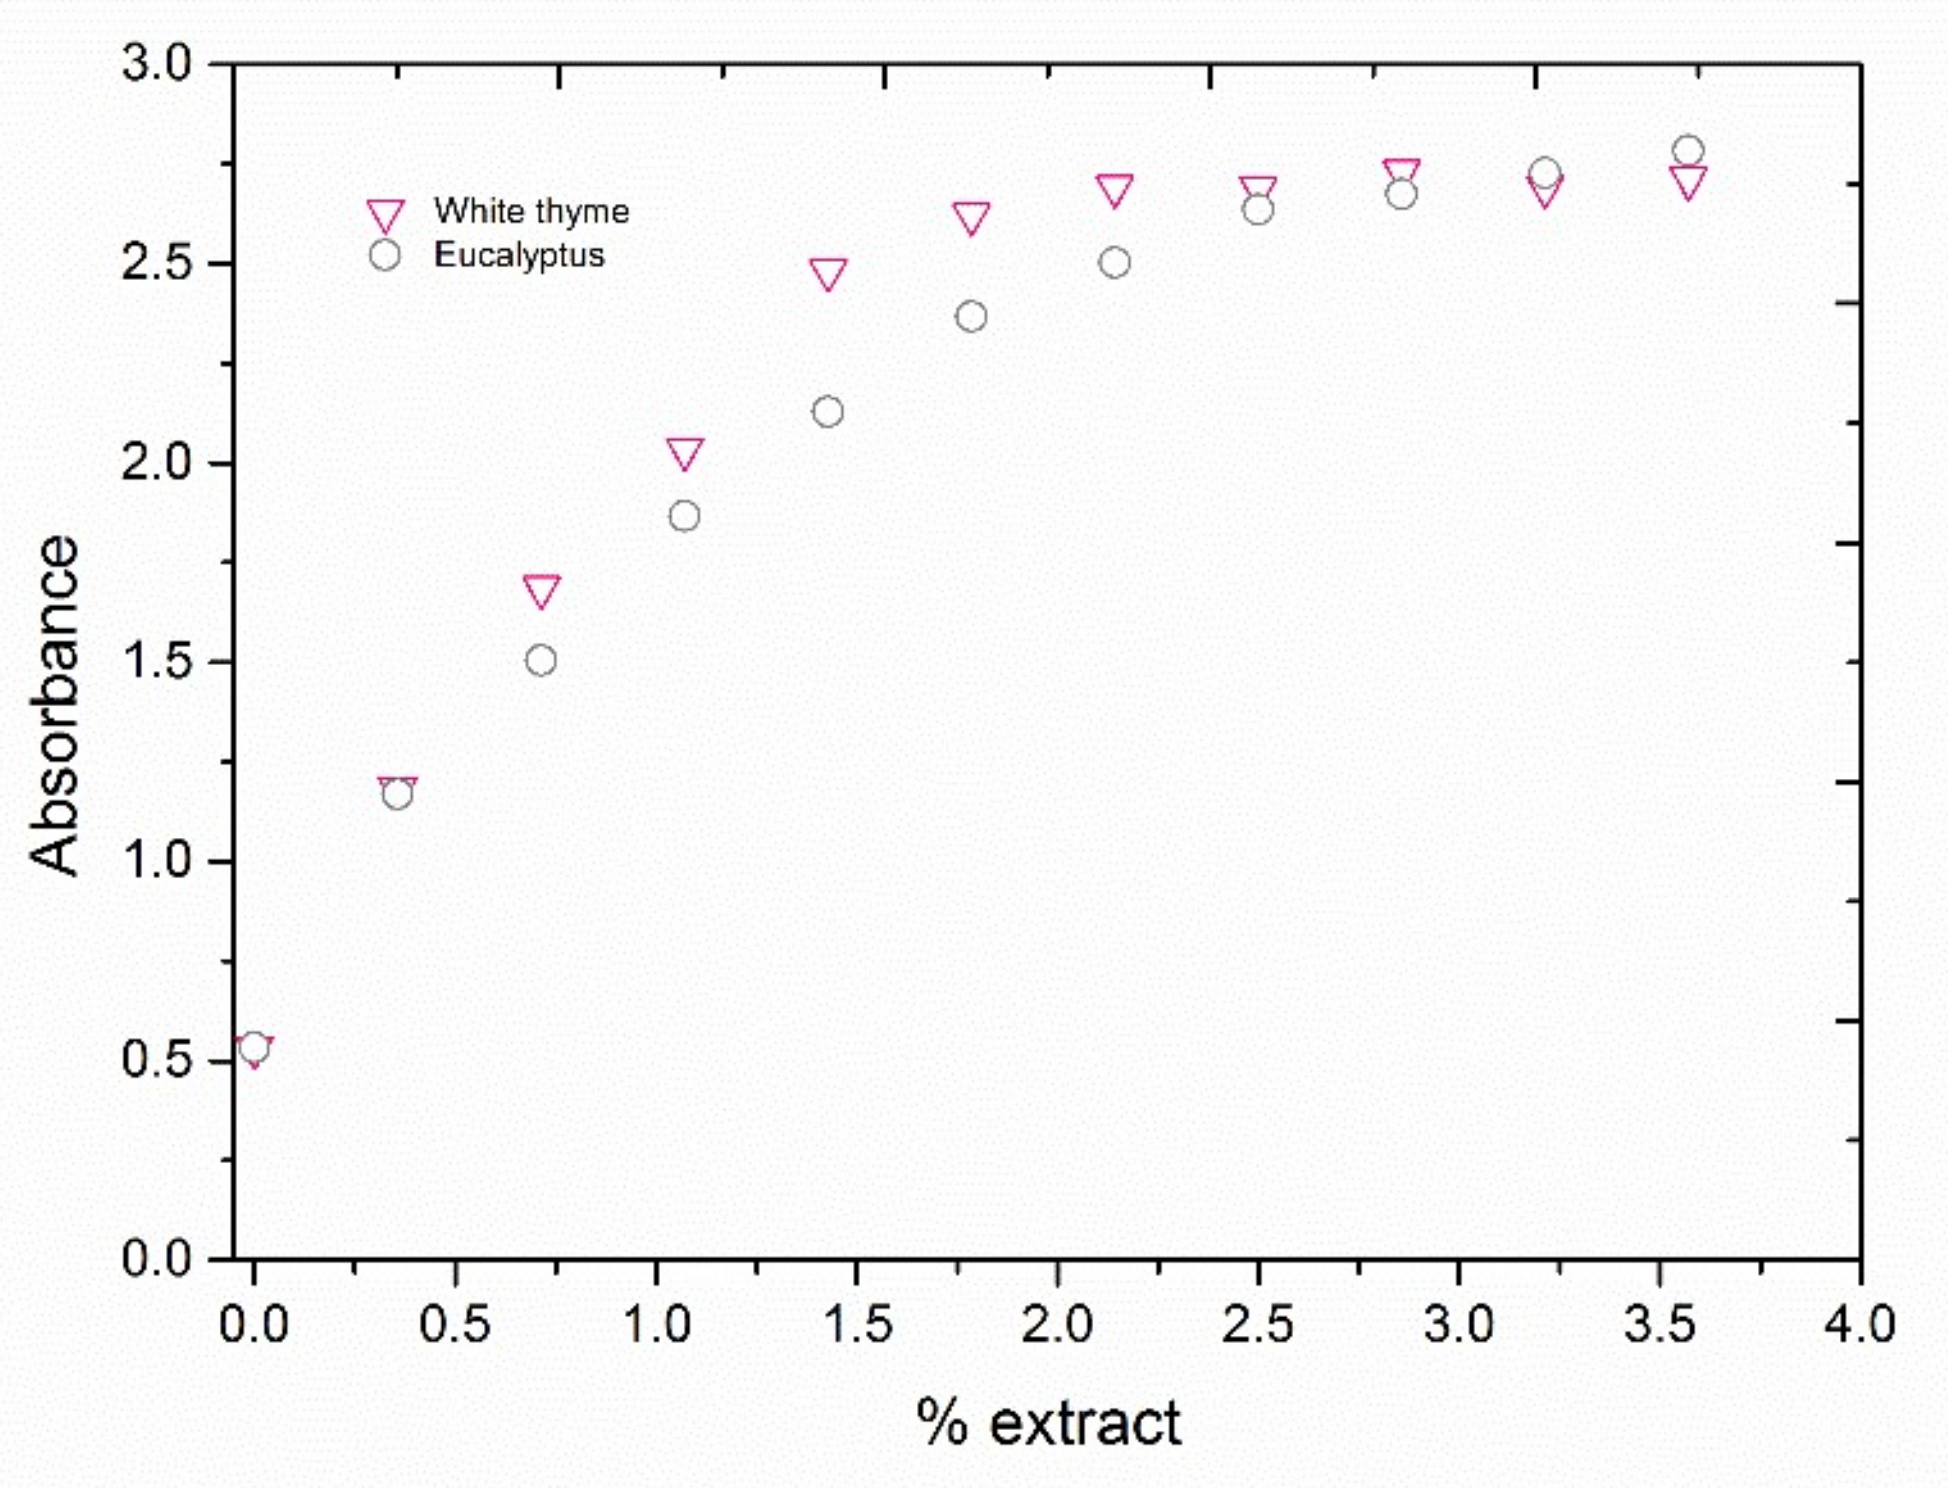
- Influence of the extract concentration on the nanoparticle growth
- (c)
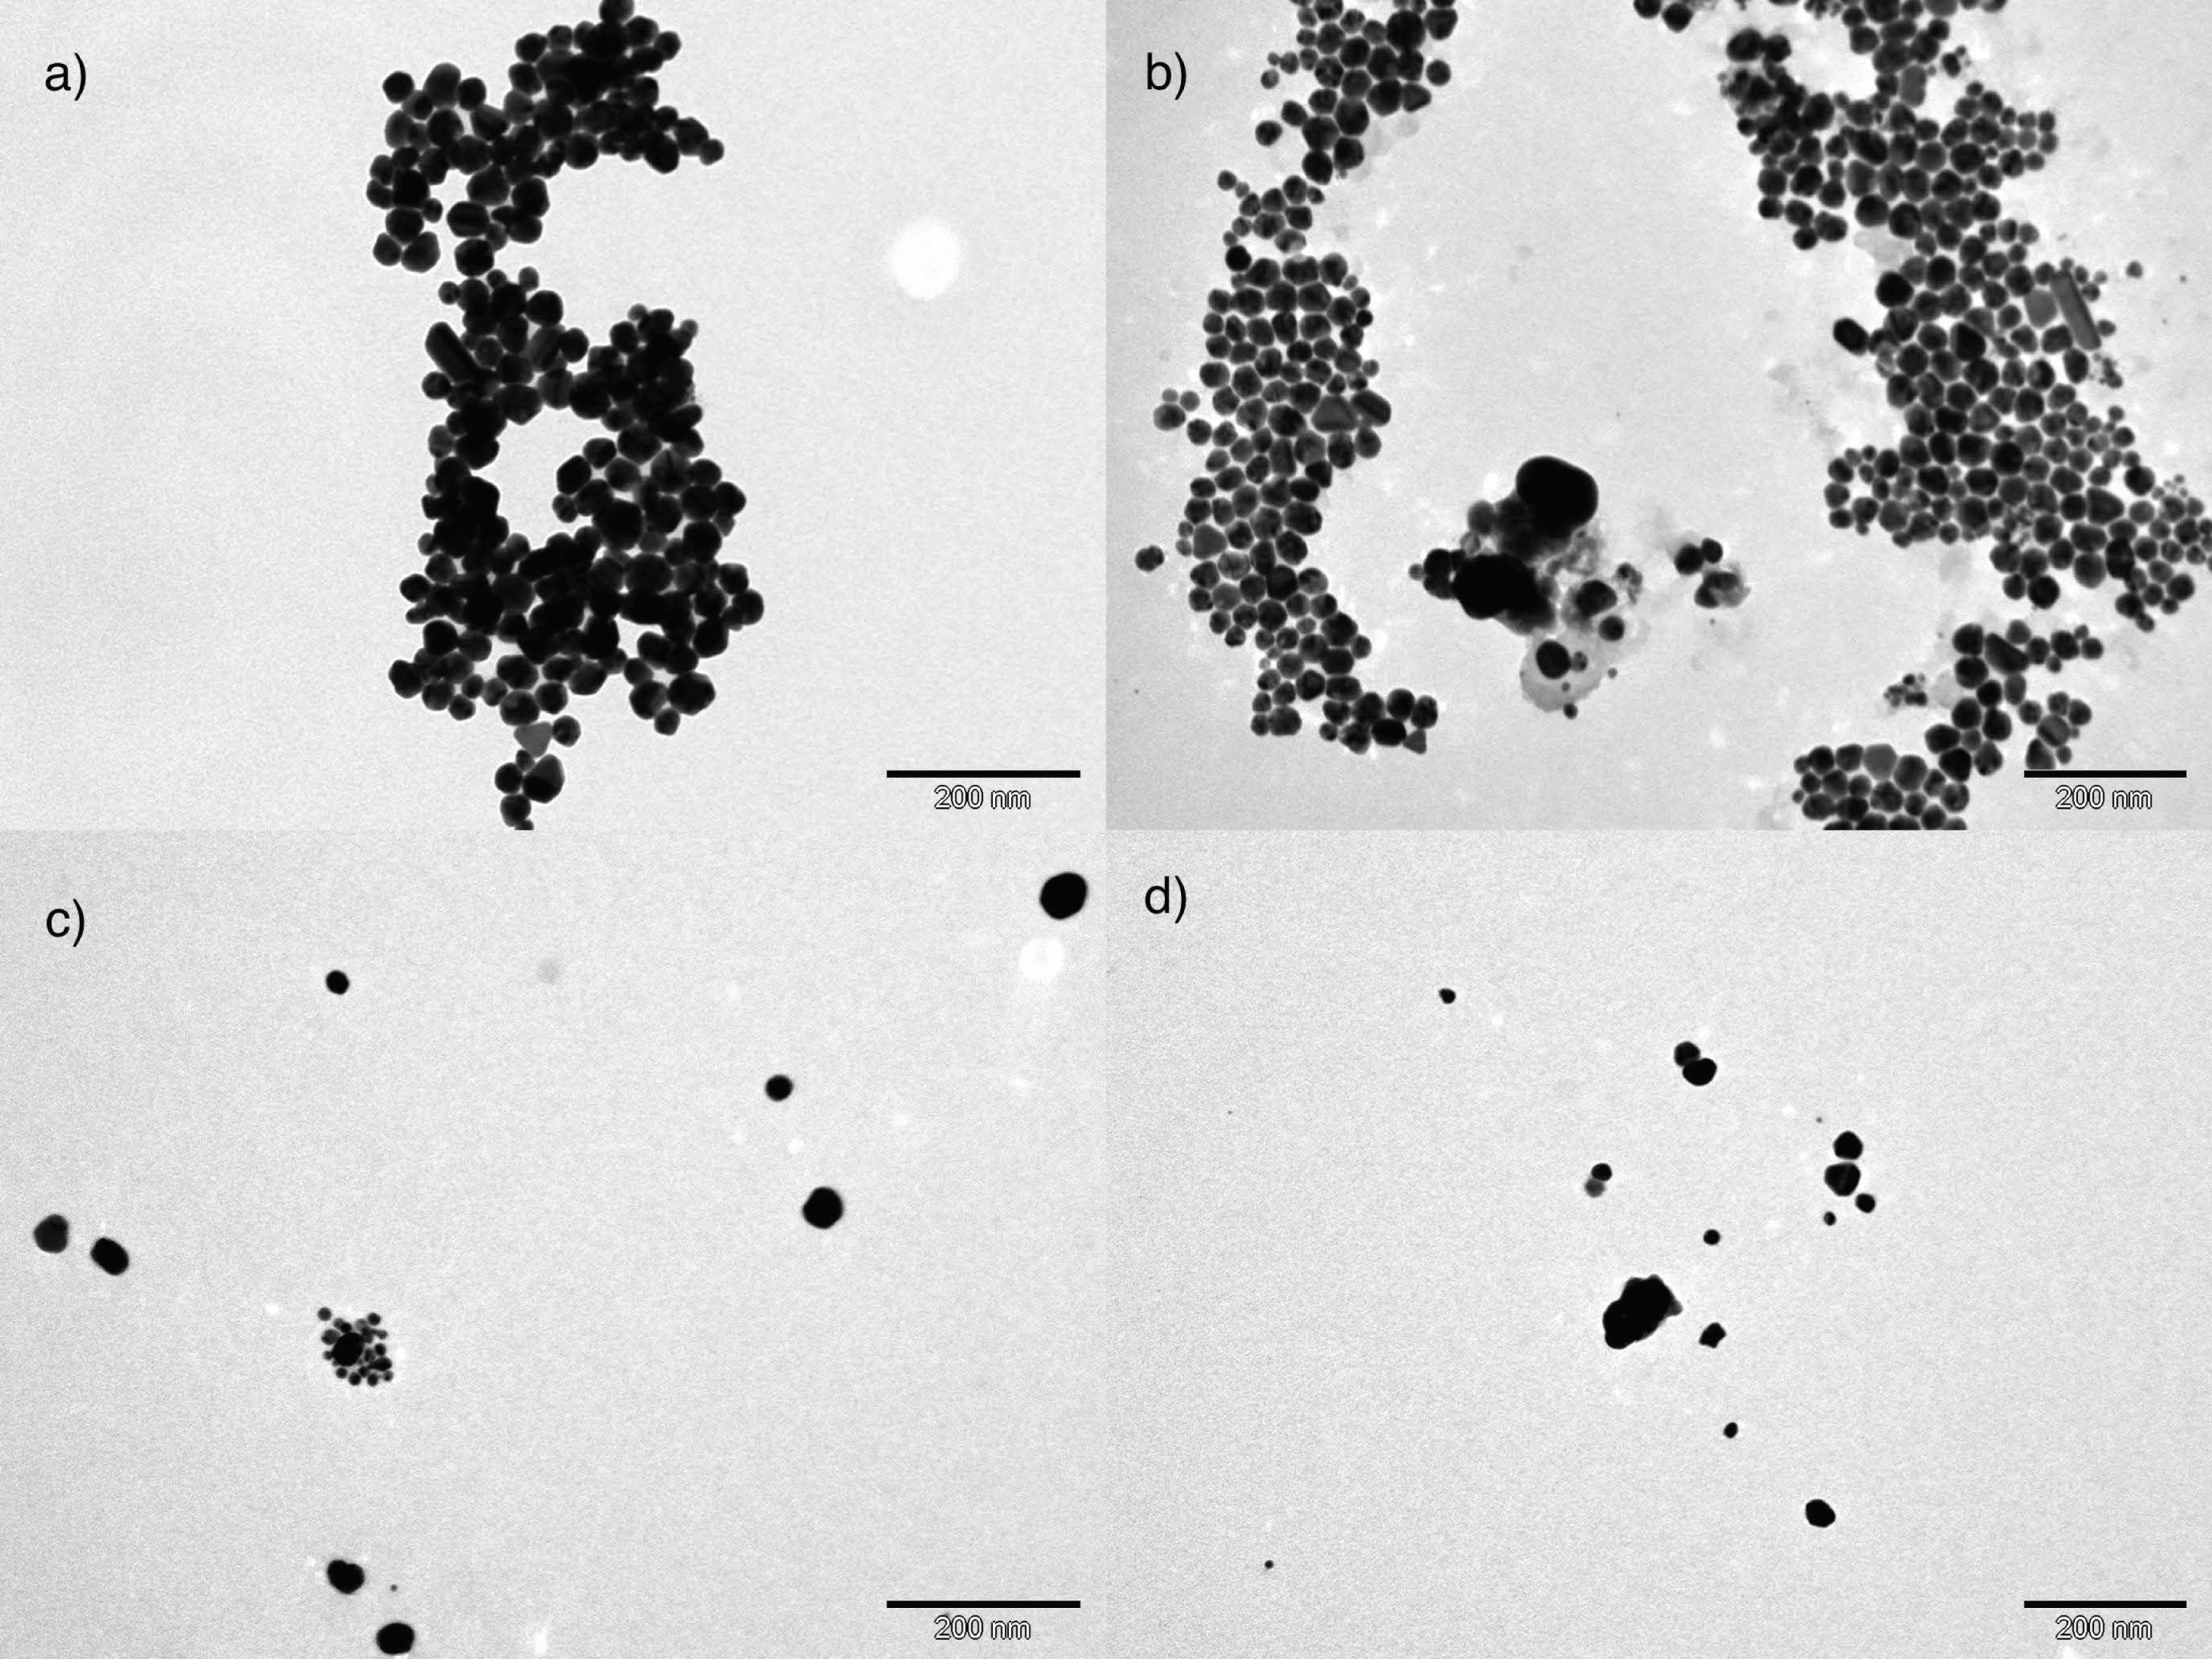
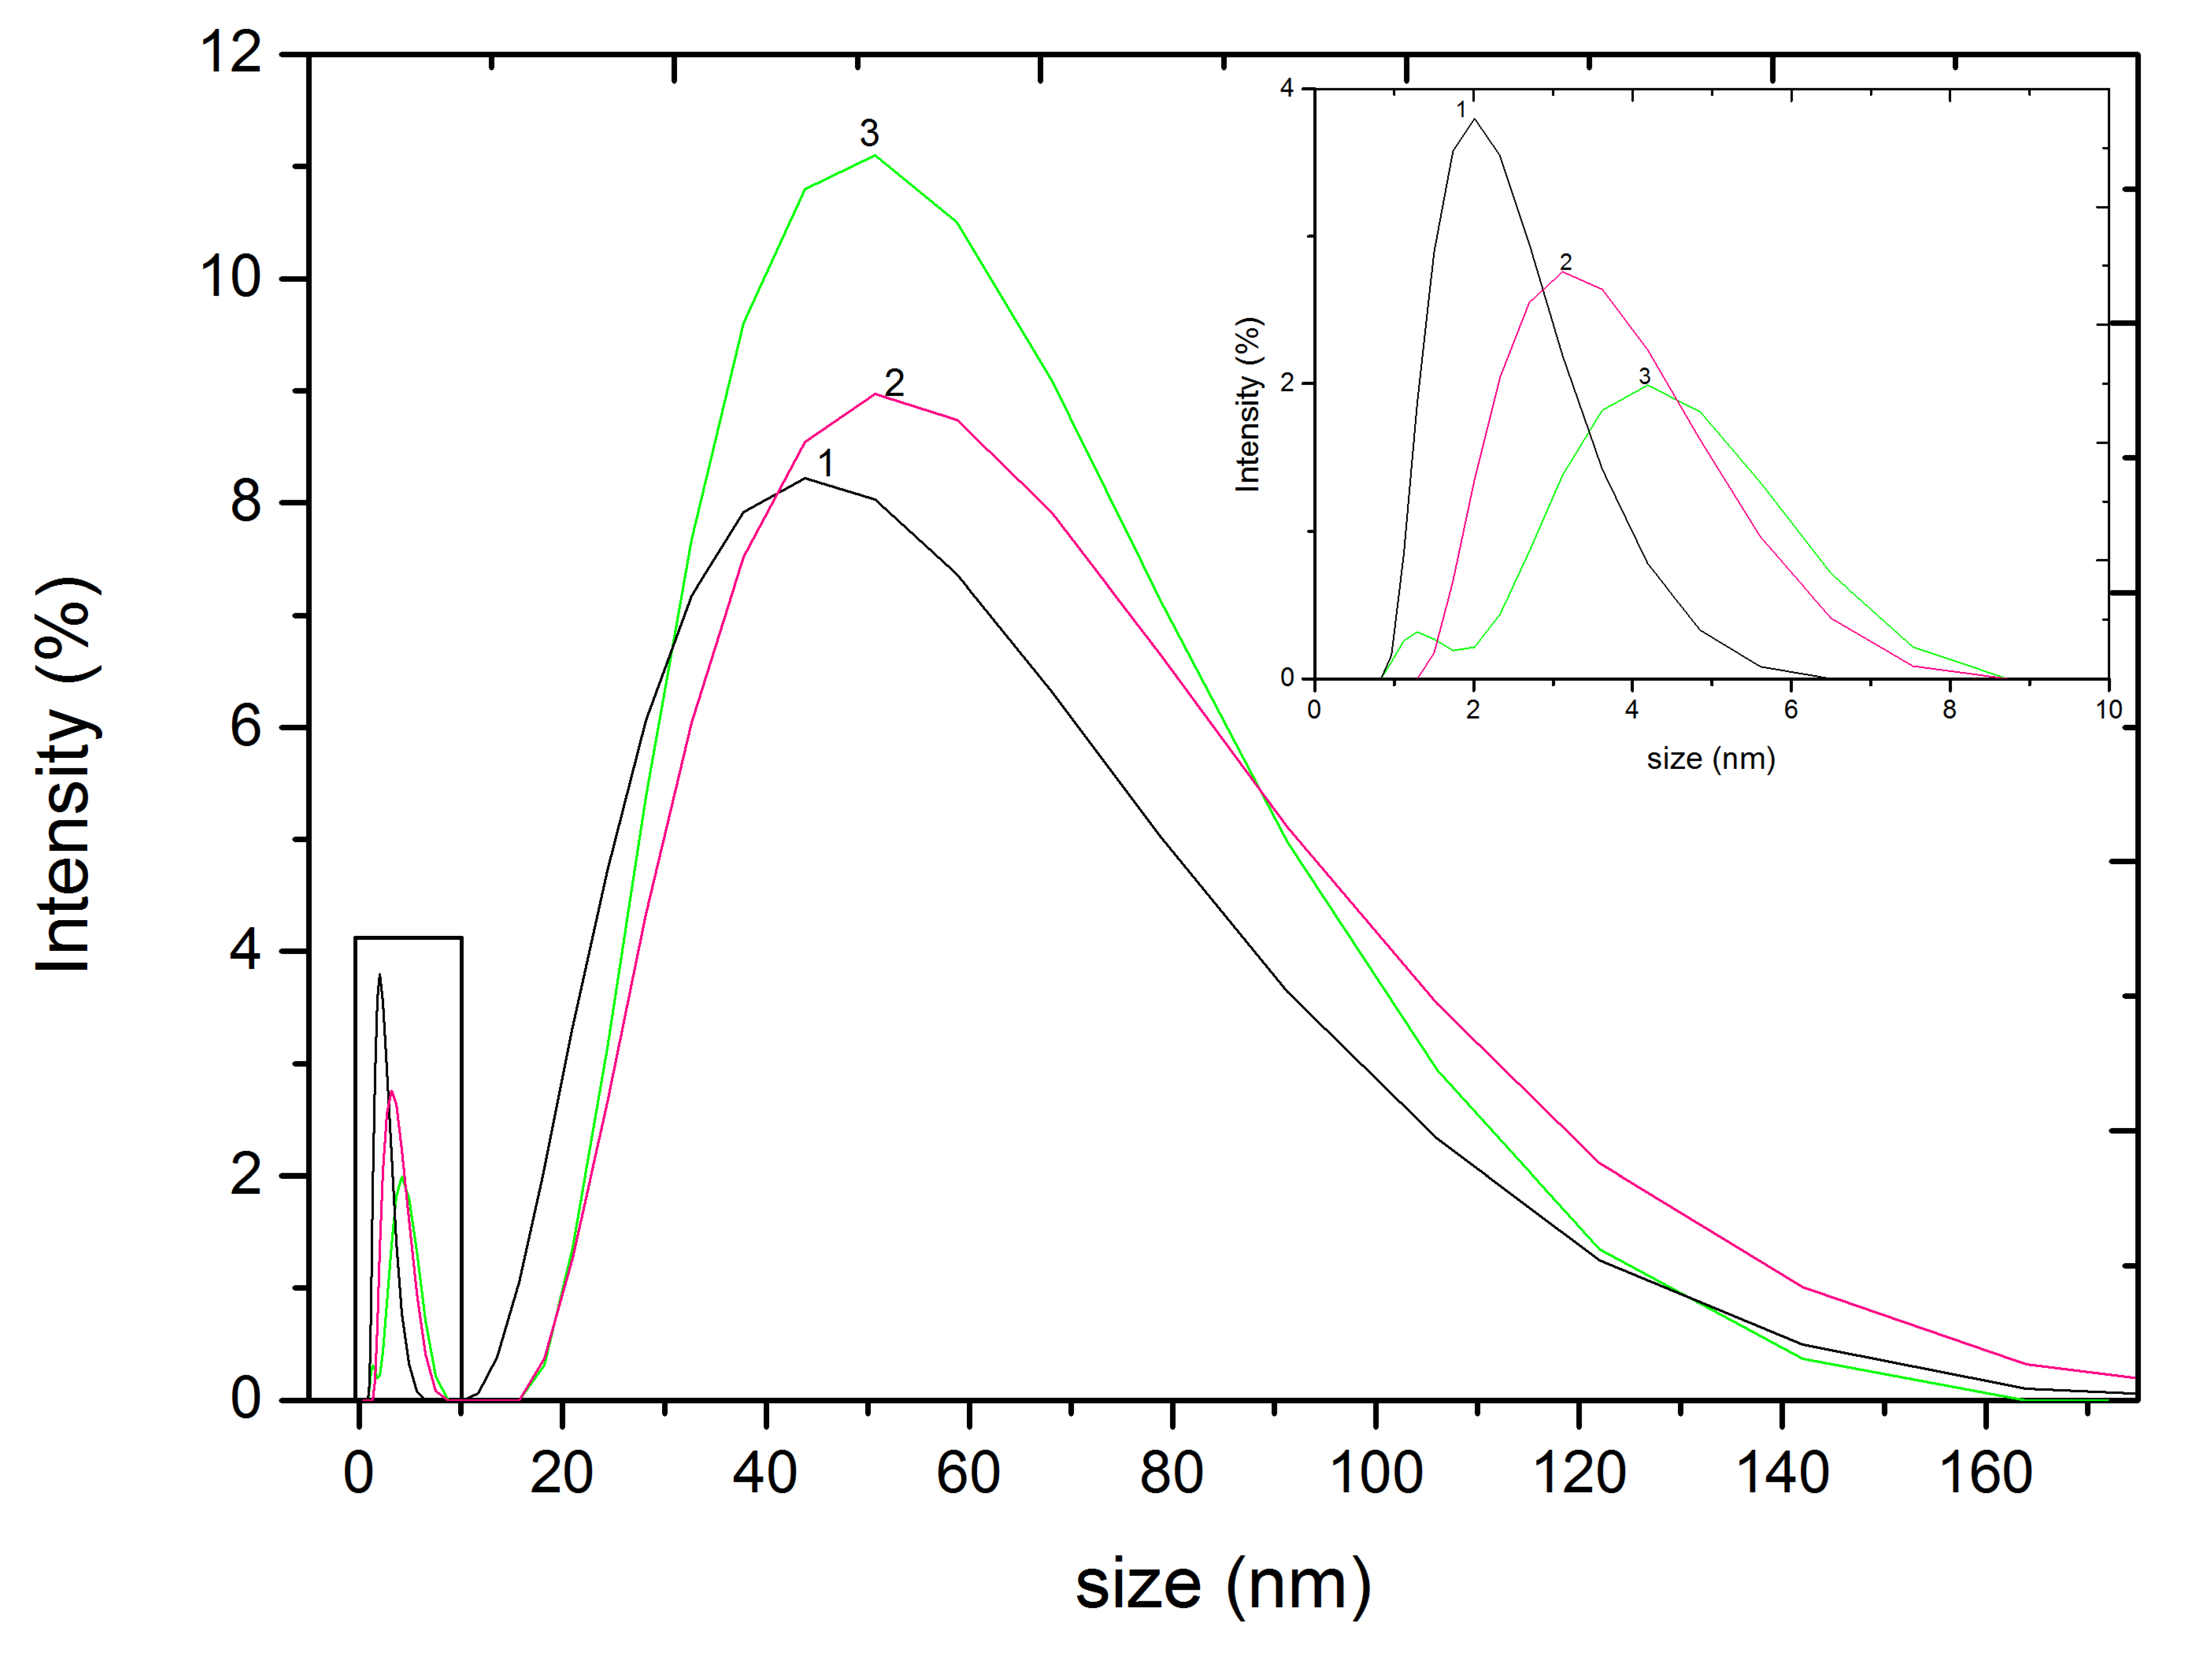
- Antioxidant capacity studies and characterization of nanoparticles
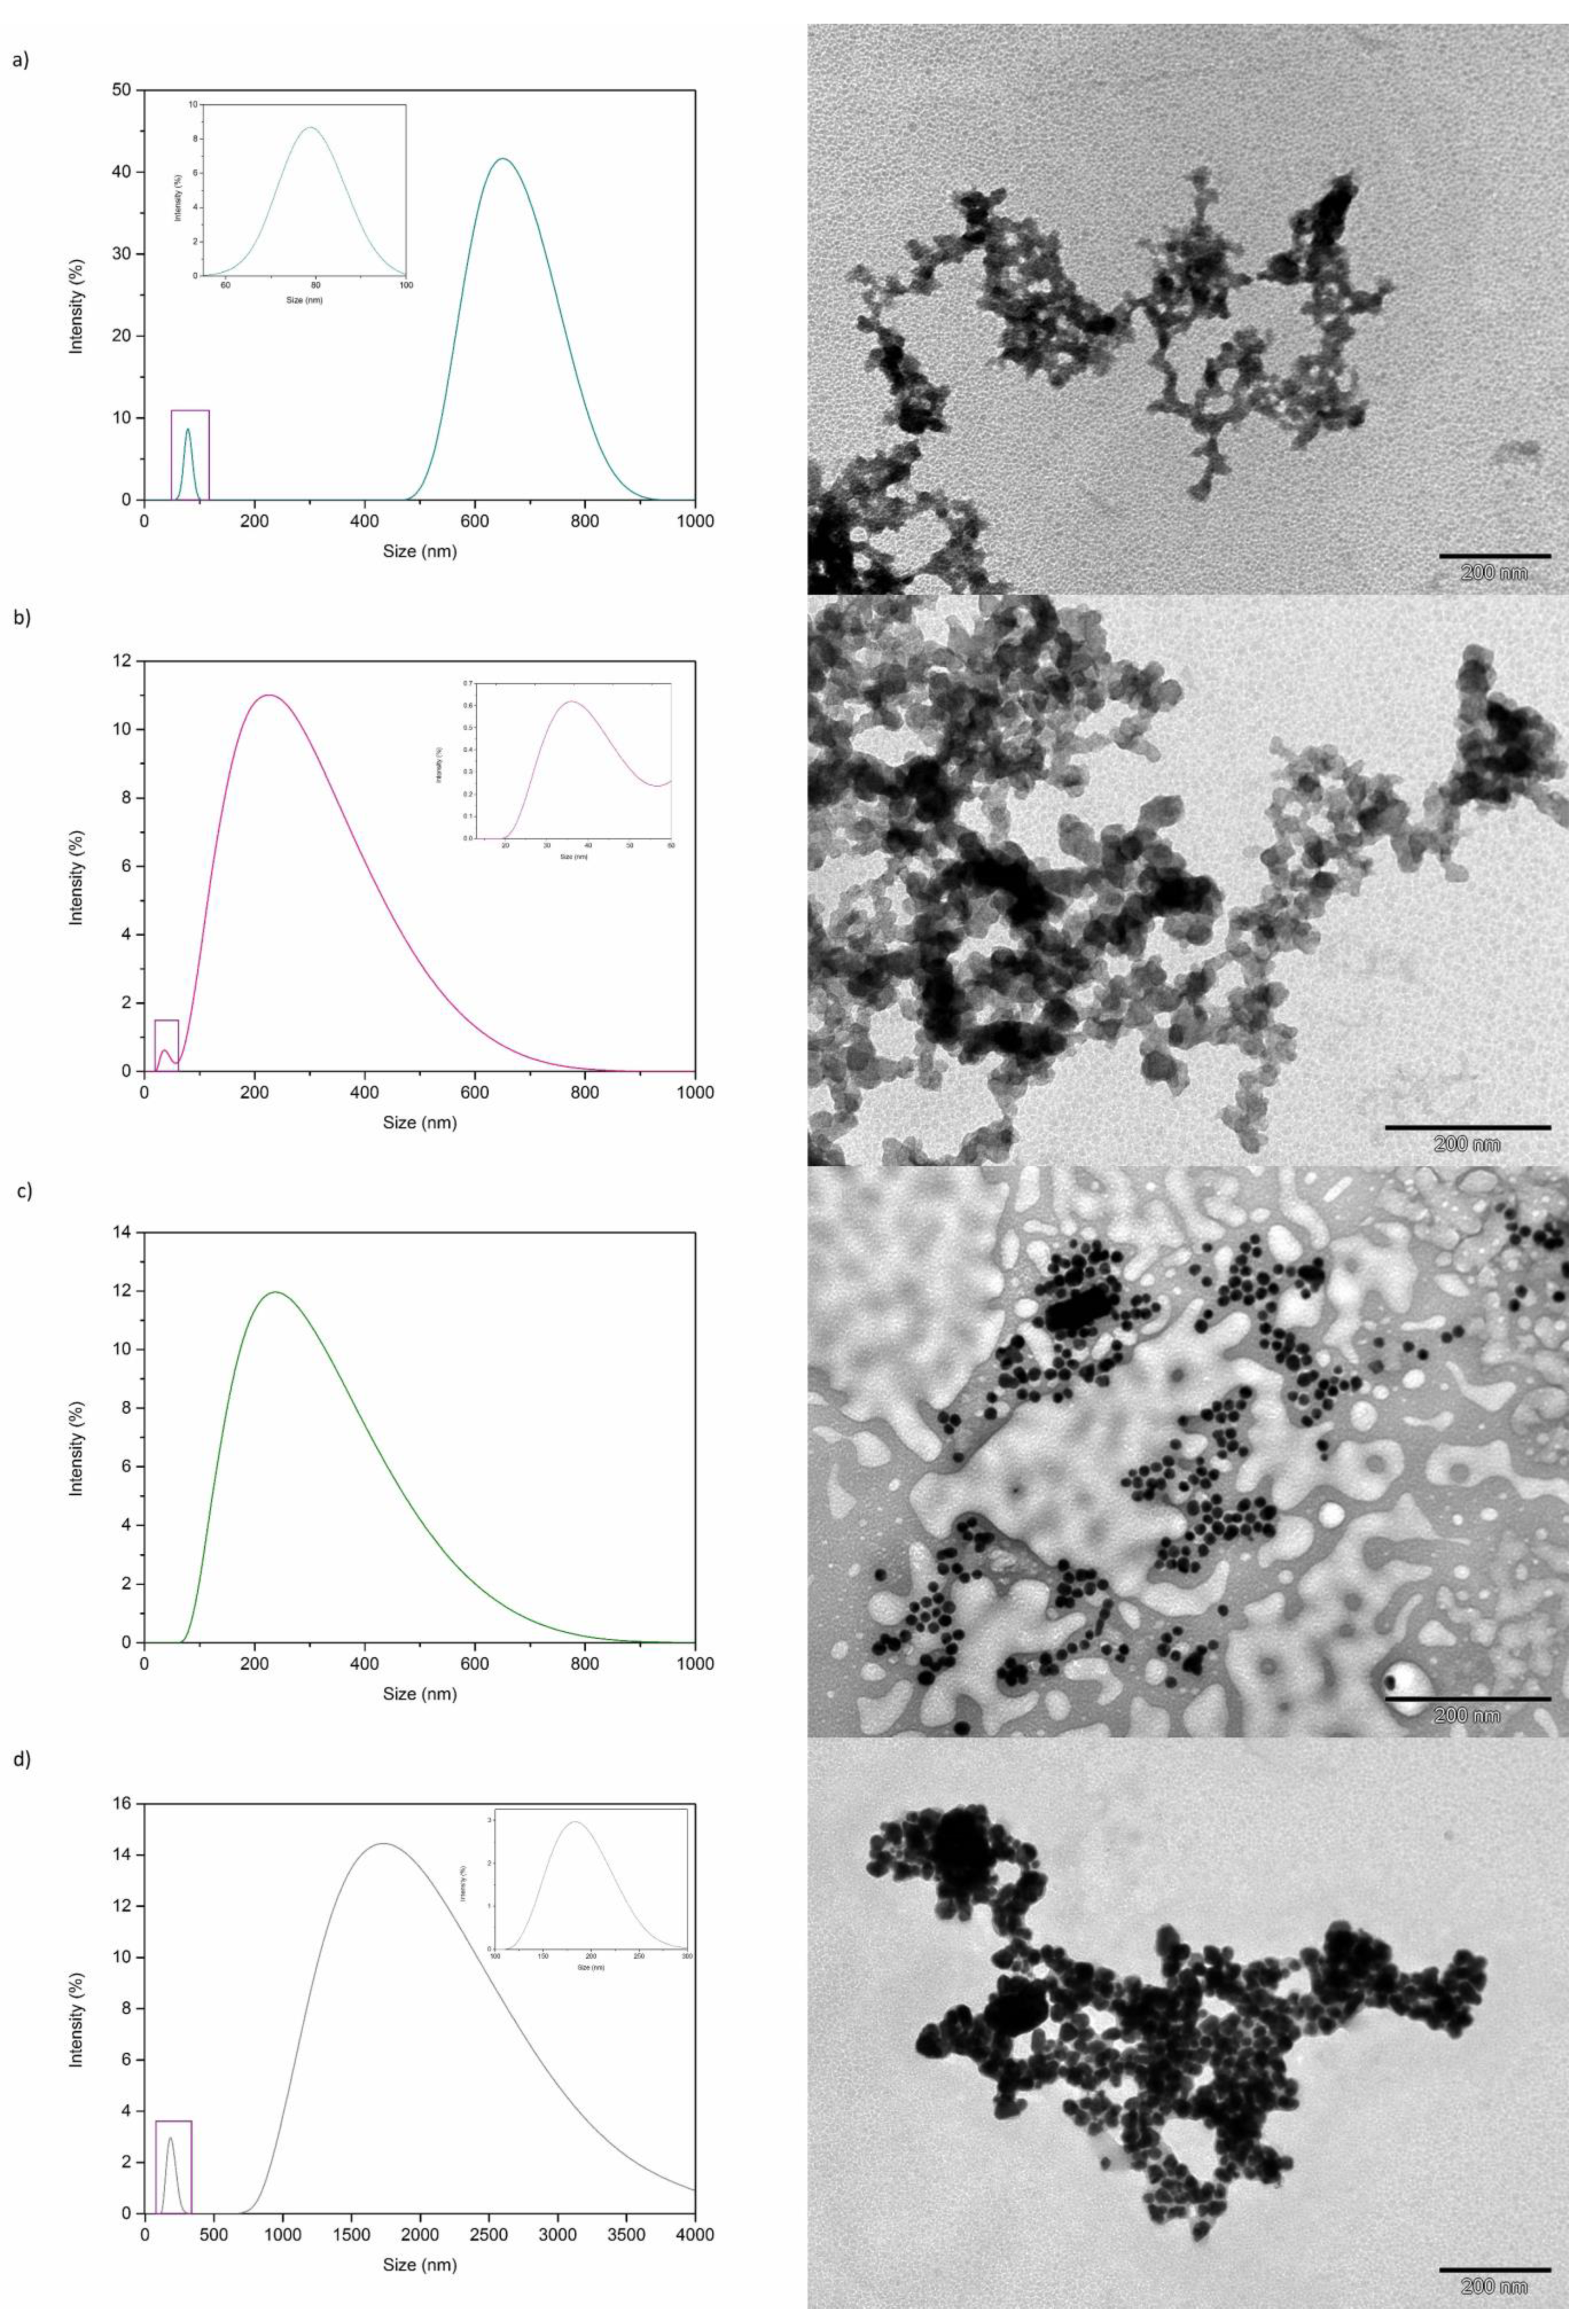
3.2. Synthesis and Characterization of Metallic Nanoparticles
4. Conclusions
Supplementary Materials
Author Contributions
Funding
Institutional Review Board Statement
Informed Consent Statement
Data Availability Statement
Acknowledgments
Conflicts of Interest
References
- US-EPA. Nanotechnology White Paper; U.S. Environmental Protection Agency Report; EPA: Washington, DC, USA, 2007. [Google Scholar]
- Teng, Z.; Luo, Y.; Wang, T.; Zhang, B.; Wang, Q. Development and application of nanoparticles synthesized with folic acid conjugated soy protein. J. Agric. Food. Chem. 2013, 61, 2556–2564. [Google Scholar] [CrossRef] [PubMed]
- Shah, M.; Fawcett, D.; Sharma, S.; Tripathy, S.K.; Poinern, G.E.J. Green synthesis of metallic nanoparticles via biological entities. Materials 2015, 8, 7278–7308. [Google Scholar] [CrossRef] [PubMed] [Green Version]
- Kanmani, P.; Rhim, J.-W. Physicochemical properties of gelatin/silver nanoparticle antimicrobial composite films. Food Chem. 2014, 148, 162–169. [Google Scholar] [CrossRef] [PubMed]
- Pradeep, T. Anshup, Noble metal nanoparticles for water purification: A critical review. Thin Solid Film. 2009, 517, 6441–6478. [Google Scholar] [CrossRef]
- Castillo-Henriquez, L.; Alfaro-Aguilar, K.; Ugalde-Alvarez, J.; Vega-Fernandez, L.; Montes de Oca-Vasquez, G.; Vega-Baudrit, J.R. Green Synthesis of Gold and Silver Nanoparticles from Plant Extracts and Their Possible Applications as Antimicrobial Agents in the Agricultural Area. Nanomaterials 2020, 10, 1763. [Google Scholar] [CrossRef] [PubMed]
- Khan, M.; Shaik, M.R.; Adil, S.F.; Khan, S.T.; Al-Warthan, A.; Siddiqui, M.R.H.; Tahir, M.N.; Tremel, W. Plant extracts as green reductants for the synthesis of silver nanoparticles: Lessons from chemical synthesis. Dalton Trans. 2018, 47, 11988–12010. [Google Scholar] [CrossRef] [PubMed]
- Kharissova, O.V.; Dias, H.V.R.; Kharisov, B.I.; Pérez, B.O.; Pérez, V.M.J. The greener synthesis of nanoparticles. Trends Biotechnol. 2013, 31, 240–248. [Google Scholar] [CrossRef] [PubMed]
- Byrne, J.M.; Muhamadali, H.; Coker, V.S.; Cooper, J.; Lloyd, J.R. Scale-up of the production of highly reactive biogenic magnetite nanoparticles using Geobacter sulfurreducens. J. R. Soc. Interface 2015, 12, 10. [Google Scholar] [CrossRef] [Green Version]
- Salunke, B.K.; Sawant, S.S.; Lee, S.I.; Kim, B.S. Comparative study of MnO2 nanoparticle synthesis by marine bacterium Saccharophagus degradans and yeast Saccharomyces cerevisiae. Appl. Microbiol. Biotechnol. 2015, 99, 5419–5427. [Google Scholar] [CrossRef]
- Lee, J.-S.; Kim, G.-H.; Lee, H.G. Characteristics and antioxidant activity of Elsholtzia splendens extract-loaded nanoparticles. J. Agric. Food. Chem. 2010, 58, 3316–3321. [Google Scholar] [CrossRef]
- Makarov, V.V.; Makarova, S.S.; Love, A.J.; Sinitsyna, O.V.; Dudnik, A.O.; Yaminsky, I.V.; Taliansky, M.E.; Kalinina, N.O. Biosynthesis of stable iron oxide nanoparticles in aqueous extracts of Hordeum vulgare and Rumex acetosa plants. Langmuir 2014, 30, 5982–5988. [Google Scholar] [CrossRef]
- Shankar, S.S.; Ahmad, A.; Sastry, M. Geranium leaf assisted biosynthesis of silver nanoparticles. Biotechnol. Progr. 2003, 19, 1627–1631. [Google Scholar] [CrossRef]
- Luo, F.; Yang, D.; Chen, Z.; Megharaj, M.; Naidu, R. The mechanism for degrading Orange II based on adsorption and reduction by ion-based nanoparticles synthesized by grape leaf extract. J. Hazard. Mater. 2015, 296, 37–45. [Google Scholar] [CrossRef]
- Asmathunisha, N.; Kathiresan, K. A review on biosynthesis of nanoparticles by marine organisms. Colloids Surf. B Biointerfaces 2013, 103, 283–287. [Google Scholar] [CrossRef]
- Aziz, N.; Faraz, M.; Pandey, R.; Shakir, M.; Fatma, T.; Varma, A.; Barman, I.; Prasad, R. Facile algae-derived route to biogenic silver nanoparticles: Synthesis, antibacterial, and photocatalytic properties. Langmuir 2015, 31, 11605–11612. [Google Scholar] [CrossRef]
- Azizi, S.; Namvar, F.; Mahdavi, M.; Ahmad, M.; Mohamad, R. Biosynthesis of silver nanoparticles using brown marine macroalga, Sargassum Muticum aqueous extract. Materials 2013, 6, 5942–5950. [Google Scholar] [CrossRef]
- Mahdavi, M.; Namvar, F.; Ahmad, M.; Mohamad, R. Green biosynthesis and characterization of magnetic iron oxide (Fe3O4) nanoparticles using seaweed (Sargassum muticum) aqueous extract. Molecules 2013, 18, 5954–5964. [Google Scholar] [CrossRef]
- Alnadhari, S.; Al-Enazi, N.M.; Alshehrei, F.; Ameen, F. A review on biogenic synthesis of metal nanoparticles using marine algae and its applications. Environ. Res. 2021, 194, 110672. [Google Scholar] [CrossRef]
- Rajan, R.; Chandran, K.; Harper, S.L.; Yun, S.-I.; Kalaichelvan, P.T. Plant extract synthesized silver nanoparticles: An ongoing source of novel biocompatible materials. Ind. Crop. Prod. 2015, 70, 356–373. [Google Scholar] [CrossRef]
- Matsuura, R.; Moriyama, H.; Takeda, N.; Yamamoto, K.; Morita, Y.; Shimamura, T.; Ukeda, H. Determination of antioxidant activity and characterization of antioxidant phenolics in the plum vinegar extract of cherry blossom (Prunus lannesiana). J. Agric. Food. Chem. 2008, 56, 544–549. [Google Scholar] [CrossRef]
- Pisoschi, A.M.; Negulescu, G.P. Methods for total antioxidant activity determination: A review. Biochem. Anal. Biochem. 2011, 1. [Google Scholar] [CrossRef] [Green Version]
- Della Pelle, F.; Scroccarello, A.; Sergi, M.; Mascini, M.; Del Carlo, M.; Compagnone, D. Simple and rapid silver nanoparticles based antioxidant capacity assays: Reactivity study for phenolic compounds. Food Chem. 2018, 256, 342–349. [Google Scholar] [CrossRef]
- Li, L.; Zhang, P.; Fu, W.S.; Yang, M.F.; Wang, Y. Use of seed-mediated growth of bimetallic nanorods as a knob for antioxidant assay. Sens. Actuators B Chem. 2018, 276, 158–165. [Google Scholar] [CrossRef]
- Adil, S.F.; Assal, M.E.; Khan, M.; Al-Warthan, A.; Siddiqui, M.R.H.; Liz-Marzan, L.M. Biogenic synthesis of metallic nanoparticles and prospects toward green chemistry. Dalton Trans. 2015, 44, 9709–9717. [Google Scholar] [CrossRef] [PubMed]
- Apak, R. Current Issues in Antioxidant Measurement. J. Agric. Food. Chem. 2019, 67, 9187–9202. [Google Scholar] [CrossRef] [PubMed]
- Tan, J.B.; Lim, Y.Y. Critical analysis of current methods for assessing the in vitro antioxidant and antibacterial activity of plant extracts. Food Chem. 2015, 172, 814–822. [Google Scholar] [CrossRef] [PubMed]
- Mittal, A.K.; Chisti, Y.; Banerjee, U.C. Synthesis of metallic nanoparticles using plant extracts. Biotechnol. Adv. 2013, 31, 346–356. [Google Scholar] [CrossRef] [PubMed]
- Apak, R.; Ozyurek, M.; Guclu, K.; Capanoglu, E. Antioxidant Activity/Capacity Measurement. 1. Classification, Physicochemical Principles, Mechanisms, and Electron Transfer (ET)-Based Assays. J. Agric. Food. Chem. 2016, 64, 997–1027. [Google Scholar] [CrossRef]
- Huang, D.; Ou, B.; Prior, R.L. The Chemistry behind Antioxidant Capacity Assays. J. Agric. Food. Chem. 2005, 53, 1841–1856. [Google Scholar] [CrossRef]
- Apak, R.; Gorinstein, S.; Boehm, V.; Schaich, K.M.; Ozyurek, M.; Guclu, K. Methods of measurement and evaluation of natural antioxidant capacity/activity (IUPAC Technical Report). Pure Appl. Chem. 2013, 85, 957–998. [Google Scholar] [CrossRef] [Green Version]
- Szydłowska-Czerniak, A.; Tułodziecka, A. Comparison of a silver nanoparticle-based method and the modified spectrophotometric methods for assessing antioxidant capacity of rapeseed varieties. Food Chem. 2013, 141, 1865–1871. [Google Scholar] [CrossRef]
- Singleton, V.L.; Rossi, J.A. Colorimetry of total phenolics with phosphomolybdic-phosphotungstic acid reagents. Am. J. Enol. Vitic. 1965, 16, 144–158. [Google Scholar]
- Brand-Williams, W.; Cuvelier, M.E.; Berset, C. Use of a free radical method to evaluate antioxidant activity. LWT Food Sci. Technol. 1995, 28, 25–30. [Google Scholar] [CrossRef]
- Ozyurek, M.; Gungor, N.; Baki, S.; Guclu, K.; Apak, R. Development of a silver nanoparticle-based method for the antioxidant capacity measurement of polyphenols. Anal. Chem. 2012, 84, 8052–8059. [Google Scholar] [CrossRef]
- Blois, M.S. Antioxidant determinations by the use of a stable free radical. Nature 1958, 181, 1199–1200. [Google Scholar] [CrossRef]
- Folin, O.; Ciocalteu, V. On tyrosine and tryptophane determinations in proteins. J. Biol. Chem. 1927, 73, 627–650. [Google Scholar] [CrossRef]
- Conde, E.; Cara, C.; Moure, A.; Ruiz, E.; Castro, E.; Dominguez, H. Antioxidant activity of the phenolic compounds released by hydrothermal treatments of olive tree pruning. Food Chem. 2009, 114, 806–812. [Google Scholar] [CrossRef]
- Parsons, J.G.; Peralta-Videa, J.R.; Gardea-Torresdey, J.L. Chapter 21 Use of plants in biotechnology: Synthesis of metal nanoparticles by inactivated plant tissues, plant extracts, and living plants. In Developments in Environmental Science; Dibyendu Sarkar, R.D., Robyn, H., Eds.; Elsevier: Amsterdam, The Netherlands, 2007; Volume 5, pp. 463–485. [Google Scholar]
- Evanoff, D.D.; Chumanov, G. Synthesis and optical properties of silver nanoparticles and arrays. ChemPhysChem 2005, 6, 1221–1231. [Google Scholar] [CrossRef]
- Hou, W.-C.; Stuart, B.; Howes, R.; Zepp, R.G. Sunlight-driven reduction of silver ions by natural organic matter: Formation and transformation of silver nanoparticles. Environ. Sci. Technol. 2013, 47, 7713–7721. [Google Scholar] [CrossRef]
- Peretyazhko, T.S.; Zhang, Q.; Colvin, V.L. Size-controlled dissolution of silver nanoparticles at neutral and acidic pH conditions: Kinetics and size changes. Environ. Sci. Technol. 2014, 48, 11954–11961. [Google Scholar] [CrossRef]
- Kim, D.K.; Mikhaylova, M.; Zhang, Y.; Muhammed, M. Protective coating of superparamagnetic iron oxide nanoparticles. Chem. Mater. 2003, 15, 1617–1627. [Google Scholar] [CrossRef]


| Material | k′ (h−1) |
|---|---|
| White thyme | 3.6 ± 0.2 |
| Eucalyptus | 0.7 ± 0.1 |
| Oak | 5.5 ± 0.3 |
| White cedar | 1.9 ± 0.1 |
Publisher’s Note: MDPI stays neutral with regard to jurisdictional claims in published maps and institutional affiliations. |
© 2021 by the authors. Licensee MDPI, Basel, Switzerland. This article is an open access article distributed under the terms and conditions of the Creative Commons Attribution (CC BY) license (https://creativecommons.org/licenses/by/4.0/).
Share and Cite
Martínez-Cabanas, M.; López-García, M.; Rodríguez-Barro, P.; Vilariño, T.; Lodeiro, P.; Herrero, R.; Barriada, J.L.; Sastre de Vicente, M.E. Antioxidant Capacity Assessment of Plant Extracts for Green Synthesis of Nanoparticles. Nanomaterials 2021, 11, 1679. https://doi.org/10.3390/nano11071679
Martínez-Cabanas M, López-García M, Rodríguez-Barro P, Vilariño T, Lodeiro P, Herrero R, Barriada JL, Sastre de Vicente ME. Antioxidant Capacity Assessment of Plant Extracts for Green Synthesis of Nanoparticles. Nanomaterials. 2021; 11(7):1679. https://doi.org/10.3390/nano11071679
Chicago/Turabian StyleMartínez-Cabanas, María, Marta López-García, Pilar Rodríguez-Barro, Teresa Vilariño, Pablo Lodeiro, Roberto Herrero, José L. Barriada, and Manuel E. Sastre de Vicente. 2021. "Antioxidant Capacity Assessment of Plant Extracts for Green Synthesis of Nanoparticles" Nanomaterials 11, no. 7: 1679. https://doi.org/10.3390/nano11071679