Characterization of Enamel and Dentine about a White Spot Lesion: Mechanical Properties, Mineral Density, Microstructure and Molecular Composition

 , , ,
, , ,
Abstract
:
1. Introduction
2. Materials and Methods
- natural enamel WSL;
- dentine bordering the WSL (touching the dentine–enamel junction as close to the WSL as possible);
- area of sound enamel on the opposite medial side of the tooth;
- dentine bordering the area of sound enamel (touching the dentine–enamel junction and as close to the area of sound enamel of area 3 as possible).
3. Results
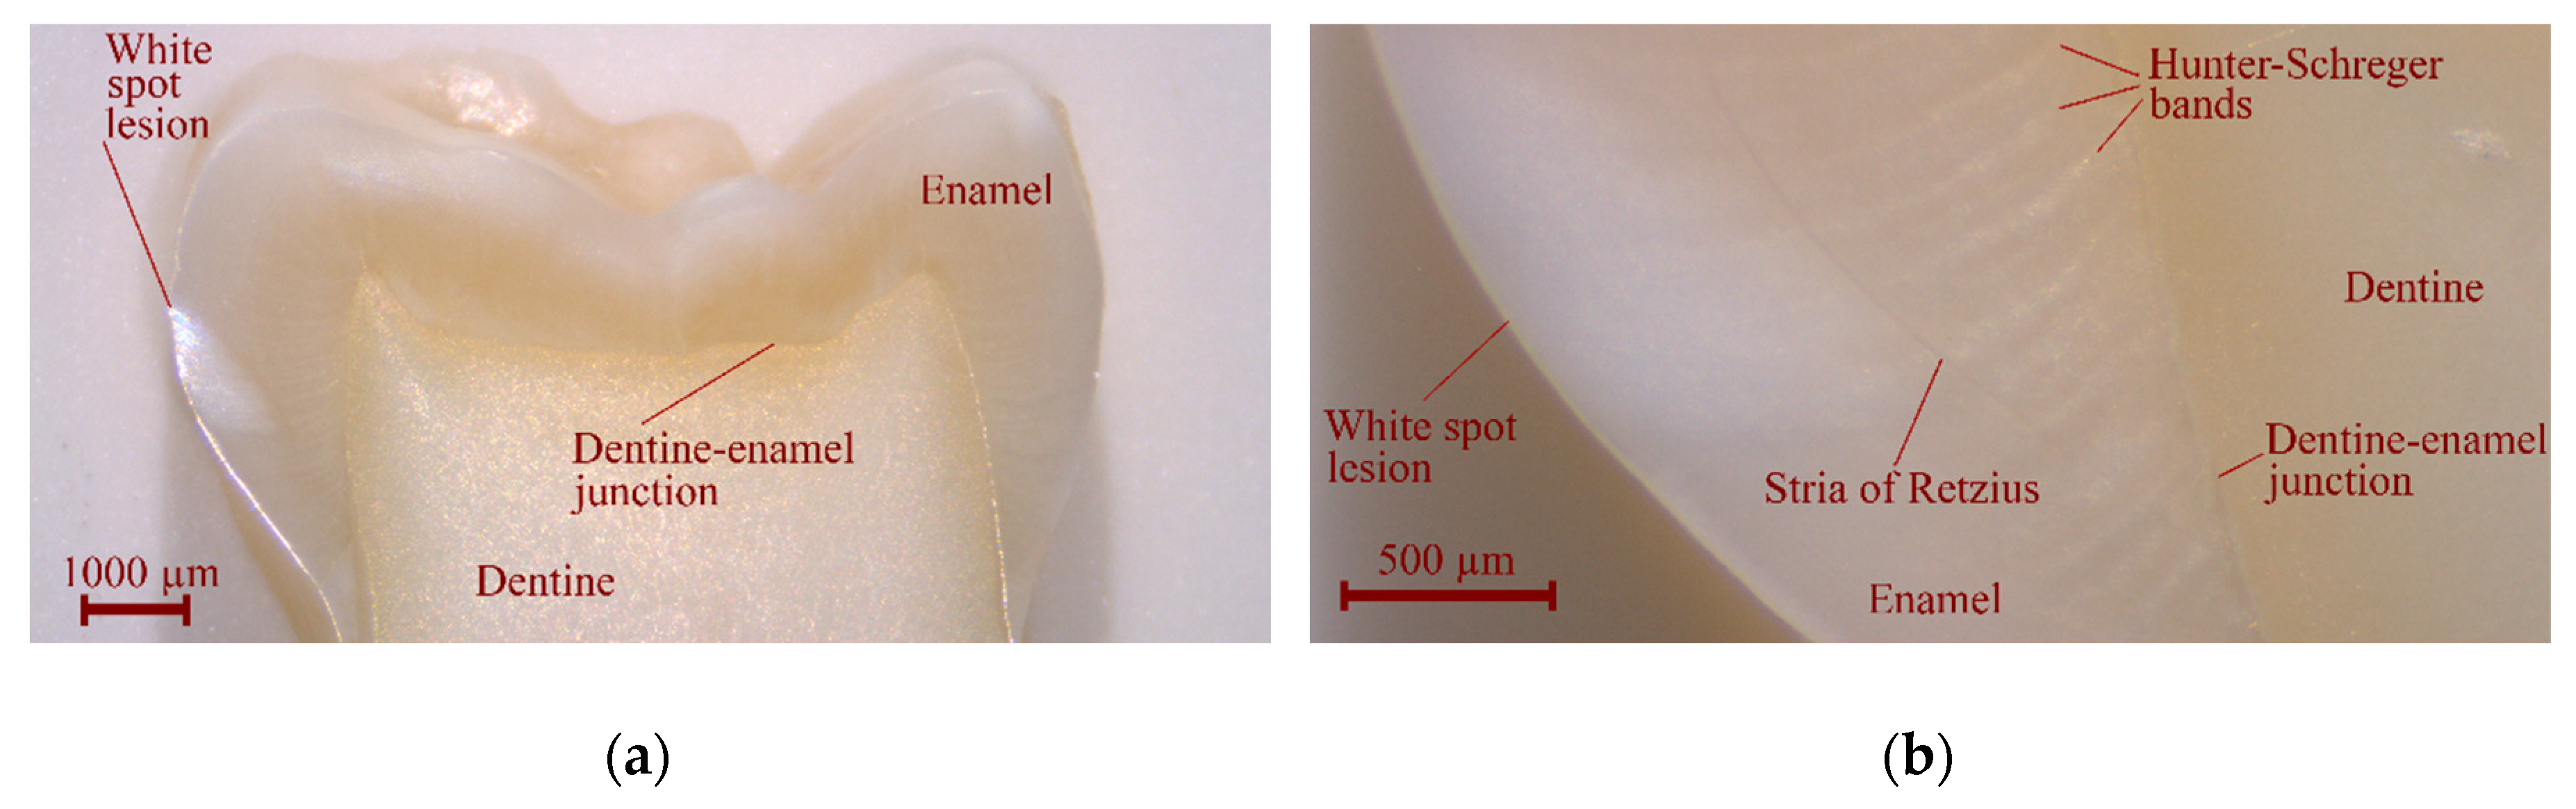
3.1. Optical Observations
3.2. Bitewing X-ray
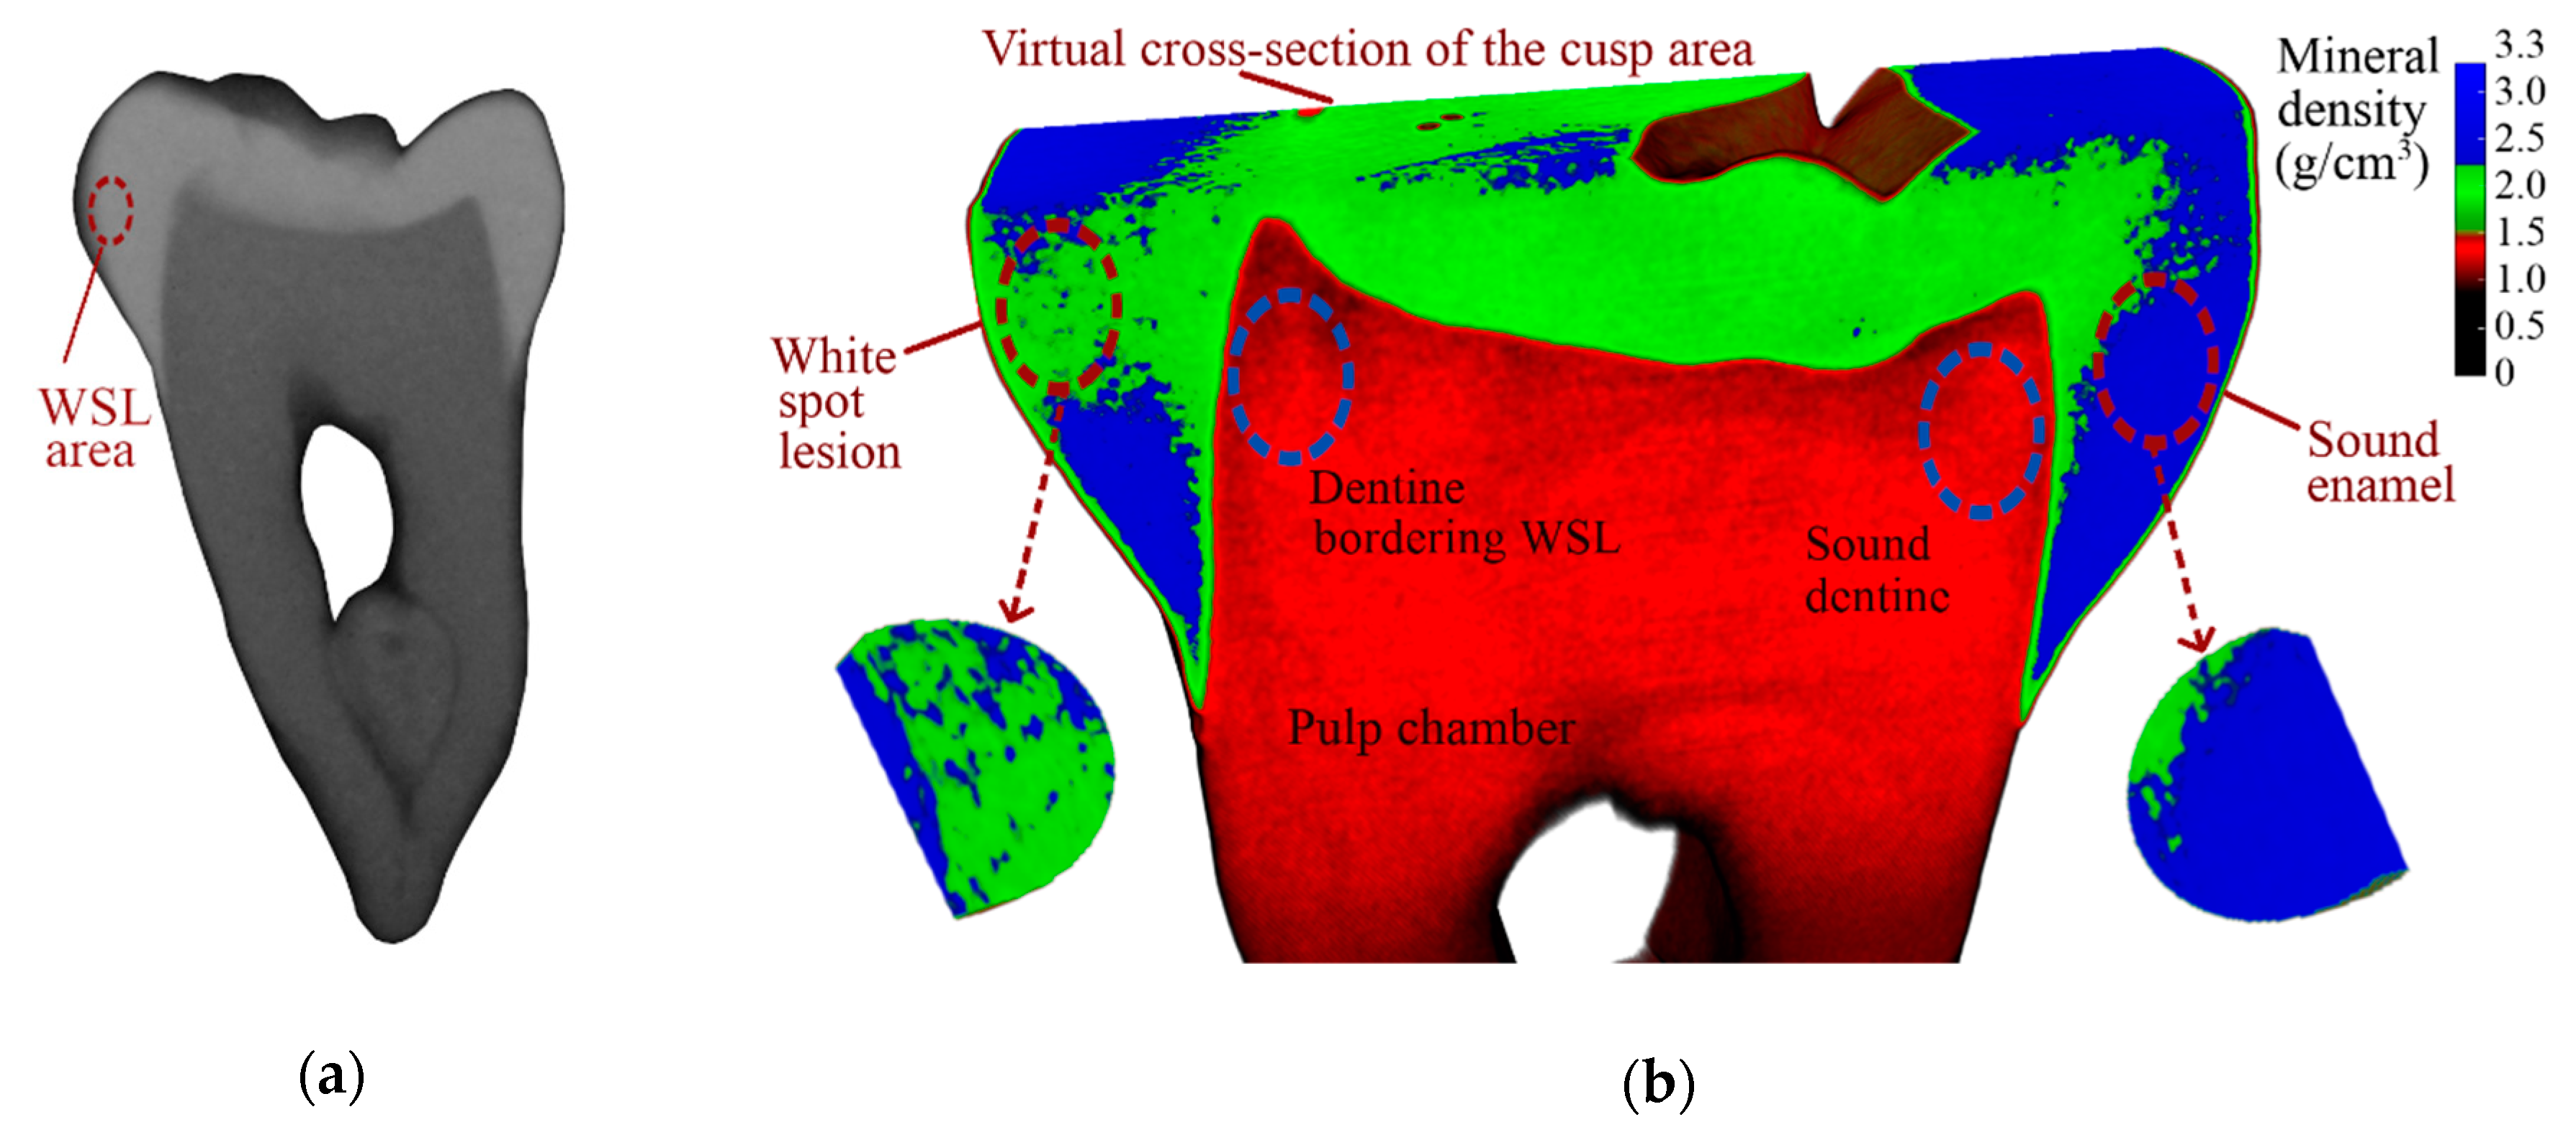
3.3. Micro-CT
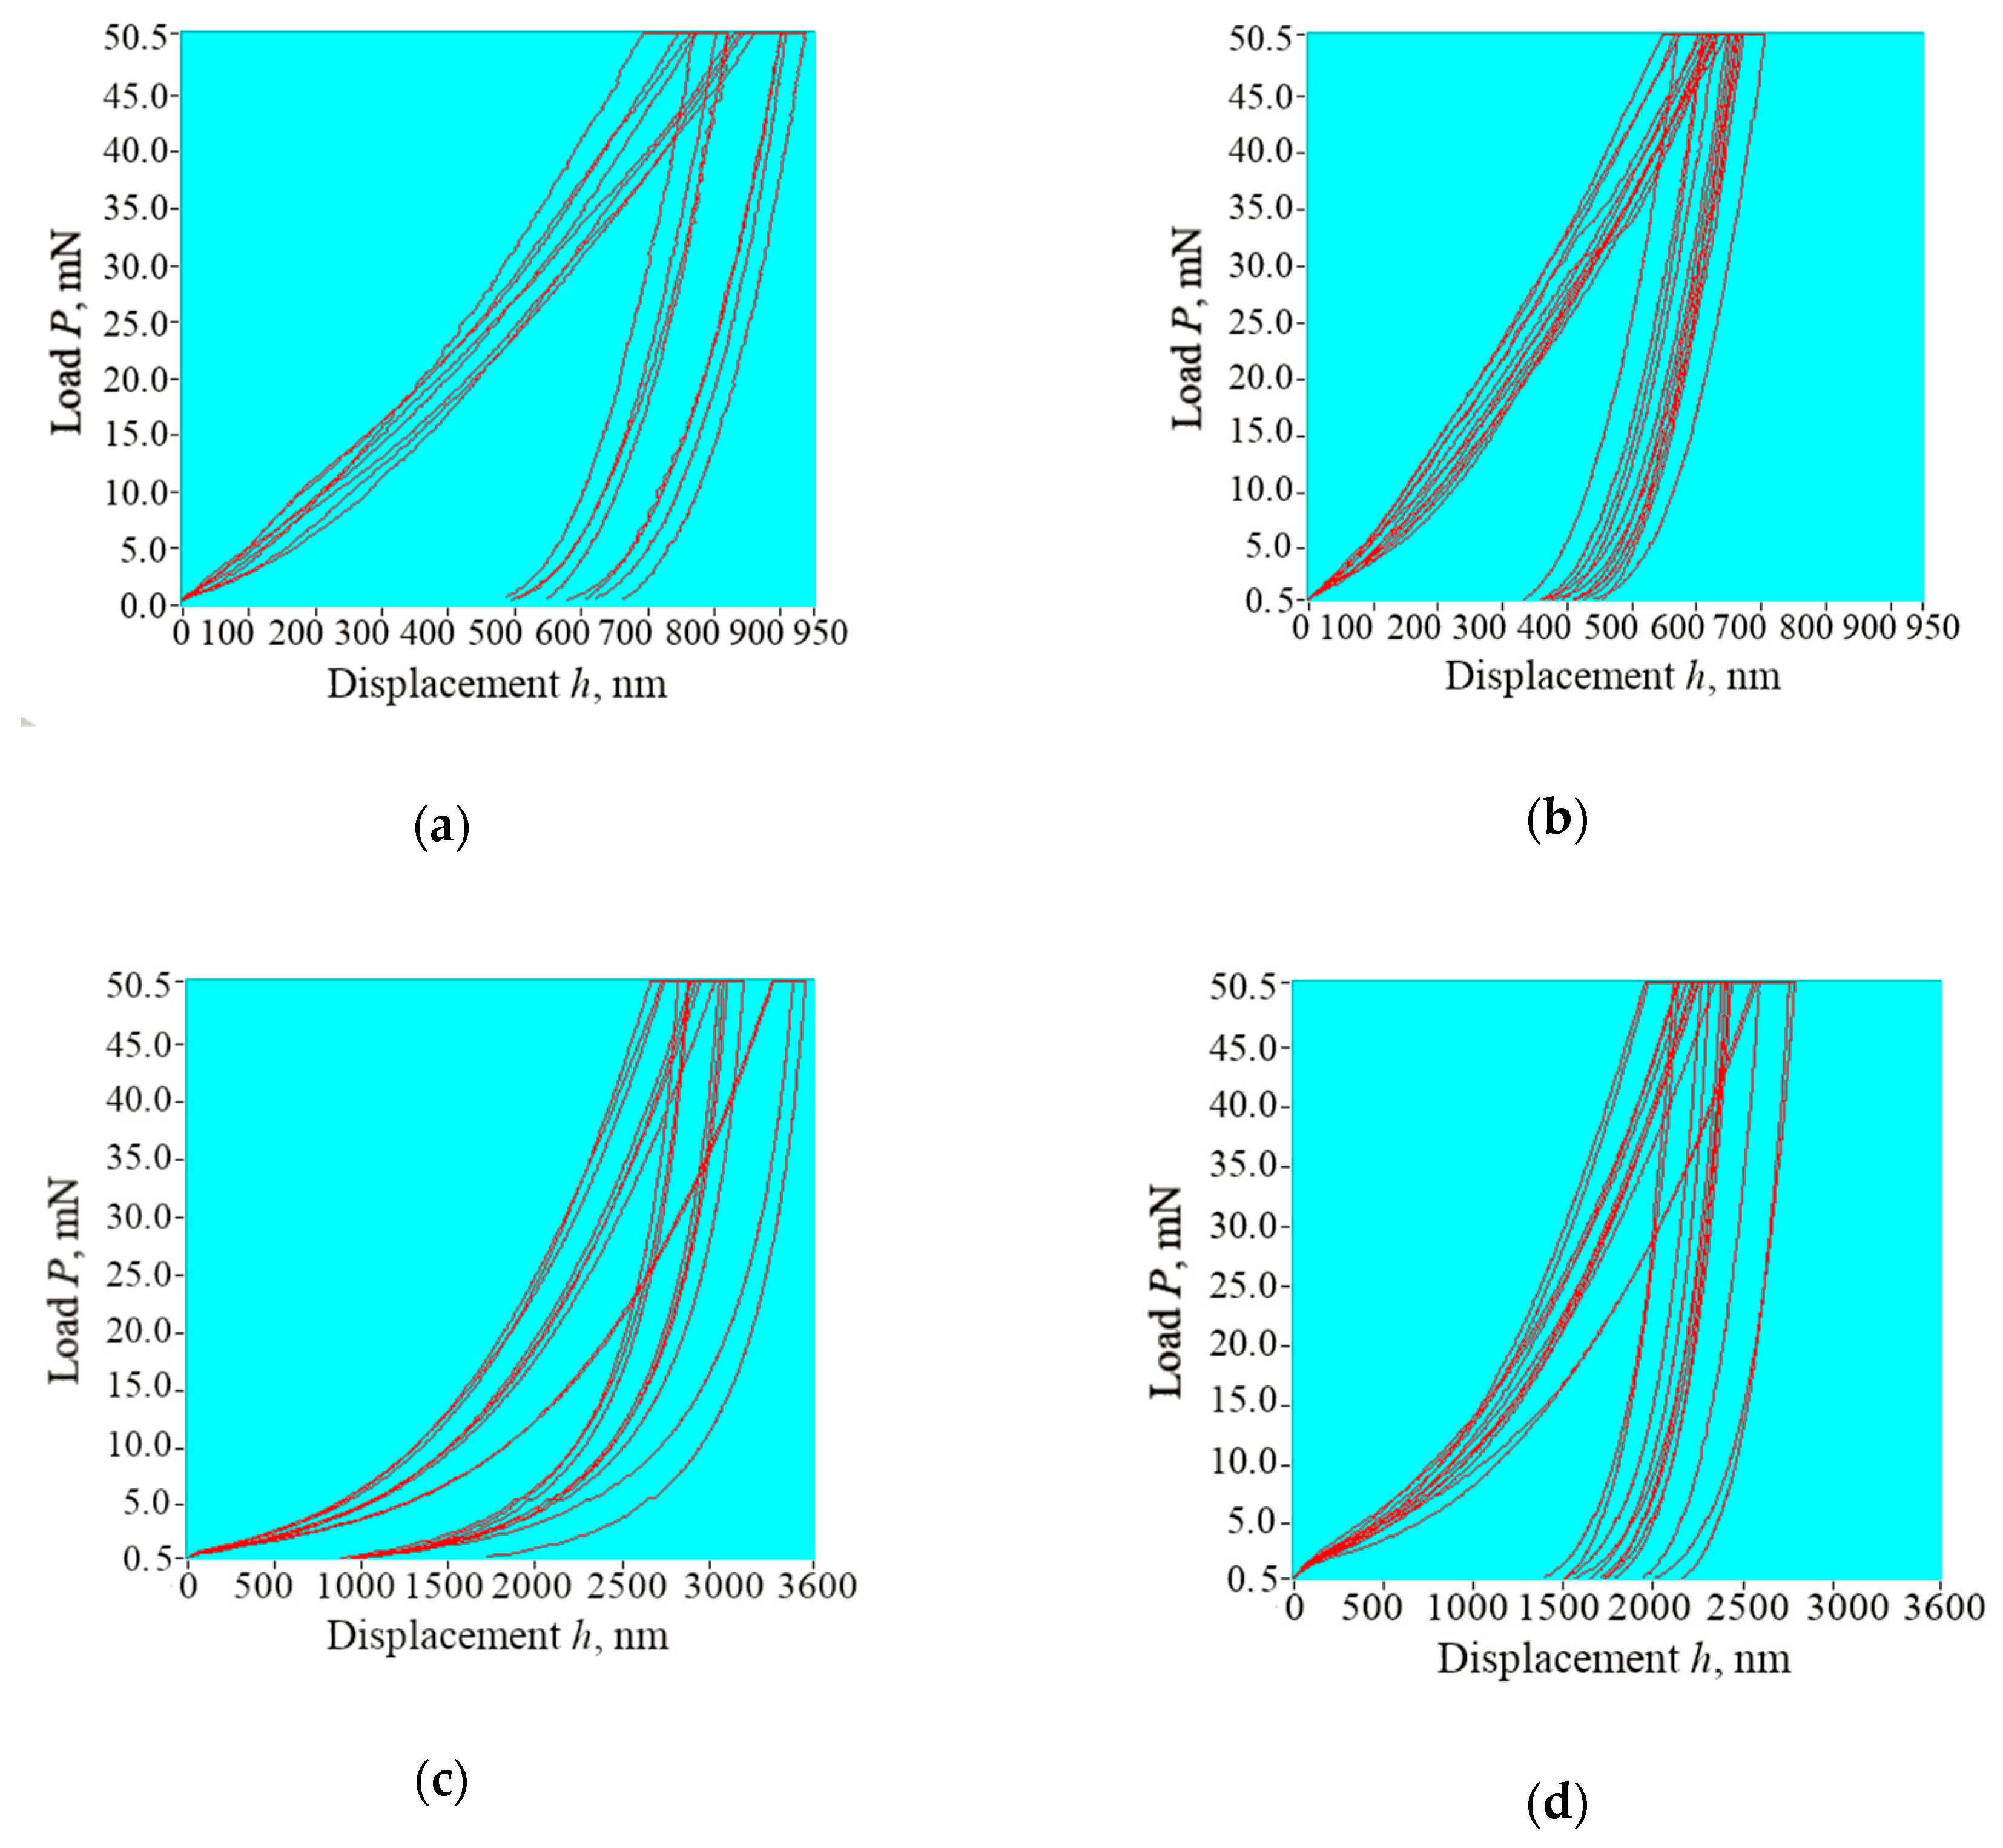
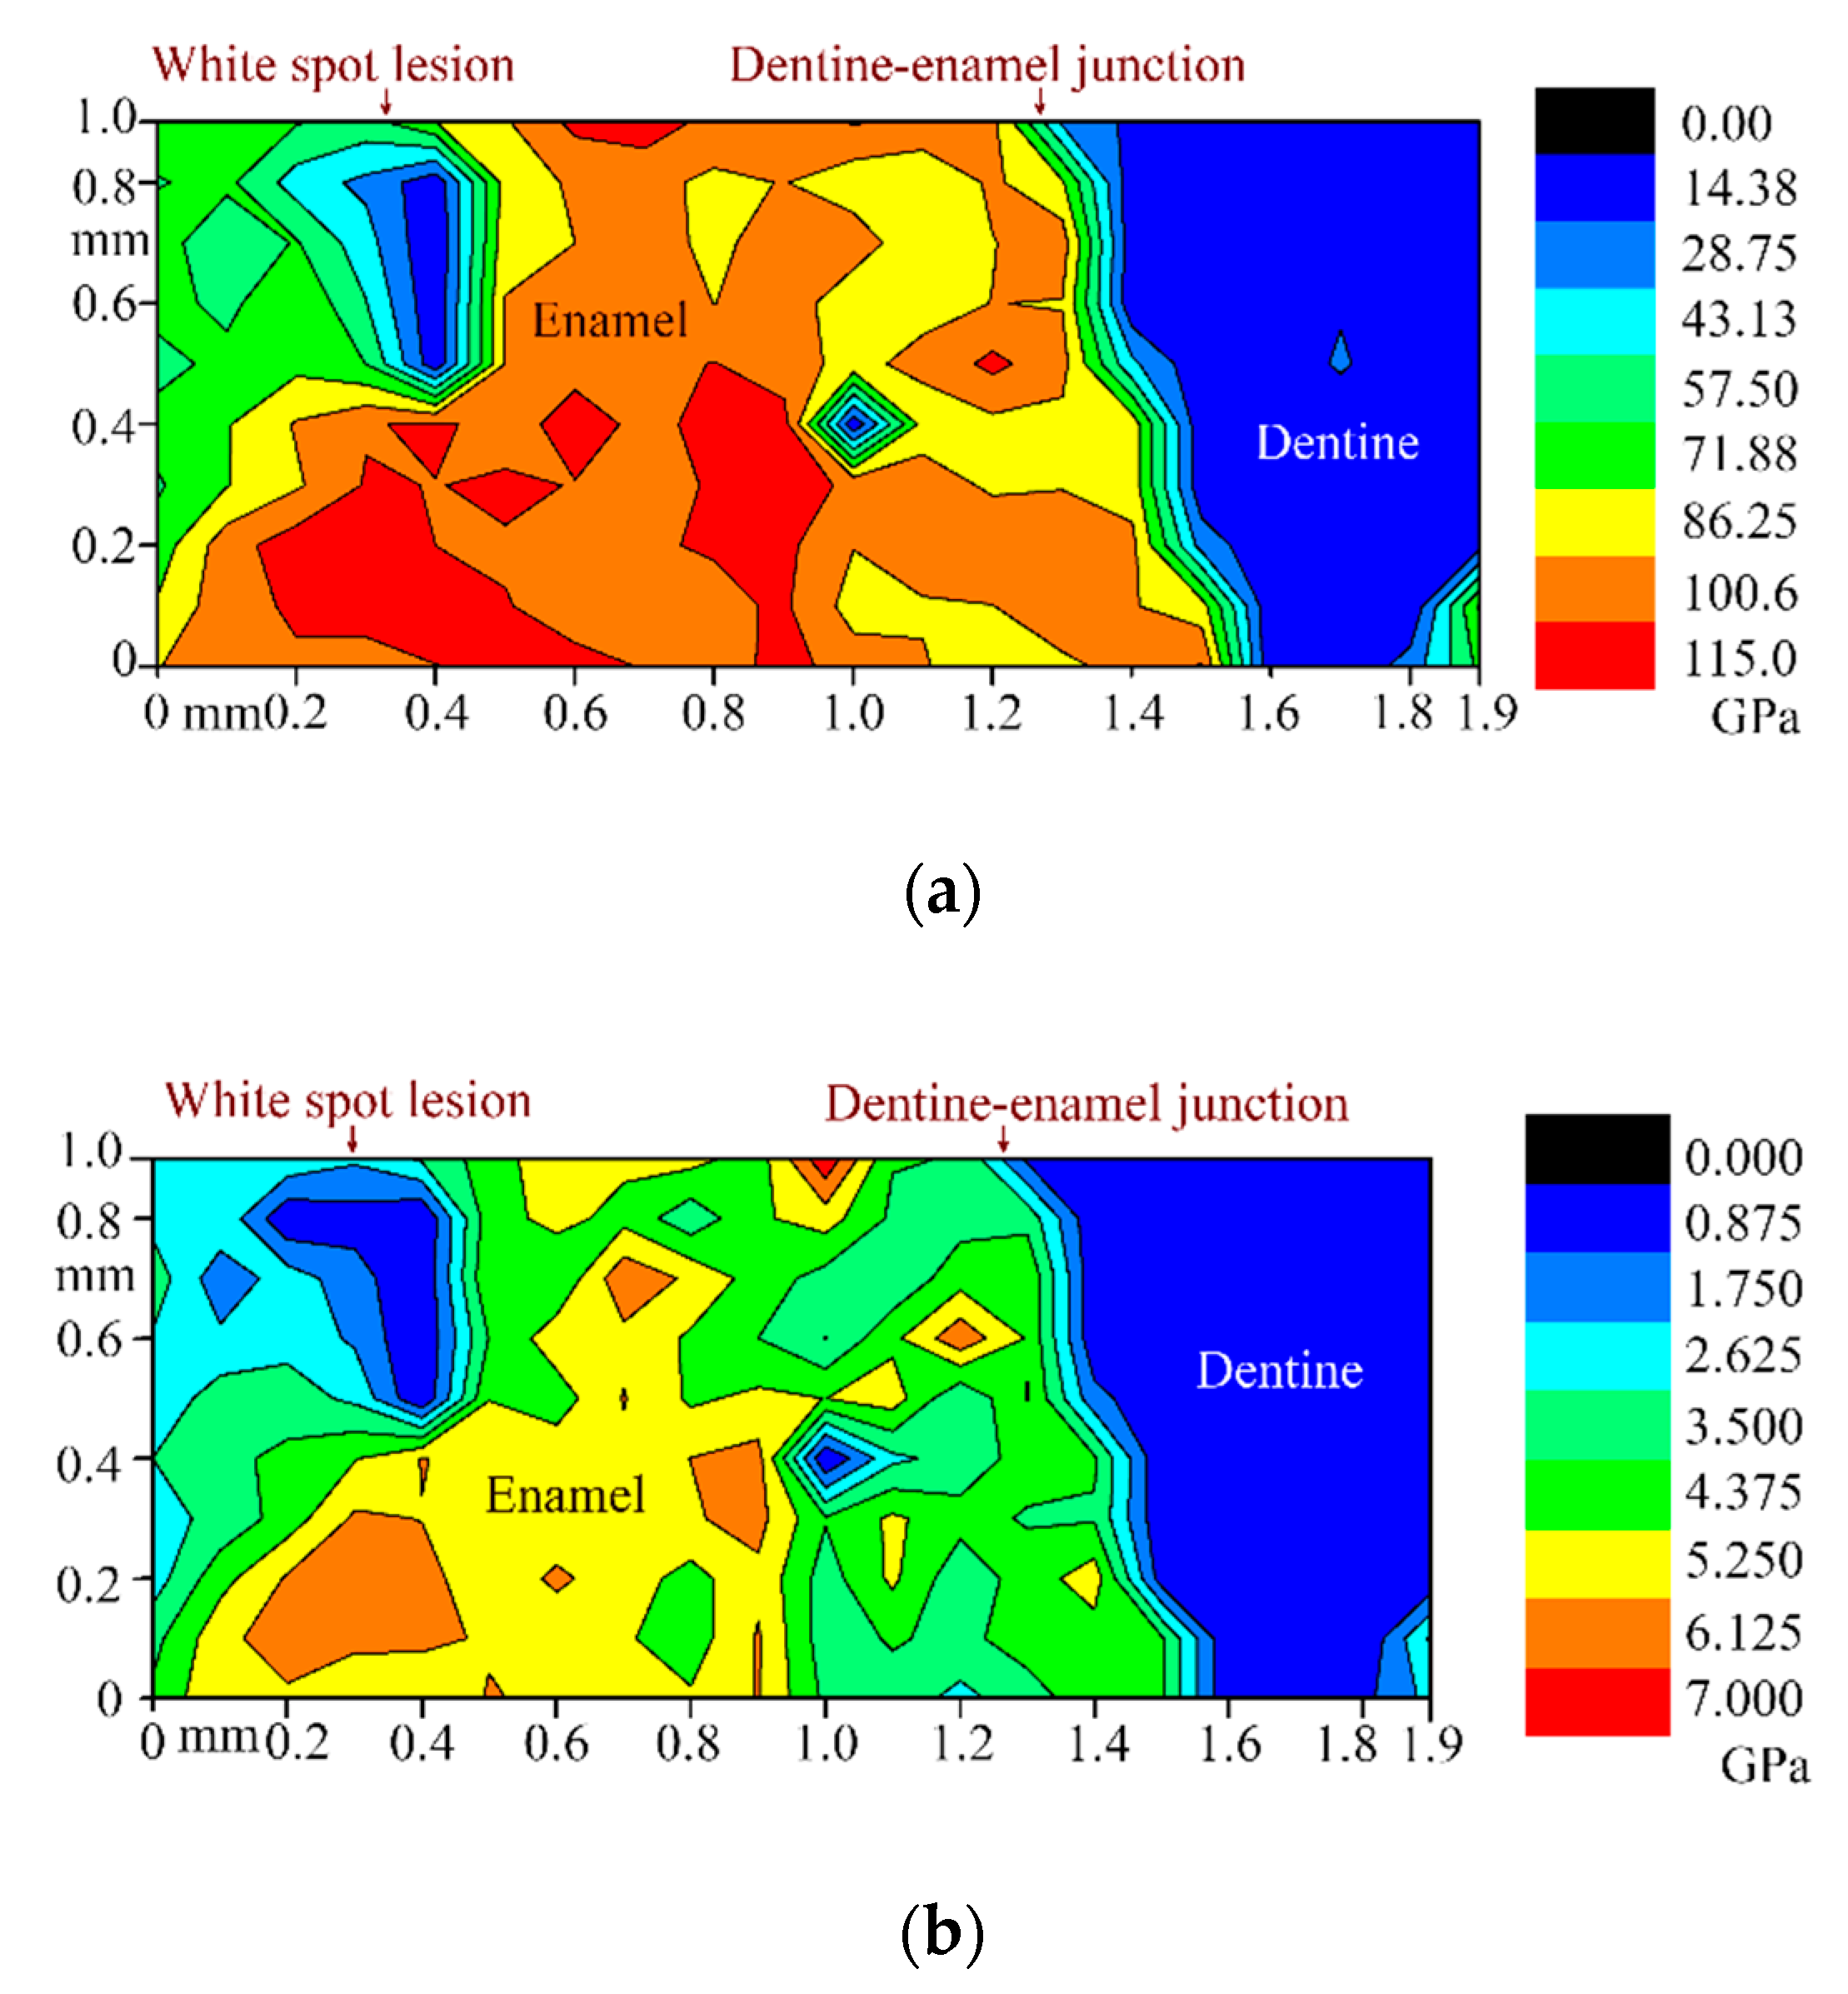
3.4. Nanoindentation
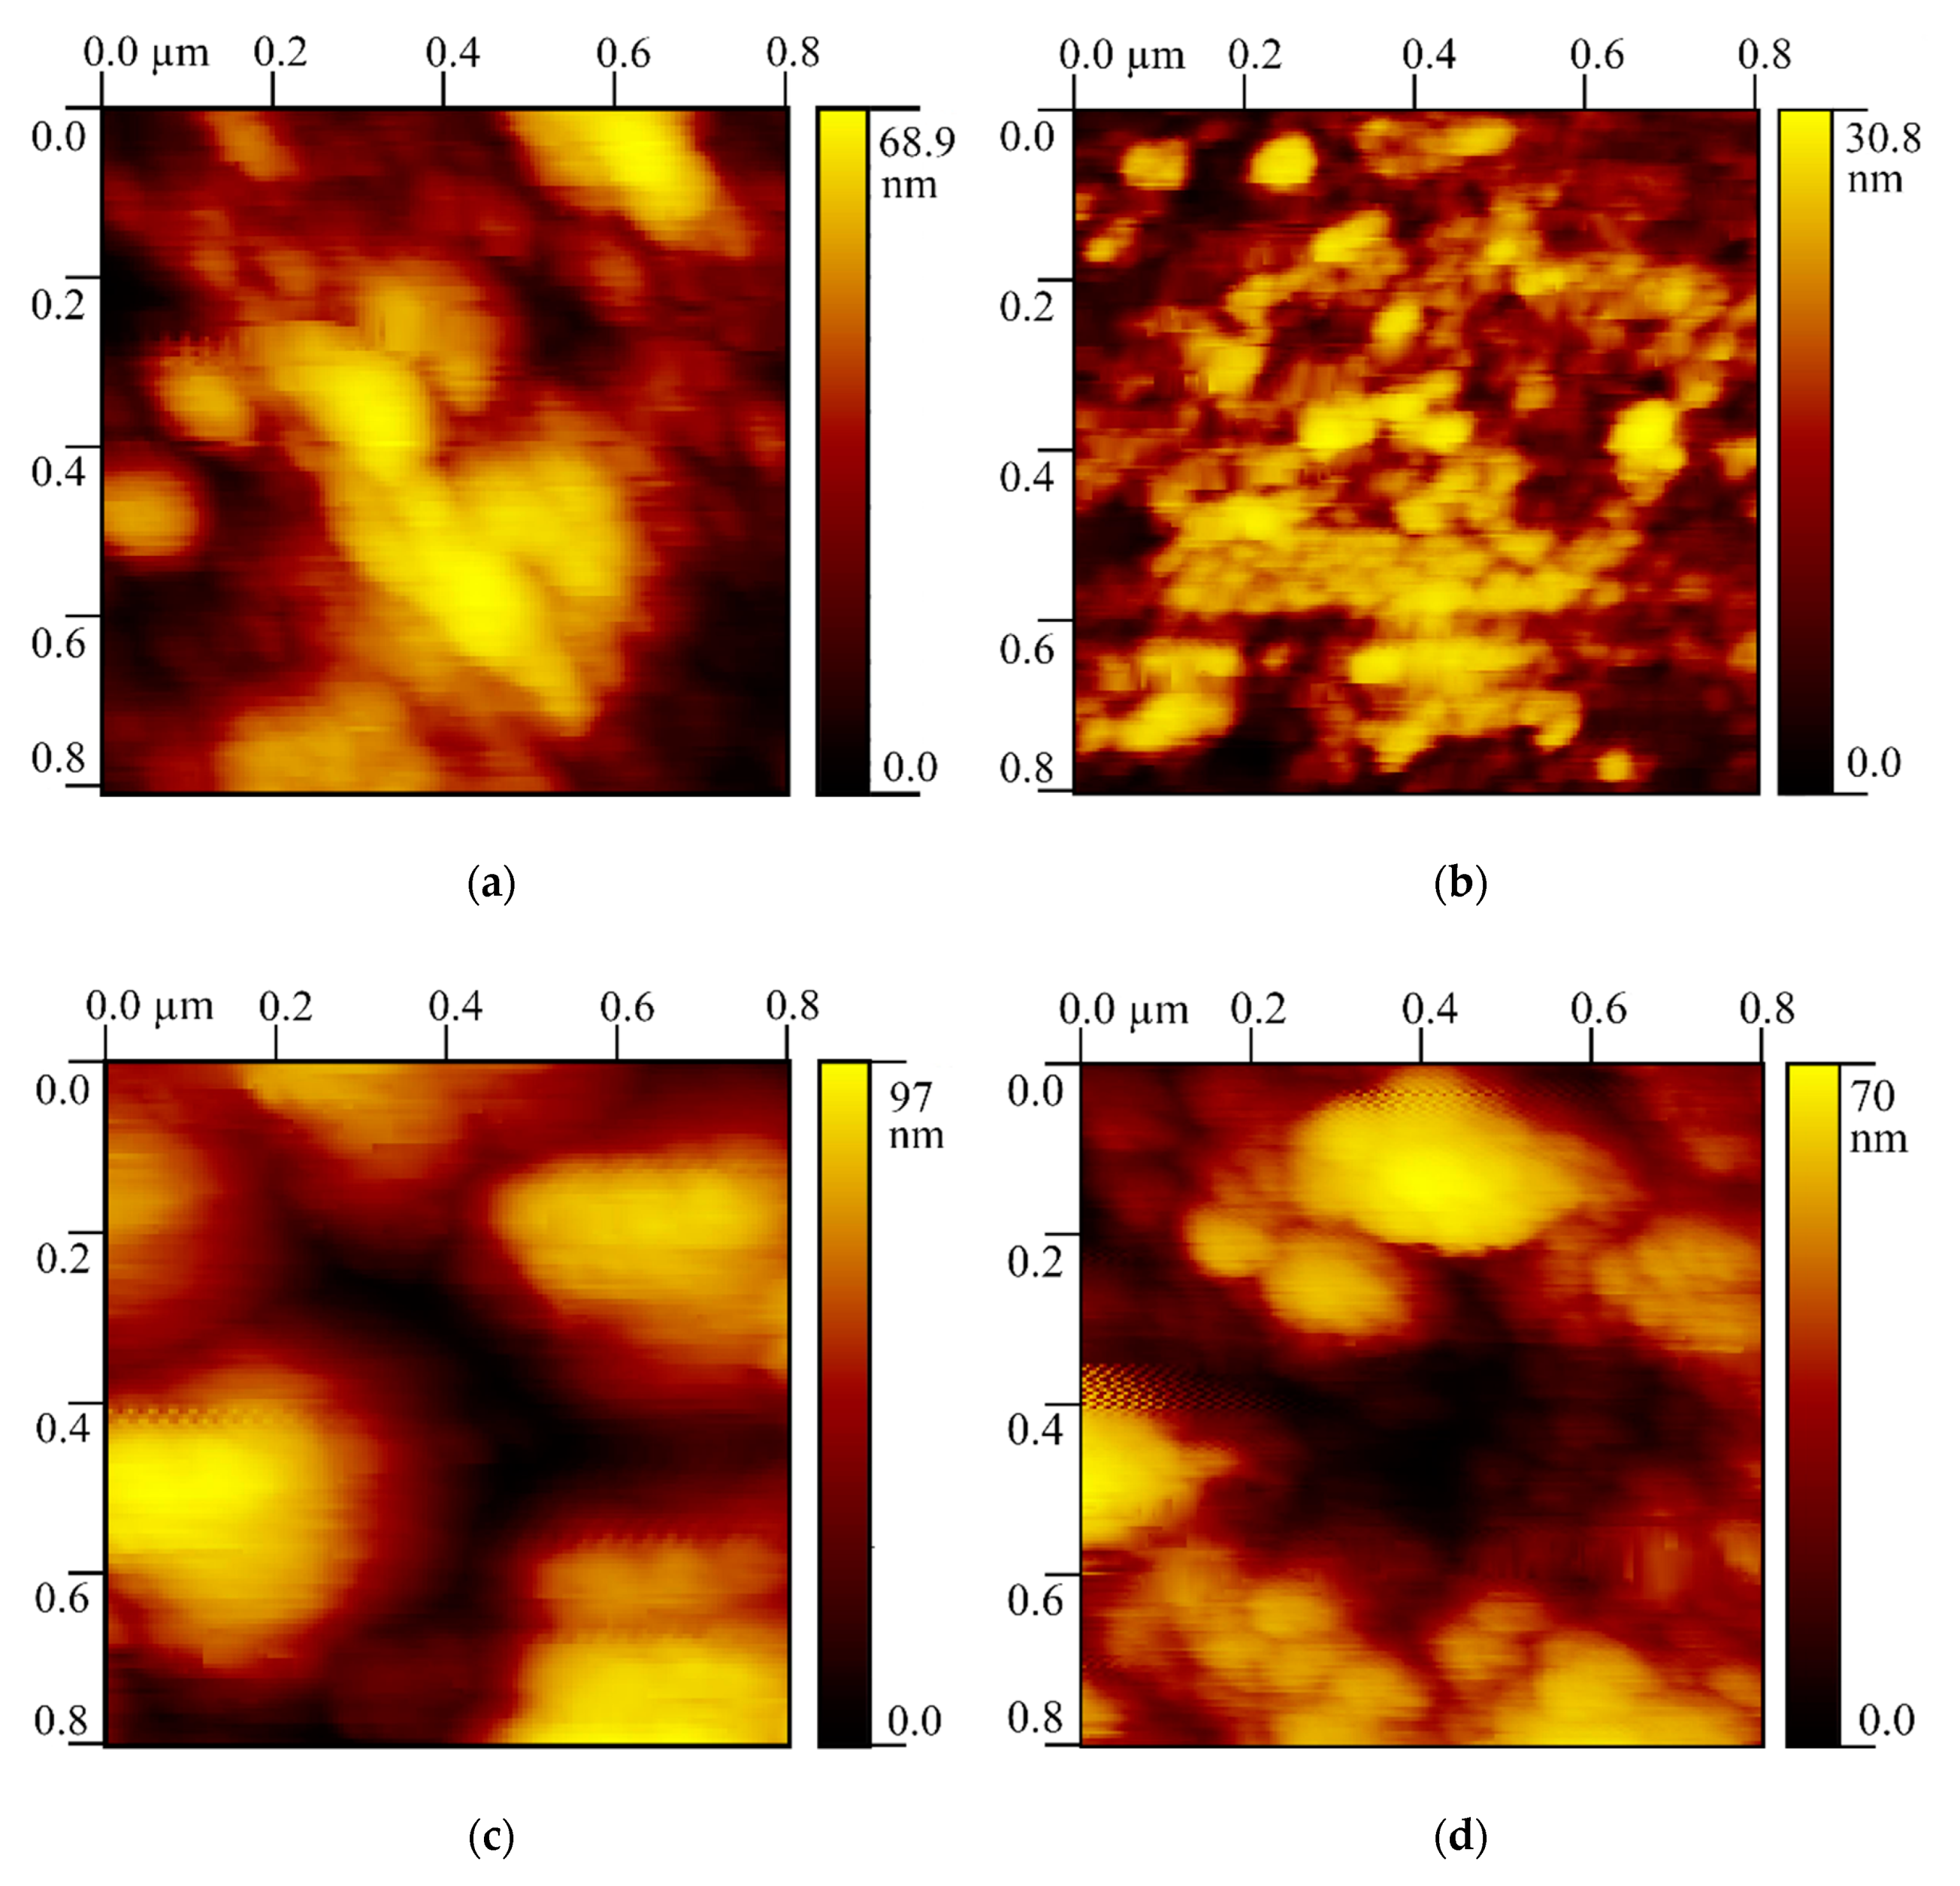
3.5. Atomic Force Microscopy
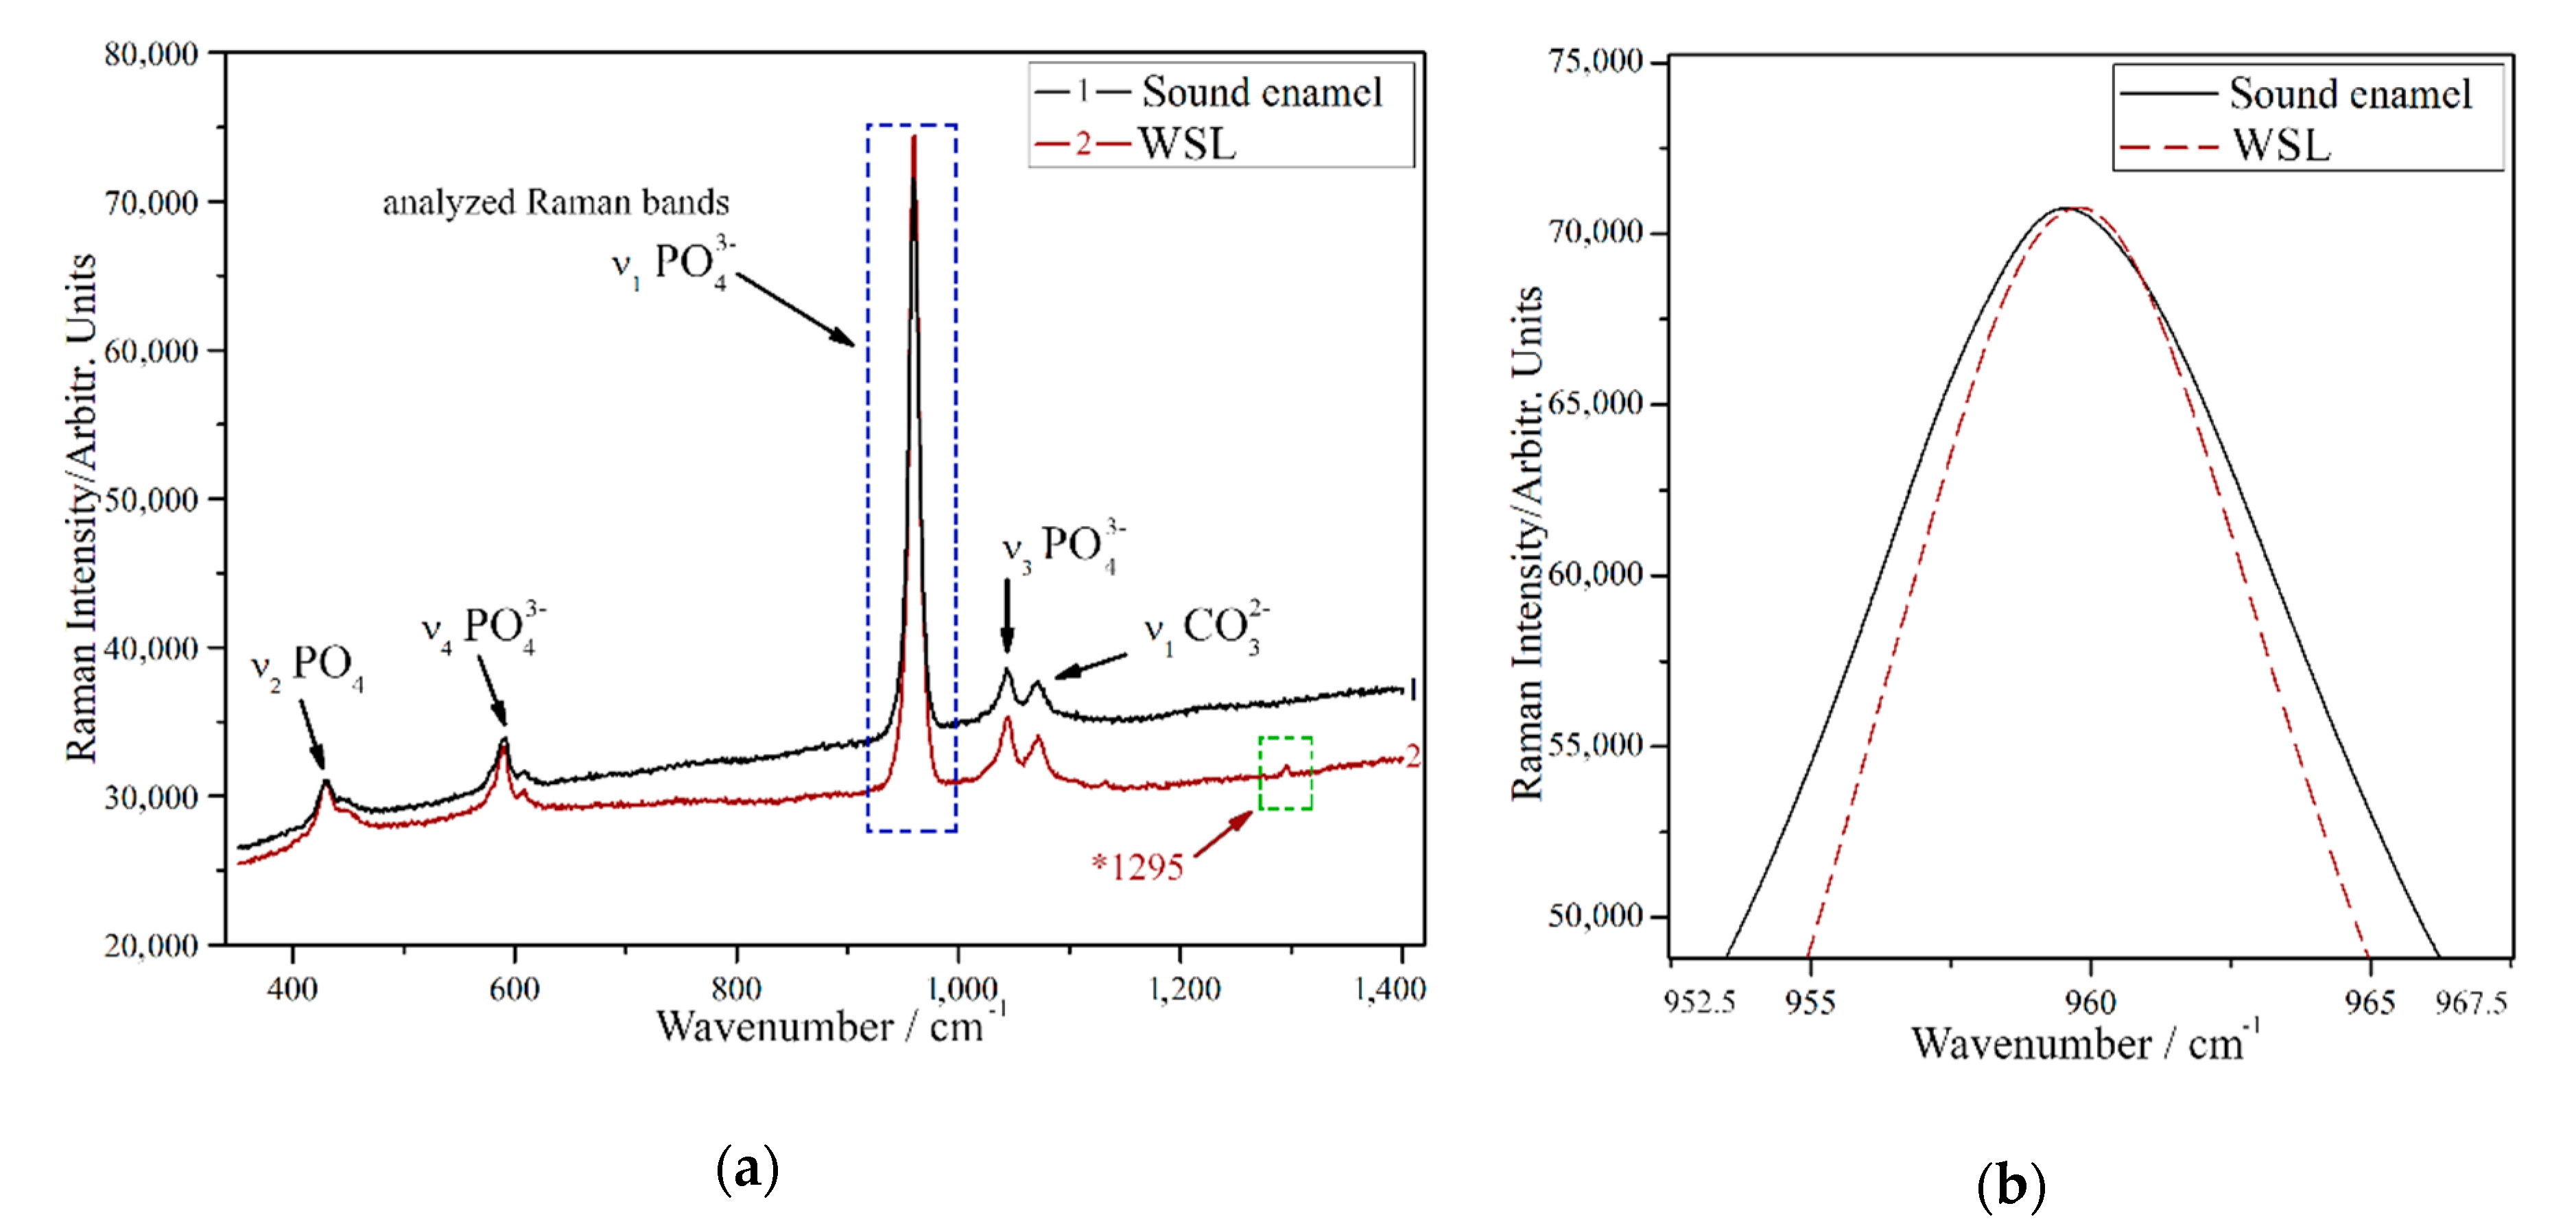
3.6. Raman Spectroscopy
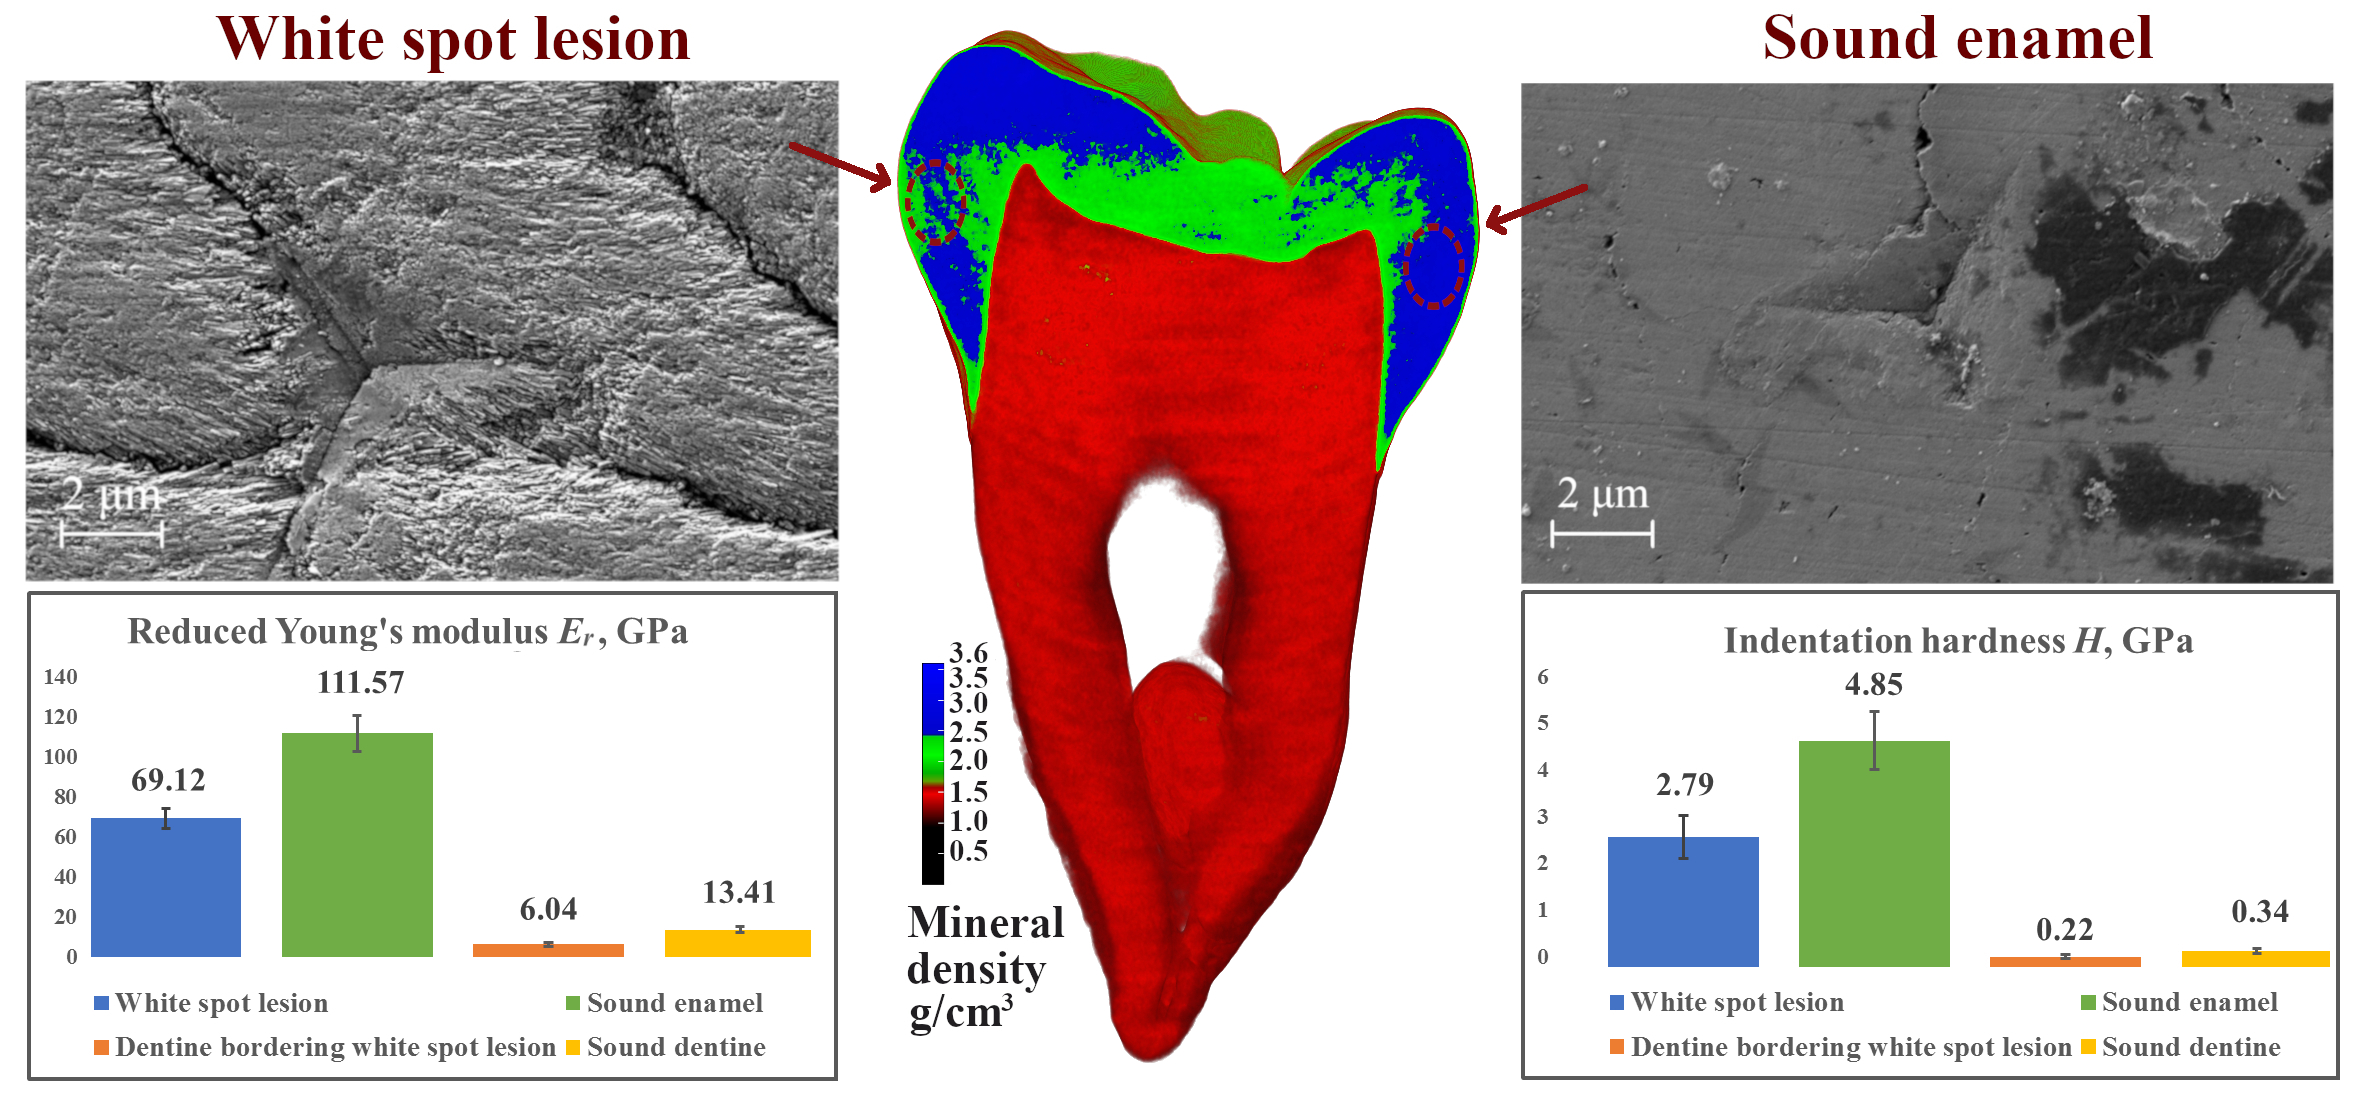
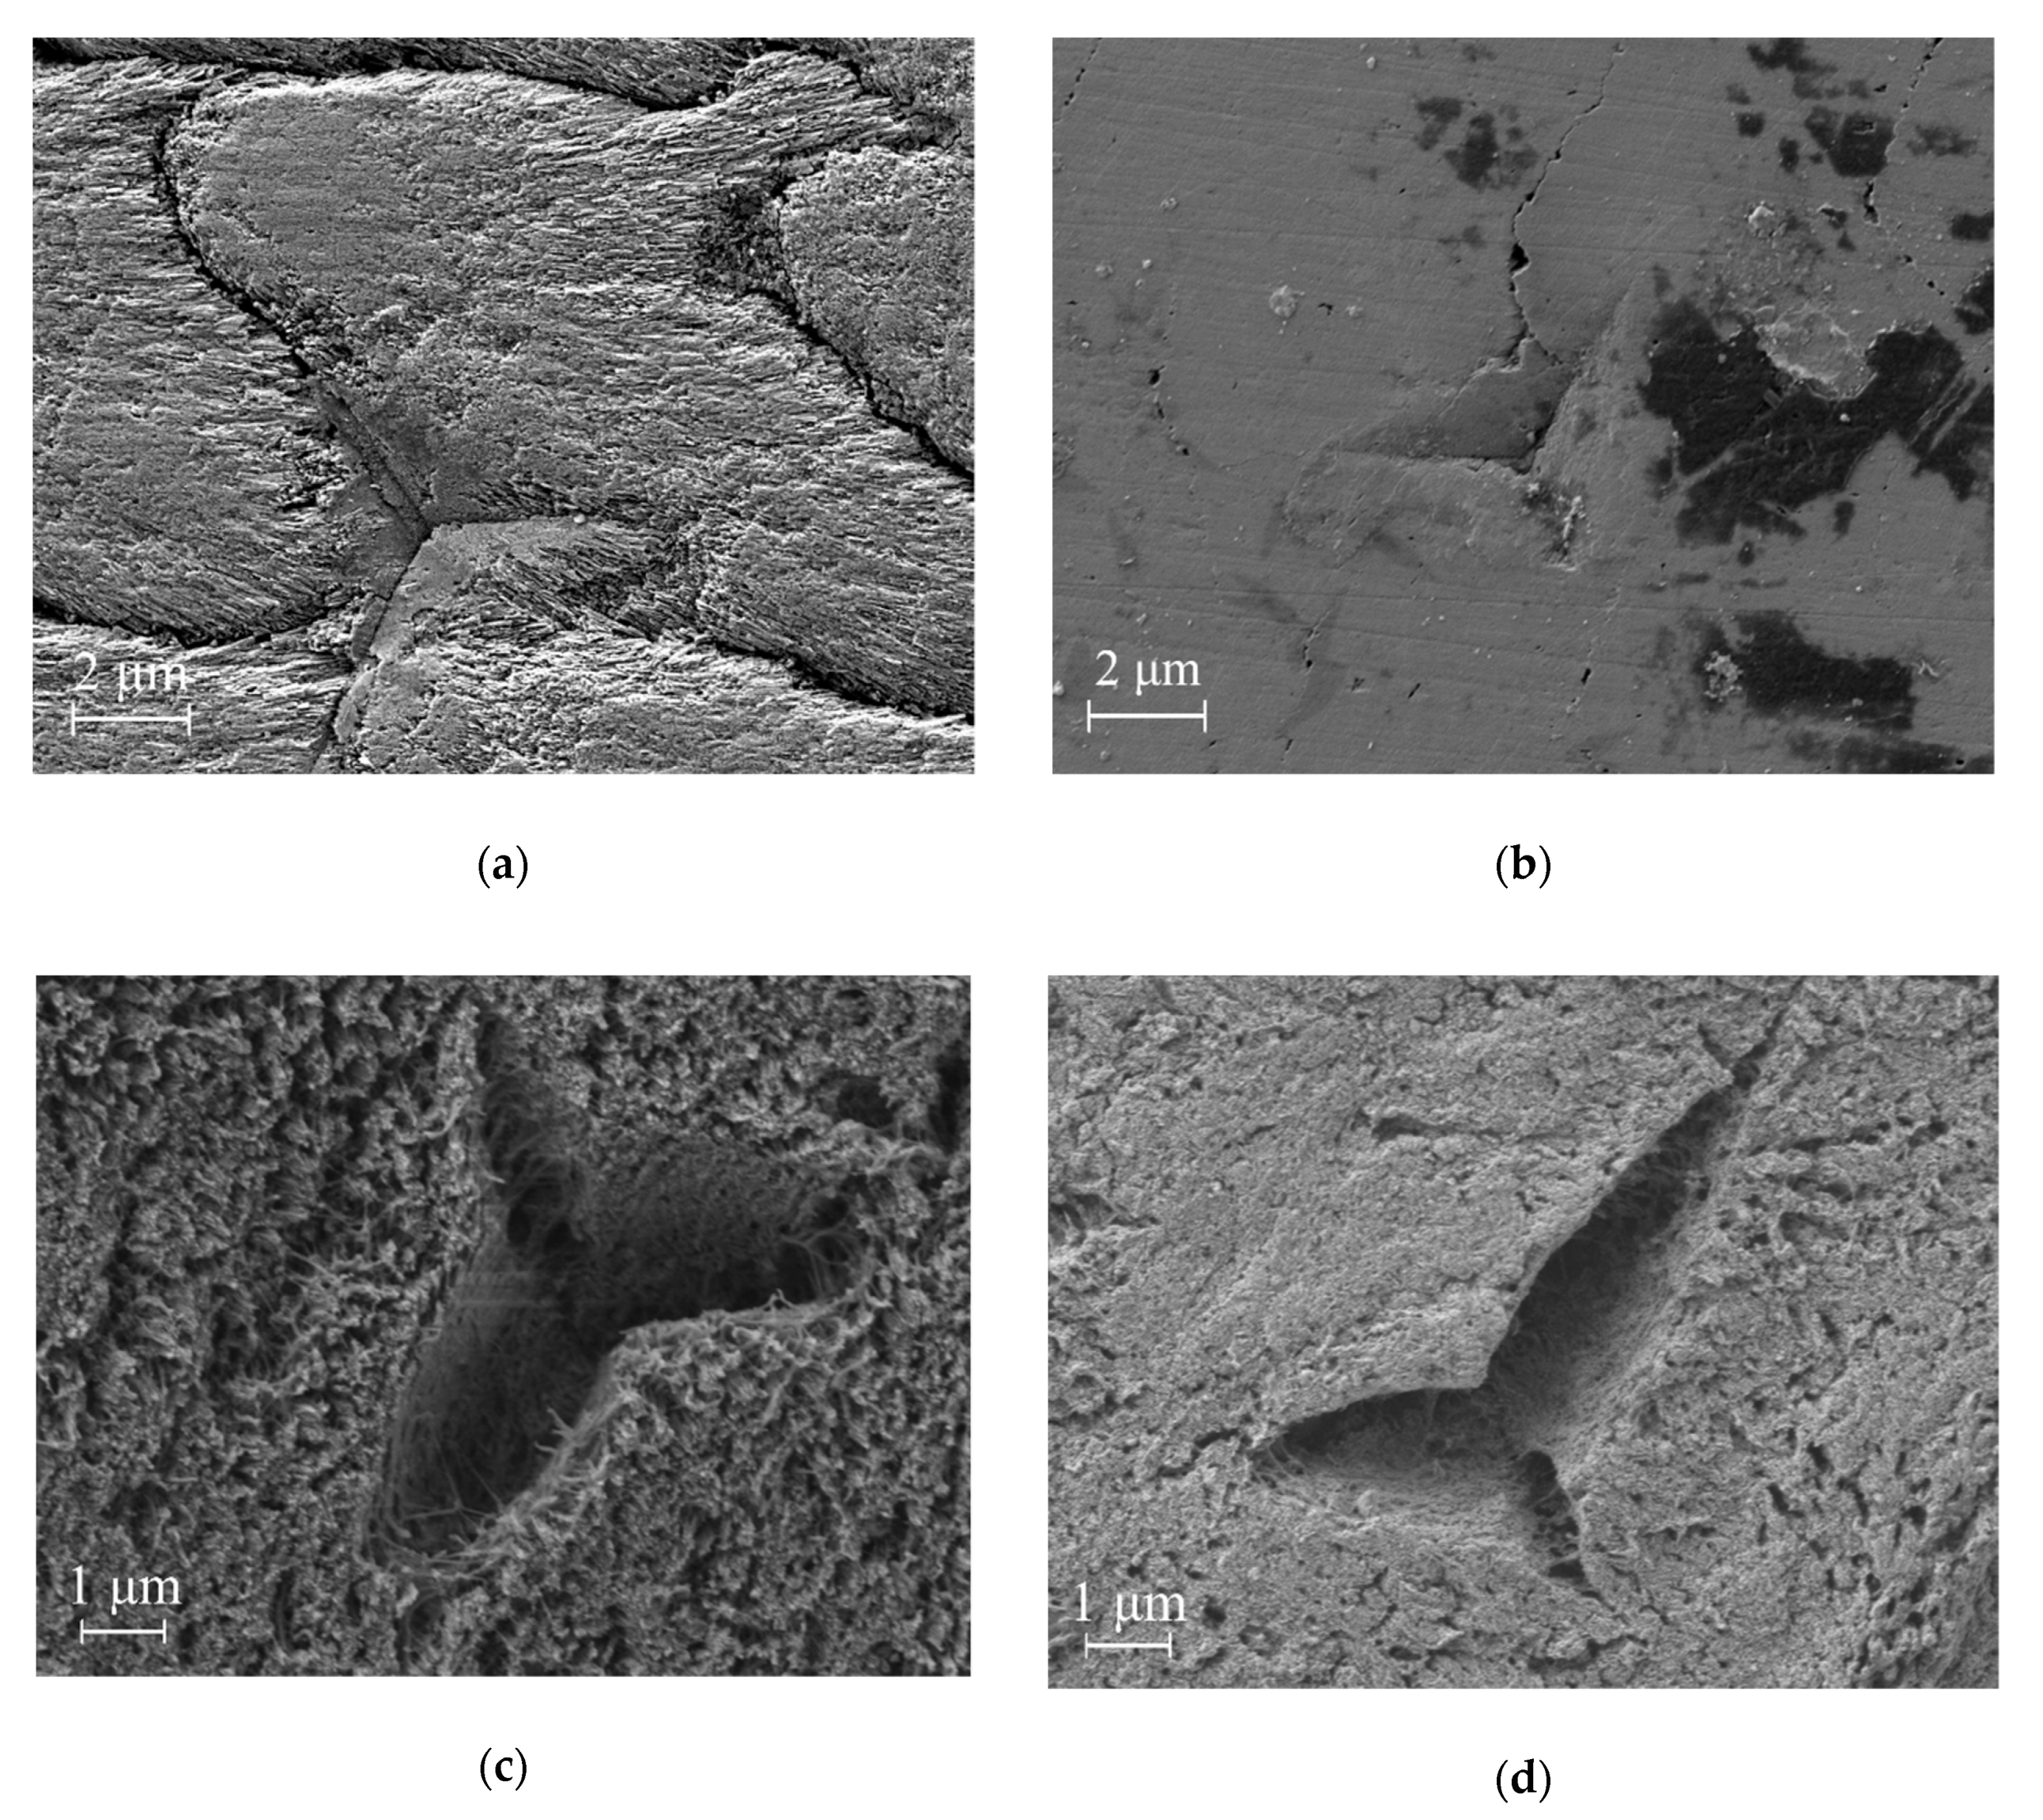
3.7. Scanning Electron Microscopy
4. Discussion
5. Conclusions
Author Contributions
Funding
Acknowledgments
Conflicts of Interest
References
- Syriopoulos, K.; Sanderink, G.C.; Velders, X.L.; Van Der Stelt, P.F. Radiographic detection of approximal caries: A comparison of dental films and digital imaging systems. Dentomaxillof. Radiol. 2000, 29, 312–318. [Google Scholar] [CrossRef]
- Shokri, A.; Kasraei, S.; Shokri, E.; Farhadian, M.; Hekmat, B. In vitro effect of changing the horizontal angulation of X-ray beam on the detection of proximal enamel caries in bitewing radiographs. Dent. Med. Probl. 2018, 55, 29–34. [Google Scholar] [CrossRef] [PubMed] [Green Version]
- Avery, J.K. Microradiographic and microhardness studies of developing enamel. Arch. Oral Biol. 1962, 7, 245–256. [Google Scholar] [CrossRef] [Green Version]
- Angker, L.; Swain, M.V.; Kilpatrick, N. Characterising the micro-mechanical behaviour of the carious dentine of primary teeth using nano-indentation. J. Biomech. 2005, 38, 1535–1542. [Google Scholar] [CrossRef]
- Biswas, N.; Mukhopadhyay, A.K.; Dey, A. Nanoindentation of Teeth: A Hard but Tough Hybrid Functionally Graded Composite. In Nanoindentation of Natural Materials, 1st ed.; Dey, A., Mukhopadhyay, A.K., Eds.; CRC Press: Boca Raton, FL, USA, 2019; pp. 85–108. [Google Scholar]
- Cochrane, N.J.; Cai, F.; Huq, N.L.; Burrow, M.F.; Reynolds, E.C. New approaches to enhanced remineralization of tooth enamel. J. Dent. Res. 2010, 89, 1187–1197. [Google Scholar] [CrossRef]
- Pires, P.M.; Dos Santos, T.P.; Fonseca-Gonçalves, A.; Pithon, M.M.; Lopes, R.T.; De Almeida Neves, A. A dual energy micro-CT methodology for visualization and quantification of biofilm formation and dentin demineralization. Arch. Oral Biol. 2018, 85, 10–15. [Google Scholar] [CrossRef]
- Songsiripradubboon, S.; Hamba, H.; Trairatvorakul, C.; Tagami, J. Sodium fluoride mouthrinse used twice daily increased incipient caries lesion remineralization in an in situ model. J. Dent. 2014, 42, 271–278. [Google Scholar] [CrossRef]
- Wang, Y.; Spencer, P.; Walker, M.P. Chemical profile of adhesive/caries-affected dentin interfaces using Raman microspectroscopy. J. Biomed. Mater. Res. A 2007, 81, 279–286. [Google Scholar] [CrossRef] [Green Version]
- Ramakrishnaiah, R.; Rehman, G.U.; Basavarajappa, S.; Al Khuraif, A.A.; Durgesh, B.H.; Khan, A.S.; Rehman, I.U. Applications of Raman spectroscopy in dentistry: Analysis of tooth structure. Appl. Spectrosc. Rev. 2015, 50, 332–350. [Google Scholar] [CrossRef]
- Park, H.J.; Kwon, T.Y.; Nam, S.H.; Kim, H.J.; Kim, K.H.; Kim, Y.J. Changes in bovine enamel after treatment with a 30% hydrogen peroxide bleaching agent. Dent. Mater. J. 2004, 23, 517–521. [Google Scholar] [CrossRef] [Green Version]
- Sadyrin, E.V.; Kislyakov, E.A.; Karotkiyan, R.V.; Yogina, D.V.; Drogan, E.G.; Swain, M.V.; Maksyukov, S.Y.; Nikolaev, A.L.; Aizikovich, S.M. Influence of Citric Acid Concentration and Etching Time on Enamel Surface Roughness of Prepared Human Tooth: In vitro Study. In Plasticity, Damage and Fracture in Advanced Materials, 1st ed.; Altenbach, H., Brünig, M., Kowalewski, Z., Eds.; Springer: Cham, Switzerland, 2020; pp. 135–150. [Google Scholar]
- Egerton, R.F.; Li, P.; Malac, M. Radiation damage in the TEM and SEM. Micron 2004, 35, 399–409. [Google Scholar] [CrossRef] [PubMed]
- Lippert, F.; Parker, D.M.; Jandt, K.D. In vitro demineralization/remineralization cycles at human tooth enamel surfaces investigated by AFM and nanoindentation. J. Colloid Interface Sci. 2004, 280, 442–448. [Google Scholar] [CrossRef] [PubMed]
- Zheng, L.; Hilton, J.F.; Habelitz, S.; Marshall, S.J.; Marshall, G.W. Dentin caries activity status related to hardness and elasticity. Eur. J. Oral Sci. 2003, 111, 243–252. [Google Scholar] [CrossRef] [PubMed]
- Yun, F.; Swain, M.V.; Chen, H.; Cairney, J.; Qu, J.; Sha, G.; Liu, H.; Ringer, S.P.; Han, Y.; Liu, L.; et al. Nanoscale pathways for human tooth decay–Central planar defect, organic-rich precipitate and high-angle grain boundary. Biomaterials 2020, 235, 119748. [Google Scholar] [CrossRef] [PubMed]
- Guerra, F.; Mazur, M.; Nardi, G.M.; Corridore, D.; Pasqualotto, D.; Rinado, F.; Ottolenghi, L. Dental hypomineralized enamel resin infiltration. Clinical indications and limits. Senses Sci. 2015, 2, 135–139. [Google Scholar]
- Harris, N.O.; Garcia-Godoy, F. Primary Preventive Dentistry, 6th ed.; Pearson Education: Upper Saddle River, NJ, USA, 2004; pp. 64–70. [Google Scholar]
- Huang, T.T.; He, L.H.; Darendeliler, M.A.; Swain, M.V. Correlation of mineral density and elastic modulus of natural enamel white spot lesions using X-ray microtomography and nanoindentation. Acta Biomater. 2010, 6, 4553–4559. [Google Scholar] [CrossRef]
- Ko, A.C.T.; Hewko, M.; Sowa, M.G.; Dong, C.C.; Cleghorn, B. Detection of early dental caries using polarized Raman spectroscopy. Opt. Express 2006, 14, 203–215. [Google Scholar] [CrossRef]
- Kinoshita, H.; Miyoshi, N.; Fukunaga, Y.; Ogawa, T.; Ogasawara, T.; Sano, K. Functional mapping of carious enamel in human teeth with Raman microspectroscopy. J. Raman Spectrosc. 2008, 39, 655–660. [Google Scholar] [CrossRef]
- Huang, T.T.Y.; He, L.H.; Darendeliler, M.A.; Swain, M.V. Nano-indentation characterisation of natural carious white spot lesions. Caries Res. 2010, 44, 101–107. [Google Scholar] [CrossRef]
- Metwally, N.; Niazy, M.; El-Malt, M. Remineralization of Early Carious Lesions using Biomimetic Selfassembling Peptides Versus Fluoride agent. (In vitro and In vivo study). Al-Azhar Dent. J. Girls 2017, 4, 179–188. [Google Scholar] [CrossRef] [Green Version]
- Başaran, G.; Veli, İ.; Başaran, E.G. Non-Cavitated approach for the treatment of white spot lesions: A case report. Int. Dent. Res. 2011, 1, 65–69. [Google Scholar] [CrossRef] [Green Version]
- Yuan, H.; Li, J.; Chen, L.; Cheng, L.; Cannon, R.D.; Mei, L. Esthetic comparison of white-spot lesion treatment modalities using spectrometry and fluorescence. Angle Orthod. 2014, 84, 343–349. [Google Scholar] [CrossRef] [PubMed]
- Eckstein, A.; Helms, H.J.; Knösel, M. Camouflage effects following resin infiltration of postorthodontic white-spot lesions in vivo: One-year follow-up. Angle Orthod. 2015, 85, 374–380. [Google Scholar] [CrossRef] [PubMed] [Green Version]
- Kim, S.; Kim, E.Y.; Jeong, T.S.; Kim, J.W. The evaluation of resin infiltration for masking labial enamel white spot lesions. Int. J. Paediatr. Dent. 2011, 21, 241–248. [Google Scholar] [CrossRef]
- Borges, A.B.; Caneppele, T.M.F.; Masterson, D.; Maia, L.C. Is resin infiltration an effective esthetic treatment for enamel development defects and white spot lesions? A systematic review. J. Dent. 2017, 56, 11–18. [Google Scholar] [CrossRef] [PubMed] [Green Version]
- Fejerskov, O.; Kidd, E. Dental Caries: The Disease and Its Clinical Management, 2nd ed.; Blackwell Munksgaard: Oxford, UK, 2008; pp. 220–222. [Google Scholar]
- Fisher, J.; Glick, M. FDI world dental federation science committee. A new model for caries classification and management: The FDI World Dental Federation caries matrix. J. Am. Dent. Assoc. 2012, 143, 546–551. [Google Scholar] [CrossRef] [PubMed]
- Longbottom, C.L.; Huysmans, M.C.; Pitts, N.; Fontana, M. Glossary of key terms. In Detection, Assessment, Diagnosis and Monitoring of Caries, 1st ed.; Pitts, N.B., Ed.; Karger: Basel, Switzerland, 2009; pp. 209–216. [Google Scholar]
- Park, S.; Wang, D.H.; Zhang, D.; Romberg, E.; Arola, D. Mechanical properties of human enamel as a function of age and location in the tooth. J. Mater. Sci. Mater. Med. 2008, 19, 2317–2324. [Google Scholar] [CrossRef]
- Wychowanski, P.; Malkiewicz, K. Evaluation of metal ion concentration in hard tissues of teeth in residents of central Poland. BioMed Res. Int. 2017, 2017, 6419709. [Google Scholar] [CrossRef]
- Kamberi, B.; Kqiku, L.; Hoxha, V.; Dragusha, E. Lead concentrations in teeth from people living in Kosovo and Austria. Coll. Antropol. 2011, 35, 79–82. [Google Scholar]
- Oliver, W.C.; Pharr, G.M. An improved technique for determining hardness and elastic modulus using load and displacement sensing indentation experiments. J. Mater. Res. 1992, 7, 1564–1583. [Google Scholar] [CrossRef]
- Alyahya, A.; Alqareer, A.; Swain, M. Microcomputed Tomography Calibration Using Polymers and Minerals for Enamel Mineral Content Quantitation. Med. Princ. Pract. 2019, 28, 247–255. [Google Scholar] [CrossRef] [PubMed]
- Zou, W.; Hunter, N.; Swain, M.V. Application of polychromatic µCT for mineral density determination. J. Dent. Res. 2011, 90, 18–30. [Google Scholar] [CrossRef] [PubMed] [Green Version]
- King, R.B. Elastic analysis of some punch problems for a layered medium. Int. J. Solids Struct. 1987, 23, 1657–1664. [Google Scholar] [CrossRef]
- Bertassoni, L.E.; Swain, M.V. Removal of dentin non-collagenous structures results in the unraveling of microfibril bundles in collagen type I. Connect. Tissue Res. 2017, 58, 414–423. [Google Scholar] [CrossRef] [PubMed]
- Inoue, S.; Abe, Y.; Yoshida, Y.; De Munck, J.; Sano, H.; Suzuki, K.; Lambrechts, P.; Van Meerbeek, B. Effect of conditioner on bond strength of glass-ionomer adhesive to dentin/enamel with and without smear layer interposition. Oper. Dent. 2004, 29, 685–692. [Google Scholar]
- Xue, J.; Li, W.; Swain, M.V. In vitro demineralization of human enamel natural and abraded surfaces: A micromechanical and SEM investigation. J. Dent. 2009, 37, 264–272. [Google Scholar] [CrossRef]
- Cuy, J.L.; Mann, A.B.; Livi, K.J.; Teaford, M.F.; Weihs, T.P. Nanoindentation mapping of the mechanical properties of human molar tooth enamel. Arch. Oral Biol. 2002, 47, 281–291. [Google Scholar] [CrossRef]
- Habelitz, S.; Marshall, S.J.; Marshall, G.W., Jr.; Balooch, M. Mechanical properties of human dental enamel on the nanometre scale. Arch. Oral Biol. 2001, 46, 173–183. [Google Scholar] [CrossRef]
- He, L.H.; Fujisawa, N.; Swain, M.V. Elastic modulus and stress–strain response of human enamel by nano-indentation. Biomaterials 2006, 27, 4388–4398. [Google Scholar] [CrossRef]
- Fong, H.; Sarikaya, M.; White, S.N.; Snead, M.L. Nano-mechanical properties profiles across dentin–enamel junction of human incisor teeth. Mater. Sci. Eng. C Mater. Biol. Appl. 1999, 7, 119–128. [Google Scholar] [CrossRef]
- Yanagisawa, T.; Miake, Y. High-resolution electron microscopy of enamel-crystal demineralization and remineralization in carious lesions. Microscopy 2003, 52, 605–613. [Google Scholar] [CrossRef] [PubMed]
- Angker, L.; Nijhof, N.; Swain, M.V.; Kilpatrick, N.M. Influence of hydration and mechanical characterization of carious primary dentine using an ultra-micro indentation system (UMIS). Eur. J. Oral Sci. 2004, 112, 231–236. [Google Scholar] [CrossRef] [PubMed]
- Stankoska, K.; Sarram, L.; Smith, S.; Bedran-Russo, A.K.; Little, C.B.; Swain, M.V.; Bertassoni, L.E. Immunolocalization and distribution of proteoglycans in carious dentine. Aust. Dent. J. 2016, 61, 288–297. [Google Scholar] [CrossRef] [PubMed]
- Bajaj, D.; Arola, D.D. On the R-curve behavior of human tooth enamel. Biomaterials 2009, 30, 4037–4046. [Google Scholar] [CrossRef] [Green Version]
- Ang, S.F.; Bortel, E.L.; Swain, M.V.; Klocke, A.; Schneider, G.A. Size-dependent elastic/inelastic behavior of enamel over millimeter and nanometer length scales. Biomaterials 2010, 31, 1955–1963. [Google Scholar] [CrossRef] [Green Version]
- Maas, M.C.; Dumont, E.R. Built to last: The structure, function, and evolution of primate dental enamel. Evol. Anthropol. 1999, 8, 133–152. [Google Scholar] [CrossRef]
- Pietrzyńska, M.; Zembrzuska, J.; Tomczak, R.; Mikołajczyk, J.; Rusińska-Roszak, D.; Voelkel, A.; Buchwald, T.; Jampílek, J.; Lukáč, M.; Devínsky, F. Experimental and in silico investigations of organic phosphates and phosphonates sorption on polymer-ceramic monolithic materials and hydroxyapatite. Eur. J. Pharm. Sci. 2016, 93, 295–303. [Google Scholar] [CrossRef]
- Chun-Te Ko, A.; Hewko, M.D.; Leonardi, L.; Sowa, M.G.; Dong, C.C.; Williams, P.; Cleghorn, B. Ex vivo detection and characterization of early dental caries by optical coherence tomography and Raman spectroscopy. J. Biomed. Opt. 2005, 10, 31118. [Google Scholar]
- Buchwald, T.; Okulus, Z.; Szybowicz, M. Raman spectroscopy as a tool of early dental caries detection–new insights. J. Raman Spectrosc. 2017, 48, 1094–1102. [Google Scholar] [CrossRef]
- Natarajan, A.K.; Fraser, S.J.; Swain, M.V.; Drummond, B.K.; Gordon, K.C. Raman spectroscopic characterisation of resin-infiltrated hypomineralised enamel. Anal. Bioanal. Chem. 2015, 407, 5661–5671. [Google Scholar] [CrossRef]
- Penel, G.; Delfosse, C.; Descamps, M.; Leroy, G. Composition of bone and apatitic biomaterials as revealed by intravital Raman microspectroscopy. Bone 2005, 36, 893–901. [Google Scholar] [CrossRef] [PubMed]
- La Fontaine, A.; Zavgorodniy, A.; Liu, H.; Zheng, R.; Swain, M.; Cairney, J. Atomic-scale compositional mapping reveals Mg-rich amorphous calcium phosphate in human dental enamel. Sci. Adv. 2016, 2, e1601145. [Google Scholar] [CrossRef] [PubMed] [Green Version]
- Yang, X.; Wang, L.; Qin, Y.; Sun, Z.; Henneman, Z.J.; Moradian-Oldak, J.; Nancollas, G.H. How amelogenin orchestrates the organization of hierarchical elongated microstructures of apatite. J. Phys. Chem. B 2010, 114, 2293–2300. [Google Scholar] [CrossRef] [PubMed] [Green Version]
- Tohda, H.; Takuma, S.; Tanaka, N. Intracrystalline structure of enamel crystals affected by caries. J. Dent. Res. 1987, 66, 1647–1653. [Google Scholar] [CrossRef]
- Timchenko, E.V.; Timchenko, P.E.; Volova, L.T.; Rosenbaum, A.Y.; Kulabukhova, A.Y.; Zherdeva, L.A.; Nefedova, I.F. Application of Raman spectroscopy method to the diagnostics of caries development. J. Biomed. Photonics Eng. 2015, 1, 201–205. [Google Scholar] [CrossRef]
- Akkus, A.; Yang, S.; Akkus, O.; Lang, L. A portable confocal fiber optic raman spectrometer concept for evaluation of mineral content within enamel tissue. J. Oper. Esthet. Dent. 2016, 1, 1–5. [Google Scholar]
- Yakubu, E.; Li, B.; Duan, Y.; Yang, S. Full-scale Raman imaging for dental caries detection. Biomed. Opt. Express 2018, 9, 6009–6016. [Google Scholar] [CrossRef]
- Okagbare, P.I.; Esmonde-White, F.W.; Goldstein, S.A.; Morris, M.D. Development of non-invasive Raman spectroscopy for in vivo evaluation of bone graft osseointegration in a rat model. Analyst 2010, 135, 3142–3146. [Google Scholar] [CrossRef] [Green Version]
- Ando, M.; Liao, C.S.; Eckert, G.J.; Cheng, J.X. Imaging of demineralized enamel in intact tooth by epidetected stimulated Raman scattering microscopy. J. Biomed. Opt. 2018, 23, 105005. [Google Scholar] [CrossRef]


| Filter | Group | Area | Mineral Density, g/cm3 | Standard Deviation, g/cm3 |
|---|---|---|---|---|
| Al+Cu | WSL | Enamel | 2.21 | 0.06 |
| Dentine | 1.21 | 0.06 | ||
| Sound | Enamel | 2.33 | 0.08 | |
| Dentine | 1.21 | 0.03 | ||
| Cu | WSL | Enamel | 2.35 | 0.07 |
| Dentine | 1.29 | 0.05 | ||
| Sound | Enamel | 2.47 | 0.08 | |
| Dentine | 1.31 | 0.06 |
| Group | Area | Reduced Young’s Modulus Er, GPa | Indentation Hardness H, GPa | Indentation Creep, nm |
|---|---|---|---|---|
| WSL | Enamel | 69.12 ± 4.97 | 2.79 ± 0.46 | 64.60 ± 18.00 |
| Dentine | 6.04 ± 0.78 | 0.22 ± 0.04 | 155.22 ± 23.24 | |
| Sound | Enamel | 111.57 ± 8.95 | 4.85 ± 0.62 | 38.16 ± 9.92 |
| Dentine | 13.41 ± 1.55 | 0.34 ± 0.06 | 175.96 ± 41.20 |
| Tooth Area | Average Ra by 15 Profiles, nm | Standard Deviation, nm | Rt, nm |
|---|---|---|---|
| Natural enamel WSL | 8.9 | 3.6 | 68.9 |
| Sound enamel | 2.8 | 1.0 | 30.8 |
| Dentine bordering WSL | 14.2 | 4.2 | 97.0 |
| Sound dentine | 7.3 | 3.9 | 70.0 |
© 2020 by the authors. Licensee MDPI, Basel, Switzerland. This article is an open access article distributed under the terms and conditions of the Creative Commons Attribution (CC BY) license (http://creativecommons.org/licenses/by/4.0/).
Share and Cite
Sadyrin, E.; Swain, M.; Mitrin, B.; Rzhepakovsky, I.; Nikolaev, A.; Irkha, V.; Yogina, D.; Lyanguzov, N.; Maksyukov, S.; Aizikovich, S. Characterization of Enamel and Dentine about a White Spot Lesion: Mechanical Properties, Mineral Density, Microstructure and Molecular Composition. Nanomaterials 2020, 10, 1889. https://doi.org/10.3390/nano10091889
Sadyrin E, Swain M, Mitrin B, Rzhepakovsky I, Nikolaev A, Irkha V, Yogina D, Lyanguzov N, Maksyukov S, Aizikovich S. Characterization of Enamel and Dentine about a White Spot Lesion: Mechanical Properties, Mineral Density, Microstructure and Molecular Composition. Nanomaterials. 2020; 10(9):1889. https://doi.org/10.3390/nano10091889
Chicago/Turabian StyleSadyrin, Evgeniy, Michael Swain, Boris Mitrin, Igor Rzhepakovsky, Andrey Nikolaev, Vladimir Irkha, Diana Yogina, Nikolay Lyanguzov, Stanislav Maksyukov, and Sergei Aizikovich. 2020. "Characterization of Enamel and Dentine about a White Spot Lesion: Mechanical Properties, Mineral Density, Microstructure and Molecular Composition" Nanomaterials 10, no. 9: 1889. https://doi.org/10.3390/nano10091889