ORR in Non-Aqueous Solvent for Li-Air Batteries: The Influence of Doped MnO2-Nanoelectrocatalyst

 , , , , , and
Abstract
:
1. Introduction
2. Materials and Methods
2.1. Synthesis of Bare and Co-/Fe-Doped Nano-MnO2
2.2. Powders Physicochemical Characterization
2.3. Electrochemical Characterization
3. Results
3.1. Co- and Fe-Doped MnO2 Electrocatalytic Behavior
3.2. Nanoelectrocatalysts Physicochemical Features
- i.
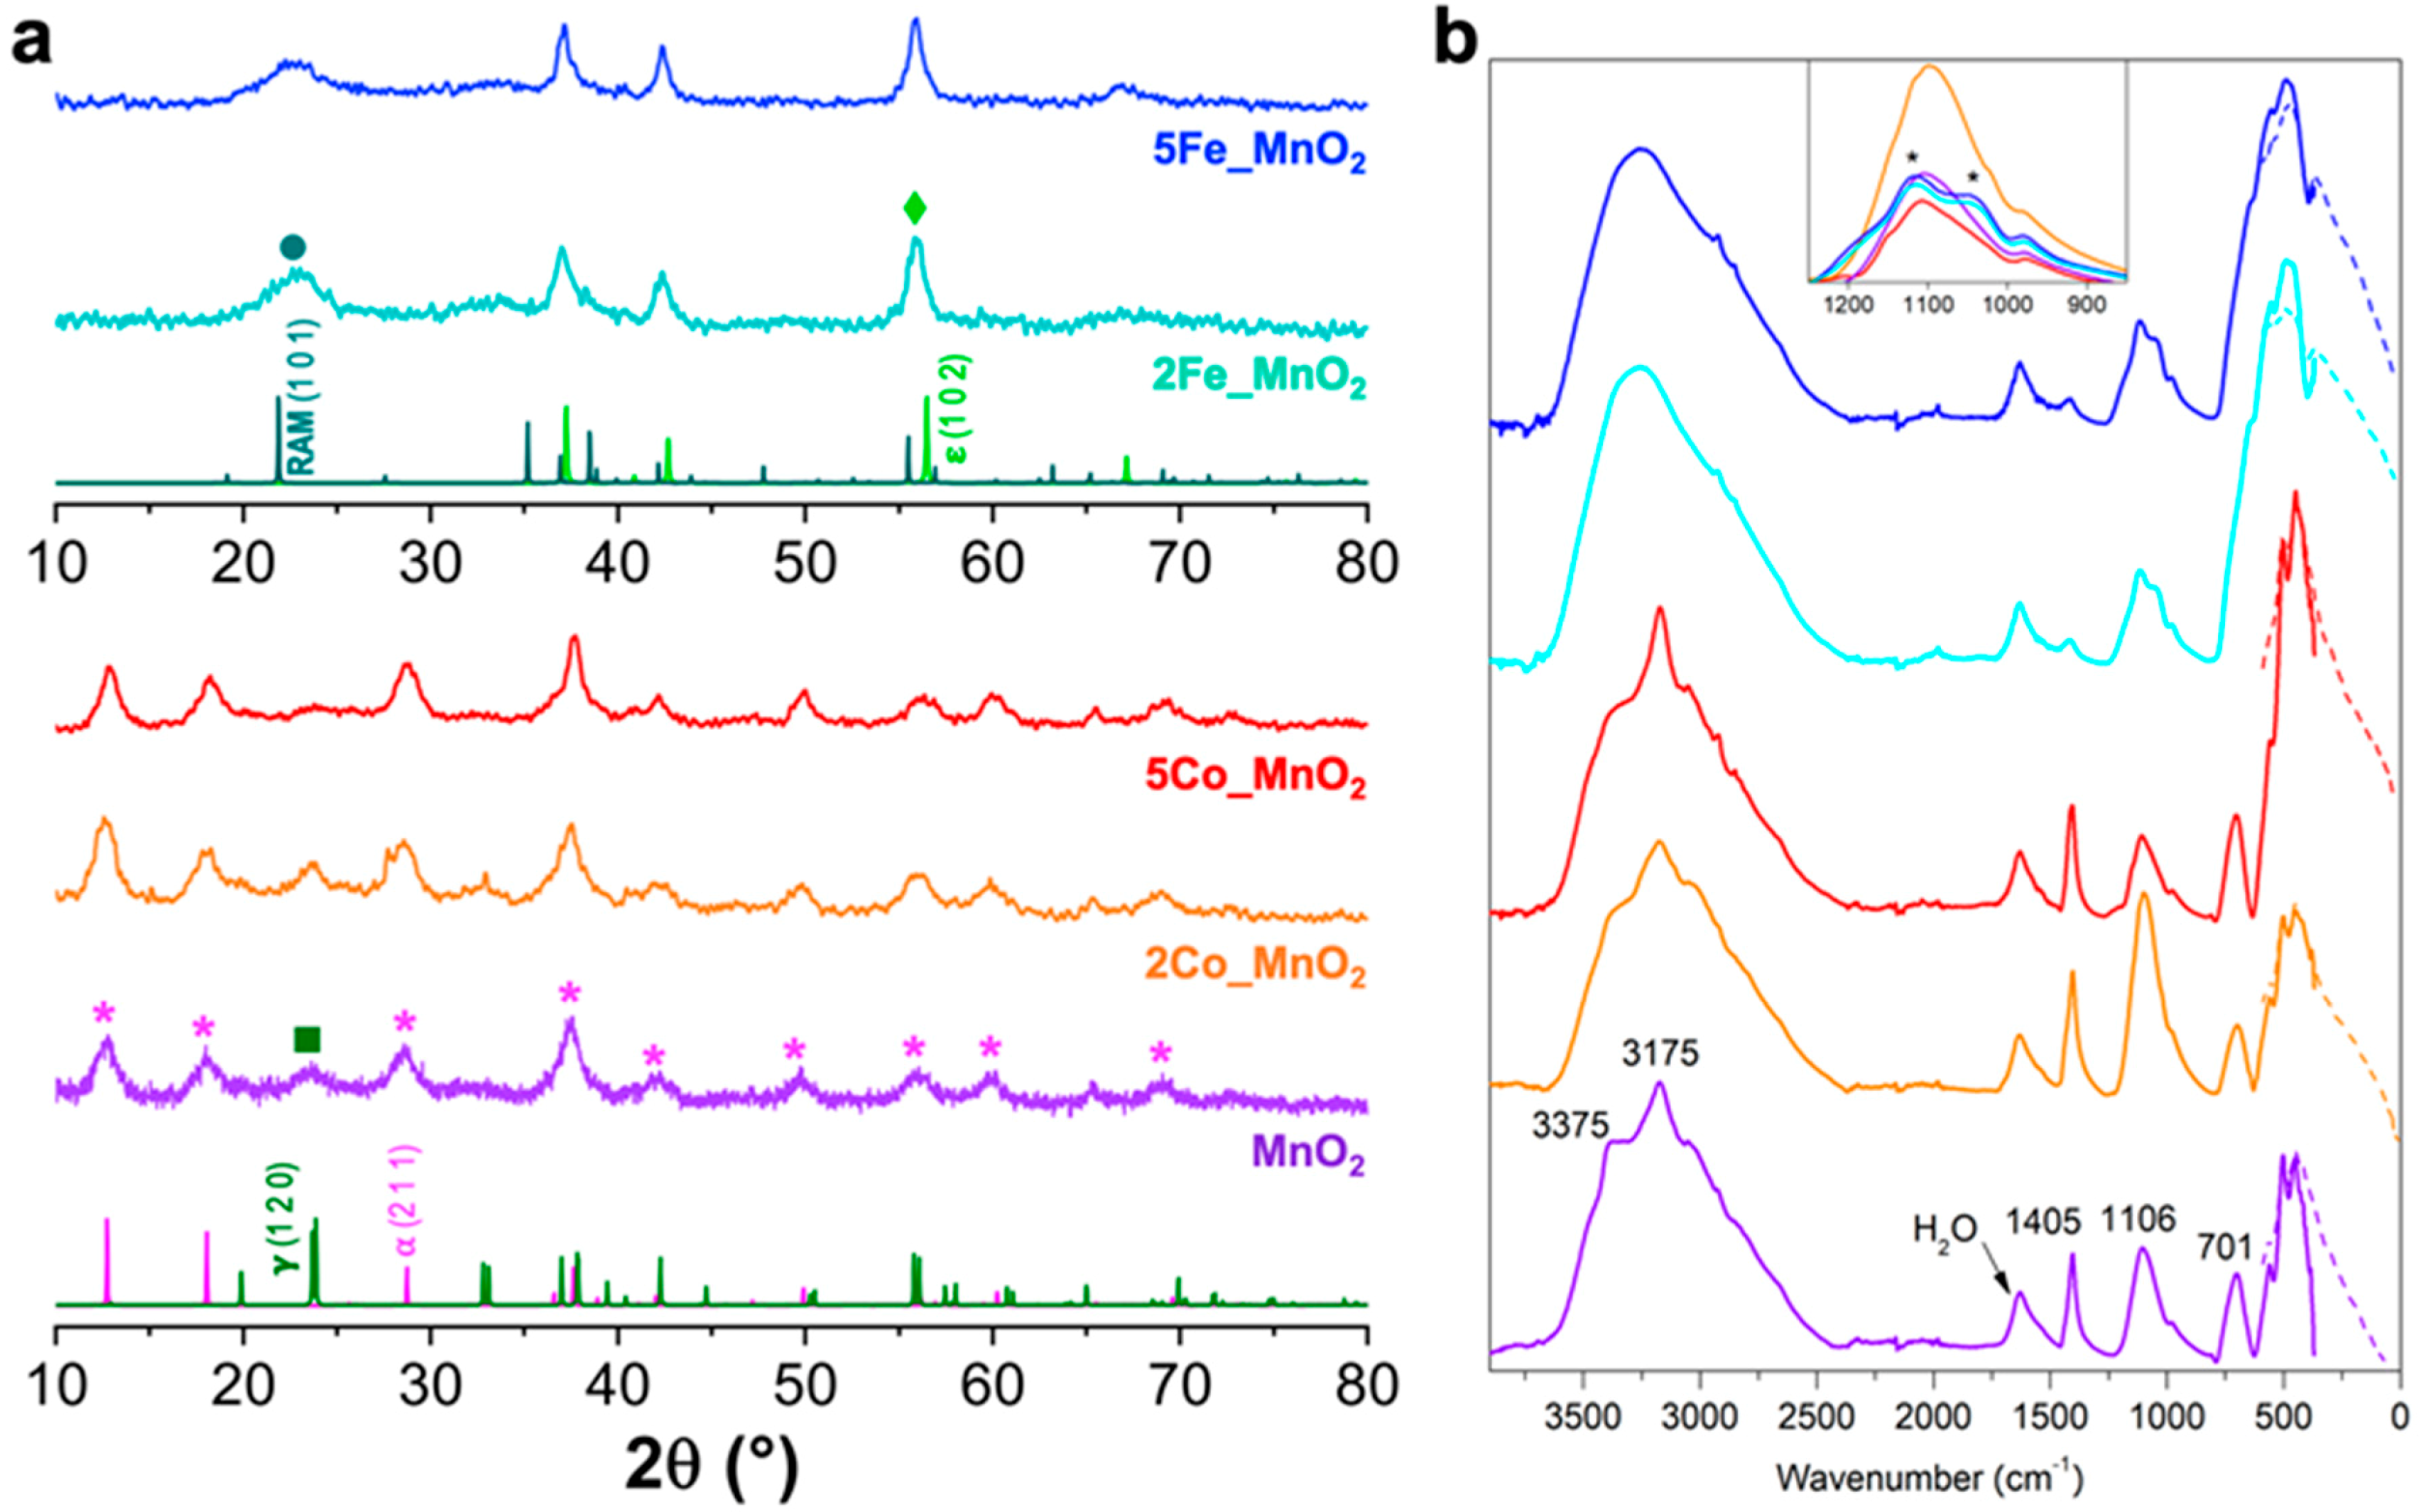
- in the high wavenumbers range (3600–2800 cm−1) a complex envelope is observable, in which some specific contributions can be singled out. The main feature is represented by the band centered at ~3170 cm−1, ascribable to the N–H stretching mode of ammonium ions [54] still present in this system (and probably located in the channels of the α phase) and possibly deriving as a residue from the preparation route (see the Materials and Methods section). Moreover, there are two less intense components, located at ~3380 and 3480 cm−1, respectively ascribable, on the basis of their spectroscopic behavior and literature data [55], to the O–H stretching vibrations of water molecules and hydroxyl species located in MnO6 octahedra in different coordination positions. Finally, all these bands are superimposed to a large envelope, covering the whole spectral range, which is due to surface OH species mutually interacting by H-bonding;
- ii.
- in the 1700–850 cm−1 spectral range at least three more components are evident: the first band, large and located at ~1630 cm−1, can be ascribed to the bending mode of undissociated water molecules (whose stretching mode was described above). Then, a sharp component located at ~1400 cm−1 can be related to the bending modes of ammonium ions [54,56]. It is worth noting that in the same spectral range lies the S=O asymmetric mode of sulfate species (still deriving from the same oxidizing agent). The third broad component is centered at ~1100 cm−1 and presents a satellite shoulder at ~980 cm−1: on the basis of the literature, it may be ascribed to the bending mode of OH groups directly bonded to the MnO6 octahedra [57]. The shoulder may indicate the possible presence of distorted crystallographic situations on top of which OH groups are still present and exhibit a slightly different spectral position. In this broad envelope, the symmetric S=O stretching mode of residual sulfate-containing species (most likely sulfates deriving from the decompositions of the oxidizing agent employed in the preparation route and whose asymmetric mode is centered at ~1400 cm−1, as previously reported) can be appreciable;
- iii.
- last, but not least, in the spectral range below 800 cm−1 many components can be observed: in particular, the most intense and broad band at ~690 cm−1 ascribable to Mn–O–Mn stretching mode appears, whereas the components located at lower frequency are supposed to be the bending and wagging spectral counterparts of the above species. The other less intense peaks, at ~560, ~500 and ~450 cm−1 referred to Mn–O stretching, bending and wagging vibrations from MnO6 octahedral units which are shared by corners and/or edges [57,58].
4. Discussion
5. Conclusions
Supplementary Materials
Author Contributions
Funding
Conflicts of Interest
References
- Hegde, G.S.; Ghosh, A.; Badam, R.; Matsumi, N.; Sundara, R. Role of Defects in Low-Cost Perovskite Catalysts toward ORR and OER in Lithium-Oxygen Batteries. ACS Appl. Energy Mater. 2020, 3, 1338–1348. [Google Scholar] [CrossRef]
- Wang, Y.J.; Fan, H.; Ignaszak, A.; Zhang, L.; Shao, S.; Wilkinson, D.P.; Zhang, J. Compositing doped-carbon with metals, non-metals, metal oxides, metal nitrides and other materials to form bifunctional electrocatalysts to enhance metal-air battery oxygen reduction and evolution reactions. Chem. Eng. J. 2018, 348, 416–437. [Google Scholar] [CrossRef]
- Peled, E.; Golodnitsky, D.; Mazor, H.; Goor, M.; Avshalomov, S. Parameter analysis of a practical lithium- and sodium-air electric vehicle battery. J. Power Sources 2011, 196, 6835–6840. [Google Scholar] [CrossRef]
- Surya, K.; Michael, M.S.; Prabaharan, S.R.S. A review on advancement in non-noble metal based oxides as bifunctional catalysts for rechargeable non-aqueous Li/air battery. Solid State Ionics 2018, 317, 89–96. [Google Scholar] [CrossRef]
- Wang, Z.-L.; Xu, D.; Xu, J.-J.; Zhang, X.-B. Oxygen electrocatalysts in metal-air batteries: From aqueous to nonaqueous electrolytes. Chem. Soc. Rev. 2013, 43. [Google Scholar] [CrossRef]
- Chen, Y.; Freunberger, S.A.; Peng, Z.; Fontaine, O.; Bruce, P.G. Charging a Li-O2 battery using a redox mediator. Nat. Chem. 2013, 5, 489–494. [Google Scholar] [CrossRef]
- Younesi, R.; Hahlin, M.; Björefors, F.; Johansson, P.; Edström, K. Li-O2 Battery Degradation by Lithium Peroxide (Li2O2): A Model Study. Chem. Mater. 2013, 25, 77–84. [Google Scholar] [CrossRef]
- Xu, Y.; Jiang, H.; Li, X.; Xiao, H.; Xiao, W.; Wu, T. Synthesis and characterization of Mn-based composite oxides with enhanced electrocatalytic activity for oxygen reduction. J. Mater. Chem. A 2014, 2, 13345. [Google Scholar] [CrossRef]
- Zahoor, A.; Ghouri, Z.K.; Hashmi, S.; Raza, F.; Ishtiaque, S.; Nadeem, S.; Ullah, I.; Nahm, K.S. Electrocatalysts for Lithium-Air Batteries: Current Status and Challenges. ACS Sustain. Chem. Eng. 2019, 7, 14288–14320. [Google Scholar] [CrossRef]
- Jang, H.; Zahoor, A.; Kim, Y.; Christy, M.; Oh, M.Y.; Aravindan, V.; Lee, Y.S.; Nahm, K.S. Tailoring three dimensional α–MnO2/RuO2 hybrid nanostructure as prospective bifunctional catalyst for Li-O2 batteries. Electrochim. Acta 2016, 212, 701–709. [Google Scholar] [CrossRef]
- Locatelli, C.; Minguzzi, A.; Vertova, A.; Rondinini, S. IrO2-SnO2 mixtures as electrocatalysts for the oxygen reduction reaction in alkaline media. J. Appl. Electrochem. 2013, 43, 171–179. [Google Scholar] [CrossRef]
- Minguzzi, A.; Locatelli, C.; Lugaresi, O.; Vertova, A.; Rondinini, S. Au-based/electrochemically etched cavity-microelectrodes as optimal tool for quantitative analyses on finely dispersed electrode materials: Pt/C, IrO2-SnO2 and Ag catalysts. Electrochim. Acta 2013, 114, 637–642. [Google Scholar] [CrossRef]
- Orsini, S.; Pargoletti, E.; Vertova, A.; Minguzzi, A.; Locatelli, C.; Rondinini, S.; Cappelletti, G. Ad hoc tailored electrocatalytic MnO2 nanorods for the oxygen reduction in aqueous and organic media. J. Electroanal. Chem. 2018, 808, 439–445. [Google Scholar] [CrossRef]
- Pargoletti, E.; Cappelletti, G.; Minguzzi, A.; Rondinini, S.; Leoni, M.; Marelli, M.; Vertova, A. High-performance of bare and Ti-doped α-MnO2 nanoparticles in catalyzing the Oxygen Reduction Reaction. J. Power Sources 2016, 325, 116–128. [Google Scholar] [CrossRef]
- Wang, Y.; Wang, J.; Mohamed, Z.; Huang, Q.; Chen, T.; Hou, Y.; Dang, F.; Zhang, W.; Wang, H. A free-standing CeO2/Co3O4 nanowires electrode featuring a controllable discharge/charge product evolution route with enhanced catalytic performance for Li-O2 batteries. Appl. Mater. Today 2020, 19, 100603. [Google Scholar] [CrossRef]
- Débart, A.; Bao, J.; Armstrong, G.; Bruce, P.G. An O2 cathode for rechargeable lithium batteries: The effect of a catalyst. J. Power Sources 2007, 174, 1177–1182. [Google Scholar] [CrossRef]
- Lee, S.; Lee, G.H.; Lee, H.J.; Dar, M.A.; Kim, D.W. Fe-based hybrid electrocatalysts for nonaqueous lithium-oxygen batteries. Sci. Rep. 2017, 7, 1–9. [Google Scholar] [CrossRef] [Green Version]
- Wei, C.; Yu, L.; Cui, C.; Lin, J.; Wei, C.; Mathews, N.; Huo, F.; Sritharan, T.; Xu, Z. Ultrathin MnO2 nanoflakes as efficient catalysts for oxygen reduction reaction. Chem. Commun. 2014, 50, 7885. [Google Scholar] [CrossRef]
- Sokolsky, G.; Zudina, L.; Boldyrev, E.; Miroshnikov, O.; Gauk, N.; Kiporenko, O.Y. ORR Electrocatalysis on Cr3+, Fe2+, Co2+ Doped Manganese(IV) Oxides. Acta Phys. Pol. A 2018, 133, 1097–1102. [Google Scholar] [CrossRef]
- Hashemzadeh, F.; Mehdi Kashani Motlagh, M.; Maghsoudipour, A. A comparative study of hydrothermal and sol-gel methods in the synthesis of MnO2 nanostructures. J. Sol-Gel Sci. Technol. 2009, 51, 169–174. [Google Scholar] [CrossRef]
- Ye, Z.; Li, T.; Ma, G.; Dong, Y.; Zhou, X. Metal-Ion (Fe, V, Co, and Ni)-Doped MnO2 Ultrathin Nanosheets Supported on Carbon Fiber Paper for the Oxygen Evolution Reaction. Adv. Funct. Mater. 2017, 27, 1704083. [Google Scholar] [CrossRef]
- Longhi, M.; Cova, C.; Pargoletti, E.; Coduri, M.; Santangelo, S.; Patanè, S.; Ditaranto, N.; Cioffi, N.; Facibeni, A.; Scavini, M. Synergistic Effects of Active Sites’ Nature and Hydrophilicity on the Oxygen Reduction Reaction Activity of Pt-Free Catalysts. Nanomaterials 2018, 8, 643. [Google Scholar] [CrossRef] [PubMed] [Green Version]
- Xiong, Y.; Xie, Y.; Li, Z.; Wu, C. Growth of well-aligned γ-MnO2 monocrystalline nanowires through a coorination-polymer-precursor route. Chem. A Eur. J. 2003, 9, 1645. [Google Scholar] [CrossRef] [PubMed]
- Liu, S.W.; Qin, X. Preparation of a Ag-MnO2/graphene composite for the oxygen reduction reaction in alkaline solution. RSC Adv. 2015, 5, 15627–15633. [Google Scholar] [CrossRef]
- Ma, J.; Wang, C.; He, H. Transition metal doped cryptomelane-type manganese oxide catalysts for ozone decomposition. Appl. Catal. B Environ. 2017, 201, 503–510. [Google Scholar] [CrossRef]
- Kim, B.C.; Justin Raj, C.; Cho, W.-J.; Lee, W.-G.; Jeong, H.T.; Yu, K.H. Enhanced electrochemical properties of cobalt doped manganese dioxide nanowires. J. Alloys Compd. 2014, 617, 491–497. [Google Scholar] [CrossRef] [Green Version]
- Minguzzi, A.; Longoni, G.; Cappelletti, G.; Pargoletti, E.; Di Bari, C.; Locatelli, C.; Marelli, M.; Rondinini, S.; Vertova, A. The Influence of Carbonaceous Matrices and Electrocatalytic MnO2 Nanopowders on Lithium-Air Battery Performances. Nanomaterials 2016, 6, 10. [Google Scholar] [CrossRef] [Green Version]
- Xu, W.; Viswanathan, V.V.; Wang, D.; Towne, S.A.; Xiao, J.; Nie, Z.; Hu, D.; Zhang, J.G. Investigation on the charging process of Li2O2-based air electrodes in Li-O2 batteries with organic carbonate electrolytes. J. Power Sources 2011, 196, 3894–3899. [Google Scholar] [CrossRef]
- Giordani, V.; Tozier, D.; Tan, H.; Burke, C.M.; Gallant, B.M.; Uddin, J.; Greer, J.R.; McCloskey, B.D.; Chase, G.V.; Addison, D. A Molten Salt Lithium–Oxygen Battery. J. Am. Chem. Soc. 2016, 138, 2656–2663. [Google Scholar] [CrossRef] [Green Version]
- Shao, Y.; Ding, F.; Xiao, J.; Zhang, J.; Xu, W.; Park, S.; Zhang, J.G.; Wang, Y.; Liu, J. Making Li-air batteries rechargeable: Material challenges. Adv. Funct. Mater. 2013, 23, 987–1004. [Google Scholar] [CrossRef]
- Wang, C.; Yu, Y.; Niu, J.; Liu, Y.; Bridges, D.; Liu, X.; Pooran, J.; Zhang, Y.; Hu, A. Recent Progress of Metal-Air Batteries—A Mini Review. Appl. Sci. 2019, 9, 2787. [Google Scholar] [CrossRef] [Green Version]
- Du, P.; Lu, J.; Lau, K.C.; Luo, X.; Bareño, J.; Zhang, X.; Ren, Y.; Zhang, Z.; Curtiss, L.A.; Sun, Y.-K.; et al. Compatibility of lithium salts with solvent of the non-aqueous electrolyte in Li–O2 batteries. Phys. Chem. Chem. Phys. 2013, 15, 5572. [Google Scholar] [CrossRef] [PubMed]
- Gunasekara, I.; Mukerjee, S.; Plichta, E.J.; Hendrickson, M.A.; Abraham, K.M. A Study of the Influence of Lithium Salt Anions on Oxygen Reduction Reactions in Li-Air Batteries. J. Electrochem. Soc. 2015, 162, A1055–A1066. [Google Scholar] [CrossRef] [Green Version]
- Marinaro, M.; Balasubramanian, P.; Gucciardi, E.; Theil, S.; Jörissen, L.; Wohlfahrt-Mehrens, M. Importance of Reaction Kinetics and Oxygen Crossover in aprotic Li-O2 Batteries Based on a Dimethyl Sulfoxide Electrolyte. ChemSusChem 2015, 8, 3139–3145. [Google Scholar] [CrossRef]
- Kim, D.S.; Park, Y.J. Effect of multi-catalysts on rechargeable Li-air batteries. J. Alloys Compd. 2014, 591, 164–169. [Google Scholar] [CrossRef]
- Scheers, J.; Lidberg, D.; Sodeyama, K.; Futera, Z.; Tateyama, Y. Life of superoxide in aprotic Li-O2 battery electrolytes: Simulated solvent and counter-ion effects. Phys. Chem. Chem. Phys. 2016, 18, 9961–9968. [Google Scholar] [CrossRef] [Green Version]
- Lu, Y.-C.; Gasteiger, H.A.; Shao-Horn, Y. Method Development to Evaluate the Oxygen Reduction Activity of High-Surface-Area Catalysts for Li-Air Batteries. Electrochem. Solid-State Lett. 2011, 14, A70. [Google Scholar] [CrossRef]
- Augustin, M.; Fenske, D.; Parisi, J. Study on Electrolyte Stability and Oxygen Reduction Reaction Mechanisms in the Presence of Manganese Oxide Catalysts for Aprotic Lithium-Oxygen Batteries. Energy Technol. 2016, 4, 1531–1542. [Google Scholar] [CrossRef] [Green Version]
- Tran, C.; Yang, X.Q.; Qu, D. Investigation of the gas-diffusion-electrode used as lithium/air cathode in non-aqueous electrolyte and the importance of carbon material porosity. J. Power Sources 2010, 195, 2057–2063. [Google Scholar] [CrossRef]
- Xiao, J.; Wang, D.; Xu, W.; Wang, D.; Williford, R.E.; Liu, J.; Zhang, J.G. Optimization of Air Electrode for Li/Air Batteries. J. Electrochem. Soc. 2010, 157, A487–A492. [Google Scholar] [CrossRef]
- Gittleson, F.S.; Sekol, R.C.; Doubek, G.; Linardi, M.; Taylor, A.D. Catalyst and electrolyte synergy in Li-O2 batteries. Phys. Chem. Chem. Phys. 2014, 16, 3230. [Google Scholar] [CrossRef] [PubMed]
- Mellan, T.A.; Maenetja, K.P.; Ngoepe, P.E.; Woodley, S.M.; Catlow, C.R.A.; Grau-Crespo, R. Lithium and oxygen adsorption at the β-MnO2 (110) surface. J. Mater. Chem. A 2013, 1, 14879. [Google Scholar] [CrossRef] [Green Version]
- Walsh, A.; Sokol, A.A.; Catlow, C.R.A. Computational Approaches to Energy Materials; John Wiley & Sons: Hoboken, NJ, USA, 2013. [Google Scholar]
- Laoire, C.O.; Mukerjee, S.; Abraham, K.M.; Plichta, E.J.; Hendrickson, M.A. Elucidating the mechanism of oxygen reduction for lithium-air battery applications. J. Phys. Chem. C 2009, 113, 20127–20134. [Google Scholar] [CrossRef]
- De Wolff, P.M. Interpretation of some γ-MnO2 diffraction patterns. Acta Crystallogr. 1959, 12, 341–345. [Google Scholar] [CrossRef]
- Byström, A.M.; Lund, E.W.; Lund, L.K.; Hakala, M. The Crystal Structure of Ramsdellite, an Orthorhombic Modification of MnO2. Acta Chem. Scand. 1949, 3, 163–173. [Google Scholar] [CrossRef] [Green Version]
- Turner, S.; Buseck, P.R. Defects in nsutite (γ-MnO2) and dry-cell battery efficiency. Nature 1983, 304, 143–146. [Google Scholar] [CrossRef]
- Wang, Z.; Wang, F.; Li, Y.; Hu, J.; Lu, Y.; Xu, M. Interlinked multiphase Fe-doped MnO2 nanostructures: A novel design for enhanced pseudocapacitive performance. Nanoscale 2016, 8, 7309–7317. [Google Scholar] [CrossRef]
- Portehault, D.; Cassaignon, S.; Baudrin, E.; Jolivet, J.P. Structural and morphological control of manganese oxide nanoparticles upon soft aqueous precipitation through MnO4−/Mn2+ reaction. J. Mater. Chem. 2009, 19, 2407. [Google Scholar] [CrossRef]
- Benhaddad, L.; Makhloufi, L.; Messaoudi, B.; Rahmouni, K.; Takenouti, H. Reactivity of Nanostructured MnO2 in Alkaline Medium Studied with a Micro-Cavity Electrode: Effect of Synthesizing Temperature. ACS Appl. Mater. Interfaces 2009, 1, 424–432. [Google Scholar] [CrossRef]
- Peng, R.; Wu, N.; Zheng, Y.; Huang, Y.; Luo, Y.; Yu, P.; Zhuang, L. Large-Scale Synthesis of Metal Ion-Doped Manganese Dioxide for Enhanced Electrochemical Performance. ACS Appl. Mater. Interfaces 2016, 8, 8474–8480. [Google Scholar] [CrossRef]
- Marcus, Y. Ionic Radii in Aqueous Solutions. Chem. Rev. 1988, 88, 1475–1498. [Google Scholar] [CrossRef]
- Shannon, R.D. Revised effective ionic radii and systematic studies of interatomic distances in halides and chalcogenides. Acta Crystallogr. Sect. A 1976, 32, 751–767. [Google Scholar] [CrossRef]
- Nakamoto, K. Infrared and Raman Spectra of Inorganic and Coordination Compounds, 6th ed.; John Wiley & Sons, Inc.: Hoboken, NJ, USA, 2009; ISBN 9780471743392. [Google Scholar]
- Rossuen, G.R. The tetravalent manganese oxides: Identification, hydration, and structural relationships by infrared spectroscopy. Technology 1979, 64, 1199–1218. [Google Scholar]
- Park, J.; Xia, C.; Selby, S.; Foster, S.C. The v4 Band of Ammonium, NH4+. J. Mol. Spectrosc. 1996, 179, 150–158. [Google Scholar] [CrossRef]
- Ishii, M.; Nakahira, M.; Yamanaka, T. Infrared absorption spectra and cation distributions in (Mn, Fe)3O4. Solid State Commun. 1972, 11, 209–212. [Google Scholar] [CrossRef]
- Kolta, G.A.; Kerim, F.M.A.; Azim, A.A.A. Infrared absorption spectra of some Manganese Dioxide Modifications and their thermal products. Zeitschrift fur Anorg. und Allg. Chemie 1971, 384, 260–266. [Google Scholar] [CrossRef]
- Julien, C.; Massot, M. Spectroscopic studies of the structural transitions in positive electrodes for lithium batteries. J. Power Sources 2003, 119–121, 743–748. [Google Scholar] [CrossRef]
- Julien, C.; Massot, M. Spectroscopic studies of the local structure in positive electrodes for lithium batteries. Phys. Chem. Chem. Phys. 2002, 4, 4226–4235. [Google Scholar] [CrossRef]
- Barudžija, T.; Cvjetićanin, N.; Bajuk-Bogdanović, D.; Mojović, M.; Mitrić, M. Vibrational and electron paramagnetic resonance spectroscopic studies of β-MnO2 and α-KxMnO2 nanorods. J. Alloys Compd. 2017, 728, 259–270. [Google Scholar] [CrossRef]
- Said, M.I.; Rageh, A.H.; Abdel-Aal, F.A.M. Fabrication of novel electrochemical sensors based on modification with different polymorphs of MnO2 nanoparticles. Application to furosemide analysis in pharmaceutical and urine samples. RSC Adv. 2018, 8, 18698–18713. [Google Scholar] [CrossRef] [Green Version]
- Ishfaq, M.; Rizwan Khan, M.; Bhopal, M.F.; Nasim, F.; Ali, A.; Bhatti, A.S.; Ahmed, I.; Bhardwaj, S.; Cepek, C. 1.5 MeV proton irradiation effects on electrical and structural properties of TiO2/n-Si interface. J. Appl. Phys. 2014, 115, 174506. [Google Scholar] [CrossRef]
- Naeem, M.; Hasanain, S.K.; Kobayashi, M.; Ishida, Y.; Fujimori, A.; Buzby, S.; Shah, S.I. Effect of reducing atmosphere on the magnetism of Zn1−xCoxO (0 ≤ x ≤ 0.10) nanoparticles. Nanotechnol. 2006, 17, 2675–2680. [Google Scholar] [CrossRef] [PubMed] [Green Version]
- Biesinger, M.C.; Payne, B.P.; Grosvenor, A.P.; Lau, L.W.M.; Gerson, A.R.; Smart, R.S.C. Resolving surface chemical states in XPS analysis of first row transition metals, oxides and hydroxides: Cr, Mn, Fe, Co and Ni. Appl. Surf. Sci. 2011, 257, 2717–2730. [Google Scholar] [CrossRef]
- Cappelletti, G.; Ardizzone, S.; Bianchi, C.L.; Gialanella, S.; Naldoni, A.; Pirola, C.; Ragaini, V. Photodegradation of pollutants in air: Enhanced properties of nano-TiO2 prepared by ultrasound. Nanoscale Res. Lett. 2009, 4, 97. [Google Scholar] [CrossRef] [PubMed] [Green Version]
- Stucchi, M.; Boffito, D.; Pargoletti, E.; Cerrato, G.; Bianchi, C.; Cappelletti, G. Nano-MnO2 Decoration of TiO2 Microparticles to Promote Gaseous Ethanol Visible Photoremoval. Nanomaterials 2018, 8, 686. [Google Scholar] [CrossRef] [Green Version]
- Kang, S.; Pawar, R.C.; Pyo, Y.; Khare, V.; Lee, C.S. Size-controlled BiOCl–RGO composites having enhanced photodegradative properties. J. Exp. Nanosci. 2016, 11, 259–275. [Google Scholar] [CrossRef] [Green Version]
- Boiadjieva, T.; Cappelletti, G.; Ardizzone, S.; Rondinini, S.; Vertova, A. The role of surface electrification on the growth and structural features of titania nanoparticles. Phys. Chem. Chem. Phys. 2004, 6, 3535. [Google Scholar] [CrossRef] [Green Version]
- Ogasawara, T.; Débart, A.; Holzapfel, M.; Novák, P.; Bruce, P.G. Rechargeable Li2O2 electrode for lithium batteries. J. Am. Chem. Soc. 2006, 128, 1390–1393. [Google Scholar] [CrossRef]


| Catalysts | Solvent/Electrolyte | ORR Onset Shift (mV) | Ref. |
|---|---|---|---|
| Pt/C | LiClO4/DME | 30 | [41] |
| Pd/C | 0 | ||
| Au/C | 50 | ||
| Pt/C | LiClO4/TEGDME | 70 | |
| Pd/C | 90 | ||
| Au/C | 130 | ||
| Pt/C | LiClO4/DMSO | 60 | |
| Pd/C | 60 | ||
| Au/C | 50 | ||
| Carbon vulcan XC72R | LiTFSi/DMSO | 20 | [38] |
| Mn5O8/C | 20 | ||
| α-Mn2O3/C | 110 | ||
| MnO2 | 0.15-M LiNO3/PC | 50 ± 2 | This work |
| 2Co_MnO2 | 130 ± 5 | ||
| 5Co_MnO2 | 60 ± 3 | ||
| 2Fe_MnO2 | 70 ± 2 | ||
| 5Fe_MnO2 | 80 ± 5 |
| Sample | % Co or Fe/Mn | Mn(4+δ)+/Mntot | Ovacancy/Otot | SBET (m2 g−1) | |
|---|---|---|---|---|---|
| EDX | XPS | ||||
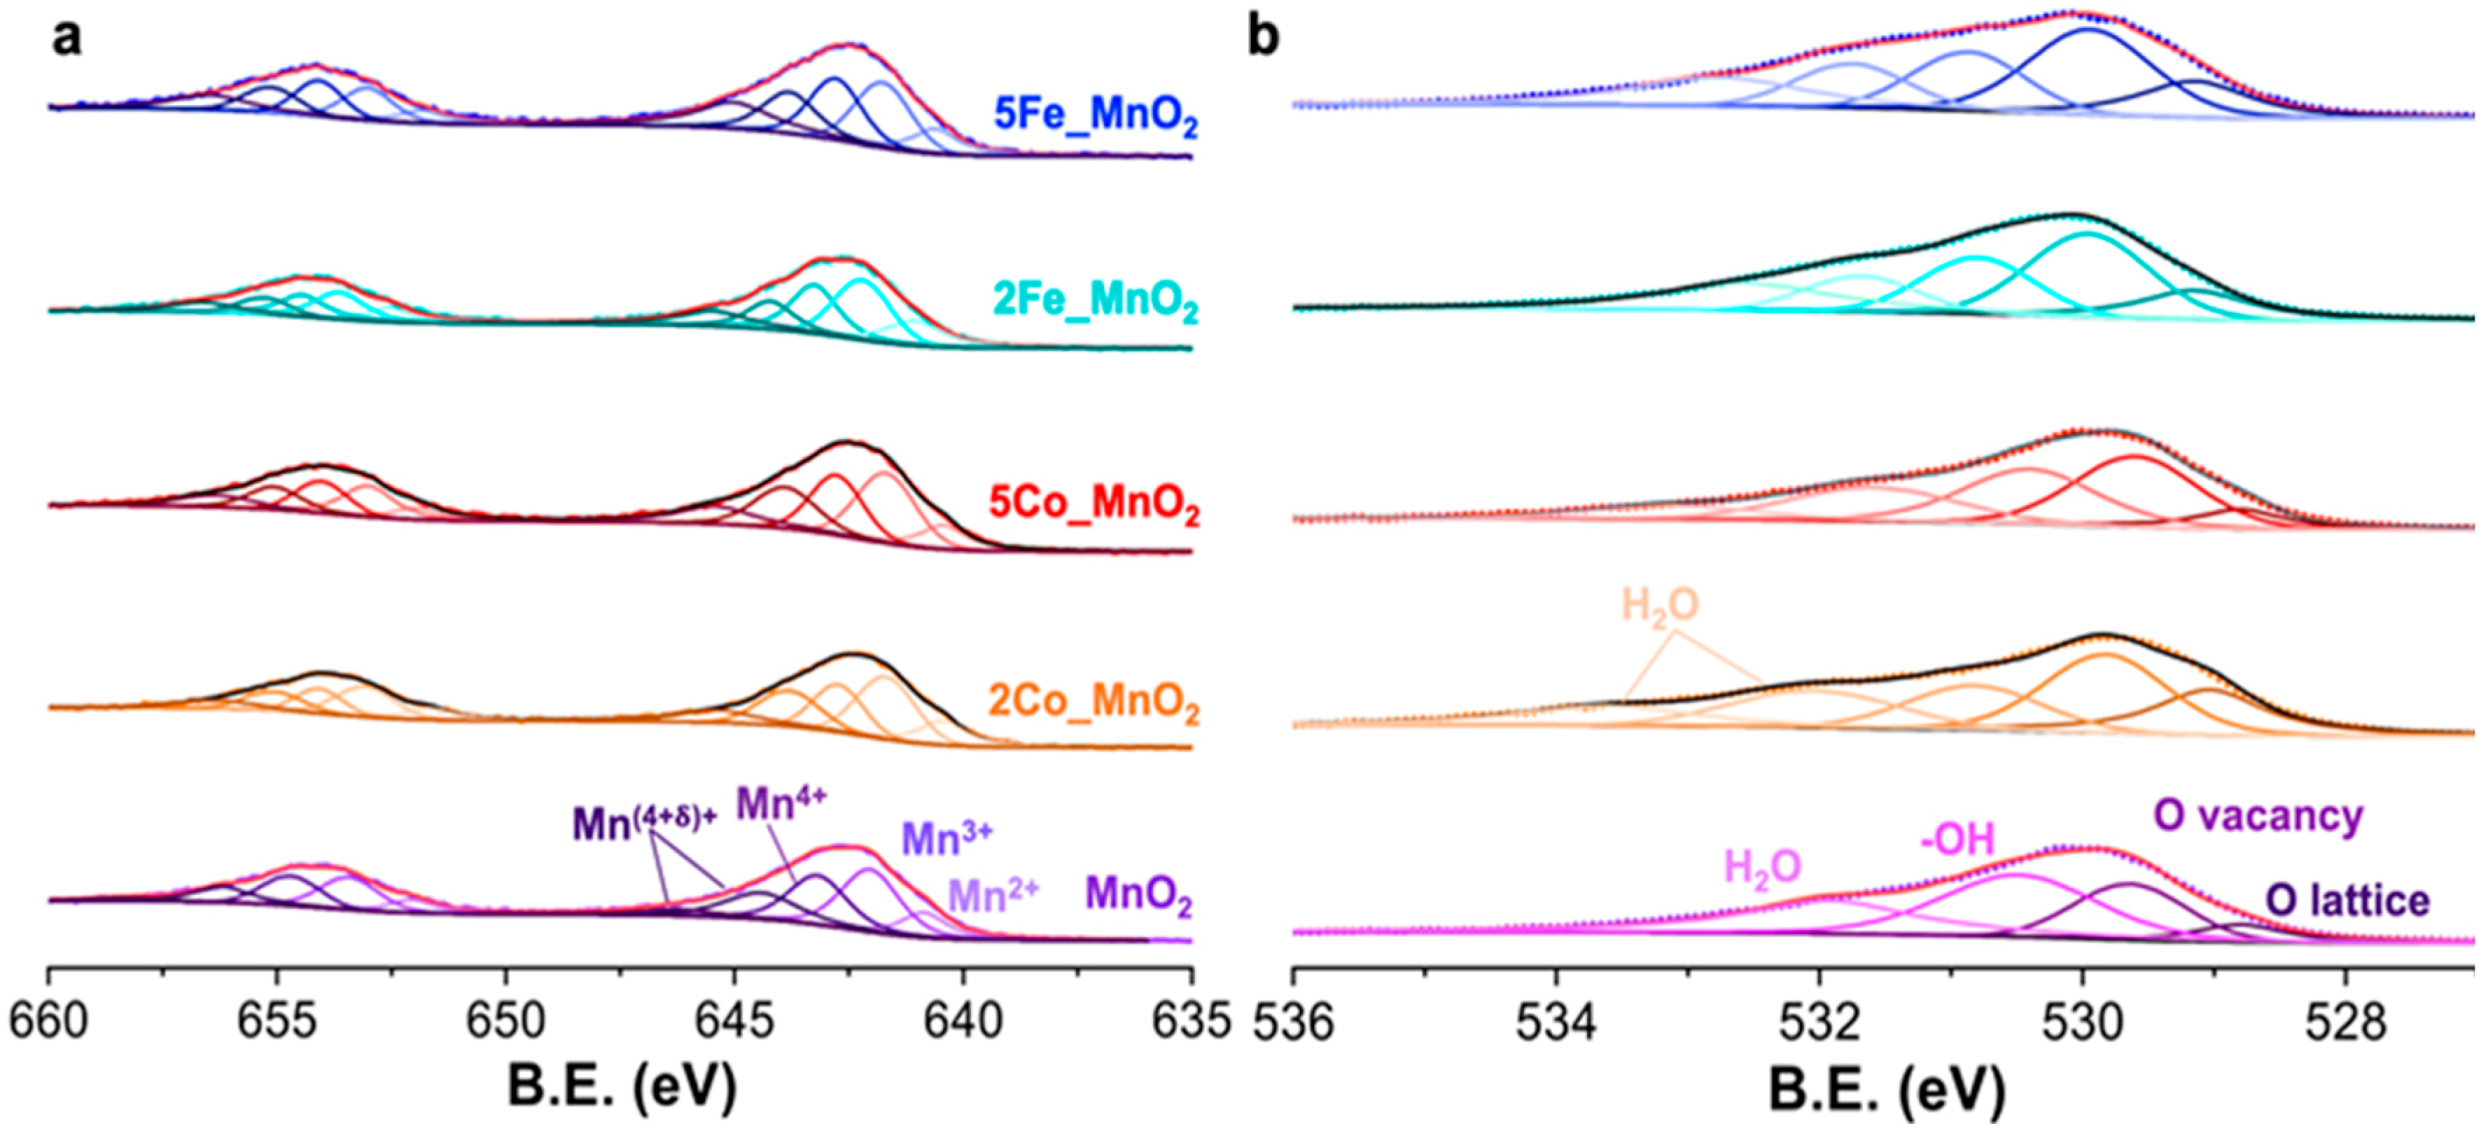
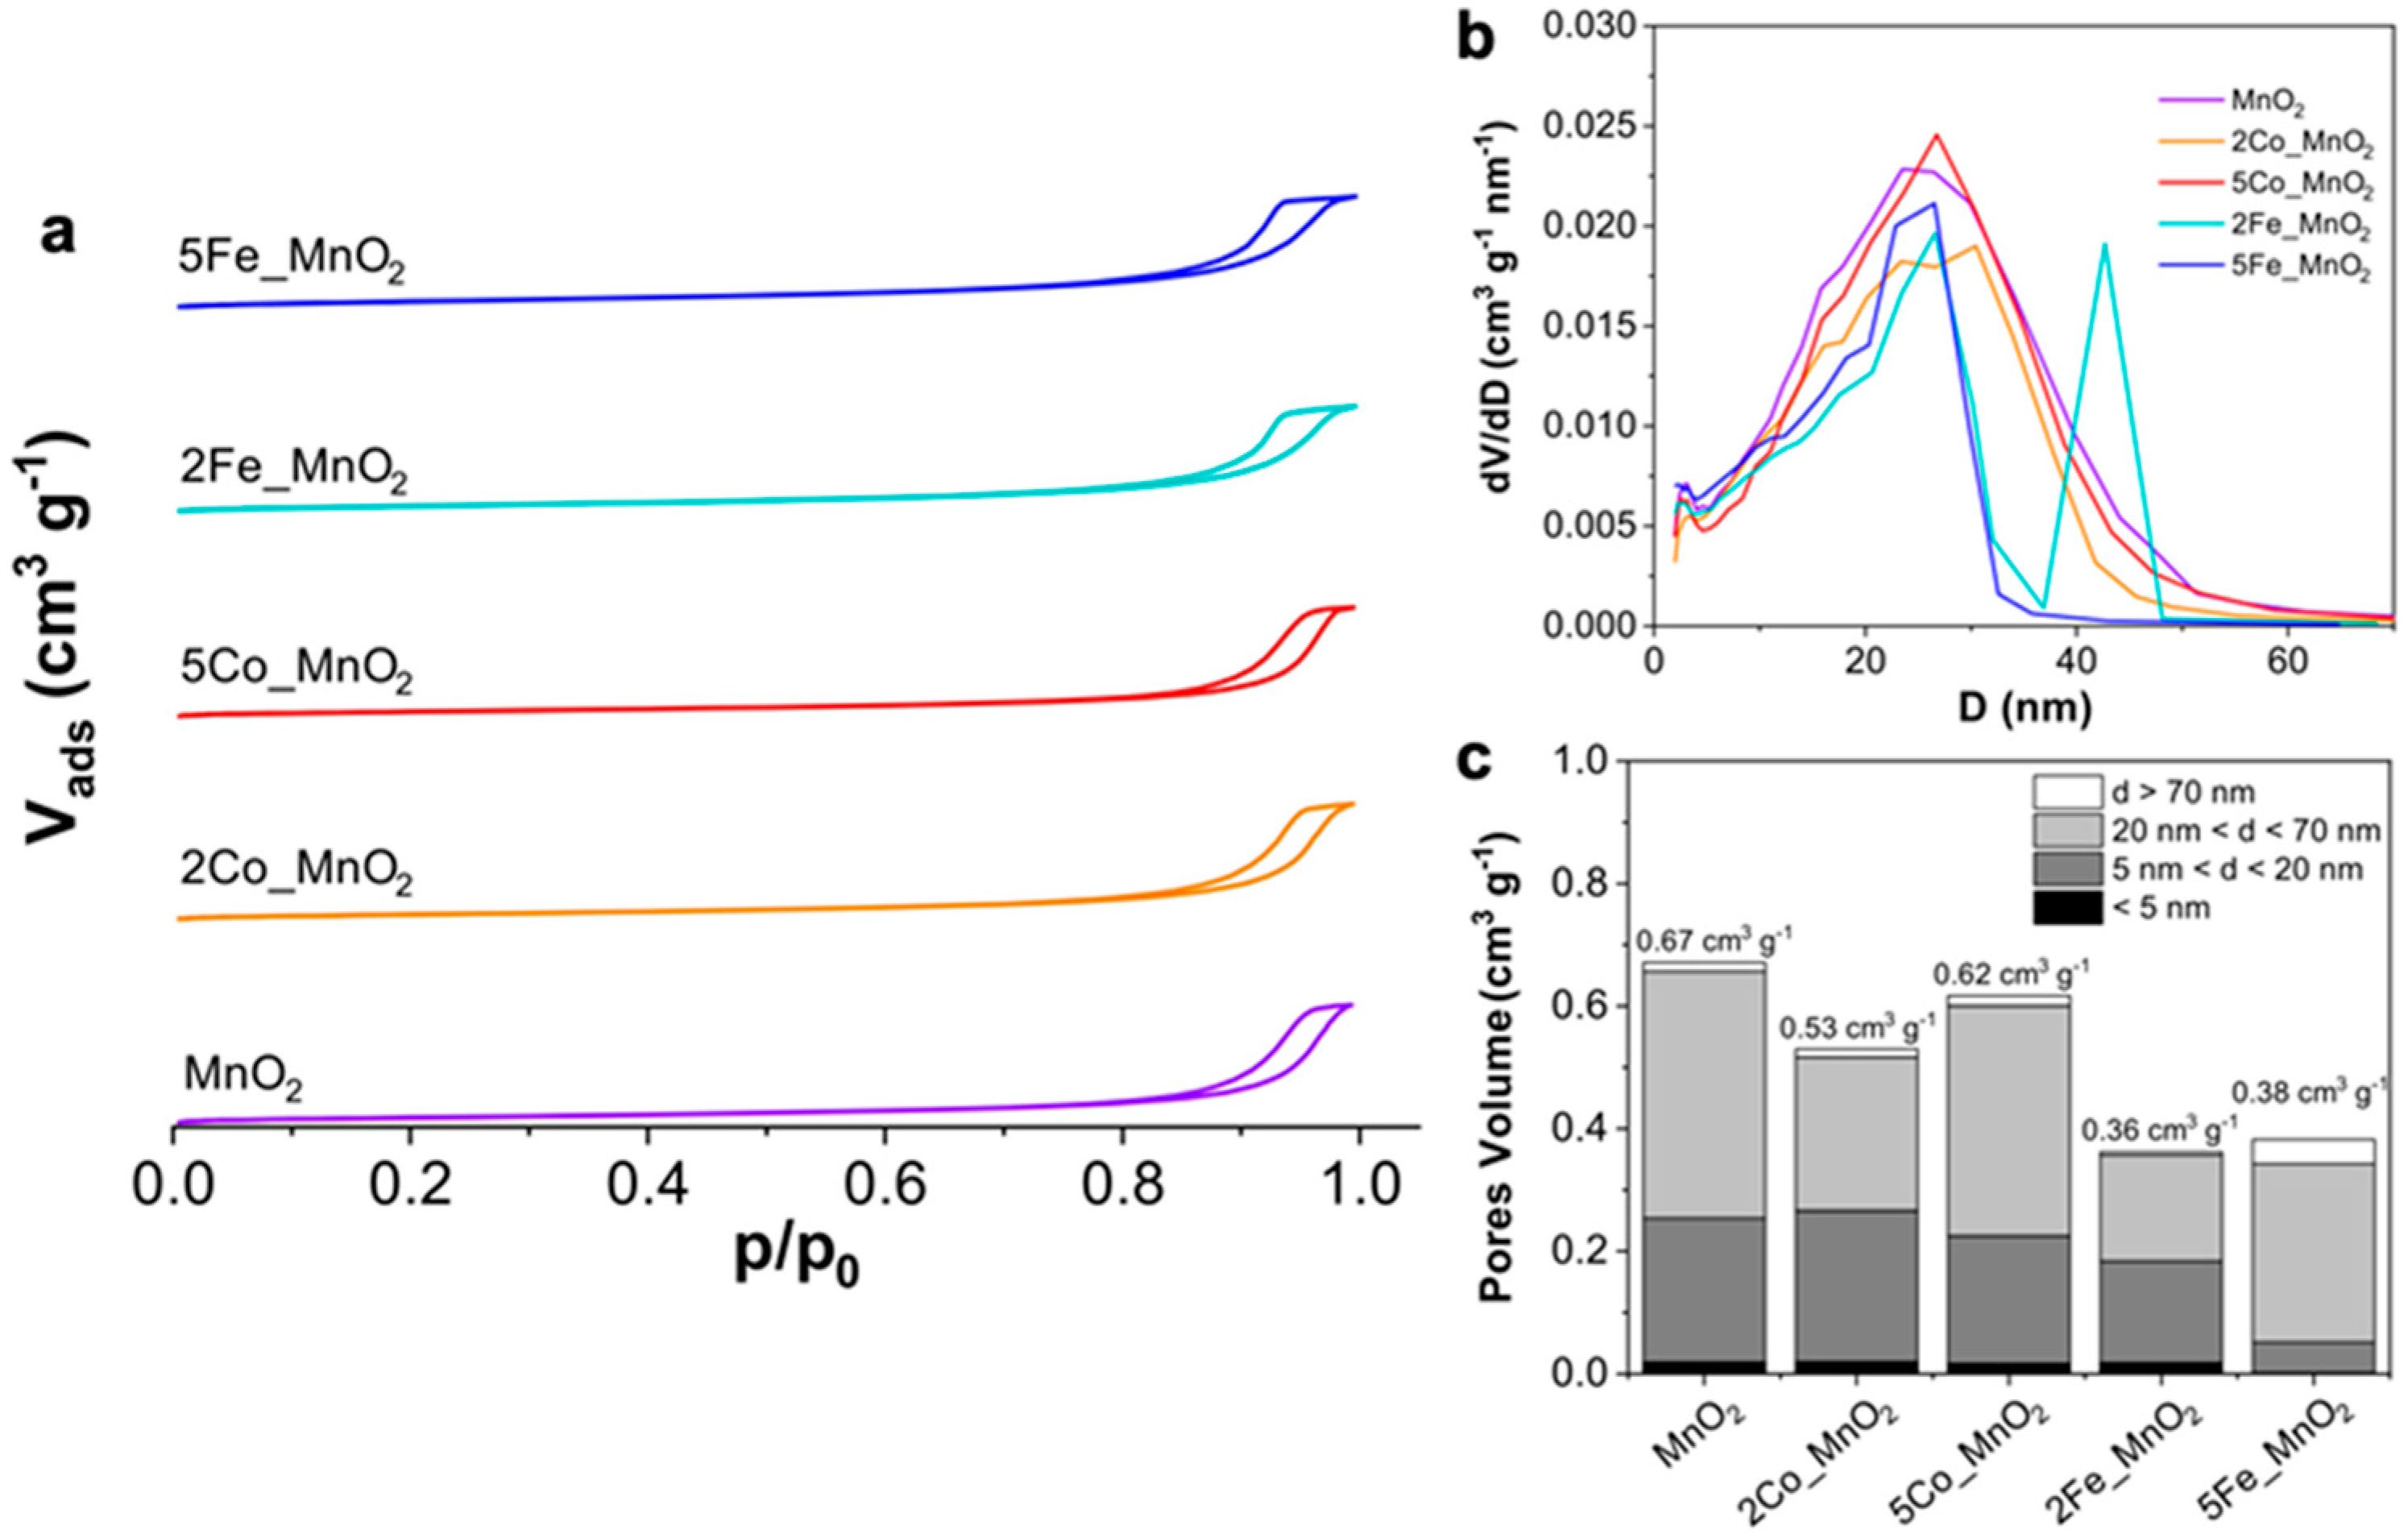
| MnO2 | − | − | 0.26 | 0.22 | 122 |
| 2Co_MnO2 | 0.6 | n.d. | 0.32 | 0.30 | 98 |
| 5Co_MnO2 | 2.0 | n.d. | 0.36 | 0.39 | 118 |
| 2Fe_MnO2 | 7.7 | 11 | 0.28 | 0.32 | 89 |
| 5Fe_MnO2 | 11.0 | 24 | 0.39 | 0.32 | 100 |
© 2020 by the authors. Licensee MDPI, Basel, Switzerland. This article is an open access article distributed under the terms and conditions of the Creative Commons Attribution (CC BY) license (http://creativecommons.org/licenses/by/4.0/).
Share and Cite
Pargoletti, E.; Salvi, A.; Giordana, A.; Cerrato, G.; Longhi, M.; Minguzzi, A.; Cappelletti, G.; Vertova, A. ORR in Non-Aqueous Solvent for Li-Air Batteries: The Influence of Doped MnO2-Nanoelectrocatalyst. Nanomaterials 2020, 10, 1735. https://doi.org/10.3390/nano10091735
Pargoletti E, Salvi A, Giordana A, Cerrato G, Longhi M, Minguzzi A, Cappelletti G, Vertova A. ORR in Non-Aqueous Solvent for Li-Air Batteries: The Influence of Doped MnO2-Nanoelectrocatalyst. Nanomaterials. 2020; 10(9):1735. https://doi.org/10.3390/nano10091735
Chicago/Turabian StylePargoletti, Eleonora, Annalisa Salvi, Alessia Giordana, Giuseppina Cerrato, Mariangela Longhi, Alessandro Minguzzi, Giuseppe Cappelletti, and Alberto Vertova. 2020. "ORR in Non-Aqueous Solvent for Li-Air Batteries: The Influence of Doped MnO2-Nanoelectrocatalyst" Nanomaterials 10, no. 9: 1735. https://doi.org/10.3390/nano10091735