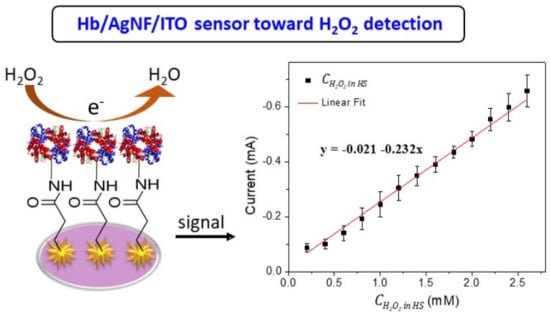
Bioelectrocatalysis of Hemoglobin on Electrodeposited Ag Nanoflowers toward H2O2 Detection


Abstract
:
1. Introduction
2. Materials and Methods
2.1. Reagents
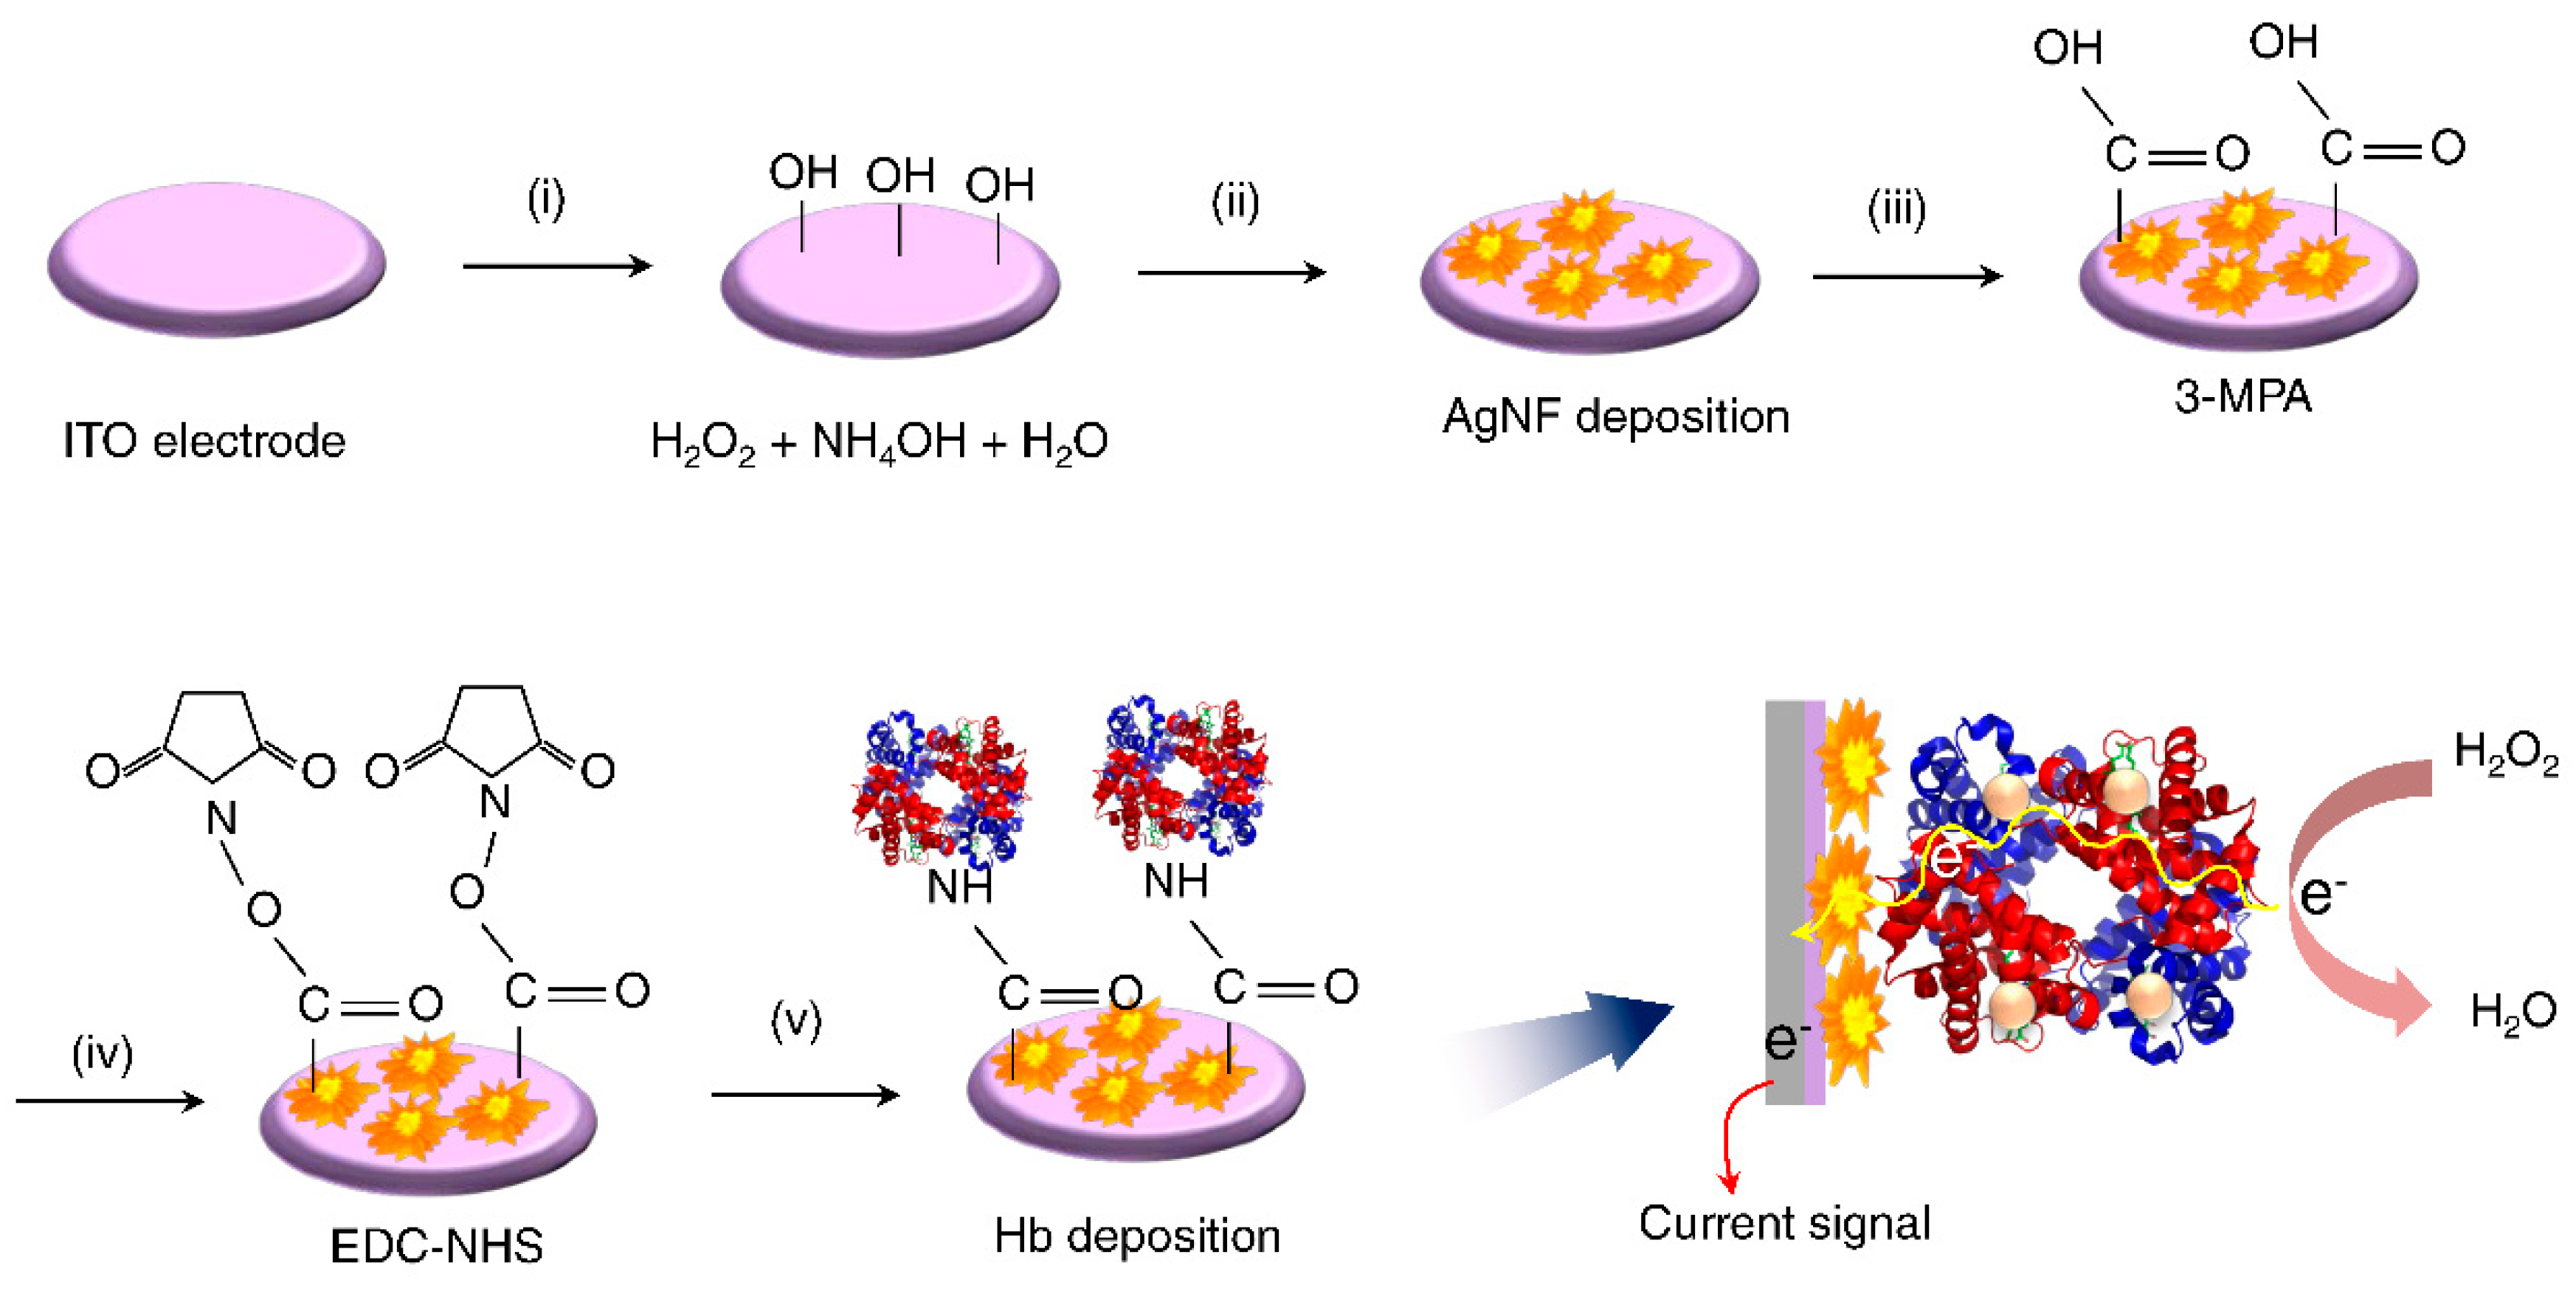
2.2. Preparation of the Hb/AgNF/ITO Electrodes
2.3. Apparatus and Measurements
3. Results
4. Conclusions
Supplementary Materials
Author Contributions
Funding
Conflicts of Interest
References
- Park, S.Y.; Je, J.Y.; Ahn, C.B. Phenolic Composition and Hepatoprotective Activities of Allium Hookeri Against Hydrogen-Peroxide-Induced Oxidative Stress in Cultured Hepatocytes. J. Food Biochem. 2016, 40, 284–293. [Google Scholar] [CrossRef]
- Bekeschus, S.; Kolata, J.; Winterbourn, C.; Kramer, A.; Turner, R.; Weltmann, K.D.; Bröker, B.; Masur, K. Hydrogen peroxide: A central player in physical plasma-induced oxidative stress in human blood cells. Free Radic. Res. 2014, 48, 542–549. [Google Scholar] [CrossRef]
- Mikuls, T.R.; O’Dell, J.R.; Ertl, R.; Bergman, D.A.; Rennard, S.I. Examining the exhaled levels of hydrogen peroxide in rheumatoid arthritis: A pilot study. Ann. Rheum. Dis. 2006, 65, 1252–1253. [Google Scholar] [CrossRef] [Green Version]
- Hahn, D.M.; Chamseddine, A.H.; Miller, F.J. The effect of superoxide and hydrogen peroxide in atherosclerosis. J. Investig. Med. 2004, 52, 1081–5589. [Google Scholar] [CrossRef]
- Park, J.G.; Oh, G.T. The role of peroxidases in the pathogenesis of atherosclerosis. BMB Rep. 2011, 44, 497–505. [Google Scholar] [CrossRef] [Green Version]
- Teng, Y.; Sun, P.L.; Zhang, J.Y.; Yu, R.B.; Bai, J.L.; Yao, X.; Huang, M.; Adcock, M.I.; Barnes, P.J. Hydrogen Peroxide in Exhaled Breath Condensate in Patients with Asthma A Promising Biomarker? Chest 2011, 140, 108–116. [Google Scholar] [CrossRef] [PubMed] [Green Version]
- Cristofari-Marquand, E.; Kacel, M.; Milhe, F.; Magnan, A.; Lehucher-Michel, M.P. Asthma caused by peracetic acid-hydrogen peroxide mixture. J. Occup. Health 2007, 49, 155–158. [Google Scholar] [CrossRef] [PubMed] [Green Version]
- Rahimi, R.; Nikfar, S.; Larijani, B.; Abdollahi, M. A review on the role of antioxidants in the management of diabetes and its complications. Biomed. Pharmacother. 2005, 59, 365–373. [Google Scholar] [CrossRef] [PubMed]
- Tabner, B.J.; Turnbull, S.; Fullwood, N.J.; German, M.; Allsop, D. The production of hydrogen peroxide during early-stage protein aggregation: A common pathological mechanism in different neurodegenerative diseases? Biochem. Soc. Trans. 2005, 33, 548–550. [Google Scholar] [CrossRef] [PubMed] [Green Version]
- Kung, C.C.; Lin, P.Y.; Buse, F.J.; Xue, Y.H.; Yu, X.; Dai, L.M.; Liu, C.C. Preparation and characterization of three dimensional graphene foam supported platinum-ruthenium bimetallic nanocatalysts for hydrogen peroxide based electrochemical biosensors. Biosens. Bioelectron. 2014, 52, 1–7. [Google Scholar] [CrossRef]
- Gong, Y.F.; Chen, X.; Lu, Y.L.; Yang, W.S. Self-assembled dipeptide-gold nanoparticle hybrid spheres for highly sensitive amperometric hydrogen peroxide biosensors. Biosens. Bioelectron. 2015, 66, 392–398. [Google Scholar] [CrossRef] [PubMed]
- Ezhilarasu, H.; Vishalli, D.; Dheen, S.T.; Bay, B.H.; Srinivasan, D.K. Nanoparticle-Based Therapeutic Approach for Diabetic Wound Healing. Nanomaterials 2020, 10, 1234. [Google Scholar] [CrossRef] [PubMed]
- Sergeev, M.M.; Zakoldaev, R.A.; Itina, T.E.; Varlamov, P.V.; Kostyuk, G.K. Real-Time Analysis of Laser-Induced Plasmon Tuning in Nanoporous Glass Composite. Nanomaterials 2020, 10, 1131. [Google Scholar] [CrossRef] [PubMed]
- Thiruppathi, A.R.; Sidhureddy, B.; Boateng, E.; Soldatov, D.V.; Chen, A. Synthesis and Electrochemical Study of Three-Dimensional Graphene-Based Nanomaterials for Energy Applications. Nanomaterials 2020, 10, 1295. [Google Scholar] [CrossRef]
- Shen, J.; Shafiq, M.; Ma, M.; Chen, H. Synthesis and Surface Engineering of Inorganic Nanomaterials Based on Microfluidic Technology. Nanomaterials 2020, 10, 1177. [Google Scholar] [CrossRef] [PubMed]
- Yagati, A.K.; Min, J.; Cho, S. Electrosynthesis of ERGO-NP Nanocomposite Films for Bioelectrocatalysis of Horseradish Peroxidase towards H2O2. J. Electrochem. Soc. 2014, 161, G133–G140. [Google Scholar] [CrossRef]
- Yagati, A.K.; Choi, Y.; Park, J.; Choi, J.W.; Jun, H.S.; Cho, S. Silver nanoflower-reduced graphene oxide composite based micro-disk electrode for insulin detection in serum. Biosens. Bioelectron. 2016, 80, 307–314. [Google Scholar] [CrossRef]
- Truong, T.T.V.; Kumar, S.R.; Huang, Y.T.; Chen, D.W.; Liu, Y.K.; Lue, S.J. Size-Dependent Antibacterial Activity of Silver Nanoparticle-Loaded Graphene Oxide Nanosheets. Nanomaterials 2020, 10, 1207. [Google Scholar] [CrossRef]
- Liu, H.P.; Liu, T.Z.; Zhang, L.; Han, L.; Gao, C.B.; Yin, Y.D. Etching-Free Epitaxial Growth of Gold on Silver Nanostructures for High Chemical Stability and Plasmonic Activity. Adv. Funct. Mater. 2015, 25, 5435–5443. [Google Scholar] [CrossRef]
- Yagati, A.K.; Pyun, J.C.; Min, J.; Cho, S. Label-free and direct detection of C-reactive protein using reduced graphene oxide-nanoparticle hybrid impedimetric sensor. Bioelectrochemistry 2016, 107, 37–44. [Google Scholar] [CrossRef]
- Yagati, A.K.; Park, J.; Cho, S. Reduced Graphene Oxide Modified the Interdigitated Chain Electrode for an Insulin Sensor. Sensors 2016, 16, 109. [Google Scholar] [CrossRef] [PubMed]
- Pierzynski, G.M.; Sims, J.T.; Vance, G.F. Soils and Environmental Quality. In Handbook on Metalloproteins; Bertini, I., Sigel, A., Sigel, H., Eds.; CRC Press: Boca Raton, FL, USA, 2001. [Google Scholar]
- Yang, X.X.; Kanter, J.; Piety, N.Z.; Benton, M.; Vignes, S.M.; Shevkoplyas, S.S. A Simple, Rapid, Low-Cost Test for the Diagnosis of Sickle Cell Disease Using a Paper-Based Hemoglobin Solubility Assay. Blood 2012, 120, 245. [Google Scholar] [CrossRef]
- Li, F.P.; Nie, M.Z.; He, X.L.; Fei, J.J.; Ding, Y.L.; Feng, B. Direct electrochemistry and electrocatalysis of hemoglobin on a glassy carbon electrode modified with poly(ethylene glycol diglycidyl ether) and gold nanoparticles on a quaternized cellulose support. A sensor for hydrogen peroxide and nitric oxide. Microchim. Acta 2014, 181, 1541–1549. [Google Scholar] [CrossRef]
- Hosseinzadeh, R.; Moosavi-Movahedi, A.A.; Ghourchian, H. Electrochemistry and molecular modeling of the hemoglobin-benzene interaction with a nanocrystalline mixed metal oxide. RSC Adv. 2014, 4, 49128–49136. [Google Scholar] [CrossRef]
- Wu, H.; Sun, B.J.; Huang, D.Q.; Liu, Y.T.; Zhang, H. Characterization, Direct Electrochemistry, and Electrocatalysis of Immobilized Hemoglobin on a Platinum Nanoparticle-Didodecyldimethylammonium Bromide Composite Film. Anal. Lett. 2016, 49, 556–567. [Google Scholar] [CrossRef]
- Murru, F.; Romero, F.J.; Sánchez-Mudarra, R.; Ruiz, F.J.G.; Morales, D.P.; Capitán-Vallvey, L.F.; Salinas-Castillo, A. Portable Instrument for Hemoglobin Determination Using Room-Temperature Phosphorescent Carbon Dots. Nanomaterials 2020, 10, 825. [Google Scholar] [CrossRef] [PubMed]
- Chen, L.; Xu, Z.R. A three-dimensional nickel-doped reduced graphene oxide composite for selective separation of hemoglobin with a high adsorption capacity. RSC Adv. 2016, 6, 56278–56286. [Google Scholar] [CrossRef]
- Dong, L.H.; Guan, G.Z.; Wei, X.; Zhao, X.L.; Xv, M. Creating SERS hot spots on length adjustable AgVO3 nanobelts. J. Alloy. Compd. 2016, 677, 12–17. [Google Scholar] [CrossRef]
- Barbillon, G. Latest Novelties on Plasmonic and Non-Plasmonic Nanomaterials for SERS Sensing. Nanomaterials 2020, 10, 1200. [Google Scholar] [CrossRef]
- Fazio, B.; D’Andrea, C.; Foti, A.; Messina, E.; Irrera, A.; Donato, M.G.; Villari, V.; Micali, N.; Maragò, O.M.; Gucciardi, P.G. SERS detection of Biomolecules at Physiological pH via aggregation of Gold Nanorods mediated by Optical Forces and Plasmonic Heating. Sci. Rep. 2016, 6, 26952. [Google Scholar] [CrossRef] [Green Version]
- Ilkhani, H.; Hughes, T.; Li, J.; Zhong, C.J.; Hepel, M. Nanostructured SERS-electrochemical biosensors for testing of anticancer drug interactions with DNA. Biosens. Bioelectron. 2016, 80, 257–264. [Google Scholar] [CrossRef] [PubMed]
- Pellow-Jarman, M.V.; Hendra, P.J.; Lehnert, R.J. The dependence of Raman signal intensity on particle size for crystal powders. Vib. Spectrosc. 1996, 12, 257–261. [Google Scholar] [CrossRef]
- Srichan, C.; Ekpanyapong, M.; Horprathum, M.; Eiamchai, P.; Nuntawong, N.; Phokharatkul, D.; Danvirutai, P.; Bohez, E.; Wisitsoraat, A.; Tuantranont, A. Highly-Sensitive Surface-Enhanced Raman Spectroscopy (SERS)-based Chemical Sensor using 3D Graphene Foam Decorated with Silver Nanoparticles as SERS substrate. Sci. Rep. 2016, 6, 23733. [Google Scholar] [CrossRef] [PubMed]
- Zoppi, A.; Trigari, S.; Margheri, G.; Muniz-Miranda, M.; Giorgetti, E. Gold nanostars as SERS-active substrates for FT-Raman spectroscopy. RSC Adv. 2015, 5, 8523–8532. [Google Scholar] [CrossRef]
- Chinnadayyala, S.R.; Park, J.; Abbasi, M.A.; Cho, S. Label-free electrochemical impedimetric immunosensor for sensitive detection of IgM rheumatoid factor in human serum. Biosen. Bioelectron. 2019, 143, 111642. [Google Scholar] [CrossRef]
- Hui, N.; Gao, R.F.; Li, X.Q.; Sun, W.; Jiao, K. Direct Electrochemistry of Hemoglobin Immobilized in Polyvinylalcohol and Clay Composite Film Modified Carbon Ionic Liquid Electrode. J. Brazil. Chem. Soc. 2009, 20, 252–258. [Google Scholar] [CrossRef] [Green Version]
- Choi, Y.J.; Luo, T.J.M. Electrochemical properties of Silver Nanoparticle Doped Aminosilica Nanaocomposite. Int. J. Electrochem. 2011, 2011, 404937. [Google Scholar] [CrossRef] [Green Version]
- Jiang, H.; Chen, Z.H.; Cao, H.Y.; Huang, Y.M. Peroxidase-like activity of chitosan stabilized silver nanoparticles for visual and colorimetric detection of glucose. Analyst 2012, 137, 5560–5564. [Google Scholar] [CrossRef]
- Le, H.T.N.; Park, J.; Chinnadayyala, S.R.; Cho, S. Sensitive electrochemical detection of amyloid beta peptide in human serum using an interdigitated chain-shaped electrode. Biosens. Bioelectron. 2019, 144, 111694. [Google Scholar]
- Wang, J. Analytical Electrochemistry, 2nd ed.; Wiley: New York, NY, USA, 2000; p. 209. [Google Scholar]
- Kamin, R.A.; Wilson, G.S. Rotating ring-disk enzyme electrode for biocatalysis kinetic studies and characterization of the immobilized enzyme layer. Anal. Chem. 1980, 52, 1198–1205. [Google Scholar] [CrossRef]
- Gao, L.Z.; Zhuang, J.; Nie, L.; Zhang, J.; Zhang, Y.; Gu, N.; Wang, T.; Feng, J.; Yang, D.; Perrett, S.; et al. Intrinsic peroxidase-like activity of ferromagnetic nanoparticles. Nat. Nanotechnol. 2007, 2, 577–583. [Google Scholar] [PubMed]
- Zhang, L.; Han, L.; Hu, P.; Wang, L.; Dong, S. TiO2 nanotube arrays: Intrinsic peroxidase mimetics. Chem. Commun. 2013, 49, 10480–10482. [Google Scholar] [CrossRef] [PubMed]
- Mu, J.; Wang, Y.; Zhang, L. Intrinsic peroxidase-like activity and catalase-like activity of Co3O4 nanoparticles. Chem. Commun. 2012, 48, 2540–2542. [Google Scholar] [CrossRef] [PubMed]
- Cai, K.; Lv, Z.C.; Chen, K.; Huang, L.; Wang, J.; Shao, F.; Wang, Y.; Han, H. Aqueous synthesis of porous platinum nanotubes at room temperature and their intrinsic peroxidase-like activity. Chem. Commun. 2013, 49, 6024–6026. [Google Scholar] [CrossRef] [PubMed]
- Jiang, L.Y.; Hu, J.P.; Foord, J.S. Electroanalysis of Hydrogen Peroxide at Boron Doped Diamond Electrode Modified by Silver Nanoparticles and Haemoglobin. Electrochim. Acta 2015, 176, 488–496. [Google Scholar] [CrossRef]
- Xu, X.X.; Zhang, J.X.; Guo, F.; Zheng, W.; Zhou, H.M.; Wang, B.L.; Zheng, Y.F.; Wang, Y.B.; Cheng, Y.; Lou, X.; et al. A novel amperometric hydrogen peroxide biosensor based on immobilized Hb in Pluronic P123-nanographene platelets composite. Colloids Surface B 2011, 84, 427–432. [Google Scholar] [CrossRef]
- Zhang, L.L.; Han, G.Q.; Liu, Y.; Tang, J.; Tang, W.H. Immobilizing haemoglobin on gold/graphene-chitosan nanocomposite as efficient hydrogen peroxide biosensor. Sens. Actuators B Chem. 2014, 197, 164–171. [Google Scholar] [CrossRef]
- Bai, J.; Wu, L.P.; Wang, X.J.; Zhang, H.M. Hemoglobin-graphene modified carbon fiber microelectrode for direct electrochemistry and electrochemical H2O2 sensing. Electrochim. Acta 2015, 185, 142–147. [Google Scholar] [CrossRef]
- Shan, D.; Wang, S.X.; Zhu, D.B.; Xue, H.G. Studies on direct electron transfer and biocatalytic properties of hemoglobin in polyracrylonitrile matrix. Bioelectrochemistry 2007, 71, 198–203. [Google Scholar] [CrossRef]
- Liu, H.; Duan, C.Y.; Su, X.; Dong, X.N.; Shen, W.Q.; Zhu, Z.F. Titania nanoparticles modified reduced graphene oxide nanocomposite with a double-layered structure encapsulating hemoglobin for a mediator-free biosensor. Ceram. Int. 2014, 40, 9867–9874. [Google Scholar] [CrossRef]
- Chen, X.Q.; Wang, Q.X.; Wang, L.H.; Gao, F.; Wang, W.; Hu, Z.S. Imidazoline derivative templated synthesis of broccoli-like Bi2S3 and its electrocatalysis towards the direct electrochemistry of hemoglobin. Biosens. Bioelectron. 2015, 66, 216–223. [Google Scholar] [CrossRef] [PubMed]
- Liu, H.; Duan, C.; Su, X.; Dong, X.; Huang, Z.; Shen, W.; Zhu, Z. A hemoglobin encapsulated titania nanosheet modified reduced graphene oxide nanocomposite as a mediator-free biosensor. Sens. Actuators B Chem. 2014, 203, 303–310. [Google Scholar] [CrossRef]


| Electrodes | RS [Ω] | CPE-T (×10−9 Ω−1 sCPE−P) | CPE−P | RCT (Ω) |
|---|---|---|---|---|
| ITO | 1161 ± 10.25 | 31.97 ± 1.46 | 0.947 ± 0.005 | 49,562 ± 594.47 |
| AgNF/ITO | 1035 ± 20.74 | 41.63 ± 4.81 | 0.921 ± 0.012 | 28,577 ± 715.05 |
| 3-MPA | 1049 ± 18.89 | 78.7 ± 4.96 | 0.869 ± 0.007 | 149,970 ± 359.1 |
| EDC–NHS | 1040 ± 19.49 | 64.5 ± 4.82 | 0.885 ± 0.008 | 83,884 ± 1932 |
| Hb/AgNF/ITO | 1058 ± 12.96 | 57.9 ± 1.67 | 0.892 ± 0.003 | 879,780 ± 15,899 |
| Modified Electrode Sensors | Applied Potential (V) vs. Ag/AgCl | Detection Limit (µM) | Detection Range (µM) | Sensitivity (µA mM−1 cm−2) | Reference |
|---|---|---|---|---|---|
| Hb/AgNPs BDDE a | −0.4 | 4.81 | 500 to 20,000 | 12.48 | [47] |
| Hb/P123-NGP b | −0.4 | 8.24 | 10 to 150 | - | [48] |
| Hb/Au/GR-CS/GCE c | −0.385 | 0.35 | 2 to 935 | 0.35 | [49] |
| Hb/GCFME d | −0.5 | 2 | 8 to 214 | 1400 | [50] |
| Hb-PAN e/GCE f | −0.25 | 8.3 | 8.3 to 500 | - | [51] |
| Nafion/Hb/TiO2NPs g-rGO h/GCE | −0.35 | 0.01 | 0.1 to 140 | - | [52] |
| Nafion/Hb-CS i-bBi2S3 j/GCE | −0.4 | 0.096 | 0.4 to 4.8 | - | [53] |
| Nafion/Hb/TiO2NS k-rGO/GCE | −0.35 | 0.01 | 0.1 to 145 | - | [54] |
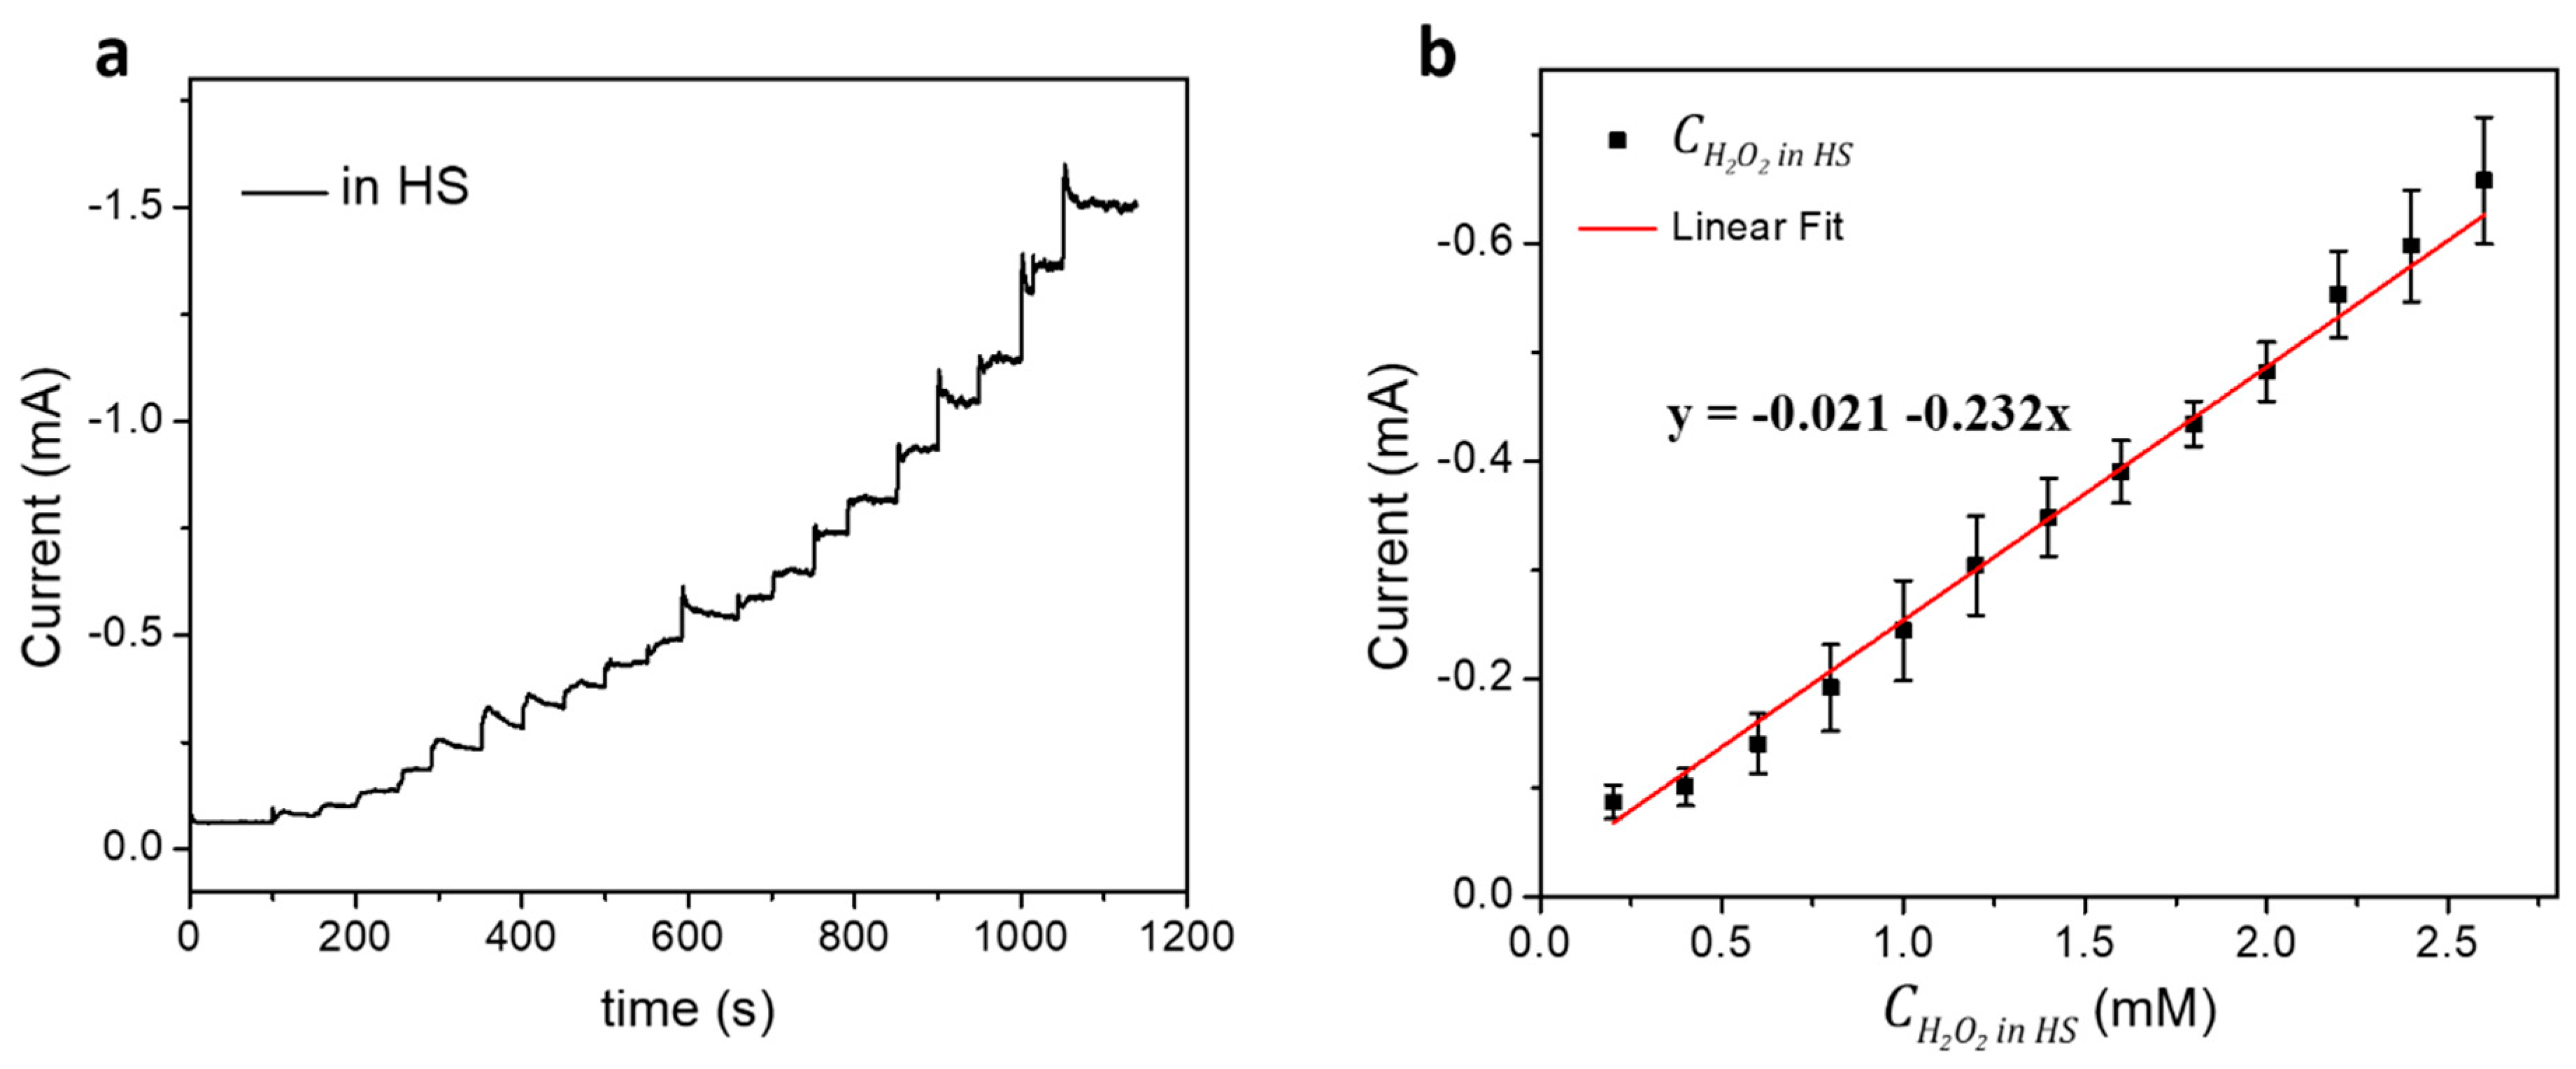
| Hb/AgNF/ITO | −0.5 | 0.12 (in PBS); 90 (in HS) | 200 to 3400 (in PBS); 200 to 2600 (in HS) | 956 (in PBS); 730 (in HS) | This work |
© 2020 by the authors. Licensee MDPI, Basel, Switzerland. This article is an open access article distributed under the terms and conditions of the Creative Commons Attribution (CC BY) license (http://creativecommons.org/licenses/by/4.0/).
Share and Cite
Yagati, A.K.; Ngoc Le, H.T.; Cho, S. Bioelectrocatalysis of Hemoglobin on Electrodeposited Ag Nanoflowers toward H2O2 Detection. Nanomaterials 2020, 10, 1628. https://doi.org/10.3390/nano10091628
Yagati AK, Ngoc Le HT, Cho S. Bioelectrocatalysis of Hemoglobin on Electrodeposited Ag Nanoflowers toward H2O2 Detection. Nanomaterials. 2020; 10(9):1628. https://doi.org/10.3390/nano10091628
Chicago/Turabian StyleYagati, Ajay Kumar, Hien T. Ngoc Le, and Sungbo Cho. 2020. "Bioelectrocatalysis of Hemoglobin on Electrodeposited Ag Nanoflowers toward H2O2 Detection" Nanomaterials 10, no. 9: 1628. https://doi.org/10.3390/nano10091628