Article

Enhanced Photo-Assisted Acetone Gas Sensor and Efficient Photocatalytic Degradation Using Fe-Doped Hexagonal and Monoclinic WO3 Phase−Junction

1
College of Chemistry and Chemical Engineering, Henan Institute of Science and Technology, Xinxiang 453000, China
2
College of Chemistry and Molecular Engineering, Zhengzhou University, Zhengzhou 450052, China
3
College of Chemistry and Chemical Engineering, Xinxiang University, Xinxiang 453000, China
4
College of Chemical Engineering and Materials, Zhengzhou University of Light Industry, Zhengzhou 450000, China
*
Authors to whom correspondence should be addressed.
Nanomaterials 2020, 10(2), 398; https://doi.org/10.3390/nano10020398
Submission received: 23 January 2020 / Revised: 16 February 2020 / Accepted: 21 February 2020 / Published: 24 February 2020

Abstract

:
The development of WO3-based gas sensors for analysis of acetone in exhaled breath is significant for noninvasive diagnosis of diabetes. A series of Fe-doped hexagonal and monoclinic WO3 phase−junction (Fe−h/m−WO3) sensors were synthesized by the hydrothermal calcination method, and the influences of operating temperature and light irradiation on the response were studied. Under light emitting diode (LED) illumination, Fe−h/m−WO3 exhibited higher responses to acetone than those of the undoped WO3-based sensors at an operating temperature of 260 °C with 90% relative humidity, and good linearity between response and acetone concentration (0.5 to 2.5 ppm) was achieved under the 90% relative humidity condition. Meanwhile, the optimal Fe−h/m−WO3 sensor exhibited high selectivity and stability for a duration of three months. The excellent sensing performance of Fe−h/m−WO3 was attributed to the formation of phase−junction and Fe doping, and these were beneficial for the separation of photon−generated carriers and oxygen adsorption on the WO3 surface, promoting the generation of superoxide radicals, which was demonstrated by electron paramagnetic resonance and photocurrent tests. Additionally, the Fe−doped WO3 phase−junction sample also showed good photocatalytic performance for rhodamine B degradation. This study may provide some insights into rational design of new types of gas sensors and offer an alternative for noninvasive diagnosis of diabetes.

Graphical Abstract

1. Introduction

Over the last few years, breath analysis, as a rapid, cheap and non−invasive biological method, has attracted much attention in diagnosing and monitoring medical fields [1,2,3]. Among the multiple inorganic gases (e.g., O2, CO2, NO, NH3) and volatile organic compounds in the exhaled breath, acetone, as a generally accepted biomarker for type−I and type−II diabetes, has been studied in detail and used to monitor metabolic disorders [4,5]. The analysis of acetone in the exhaled breath exhibits higher sensitivity than the detection of blood glucose [6]. The clinical data indicated that the exhaled acetone of healthy people was believed to be lower than 0.9 ppm, while that of diabetes exceeded 1.8 ppm [7,8,9]. It is meaningful to explore low−cost and steady gas sensors for detecting low concentrations of acetone in the exhaled breath.
Up to now, semiconductor gas sensors have been widely known for their excellent response, superior testing precision, low cost and long working life [3,10]. In a typical semiconducting sensor head, metal oxides including ZnO [11], TiO2 [12], MoS2 [13] and NiFe2O4 [4] have been widely admitted as good sensing materials for multiple gases, due to the change of electric conductivity, caused by the interaction of gas molecules and sensing material. Tungsten trioxide (WO3), as a n−type semiconductor, has been extensively used as a gas sensor material for detecting toxic gases such as NO2, NH3, H2S and acetone [13,14,15]. However, the pure WO3 material is still unable to meet the current demand for low concentration acetone detection limits and high selectivity in breath analysis [1,2]. Various approaches, including regulating particle size, controlling morphology, designing crystal structure, building surface defects and adjusting interface properties, have been adopted to solve the above problems [10,16,17]. Li et al. [18] reported that the gas-sensing property of a Co-doped monoclinic phase WO3 for acetone molecules was significantly improved due to the effect of lattice defect and Co doping, which facilitated gas adsorption. It is noteworthy that various band structures and interface properties existed in different WO3 materials [19,20]. In the lattice structure of WO3 with a hexagonal phase, the open structure could affect the adsorption property on the surface [21]. Additionally, the separation of photon-generated carriers is vital for the sensitivity of metal oxide based gas sensors [10]. The construction of semiconductor phase-junctions becomes one of the effective approaches for enhanced carrier separation. Li et al. [22,23] reported that the anatase−rutile phase junction of TiO2 greatly enhanced the photocatalytic activity, and then they demonstrated that efficient charge separation and transfer were achieved across the α−β phase junction of Ga2O3 leading to enhanced photocatalytic performance. Hence, the formation of WO3 phase junctions with hexagonal and monoclinic phase could promote the electron hole separation.
Apart from the carrier separation in semiconductors, the acetone-sensing property of the semiconductors relies heavily on the surface conductivity induced by chemical reactions between the target gases and oxygen species adsorbed onto the surface [17]. As for the general acetone-sensing mechanism (Equations (1)–(4)) [18], the oxygen ions were formed by drawing electrons from the conduction band of metal oxide, and different oxygen species (O2, O and O2−) were formed depending on the operating temperature [16].
O2(ads) + e → O2·(ads)
O2·(ads) + e → 2 O·(ads)
O·(ads) + e → O2−·(ads)
CH3COCH3(gas) + O2− → CO2 + H2O + 2e
Based on the mechanism, the enhancement of oxygen adsorption ability was a positive approach for increasing gas-sensing performance of semiconductors. Sukunta et. al. found that Fe(III)-doping in SnO2 could result in the creation of holes through the defect reactions, leading to the change of atoms surrounding the adsorption sites and further resulting in a large change of conductivity in air and in target gas [24]. Guo et. al. further proved that the oxygen vacancies in Fe-doped ZnO often acts as an adsorption and a reaction site to form plentiful O2 and O2−, and Fe-doping provided a large number of gas adsorption sites and could trap electrons from ZnO easily, leading to the enhancement of gas sensitivity [25]. Besides, UV−visible light irradiation created a charge transport that increased the density of free electron–hole pairs in WO3 semiconductor [26]. The Fe-doping not only could produce oxygen vacancies, promoting the oxygen adsorption ability, but also formed impurity energy levels in the band gap, increasing the light energy utilization [27]. Hence, Fe-doped WO3 phase junctions may be an applicable material for photo-assisted exhaled analysis.
In this study, Fe-doped hexagonal and monoclinic WO3 junction was synthesized, and the photocatalytic performance for rhodamine B (RhB) degradation was studied under visible-light illumination. The gas-sensing performances of the prepared samples including sensitivity, selectivity and stability were comprehensively investigated under light emitting diode (LED) light illumination, and the influences of operating temperature and relative humidity (RH) on the analysis of acetone content were discussed. The response was improved, and the optimal operating temperature was lower than the pure WO3 sensor [28,29,30]. Fe-doped WO3 phase junctions exhibited excellent linearity at 90% RH atmosphere under LED illumination. The gas-sensing mechanism under illumination was finally proposed.

2. Materials and Methods

2.1. Materials Synthesis

A series of Fe-doped hexagonal and monoclinic WO3 phase junction samples were synthesized by the solvothermal calcination method. Typically, 0.56 g ammonium metatungstate was dissolved into 30 mL HCl solution (6 mol/L) under magnetic stirring, and then different amounts of Fe(NO3)3·9H2O were added. The obtained reddish solution was subsequently placed into a Teflon−lined autoclave and maintained at 180 °C for 6.5 h. The precursor was collected by centrifugation and washed with ethanol, along with vacuum drying. The final products were obtained by annealing at 475 °C for 2 h and denoted as xFe−h/m−WO3, where x represented the Fe/W molar ratio. For comparison, the undoped WO3 phase junction (h/m−WO3), monoclinic WO3 (m−WO3) and hexagonal WO3 (h−WO3) samples were synthesized by the similar procedure without the existence of Fe(NO3) 3·9H2O and annealed at 475, 415 and 500 °C, respectively. The contents of W and Fe were identified by the inductively coupled plasma atomic emission spectrometer (ICP−AES) measurements (Table S1).

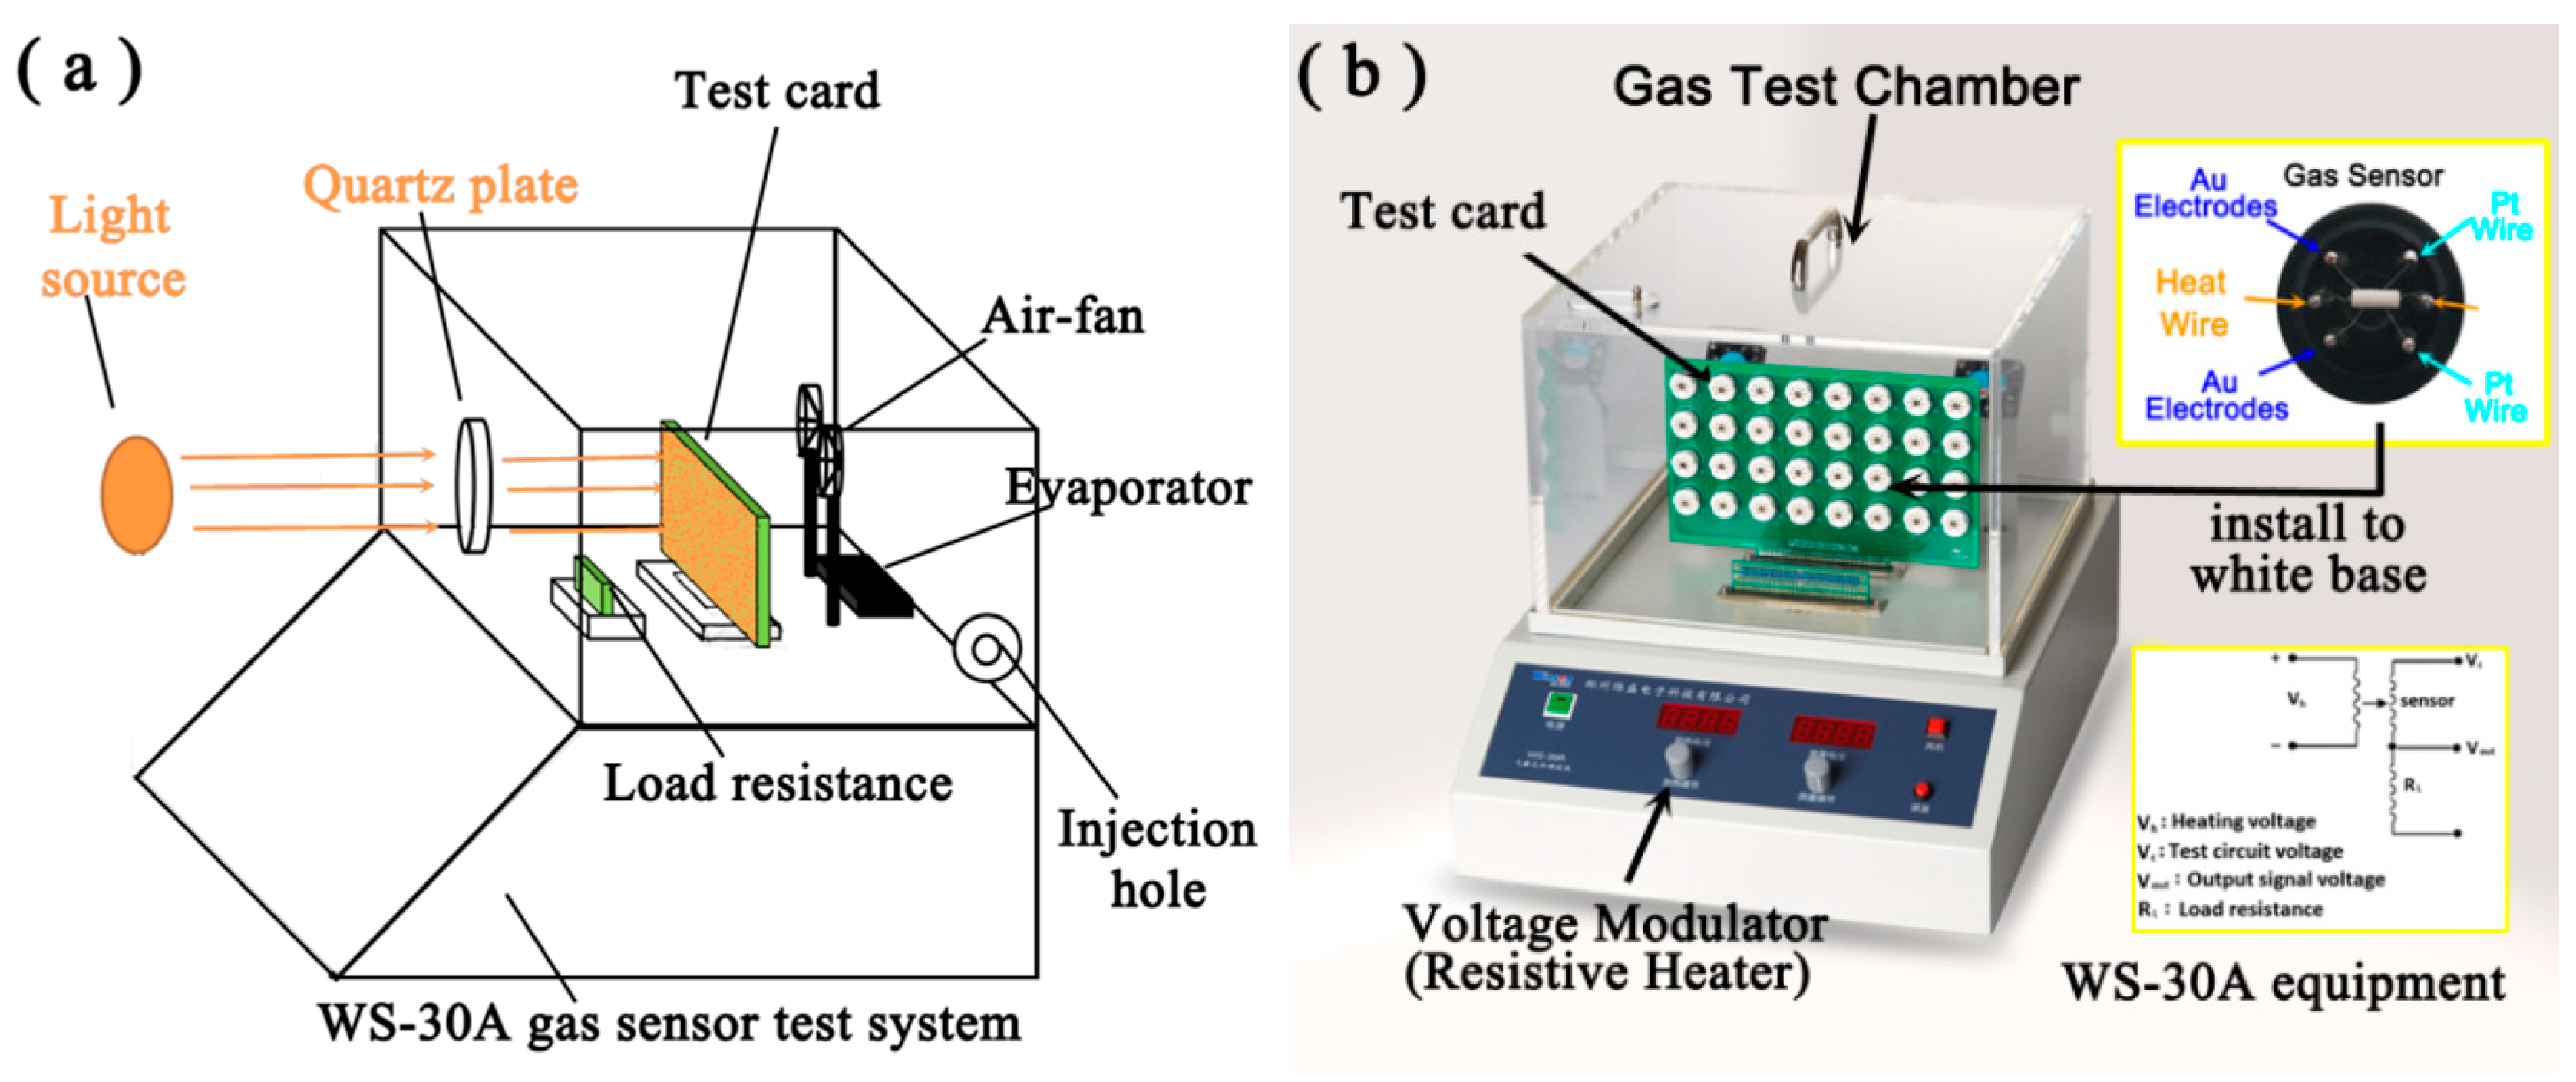
2.2. Gas Sensor Fabrication

About 15 mg of the WO3-based samples were mixed with 2~3 drops of terpineol to form a paste, which was then coated uniformly onto the surface of a ceramic tube with a pair of gold electrodes with a gap length of 2 mm and connected by platinum wires. The obtained WO3 sensing film was dried at 60 °C for 2 h. A Ni−Cr resistor wire was put through the ceramic tube as a heater to achieve the required working temperature. All the fabricated WO3 gas sensors were aged at 300 °C for 7 days in air.

2.3. Structural Characterization

The crystal structures of the obtained samples were determined by powder X−ray diffractometer (PANalytical X’Pert PRO, Netherlands) operating at 40 kV and 35 mA, using Cu Kα radiation (λ =1.5418 Å) with a scanning speed of 0.2 °/s. The surface area was measured by N2 absorption−desorption test using automated surface area and prose size analyzer (BELSORP−max, MicrotracBEL Inc., Japan). The morphology of the products was determined with a JEOL JEM-2010 and Tecnai G2 F20 (FEI Inc., USA) at the operating voltage of 200 kV. In high-resolution transmission electron microscopy (HRTEM), the corresponding fast Fourier transform (FFT) was obtained by Gatan Digital Micrograph software (Gatan Inc., America). X−ray photoelectron spectroscopy (XPS) measurements were carried out on a X−ray photoelectron spectrometer (PHI−5400, Perkin Elmer Inc., USA). Al radiation (hv = 1486.6 eV) was adopted as the excitation source and the binding energies were corrected using the background C1s peak (284.6 eV) as a reference.

2.4. Performance Measurements

The gas-sensing properties were measured by the WS-30A gas sensor test system (Zhengzhou Wei Sheng Electronics Technology Co. Ltd., Zhengzhou, China, as shown in Figure 1). The tested gases such as acetone, methanol, ethanol, toluene, CO, NO and NH3 were injected into the closed system, respectively. The response and selectivity were assessed in ambient atmosphere at controlled operating temperature (200−360 °C) under various concentrations. The relative humidity (RH) in environment was controlled by adding additional water on the evaporator. Before the addition of target analytes, liquid water was firstly injected by the micro-syringe and vaporized immediately on the evaporator. Fast gasification and diffusion of water occurred by the evaporator and air fan in the gas test chamber, and water was added to the chamber until the humidity reached experimental requirements. The electrical resistance of the sensors in air or in the target gas is calculated as
R = [RL / (Vc − Vout)]/Vout
where R, RL, Vc and Vout were the sensor resistance, the load resistance, the total loop voltage applied to the electrical circuit and the output voltage across the load resistor, respectively. The gas response (S) to the tested gases was defined as:
S = Ra/Rg
where Rg and Ra were the resistance in air and in the tested gas, respectively. The response and recovery times were chosen from the times to achieve at least 90% resistance change of the saturated value. The light-driven gas sensing properties of the obtained samples were investigated on the reconstructive WS-30A system (Figure 1). A white LED lamp was used as the light source (CEL−LED100HA, Beijing CEAULIGHT Co.), and the gas-sensing properties were measured under LED illumination. The gas response was calculated by the above method. Photocatalytic performance for RhB degradation was measured and the experimental process was described in detail in the supplementary material (S1).

3. Results and discussion

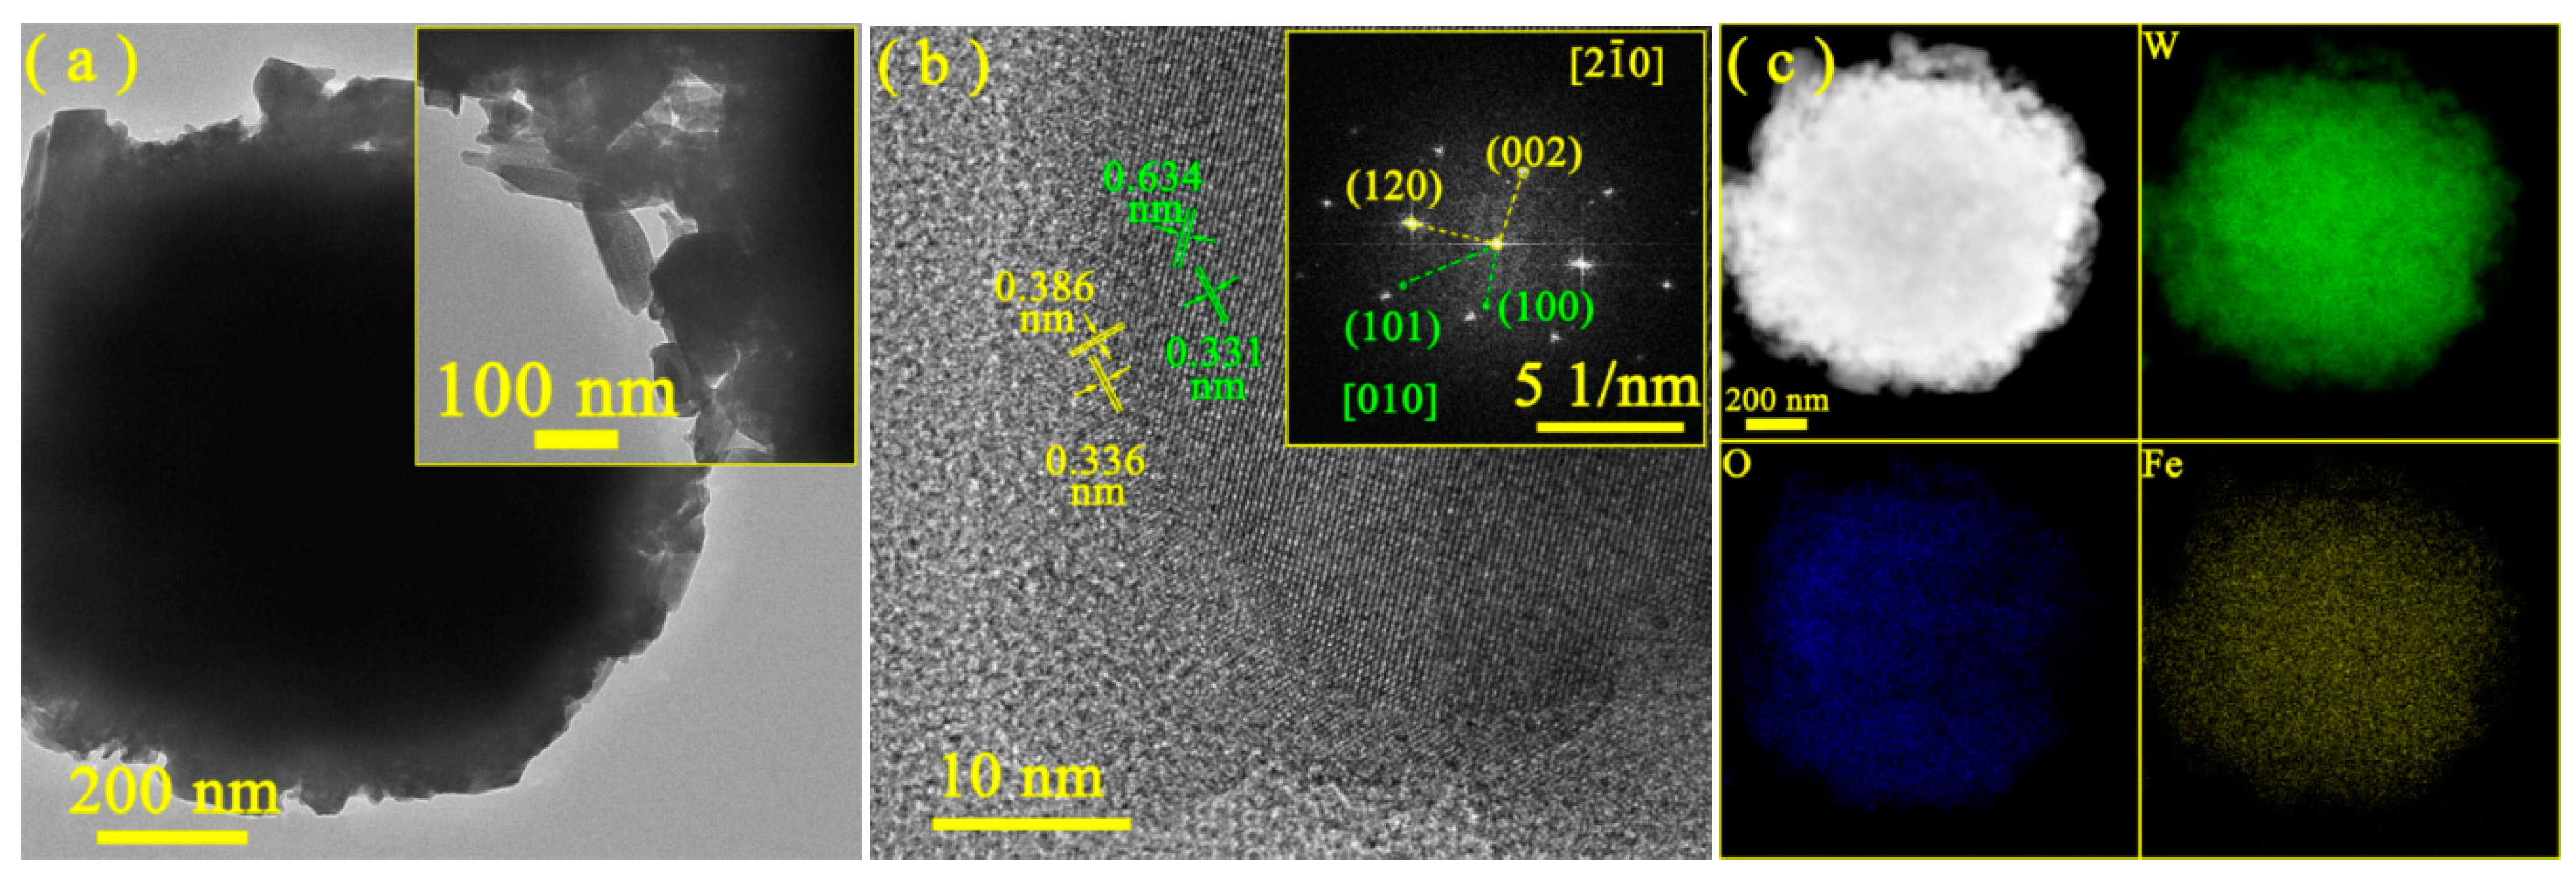
3.1. Morphology and Composition of Materials

The crystal compositions of the as-prepared samples were measured and the results are shown in Figure 2. The main peaks of the m−WO3 sample were observed at 23.0°, 23.5°, 24.3°, 33.1°, 33.5°, 33.8°, 34.0°, 49.5° and 54.1°, which corresponded to (0 0 2), (0 2 0), (2 0 0), (0 2 2), (−2 0 2), (2 0 2) and (2 2 0) diffraction planes of monoclinic WO3 (JCPDS No: 01−089−4476), respectively. For the h−WO3 sample, the distinct peaks at 13.9°, 22.7°, 24.3°, 28.2° and 36.6° were well in agreement with those of (1 0 0), (0 0 1), (1 1 0), (2 0 0) and (2 0 1) planes of hexagonal WO3 (JCPDS No: 00−033−1387). Additionally, both monoclinic and hexagonal phases coexisted in the Fe−doped and undoped h/m−WO3 samples. The locally enlarged XRD patterns were presented in Figure 2b, and it was noteworthy that the characteristic peak of the (2 0 1) crystal plane of hexagonal phase WO3 in the Fe-doped h/m−WO3 sample shifted toward the lower angle region. With the increase of Fe content, the peak of (0 2 0) crystal plane of monoclinic-phase WO3 also exhibited a slight shift. The above results indicated that the Fe impurity was successfully doped into the crystal structure of WO3.
The surface compositions of the as−prepared samples were investigated by XPS measurement. As shown in Figure 3, the high-resolution XPS spectra for W 4f and Fe 2p were deconvoluted by the Gaussian−Lorenzian method. Two evident peaks observed for m−WO3 at the binding energies of 37.9 and 35.8 eV were assigned to W 4f5/2 and W 4f7/2, respectively, which were in accordance with the reported results of monoclinic WO3 [31]. The peaks at 38.0 and 36.0 eV corresponded to the characteristic peaks of W(VI) in hexagonal phase WO3 [32,33]. In h/m−WO3 and 1.25Fe−h/m−WO3 samples, the characteristic peaks of W(VI) for monoclinic and hexagonal phase were discovered in the m−WO3 and h−WO3, respectively [32,34]. Besides, it was observed that W(VI) 4f7/2 and W(V) 4f5/2 peaks of m−WO3 and h−WO3 shifted slightly compared with those of h/m−WO3 and 1.25Fe−h/m−WO3, which were caused by the formation of phase junctions and Fe-doping [6,15]. In the high-resolution Fe 2p spectrum (Figure 3b), the deconvolution peaks were resolved into four components. In particular, two distinct peaks at binding energies of 711.5 and 724.8 eV corresponded to the characteristic peaks of Fe(III) for 2p3/2 and 2p1/2, respectively [35]. Combined with the XRD results, Fe impurity was shown to be successfully doped into the h/m−WO3 phase junction.
The morphologies of the as−prepared samples were investigated by SEM measurements. As shown in Figure S1, distinct agglomeration was observed for all the samples. The size of agglomerated particles for m−WO3 and h−WO3 reached about 1.1 μm. It was noticeable that cuboid nanoparticles appeared in the 1.25Fe−h/m−WO3 sample. Additionally, there was no obvious difference for the surface areas of the samples, based on the result of the N2 absorption−desorption measurements (Table S2). Figure 4 displayed the representative TEM images of representative 1.25Fe−h/m−WO3 sample. As shown in Figure 4a, 1.25Fe−h/m−WO3 was consisted of cuboid and anomaly nanoparticles with partial agglomeration. The HRTEM image of 1.25Fe−h/m−WO3 with representative phase junction structure was shown in Figure 4b. The lattice fringes with interplanar spacings of 0.386 and 0.336 nm were assigned to (1 2 0) and (0 0 2) facets of monoclinic WO3. Additionally, the lattice fringes of (1 0 1) and (1 0 0) planes for hexagonal WO3 were observed, based on the resolved interplanar spacings of 0.631 and 0.331 nm. The simulated FFT pattern is available for locating the highlighted spots, which could be well-indexed to its planes. As shown in the inset of Figure 4b, the zone axis of 1.25Fe−h/m−WO3 sample was calculated from the cross product of the two perpendicular vectors. The junction plane for monoclinic WO3 was thus assigned to (1 2 0) and (0 0 2) facets with the [2 −1 0] zone axis. Similar analysis indicated that the (1 0 1) and (1 0 0) planes of hexagonal WO3 existed along with the [0 1 0] axis direction. The results indicated the formation of hexagonal and monoclinic WO3 phase junctions. The high-resolution TEM images and FFT pattern, combined with XRD results, revealed both hexagonal phase and monoclinic phase were present and fused at the interfaces of 1.25Fe−h/m−WO3. To further study the detailed elemental distribution, energy-filtered W, Fe and O maps of 1.25Fe−h/m−WO3 in Figure 4c revealed that all the elements were uniformly distributed on the particle surface. Based on the above analysis, we conclude the Fe(III) impurity has been doped into the hexagonal and monoclinic WO3 phase junction samples.
UV−Vis light absorption spectra were investigated to determine optical properties of the obtained samples (Figure S3). The absorption edges of WO3−based samples were around 440 nm, and the absorption abilities of hexagonal WO3-based samples were promoted in the range of 550−800 nm, as compared with that of m−WO3, which may be due to the oxygen vacancies of the hexagonal phase WO3 structure. The indirect band gaps (Eg) of WO3-based photocatalysts were calculated by the Kubelka−Munk method [34]. The Eg values of m−WO3 and h−WO3 reached 2.76 and 2.61 eV, respectively. Moreover, the apparent Eg values of h/m−WO3 and Fe−h/m−WO3 samples were between 2.48 and 2.56 eV. With the increase of Fe content, the apparent Eg values gradually decreased, which implied that Fe doping broadened the light absorption range of WO3−based materials.

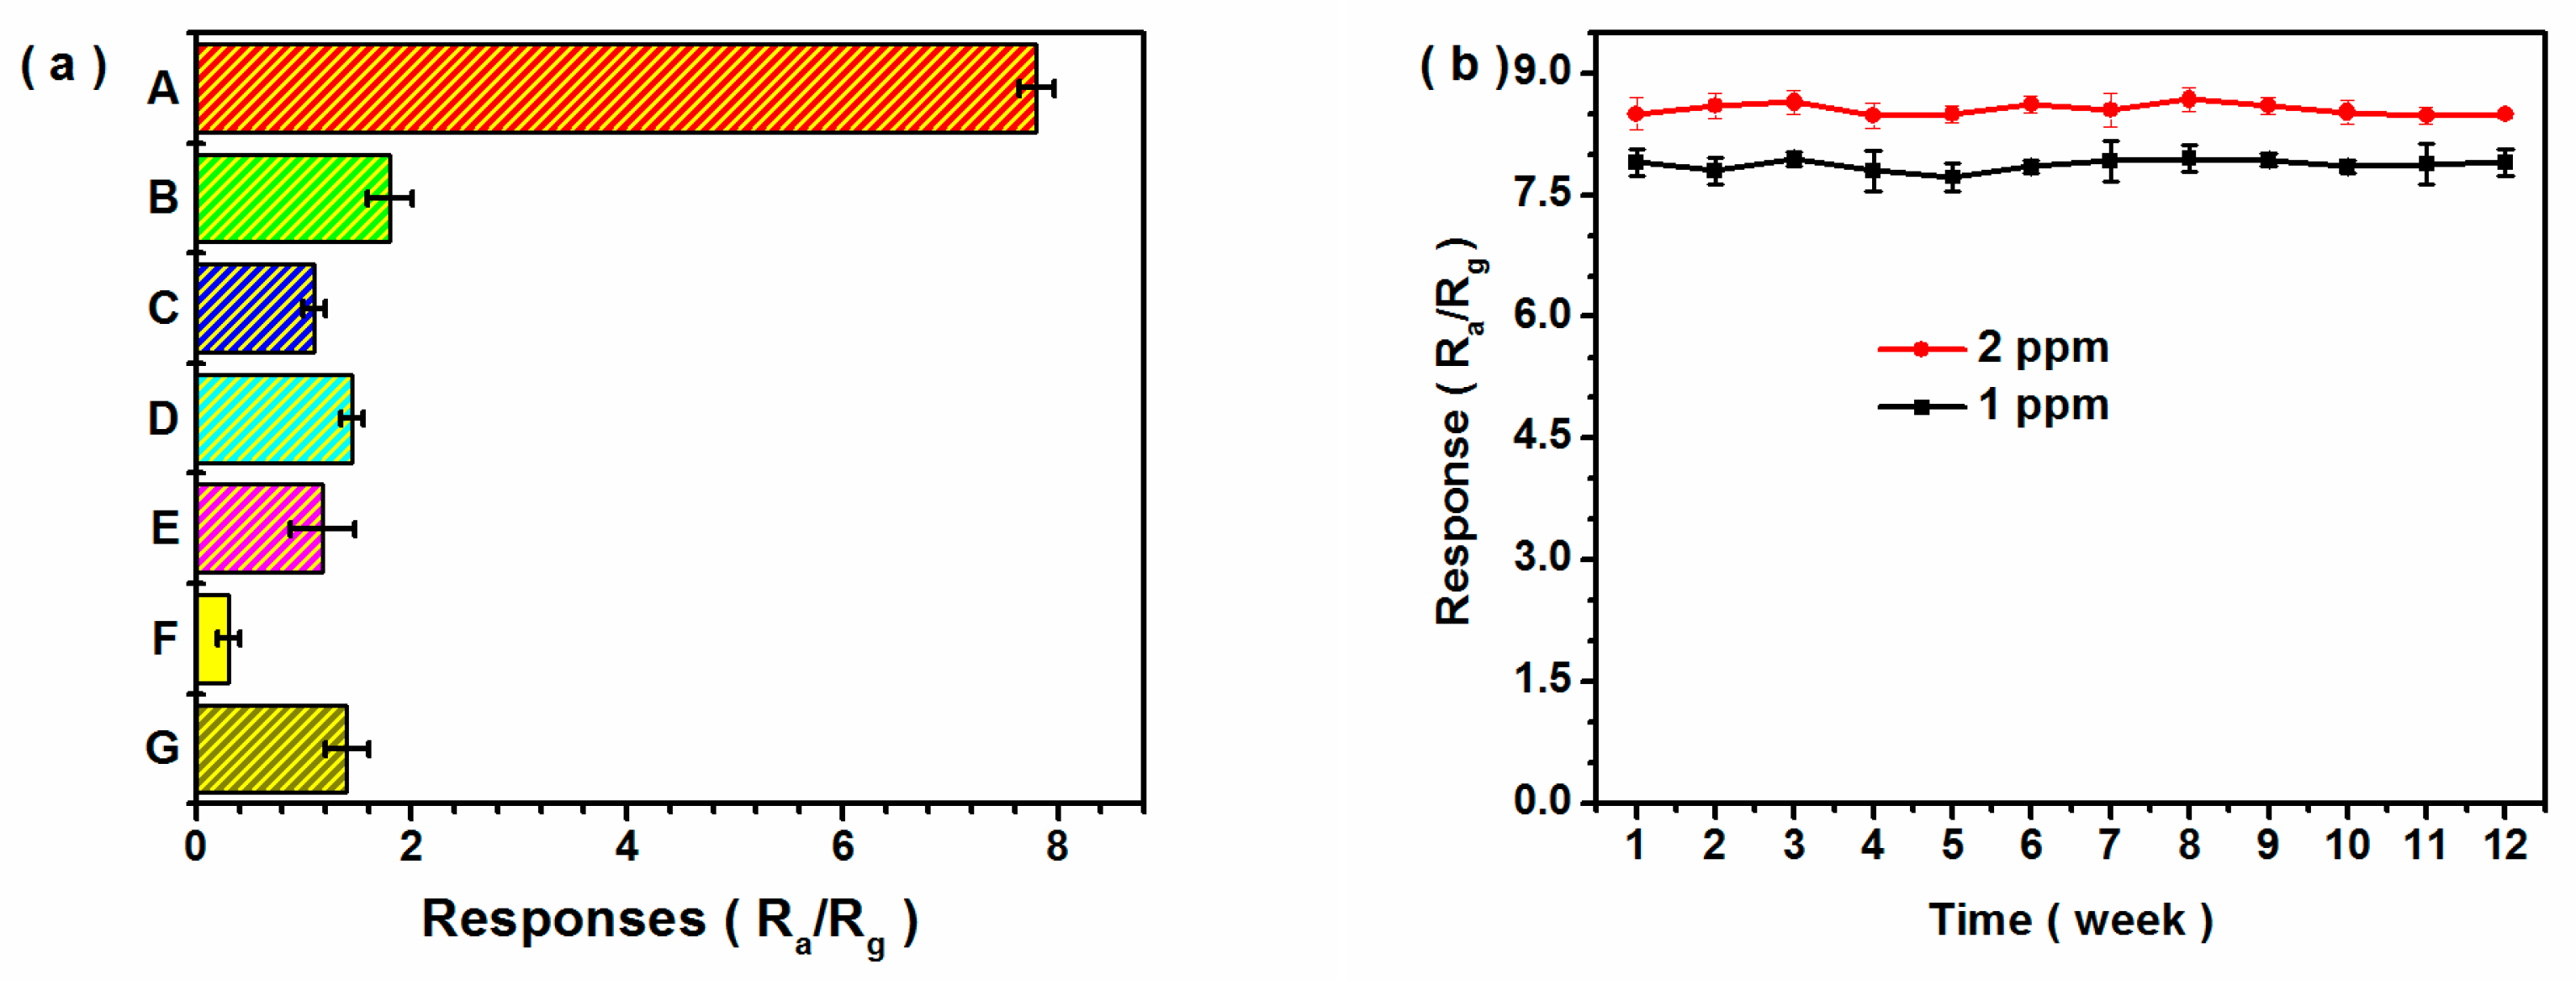
3.2. Performance for Acetone Analysis
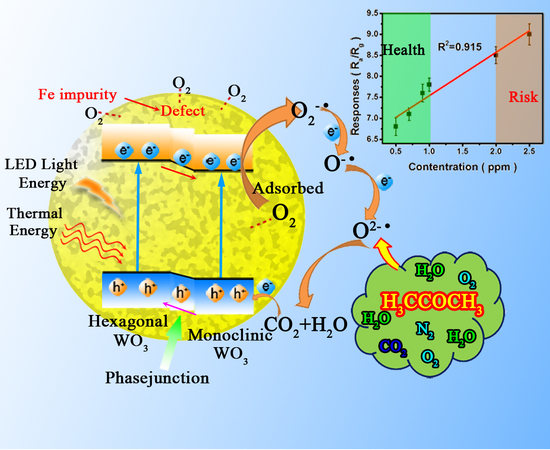
The sensing properties of WO3−based sensors were obviously dependent on the operating temperature. As shown in Figure 5a, all the prepared sensors reached maximum responses at 260 °C to 10 ppm acetone. In particular, 1.25Fe−h/m−WO3 exhibited the optimal response, which was attributed to the formation of phase junction and Fe doping. Moreover, the sensing response of 1.25Fe−h/m−WO3 to different concentrations of acetone were measured at 260 °C at a low RH atmosphere (<20% RH). As shown in Figure S3, there were sudden rises and declines of the voltage values when acetone gas was added and discharged, respectively, which indicated that 1.25Fe−h/m−WO3 possessed fast response/recovery speed towards acetone molecules. Particularly, the response of 1.25Fe−h/m−WO3 to acetone was linear from 0.1 to 1 ppm, which was not suitable for detection of the relatively high concentration of acetone for exhaled breath analysis under the humid condition. The response of WO3-based sensor to acetone was thus investigated in the concentration range of 0.2−10 ppm at 90% RH atmosphere. As shown in Figure S4, the responses to acetone decreased at 90% RH atmosphere, compared with those at a low RH atmosphere (<20% RH). Moreover, 1.25Fe−h/m−WO3 exhibited an enhanced response to acetone at 90% RH atmosphere under LED light illumination (Figure 5b,c), and the sensor required more time to establish dynamic balance because more energetic electrons were generated by the light energy. As shown in Figure S5, the response exhibited a linear relation with acetone concentration in the range of 0.5−2.5 ppm at 90% RH atmosphere. Additionally, the acetone-sensing properties of other sensors were also improved under LED light illumination (Figure S6). The results indicated that light irradiation improved the responses of Fe-doped h/m−WO3 gas sensor at high RH atmosphere. Hence, Fe-doped h/m−WO3 phase junction sensors could be used to screen type II diabetes by analysis of acetone in exhaled breath.
High selectivity for semiconductor sensors is one of the fundamental properties required for breath analysis. Six typical gases including ethanol, methanol, toluene, ammonia (NH3), nitric oxide (NO) and carbon monoxide (CO) existed in the exhaled breath. The sensing responses of 1.25Fe−h/m−WO3 sample to 1 ppm acetone and 1 ppm other gases were shown in Figure 6a. The responses to other gases were less than 1.8 under illumination at 90% RH atmosphere. Additionally, the mixtures of 1 ppm acetone and 1 ppm different interference gases were injected in the detection system, and the sensing results (Table S3) indicated that the interference gases such as ethanol, methanol, toluene, NH3, NO and CO had no significant effect on the response to acetone. As for the multicomponent gas mixture, the change of response value was less than 7% compared with the original response to single acetone. The results indicated that 1.25Fe−h/m−WO3 exhibited good selective responses to acetone gas. Apart from selectivity, stability is crucial for practical application of gas sensing materials. The responses of an identical sensor to 1 and 2 ppm acetone were evaluated every week in the duration of three months. As shown in Figure 6b, the response exhibited a slight fluctuation, and it indicated that the 1.25Fe−h/m−WO3 sensor possessed excellent reproducibility and long-term stability.

3.3. Mechanism

In the general sensing mechanism for acetone analysis, free electrons of the WO3 sensor at the working temperature were trapped by adsorbed oxygen molecules on the surface, forming reactive oxygen species. Upon exposure to acetone gas, chemisorbed oxygen components reacted with acetone molecules, and the electrons were released back to WO3. In this study, Fe-doping resulted in the generation of holes via defect reactions for the 1.25Fe−h/m−WO3 sensor, promoting the adsorption ability of oxygen molecules [24,25]. In addition, more electrons were generated under LED light illumination (Figure 7a), and inhibited recombination of photo-induced electrons and holes was achieved by the phase junction and Fe doping, which facilitated the formation of reactive oxygen species. Based on the above mechanism, rapid combination of electrons and adsorbed oxygen molecules played a key role for the enhanced acetone sensing performance. Photocurrent decay measurements were further conducted to explore the electron transfer. Under N2 atmosphere, photocurrents of all the samples were stabilized during the entire period of irradiation (Figure 7b). However, the photocurrent gradually decayed under air atmosphere. The photocurrents of h/m−WO3 phase junction samples were higher than those of h−WO3 and m−WO3 samples, which implied that the separation of photo-induced electrons and holes was promoted by the phase junction. Notably, the photocurrent of 1.25Fe−h/m−WO3 decayed faster than those of the undoped WO3-based samples. It was noteworthy that the decay of photocurrent was mainly due to the competitive electron trapping between O2 and FTO substrate [36]. Additionally, superoxide radicals were important for gas-sensing properties of semiconductors [18], and electron spin resonance (ESR) measurements were further conducted to demonstrate the formation of superoxide radicals. 5,5−Dimethyl−1−pyrroline N−oxide (DMPO) was adopted as a trapping agent for free radicals. As shown in Figure 7c, three peaks were observed for the h−WO3 and m−WO3 samples, which were caused by DMPO oxidization. The 1:2:2:1 quartet peaks, representing the characteristic signals of DMPO−·OH [37,38], were discovered for the h/m−WO3 sample. It was notable that the 1:1:1:1:1:1 six−fold peaks of DMPO−O2· were found for the 1.25Fe−h/m−WO3 sample, which indicated that abundant superoxide radicals were formed due to the interaction of dissolved oxygen and photo-induced electrons [37]. Photocatalytic degradation performances of WO3−based samples were further measured to prove the formation of superoxide radicals, and the results were shown in supplementary material S2. Based on the photocatalytic performance (Figure S7–S11), Fe impurity facilitated the photoinduced electron transfer from WO3 to the adsorbed oxygen, leading to the generation of superoxide radicals [37,39]. Hence, the formation of WO3 phase junctions was favorable for carrier separation, and Fe doping benefited the oxygen adsorption on the WO3 surface, leading to increasing electron transfer and promoting the generation of superoxide radicals.

4. Conclusions

A series of Fe-doped hexagonal and monoclinic WO3 phase junction materials were synthesized by the hydrothermal−calcination method. Under LED illumination, the optimized 1.25Fe−h/m−WO3 sensor exhibited higher responses to acetone, compared with other as−prepared sensors, and excellent linearity between responses and acetone concentration (0.5−2.5 ppm) was achieved at 90% RH. Meanwhile, the 1.25Fe−h/m−WO3 sensor exhibited good acetone selectivity and stability over three months, which provided an opportunity for the diagnosis of diabetes. Additionally, the Fe-doped WO3 phase junction catalyst showed good photocatalytic performance for RhB degradation. It was demonstrated that the formation of WO3 phase junctions benefited the carrier separation, and Fe doping was favored oxygen adsorption on the WO3 surface, promoting the electron transfer and the generation of superoxide radicals. The results herein may be useful for rational design of gas sensor materials with high selectivity and stability, offering an alternative for noninvasive diagnosis of diabetes.

Supplementary Materials

The following are available online at https://www.mdpi.com/2079-4991/10/2/398/s1, S1. Experimental process of photocatalytic degradation. S2. Photocatalytic performance for RhB degradation. Figure S1: SEM images of the h/m−WO3 (a), 1.0Fe−h/m−WO3 (b), 1.25Fe−h/m−WO3 (c) and 1.5Fe−h/m−WO3 (d) samples. Figure S2: UV−Vis light absorption spectra of the as−prepared WO3 samples (A: m−WO3, B: h−WO3, C: h/m−WO3, D: 1.0Fe−h/m−WO3, E: 1.25Fe−h/m−WO3, F: 1.5Fe−h/m−WO3). Figure S3: Response−recovery curves (a) and corresponding responses (b) at low RH atmosphere (< 20%) to acetone gas with the different concentrations (from 0.1 to 10 ppm) for 1.25Fe−h/m−WO3. Figure S4: Corresponding responses (b) to acetone gas with the different concentrations (from 0.1 to 10 ppm) for 1.25Fe−h/m−WO3 at different humidity. (Inset: responses vs. acetone concentration from 0.2 to 1 ppm). Figure S5: Corresponding response to acetone gas with the different concentrations from 0.1 to 10 ppm for 1.25Fe−h/m−WO3 with/without white LED illumination at 90% RH atmosphere. Figure S6: Sensing responses of other sensors to 10 ppm acetone under LED illumination at 90 % RH atmosphere (m−WO3 (A), h−WO3 (B), h/m−WO3 (C), 1.0Fe−h/m−WO3 (D), 1.25Fe−h/m−WO3 (E) and 1.5Fe−h/m−WO3 (F) samples). Figure S7: Photocatalytic activity (a) and kinetic curves (b) of the as−prepared samples for RhB degradation. Figure S8: Photocatalytic performance for RhB degradation after 40 min illumination in the cycling experiment. Figure S9: XRD pattern of 1.25Fe−h/m−WO3 before/after cycling. Figure S10: High−resolution XPS spectra for Fe 2p of 1.25Fe−h/m−WO3 before/after cycling. Figure S11: Photocatalytic activity for RhB degradation in a controlled experiment (A: without scavenger in air atmosphere, B: without scavenger in N2 atmosphere, C: addition of EDTA−Na2, D: addition of KBrO3, and E: addition of 4−benzoquinone). Table S1: Fe/W content ratio of the obtained samples by the ICP−AES measurement. Table S2: Surface area of the obtained samples by the N2 absorption−desorption measurement. Table S3: Responses to acetone under different interfering gases for the optimized sensor. Table S4: Pseudo−first order rate constant k of the obtained samples for RhB degradation. Table S5: Fe/W content ratio of the 1.25Fe−h/m−WO3 samples in cycling by the ICP−AES measurement.

Author Contributions

Data curation, F.-Y.W. and Y.H.; formal analysis, W.S., X.-Q.S. and Y.H.; investigation, J.-C.W.; project administration, J.-C.W. and W.S.; resources, J.-C.W., W.S., Y.L. and Y.H.; software, Y.L.; writing – original draft, J.-C.W.; writing – review & editing, W.S. All authors have read and agreed to the published version of the manuscript.

Funding

This research was funded by National Natural Science Foundation of China (No. 51802082), Key Scientific and Technological Project of Henan Province (No. 182102410094 and 192102310231), Key Scientific Research Project of Colleges and Universities in Henan Province (No. 19B150006), “Climbing” Project of Henan Institute of Science and Technology (No. 2018CG04).

Conflicts of Interest

The authors declare no conflict of interest.

References

  1. Staerz, A.; Weimar, U.; Barsan, N. Understanding the potential of WO3 based sensors for breath analysis. Sensors 2016, 16, 1815. [Google Scholar] [CrossRef] [PubMed]
  2. Rydosz, A. Sensors for enhanced detection of acetone as a potential tool for noninvasive diabetes monitoring. Sensors 2018, 18, 2298. [Google Scholar] [CrossRef] [PubMed] [Green Version]
  3. Zhou, Z.; Lan, C.; Wei, R.; Ho, J.C. Transparent metal-oxide nanowires and their applications in harsh electronics. J. Mater. Chem. C 2019, 7, 202–217. [Google Scholar] [CrossRef]
  4. Wang, X.-F.; Ma, W.; Jiang, F.; Cao, E.-S.; Sun, K.-M.; Cheng, L.; Song, X.-Z. Prussian blue analogue derived porous NiFe2O4 nanocubes for low-concentration acetone sensing at low working temperature. Chem. Eng. J. 2018, 338, 504–512. [Google Scholar] [CrossRef]
  5. Shen, J.-Y.; Zhang, L.; Ren, J.; Wang, J.-C.; Yao, H.-C.; Li, Z.-J. Highly enhanced acetone sensing performance of porous C-doped WO3 hollow spheres by carbon spheres as templates. Sens. Actuators B 2017, 239, 597–607. [Google Scholar] [CrossRef]
  6. Xiao, T.; Wang, X.-Y.; Zhao, Z.-H.; Li, L.; Zhang, L.; Yao, H.-C.; Wang, J.-S.; Li, Z.-J. Highly sensitive and selective acetone sensor based on C-doped WO3 for potential diagnosis of diabetes mellitus. Sens. Actuators B 2014, 199, 210–219. [Google Scholar] [CrossRef]
  7. Zhang, H.; Qin, H.; Zhang, P.; Hu, J. High sensing properties of 3 wt% Pd doped SmFe1−xMgxO3 nanocrystalline powders to acetone vapor with ultralow concentrations under light illumination. ACS Appl. Mater. Interfaces 2018, 10, 15558–15564. [Google Scholar] [CrossRef]
  8. Rydosz, A. A negative correlation between blood glucose and acetone measured in healthy and type-1 diabetes mellitus patient breath. J. Diabetes Sci. Technol. 2015, 9, 881–884. [Google Scholar] [CrossRef]
  9. Amann, A.; Smith, D. Volatile Biomarkers. In Non-Invasive Diagnosis in Physiology and Medicine; Elsevier: New York, NY, USA, 2013. [Google Scholar]
  10. Mirzaei, A.; Leonardi, S.G.; Neri, G. Detection of hazardous volatile organic compounds (VOCs) by metal oxide nanostructures-based gas sensors: A review. Ceram. Int. 2016, 42, 15119–15141. [Google Scholar] [CrossRef]
  11. Zhang, S.; Chen, H.-S.; Matras-Postolek, K.; Yang, P. ZnO nanoflowers with single crystal structure towards enhanced gas sensing and photocatalysis. Phys. Chem. Chem. Phys. 2015, 17, 30300–30306. [Google Scholar] [CrossRef]
  12. Lim, C.-J.; Park, J.-W. Luminescent oxygen-sensing films with improved sensitivity based on light scattering by TiO2 particles. Sens. Actuators B 2017, 253, 934–941. [Google Scholar] [CrossRef]
  13. Agrawal, A.V.; Kumar, R.; Venkatesan, S.; Zakhidov, A.; Yang, G.; Bao, J.; Kumar, M.; Kumar, M. Photoactivated mixed in-plane and edge-enriched p-type MoS2 flake-based NO2 sensor working at room temperature. ACS Sens. 2018, 3, 998–1004. [Google Scholar] [CrossRef] [PubMed]
  14. Wang, Y.; Liu, B.; Xiao, S.; Wang, X.; Sun, L.; Li, H.; Xie, W.; Li, Q.; Zhang, Q.; Wang, T. Low-temperature H2S detection with hierarchical Cr-doped WO3 microspheres. ACS Appl. Mater. Interfaces 2016, 8, 9674–9683. [Google Scholar] [CrossRef] [PubMed]
  15. Xiong, Y.; Zhu, Z.; Guo, T.; Li, H.; Xue, Q. Synthesis of nanowire bundle-like WO3-W18O49 heterostructures for highly sensitive NH3 sensor application. J. Hazard. Mater. 2018, 353, 290–299. [Google Scholar] [CrossRef]
  16. Lee, E.; Yoon, Y.S.; Kim, D.J. Two-dimensional transition metal dichalcogenides and metal oxide hybrids for gas sensing. ACS Sens. 2018, 3, 2045–2060. [Google Scholar] [CrossRef]
  17. Zappa, D.; Galstyan, V.; Kaur, N.; Munasinghe-Arachchige, H.M.M.; Sisman, O.; Comini, E. Metal oxide-based heterostructures for gas sensors-A review. Anal. Chim. Acta 2018, 1039, 1–23. [Google Scholar] [CrossRef]
  18. Liu, Z.; Liu, B.; Xie, W.; Li, H.; Zhou, R.; Li, Q.; Wang, T. Enhanced selective acetone sensing characteristics based on Co-doped WO3 hierarchical flower-like nanostructures assembled with nanoplates. Sens. Actuators B 2016, 235, 614–621. [Google Scholar] [CrossRef]
  19. Yan, J.; Wang, T.; Wu, G.; Dai, W.; Guan, N.; Li, L.; Gong, J. Tungsten oxide single crystal nanosheets for enhanced multichannel solar light harvesting. Adv. Mater. 2015, 27, 1580–1586. [Google Scholar] [CrossRef]
  20. Wang, J.; Liu, C.-J. Preparation of 2D WO3 nanomaterials with enhanced catalytic activities: Current status and perspective. ChemBioEng Rev. 2015, 2, 335–350. [Google Scholar] [CrossRef]
  21. Balázsi, C.; Wang, L.; Zayim, E.O.; Szilágyi, I.M.; Sedlacková, K.; Pfeifer, J.; Tóth, A.L.; Gouma, P.-I. Nanosize hexagonal tungsten oxide for gas sensing applications. J. Eur. Ceram. Soc. 2008, 28, 913–917. [Google Scholar] [CrossRef]
  22. Wang, X.; Xu, Q.; Li, M.; Shen, S.; Wang, X.; Wang, Y.; Feng, Z.; Shi, J.; Han, H.; Li, C. Photocatalytic overall water splitting promoted by an alpha-beta phase junction on Ga2O3. Angew. Chem. Int. Ed. 2012, 51, 13089–13092. [Google Scholar] [CrossRef] [PubMed]
  23. Zhang, J.; Xu, Q.; Feng, Z.; Li, M.; Li, C. Importance of the relationship between surface phases and photocatalytic activity of TiO2. Angew. Chem. Int. Ed. 2008, 47, 1766–1769. [Google Scholar] [CrossRef]
  24. Sukunta, J.; Wisitsoraat, A.; Tuantranont, A.; Jaruwongrungsee, K.; Phanichphant, S.; Liewhiran, C. Mechanistic roles of substitutional Fe dopants on catalytic acetylene-sensing process of flame-made SnO2 nanoparticles. Arabian J. Chem. 2020, 13, 3043–3059. [Google Scholar] [CrossRef]
  25. Guo, W.; Zhao, B.; Zhou, Q.; He, Y.; Wang, Z.; Radacsi, N. Fe-doped ZnO/reduced graphene oxide nanocomposite with synergic enhanced gas sensing performance for the effective detection of formaldehyde. ACS Omega 2019, 4, 10252–10262. [Google Scholar] [CrossRef] [PubMed] [Green Version]
  26. Saidi, T.; Palmowski, D.; Babicz-Kiewlicz, S.; Welearegay, T.G.; Bari, N.E.; Ionescu, R.; Smulko, J.; Bouchikhi, B. Exhaled breath gas sensing using pristine and functionalized WO3 nanowire sensors enhanced by UV-light irradiation. Sens. Actuators B 2018, 273, 1719–1729. [Google Scholar] [CrossRef]
  27. Chen, X.; Deng, N.; Zhang, X.; Yang, Y.; Li, J.; Hong, B.; Fang, J.; Xu, J.; Jin, D.; Peng, X.; et al. Preparation of Fe-doped In2O3 gas sensing semiconductor by one-step impregnation with enhanced ethanol sensing. Chem. Phys. Lett. 2019, 722, 93–103. [Google Scholar] [CrossRef]
  28. Shen, J.-Y.; Wang, M.-D.; Wang, Y.-F.; Hu, J.-Y.; Zhu, Y.; Zhang, Y.X.; Li, Z.-J.; Yao, H.-C. Iron and carbon codoped WO3 with hierarchical walnut-like microstructure for highly sensitive and selective acetone sensor. Sens. Actuators B 2018, 256, 27–37. [Google Scholar] [CrossRef]
  29. Staerz, A.; Liu, Y.; Geyik, U.; Brinkmann, H.; Weimar, U.; Zhang, T.; Barsan, N. The effect of platinum loading on WO3 based sensors. Sens. Actuators B 2019, 291, 378–384. [Google Scholar] [CrossRef]
  30. Zeb, S.; Peng, X.; Yuan, G.; Zhao, X.; Qin, C.; Sun, G.; Nie, Y.; Cui, Y.; Jiang, X. Controllable synthesis of ultrathin WO3 nanotubes and nanowires with excellent gas sensing performance. Sens. Actuators B 2020, 305, 127435. [Google Scholar] [CrossRef]
  31. Qi, J.; Chen, K.; Xing, Y.; Fan, H.; Zhao, H.; Yang, J.; Li, L.; Yan, B.; Zhou, J.; Guo, L.; et al. Application of 3D hierarchical monoclinic-type structural Sb-doped WO3 towards NO2 gas detection at low temperature. Nanoscale 2018, 10, 7440–7450. [Google Scholar] [CrossRef]
  32. Shi, W.; Guo, X.; Cui, C.; Jiang, K.; Li, Z.; Qu, L.; Wang, J.-C. Controllable synthesis of Cu2O decorated WO3 nanosheets with dominant (0 0 1) facets for photocatalytic CO2 reduction under visible-light irradiation. Appl. Catal. B 2019, 243, 236–242. [Google Scholar] [CrossRef]
  33. Shen, Y.; Bi, H.; Li, T.; Zhong, X.; Chen, X.; Fan, A.; Wei, D. Low-temperature and highly enhanced NO2 sensing performance of Au-functionalized WO3 microspheres with a hierarchical nanostructure. Appl. Surf. Sci. 2018, 434, 922–931. [Google Scholar] [CrossRef]
  34. Lu, Y.; Zhang, J.; Wang, F.; Chen, X.; Feng, Z.; Li, C. K2SO4-assisted hexagonal/monoclinic WO3 phase junction for efficient photocatalytic degradation of RhB. ACS Appl. Energy Mater. 2018, 1, 2067–2077. [Google Scholar] [CrossRef]
  35. Xie, D.; Li, H.-H.; Shi, Y.-H.; Diao, W.-Y.; Jiang, R.; Sun, H.-Z.; Wu, X.-L.; Li, W.; Fan, C.-Y.; Zhang, J.-P. Micro/nanoengineered a-Fe2O3 nanoaggregate conformably enclosed by ultrathin N-doped carbon shell for ultrastable lithium storage and insight into phase evolution mechanism. Chem. Eur. J. 2020, 26, 853–862. [Google Scholar] [CrossRef]
  36. Li, S.; Dong, G.; Hailili, R.; Yang, L.; Li, Y.; Wang, F.; Zeng, Y.; Wang, C. Effective photocatalytic H2O2 production under visible light irradiation at g-C3N4 modulated by carbon vacancies. Appl. Catal. B 2016, 190, 26–35. [Google Scholar] [CrossRef] [Green Version]
  37. Li, R.; Cai, M.; Xie, Z.; Zhang, Q.; Zeng, Y.; Liu, H.; Liu, G.; Lv, W. Construction of heterostructured CuFe2O4/g-C3N4 nanocomposite as an efficient visible light photocatalyst with peroxydisulfate for the organic oxidation. Appl. Catal. B 2019, 244, 974–982. [Google Scholar] [CrossRef]
  38. Hu, X.; Ji, H.; Chang, F.; Luo, Y. Simultaneous photocatalytic Cr(VI) reduction and 2,4,6-TCP oxidation over g-C3N4 under visible light irradiation. Catal. Today 2014, 224, 34–40. [Google Scholar] [CrossRef]
  39. Behera, A.; Mansingh, S.; Das, K.K.; Parida, K. Synergistic ZnFe2O4-carbon allotropes nanocomposite photocatalyst for norfloxacin degradation and Cr(VI) reduction. J. Colloid Interface Sci. 2019, 544, 96–111. [Google Scholar] [CrossRef]
Figure 1. Schematic diagram (a) of the light−driven gas sensor test system and photograph (b) of original WS−30A equipment.
Nanomaterials 10 00398 g001
Figure 2. XRD patterns (a) and locally enlarged XRD patterns (b) of the m−WO3 (A), h−WO3 (B), h/m−WO3 (C), 1.0Fe−h/m−WO3 (D), 1.25Fe−h/m−WO3 (E) and 1.5Fe−h/m−WO3 (F) samples.
Nanomaterials 10 00398 g002
Figure 3. X-ray photoelectron spectroscopy (XPS) spectra of W 2f (a) and Fe 2p (b) for the as−prepared samples.
Nanomaterials 10 00398 g003
Figure 4. TEM images (a,b) and EDX mapping (c) of the 1.25Fe−h/m−WO3 sample.
Nanomaterials 10 00398 g004
Figure 5. (a) Responses of the as-prepared gas sensors to 10 ppm of acetone as a function of operating temperature (A: m−WO3, B: h−WO3, C: h/m−WO3, D: 1.0Fe−h/m−WO3, E: 1.25Fe−h/m−WO3, F: 1.5Fe−h/m−WO3); response–recovery curves (b) and corresponding responses (c) to acetone gas with concentration ranging from 0.1 to 10 ppm for 1.25Fe−h/m−WO3 at 90% RH atmosphere.
Nanomaterials 10 00398 g005
Figure 6. (a) Sensing responses of 1.25Fe−h/m−WO3 sensor to 1 ppm acetone and 1 ppm other gases under LED illumination at 90% RH atmosphere (A: acetone, B: ethanol, C: methanol, D: toluene, E: NH3, F: NO, G: CO). (b) Long−term stability of 1.25Fe−h/m−WO3 sensor to 1 and 2 ppm acetone over a duration of 3 months under illumination at 90% RH atmosphere.
Nanomaterials 10 00398 g006
Figure 7. Schematic diagram of the possible gas-sensing mechanism under illumination (a), electron spin resonance (ESR) spectra of the obtained samples in water under illumination (b), and I−t curves of the obtained samples under different atmospheres (c).
Nanomaterials 10 00398 g007

