Formulation, Characterization and Evaluation against SH-SY5Y Cells of New Tacrine and Tacrine-MAP Loaded with Lipid Nanoparticles


Abstract
:
1. Introduction
2. Materials and Methods
2.1. Materials
2.2. TAC-MAP Synthesis
2.3. THA Solubility Studies
2.4. Preparation of NLC
2.5. Characterization of NLC
2.5.1. Particle Size and Surface Change
2.5.2. Encapsulation Efficiency
2.6. In Vitro Drug Release
2.6.1. TAC and TAC + MAP Release from pH 7.4
2.6.2. TAC Release in Human Plasma
2.7. In Vitro Cell Viability Studies
2.7.1. MTT Assay
2.7.2. SRB Assay
2.7.3. Cell Morphology Visualization
2.8. Statistical Analysis
3. Results and Discussion
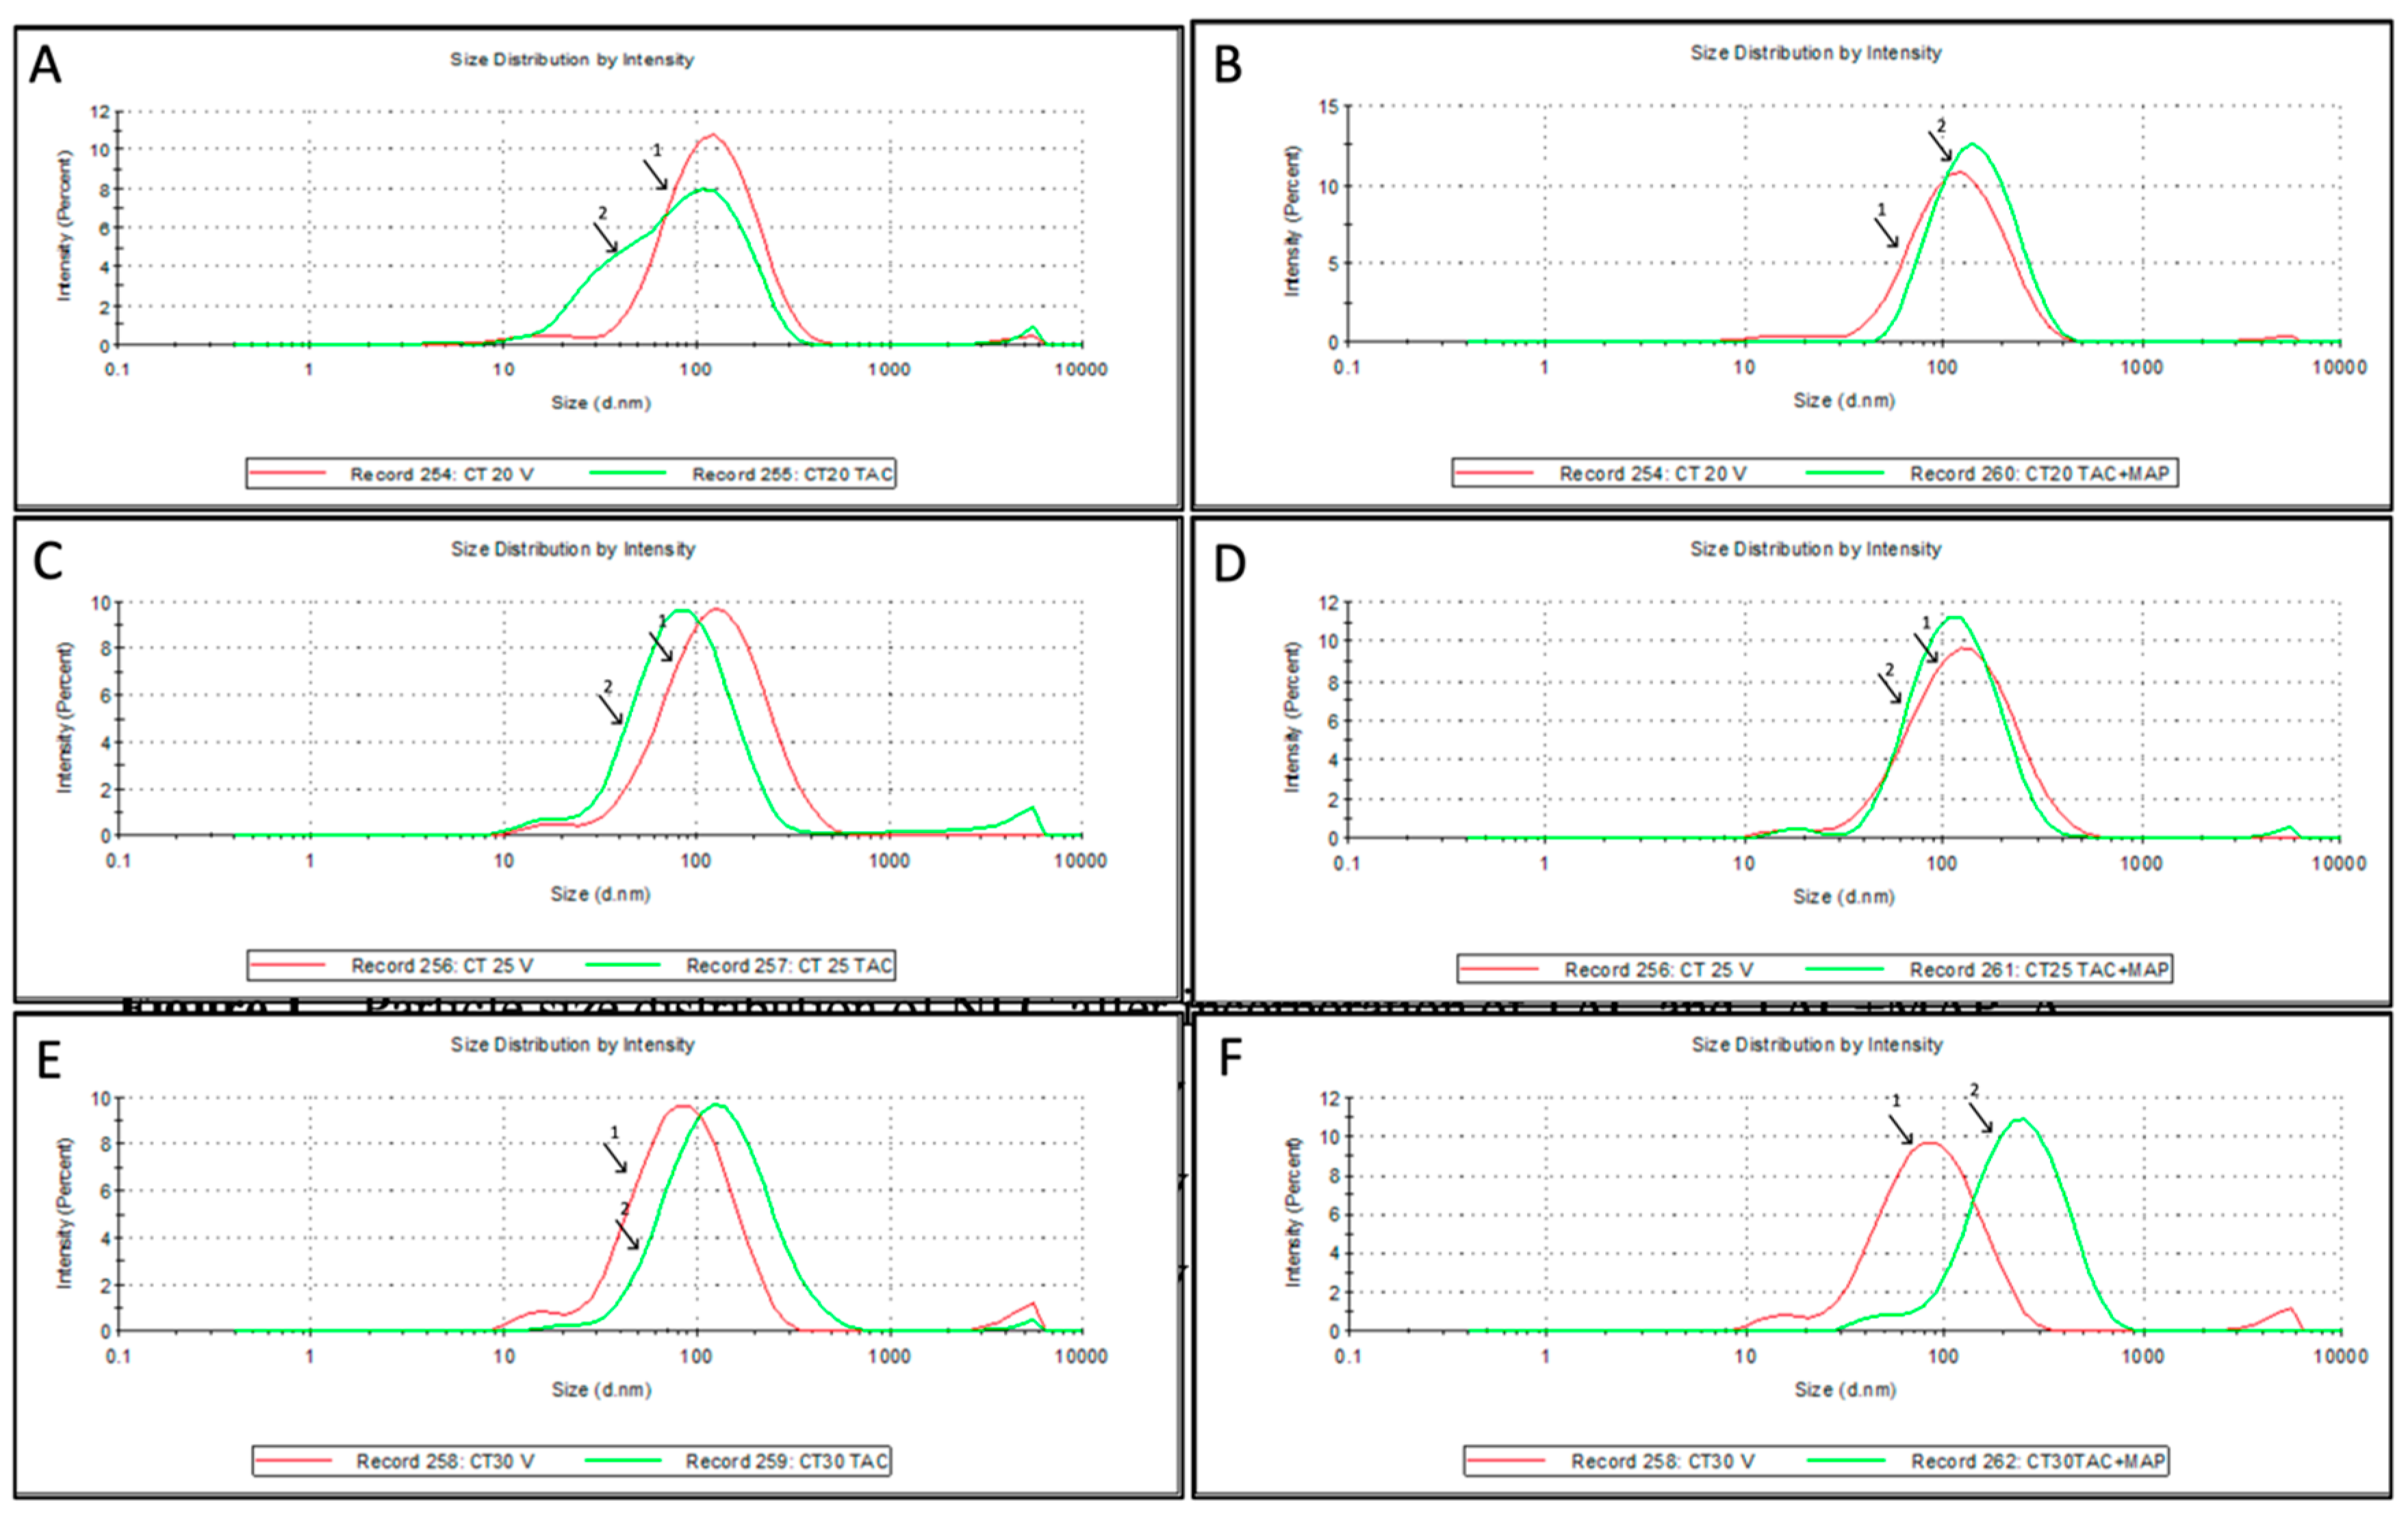
3.1. NLC Characterization
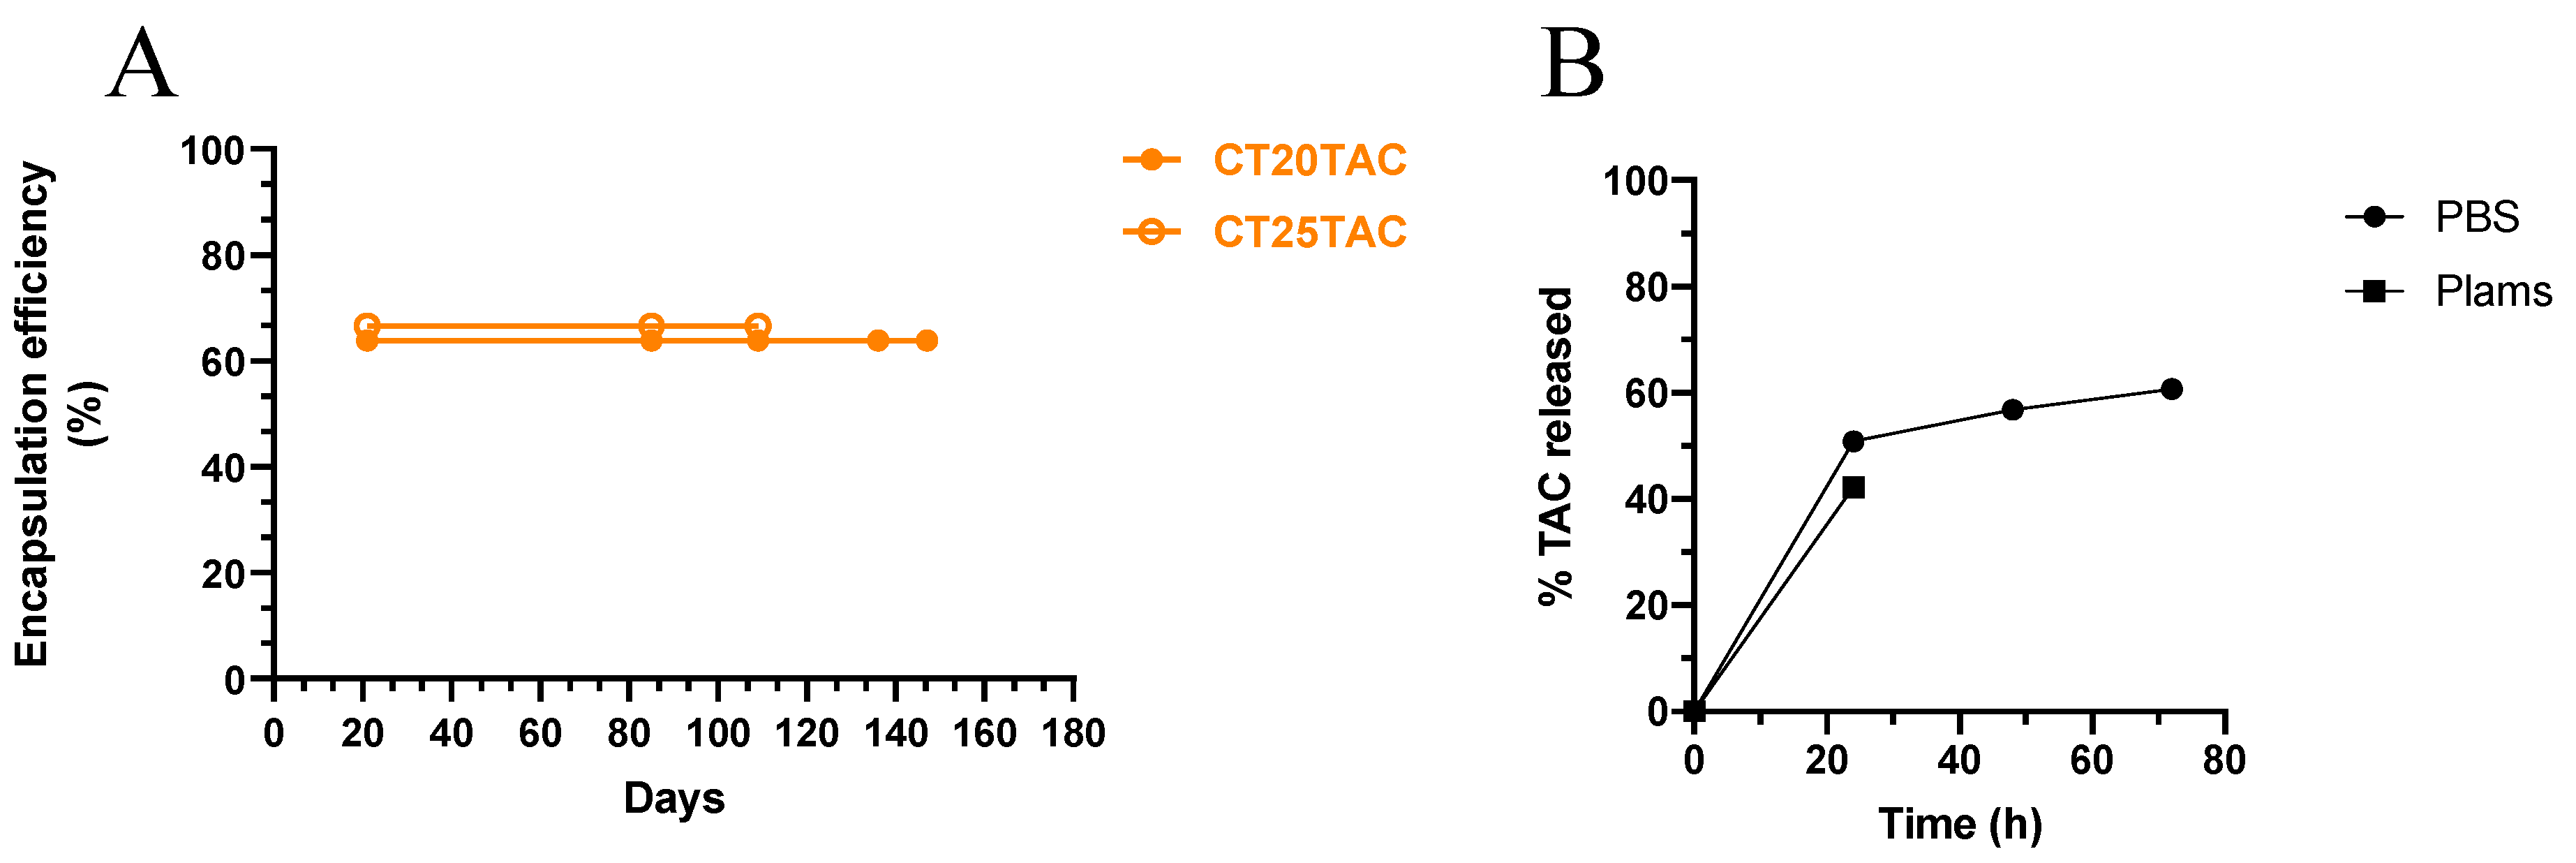
3.2. In Vitro TAC Release from NLC
3.3. In Vitro Cell Viability Studies of TAC and TAC-MAP
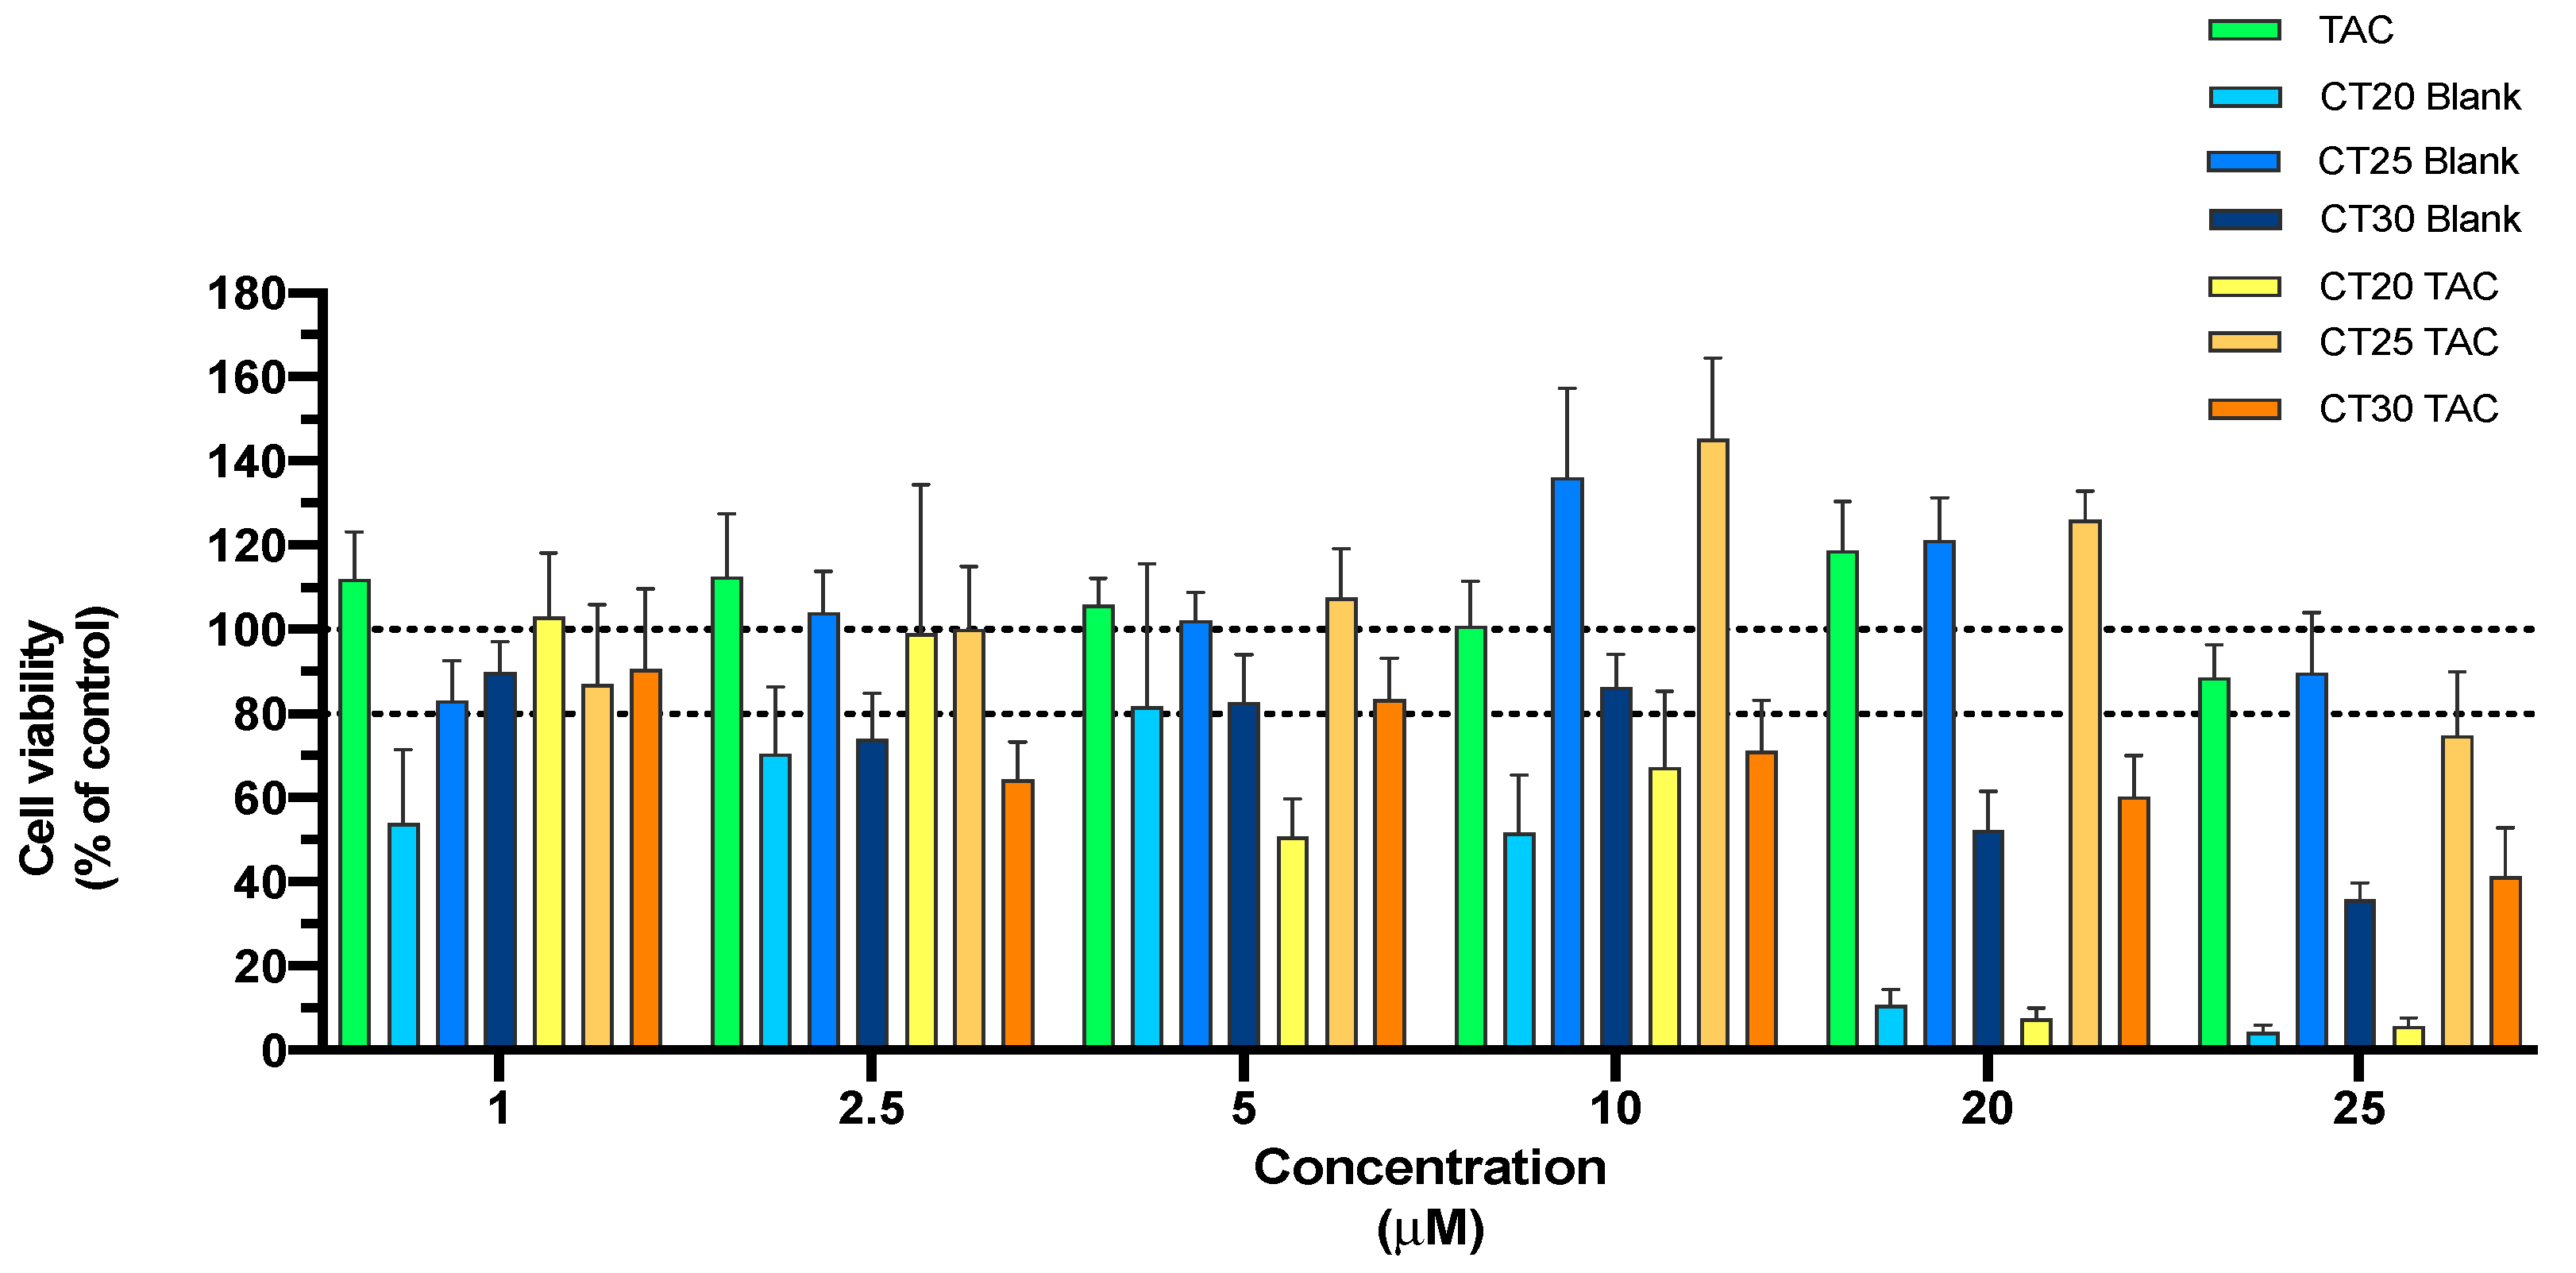
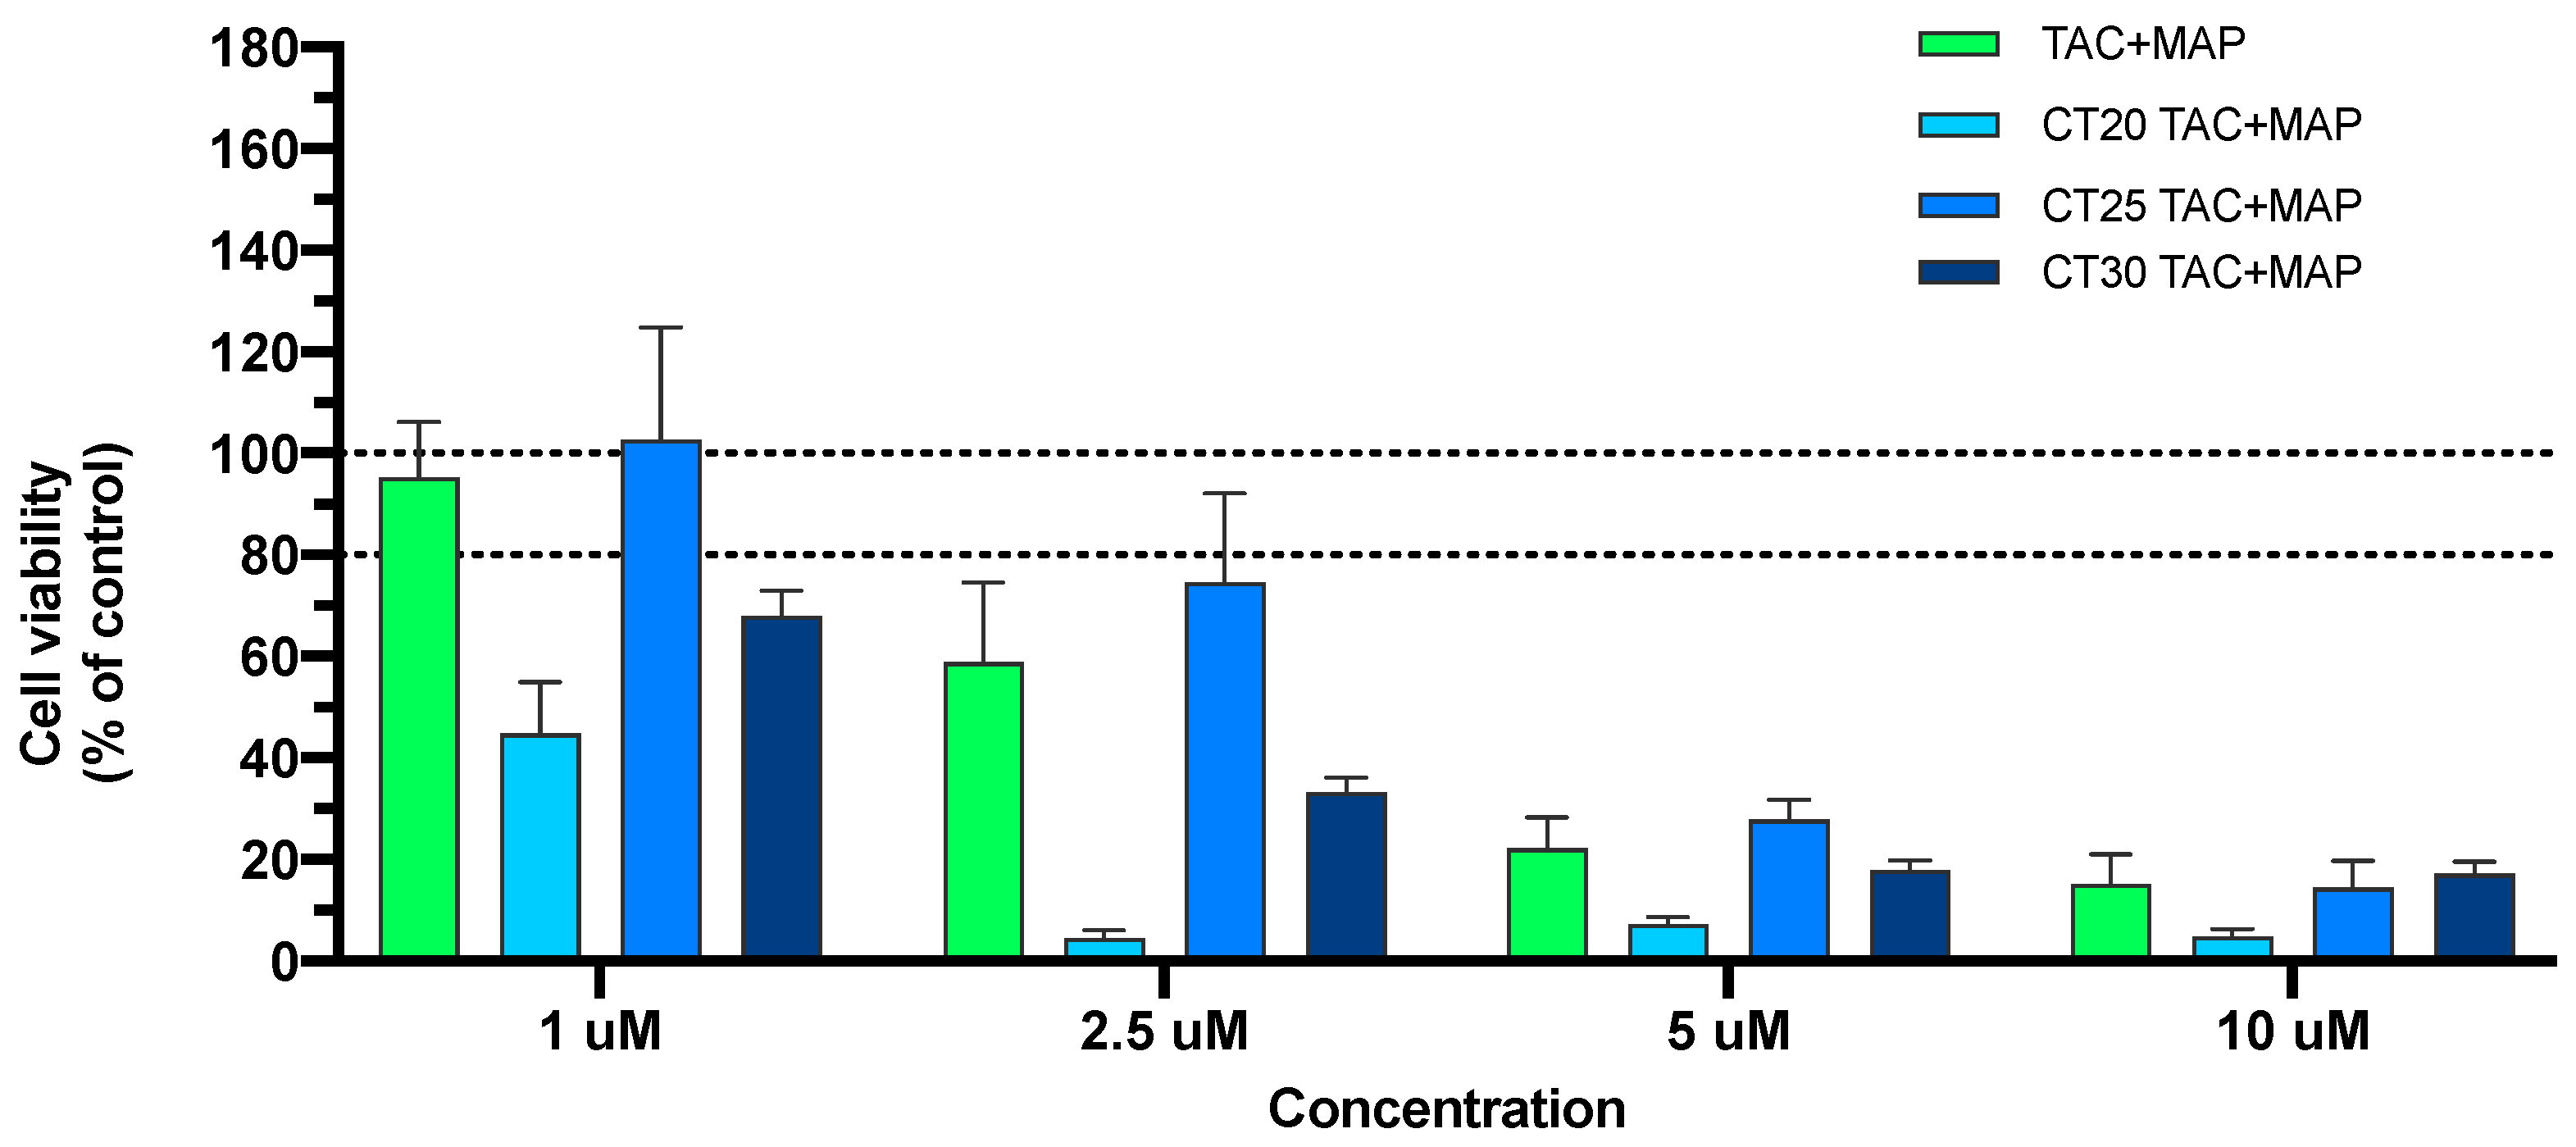
3.3.1. MTT Assay
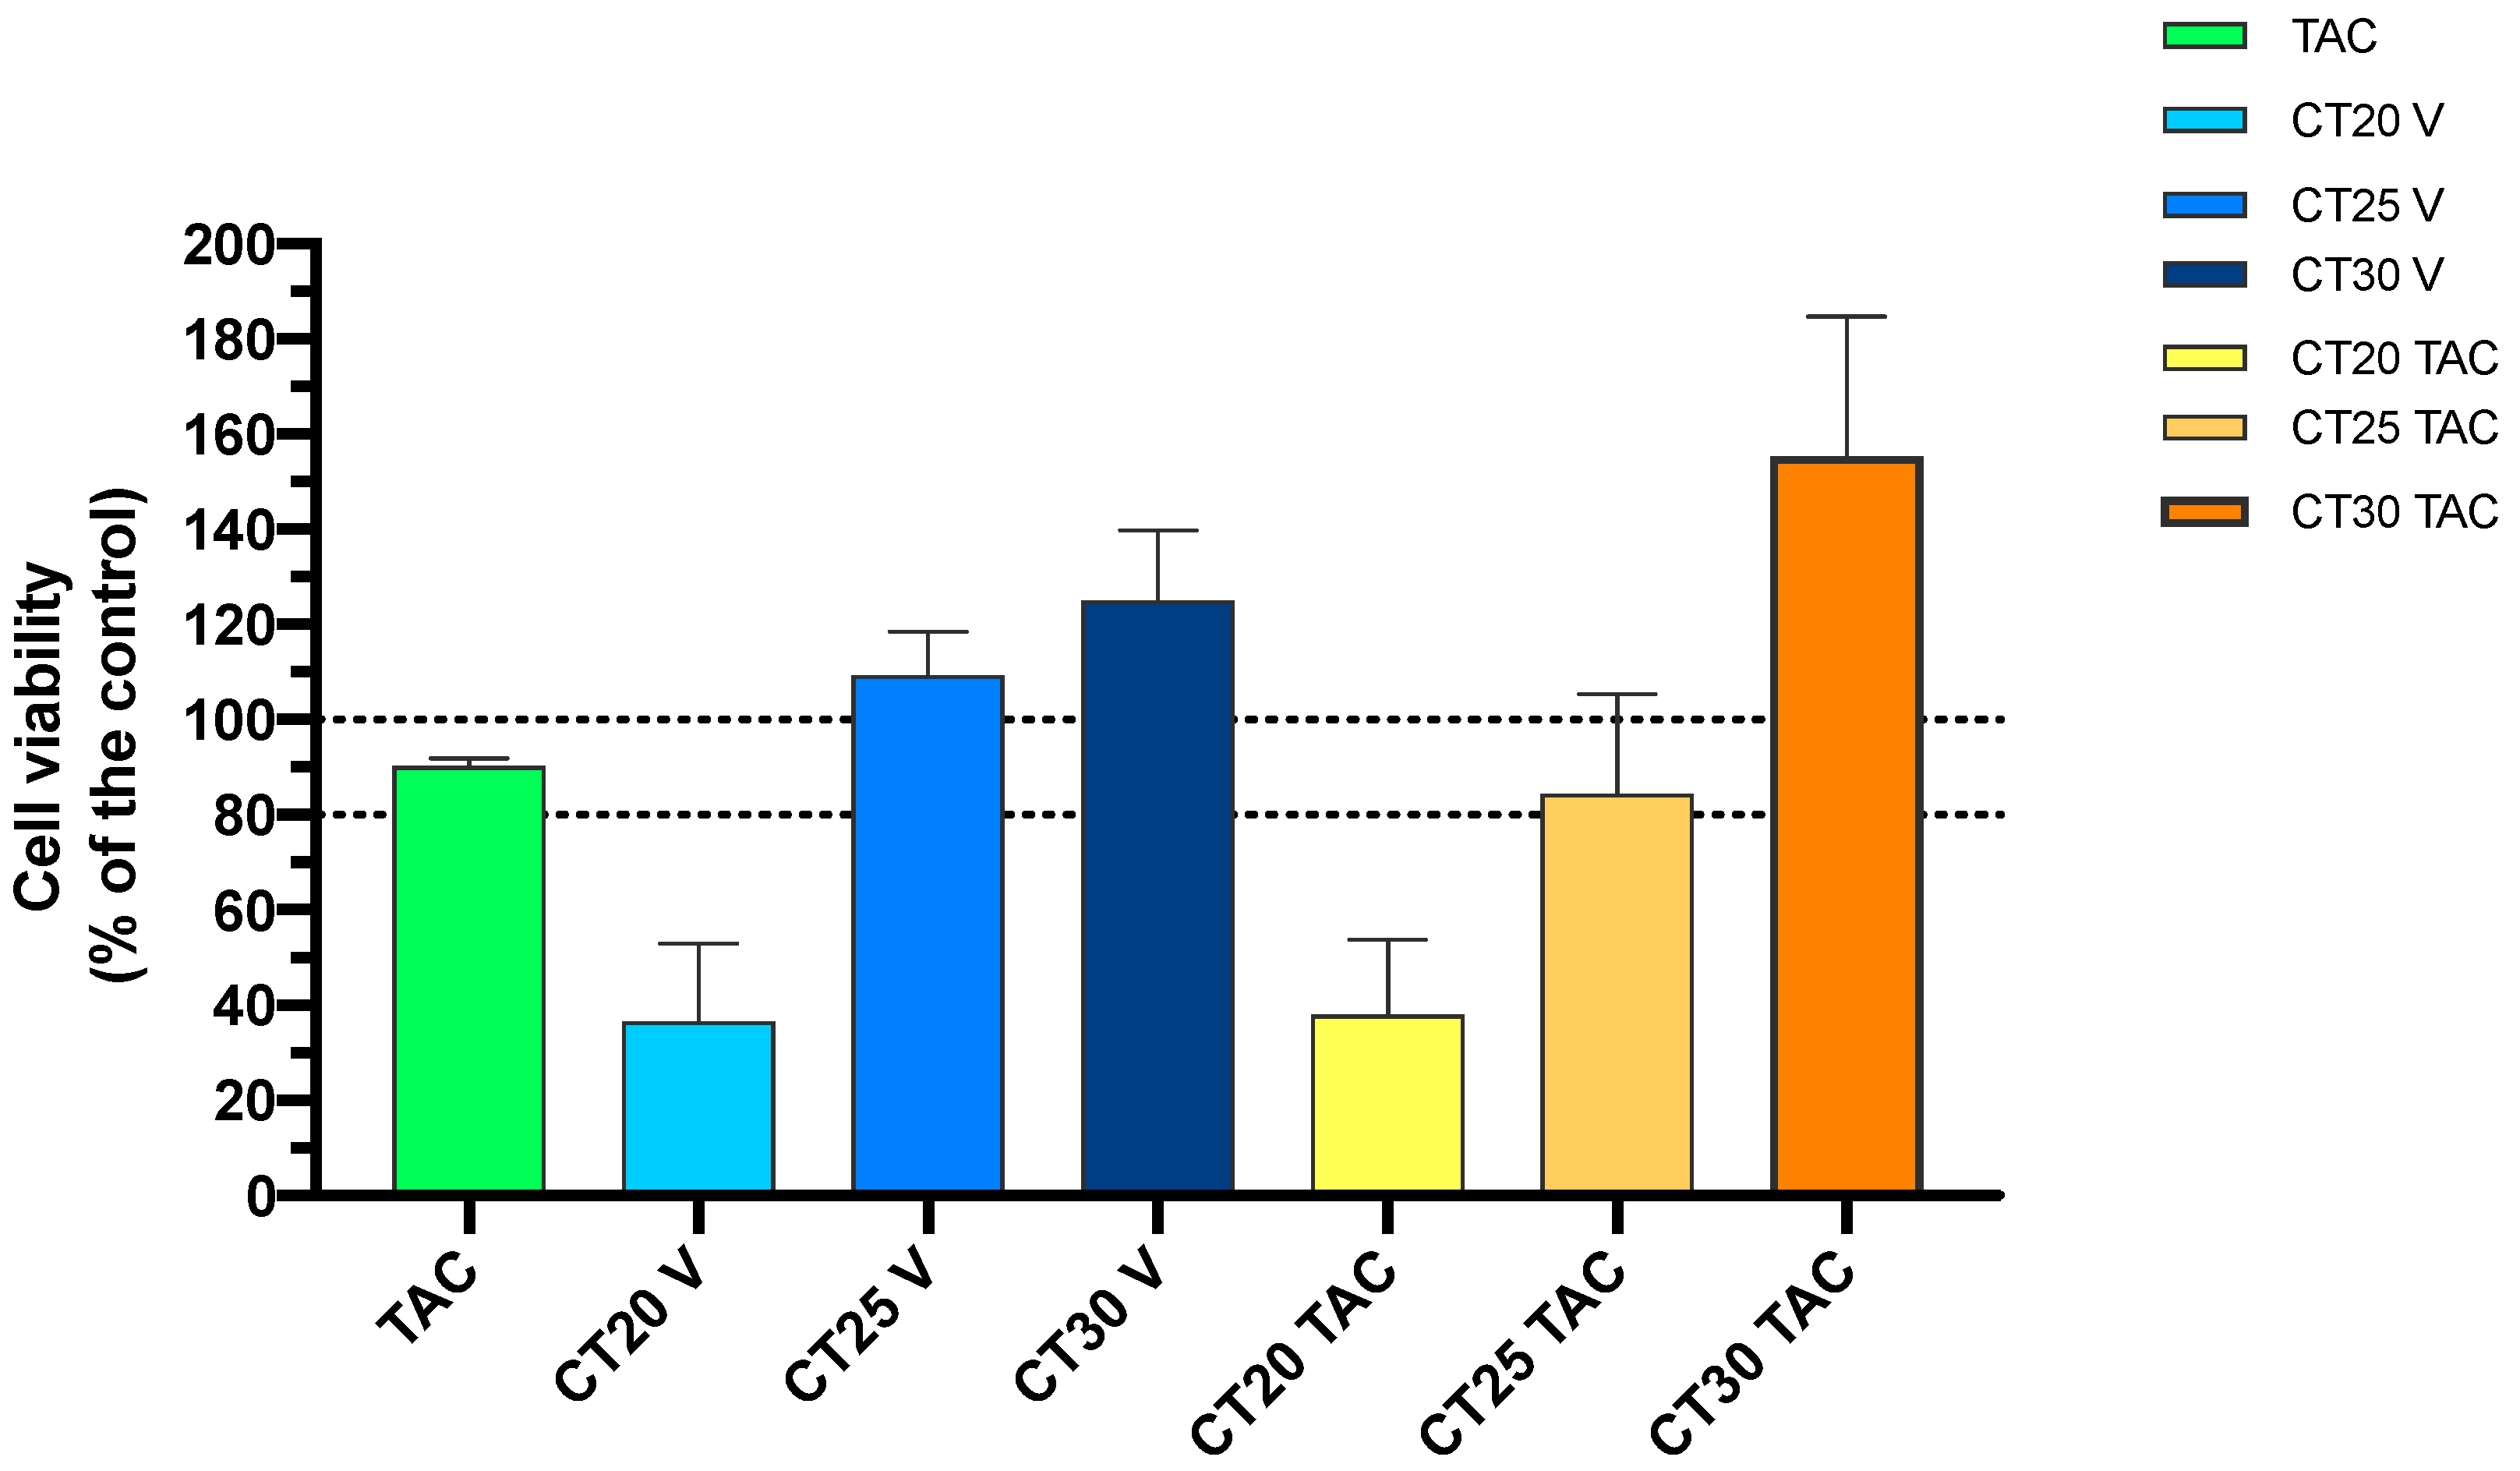
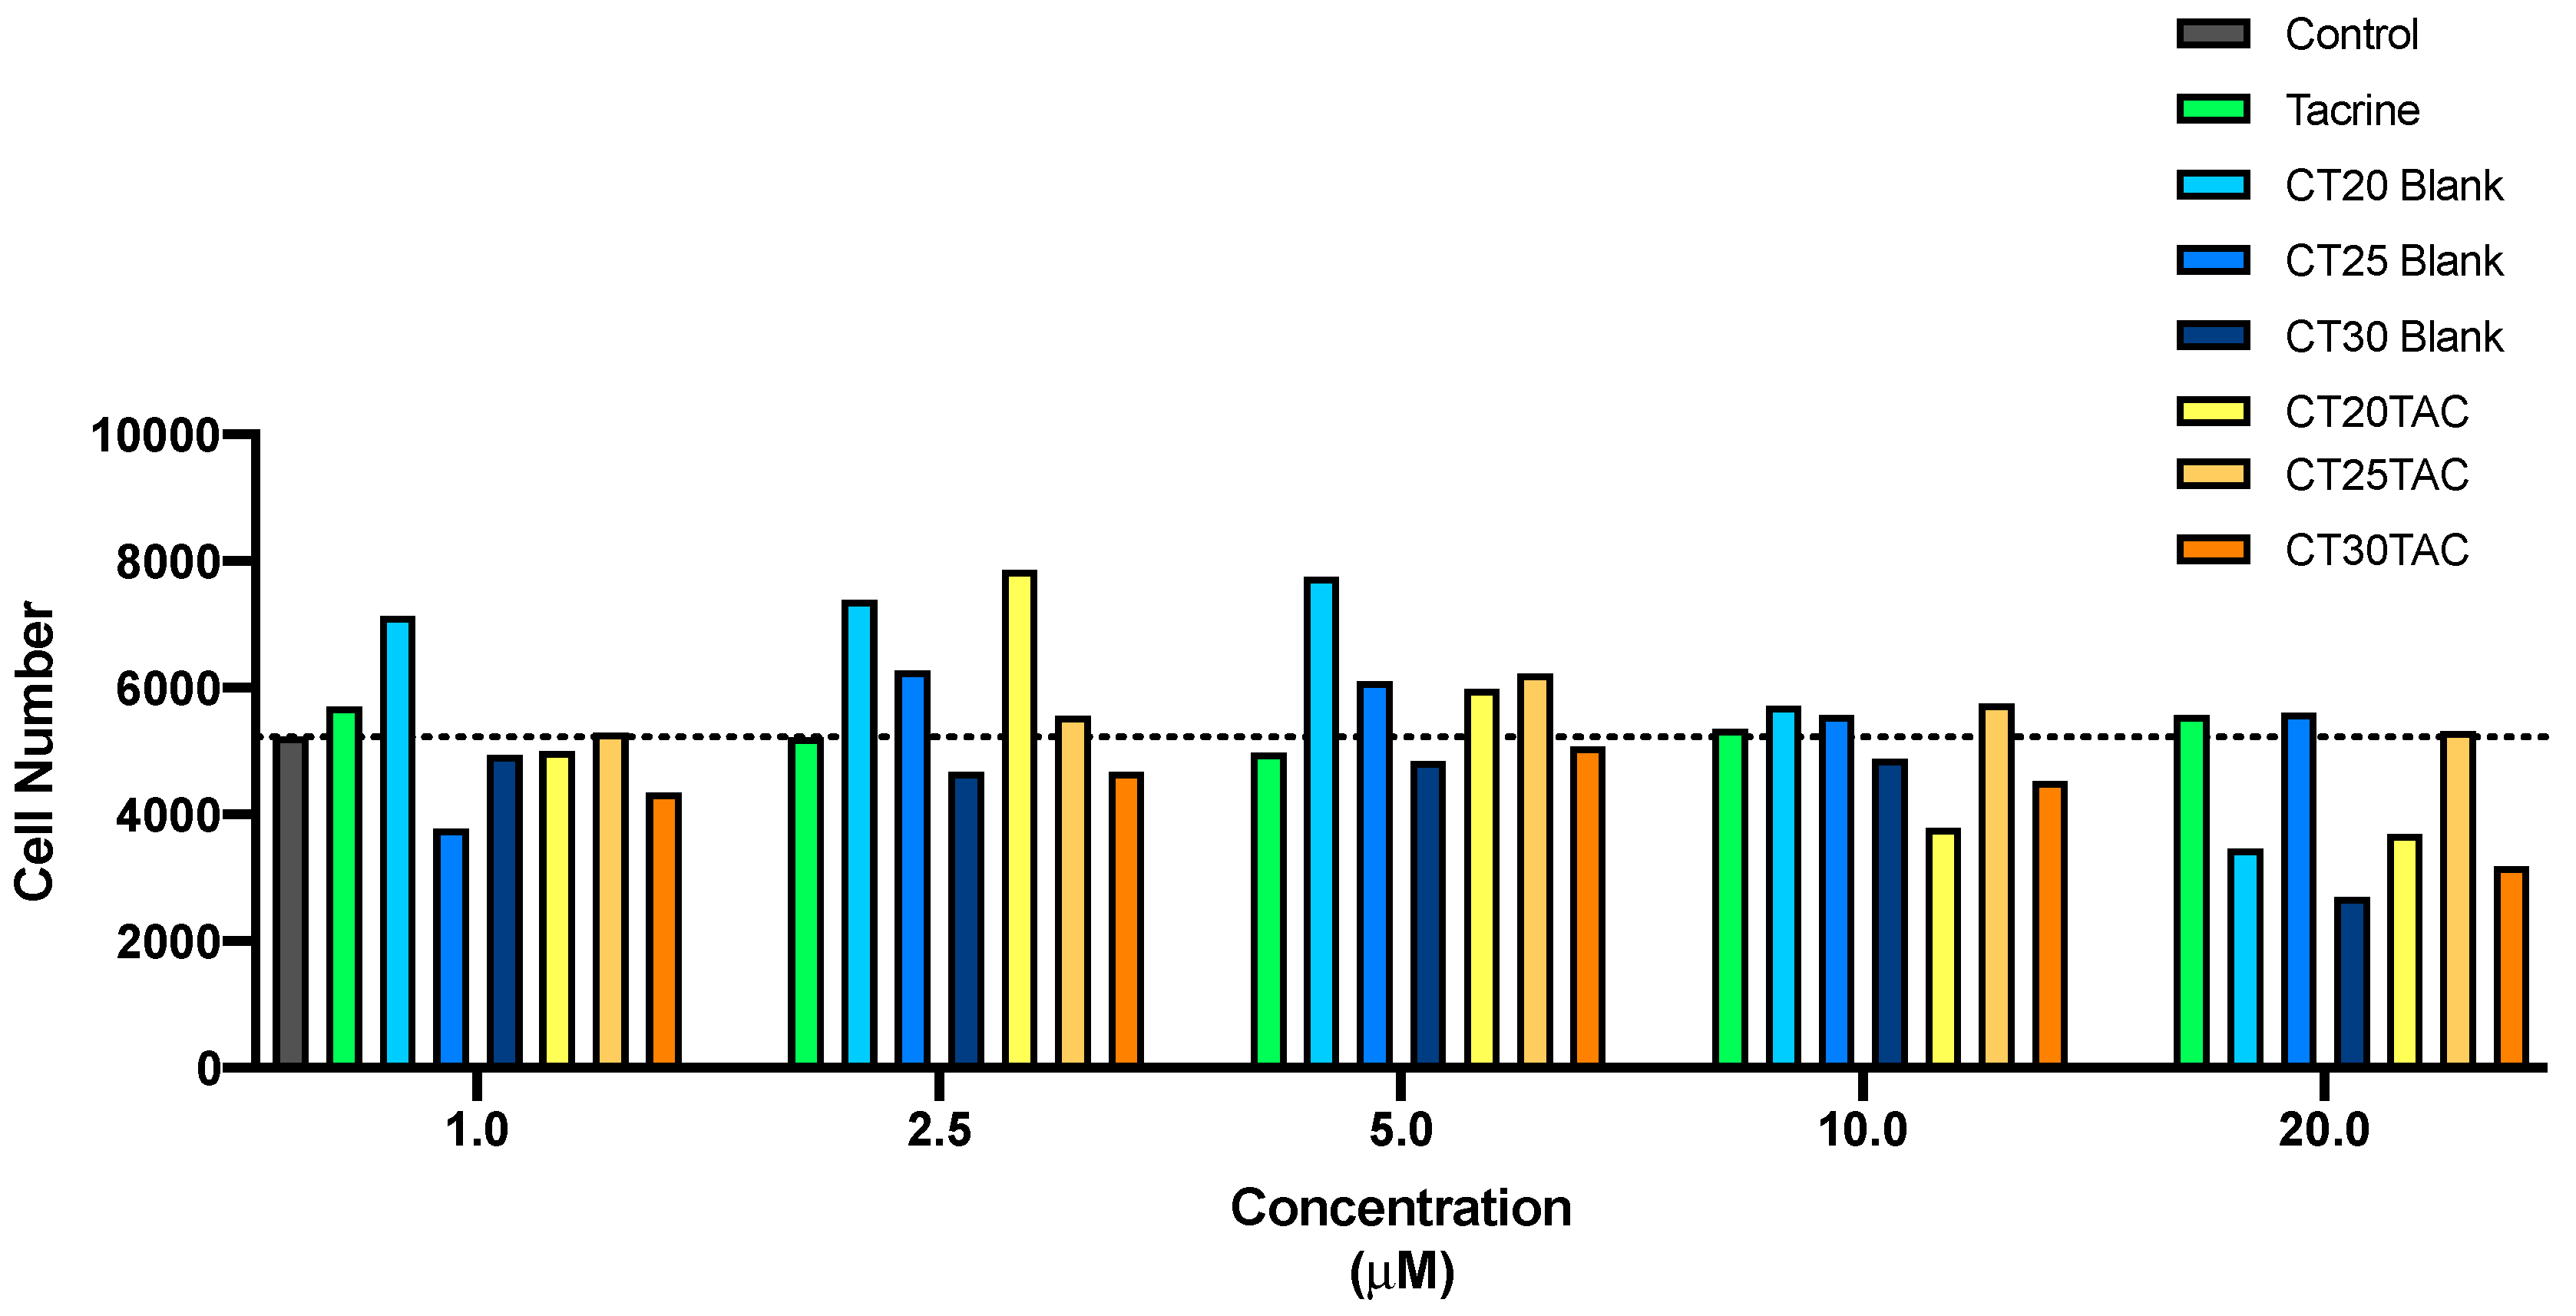
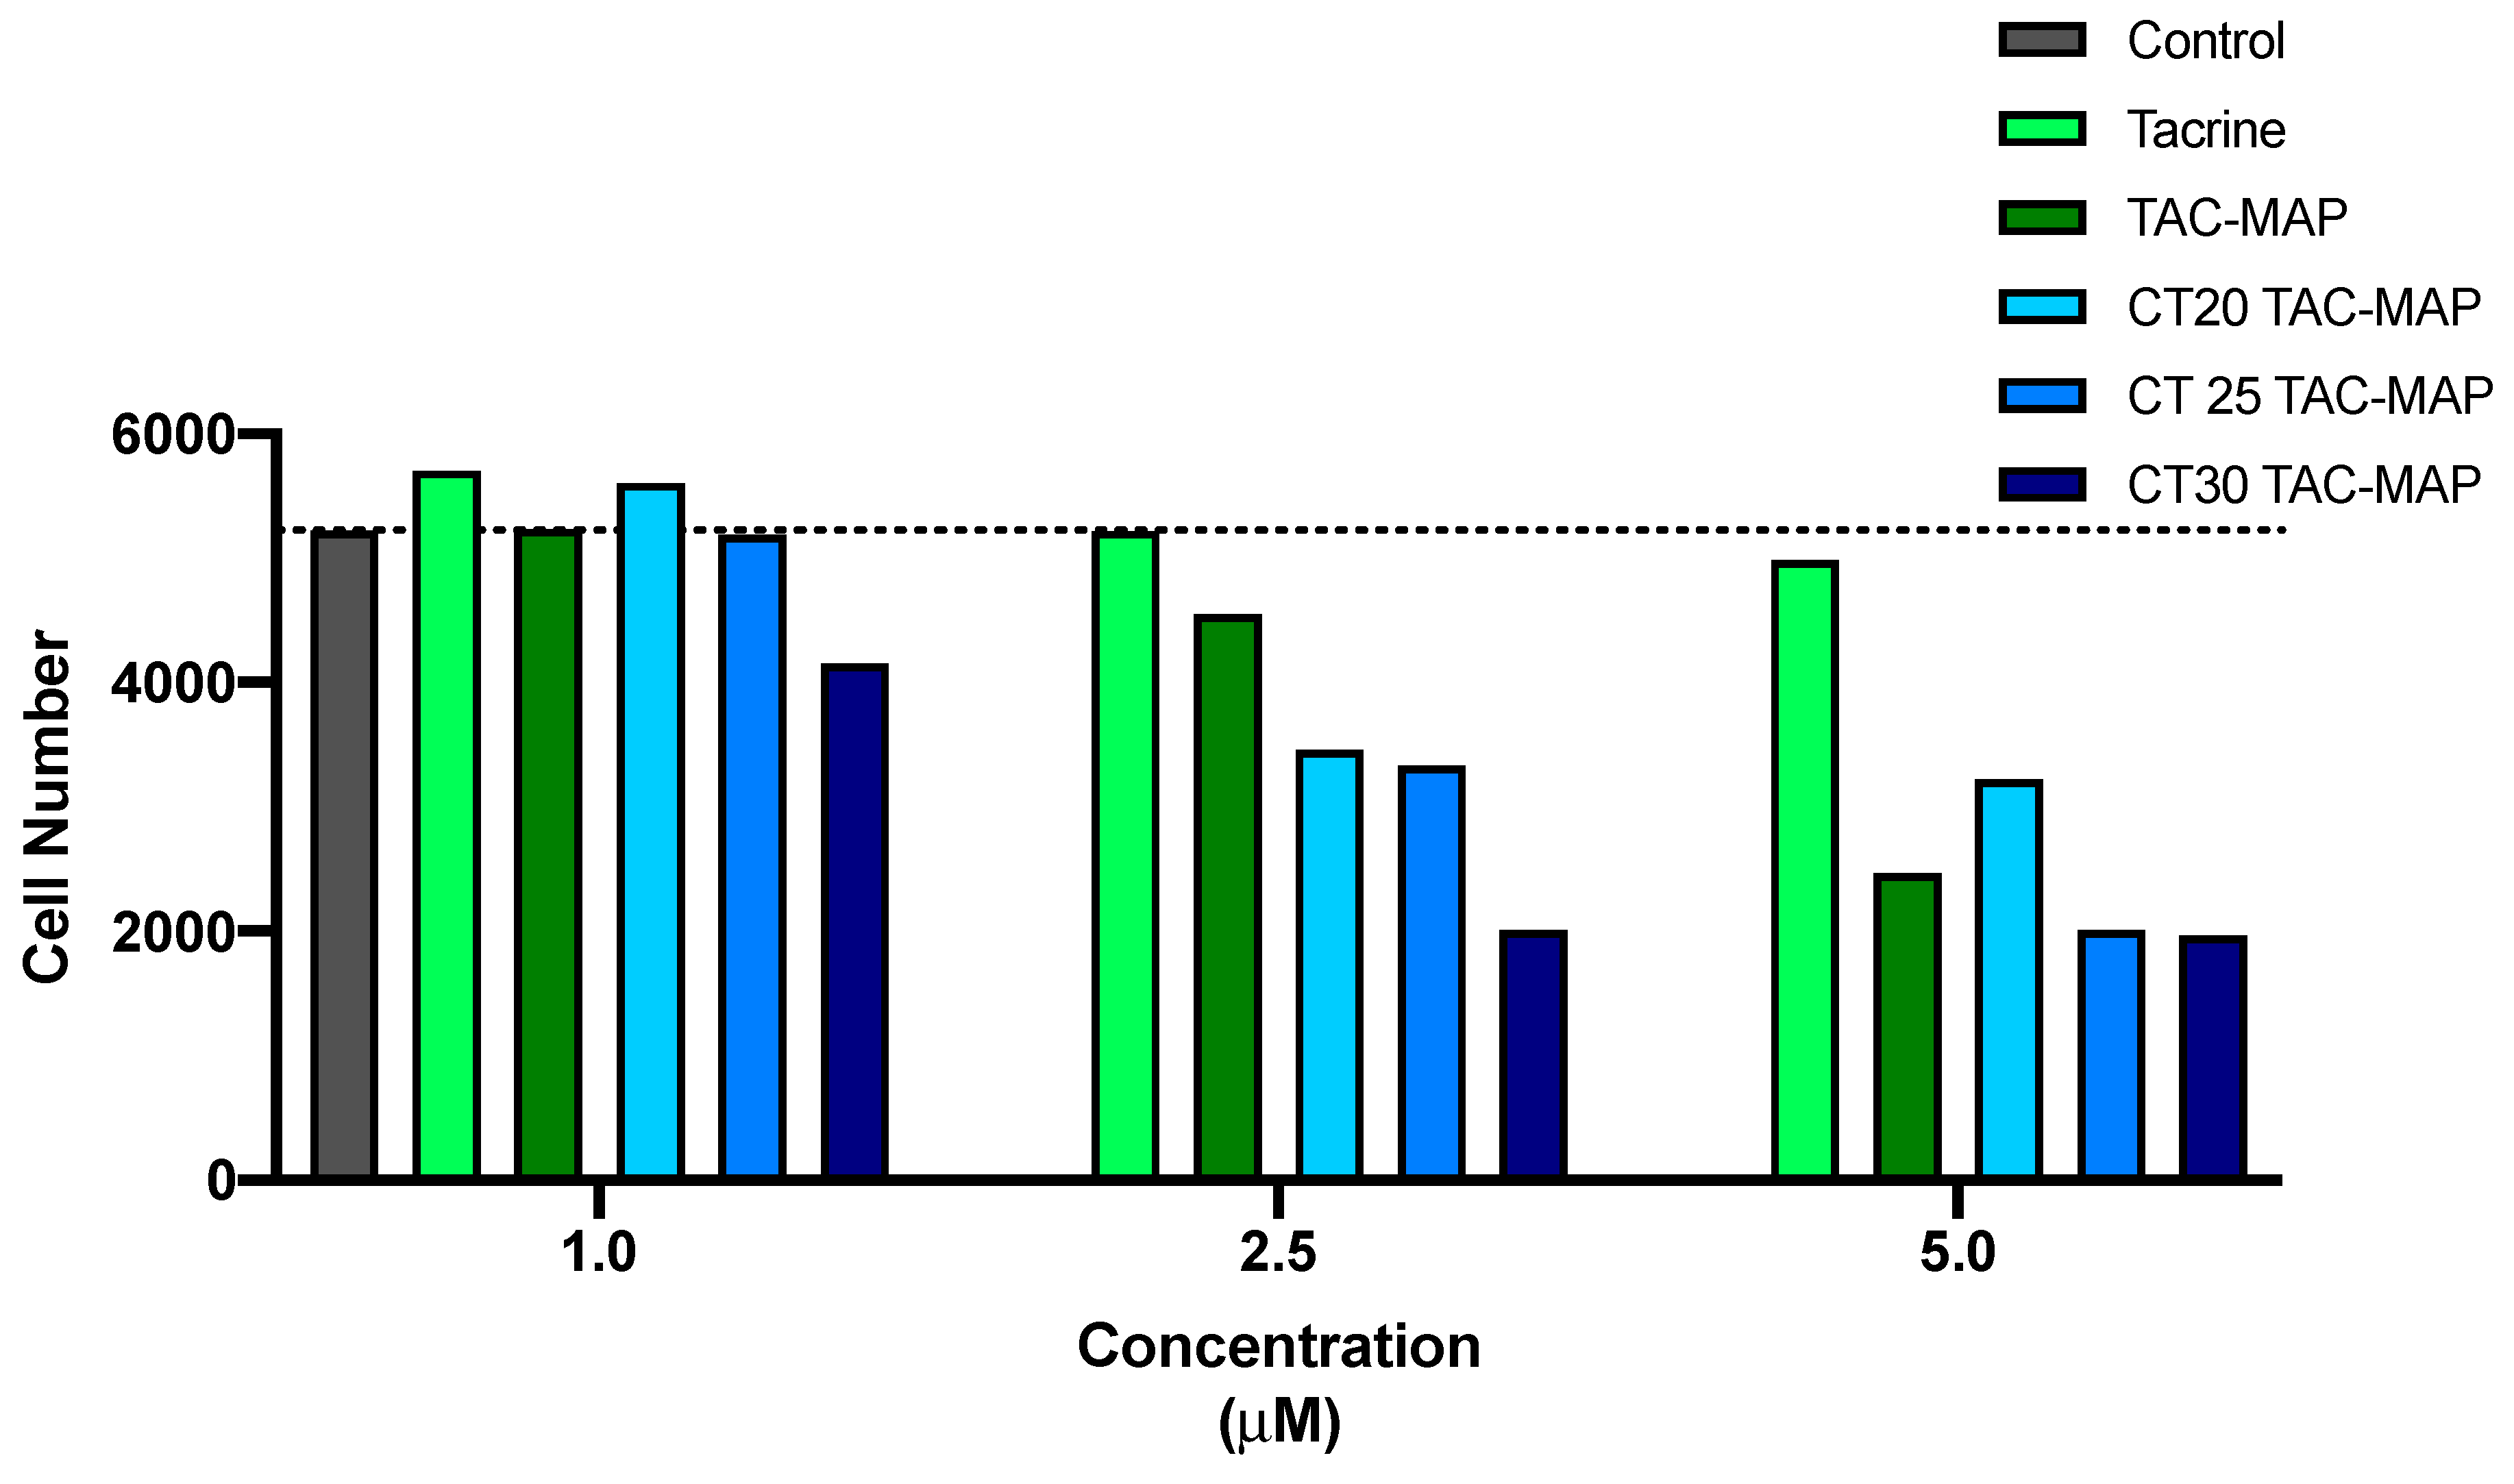
3.3.2. SRB Assay
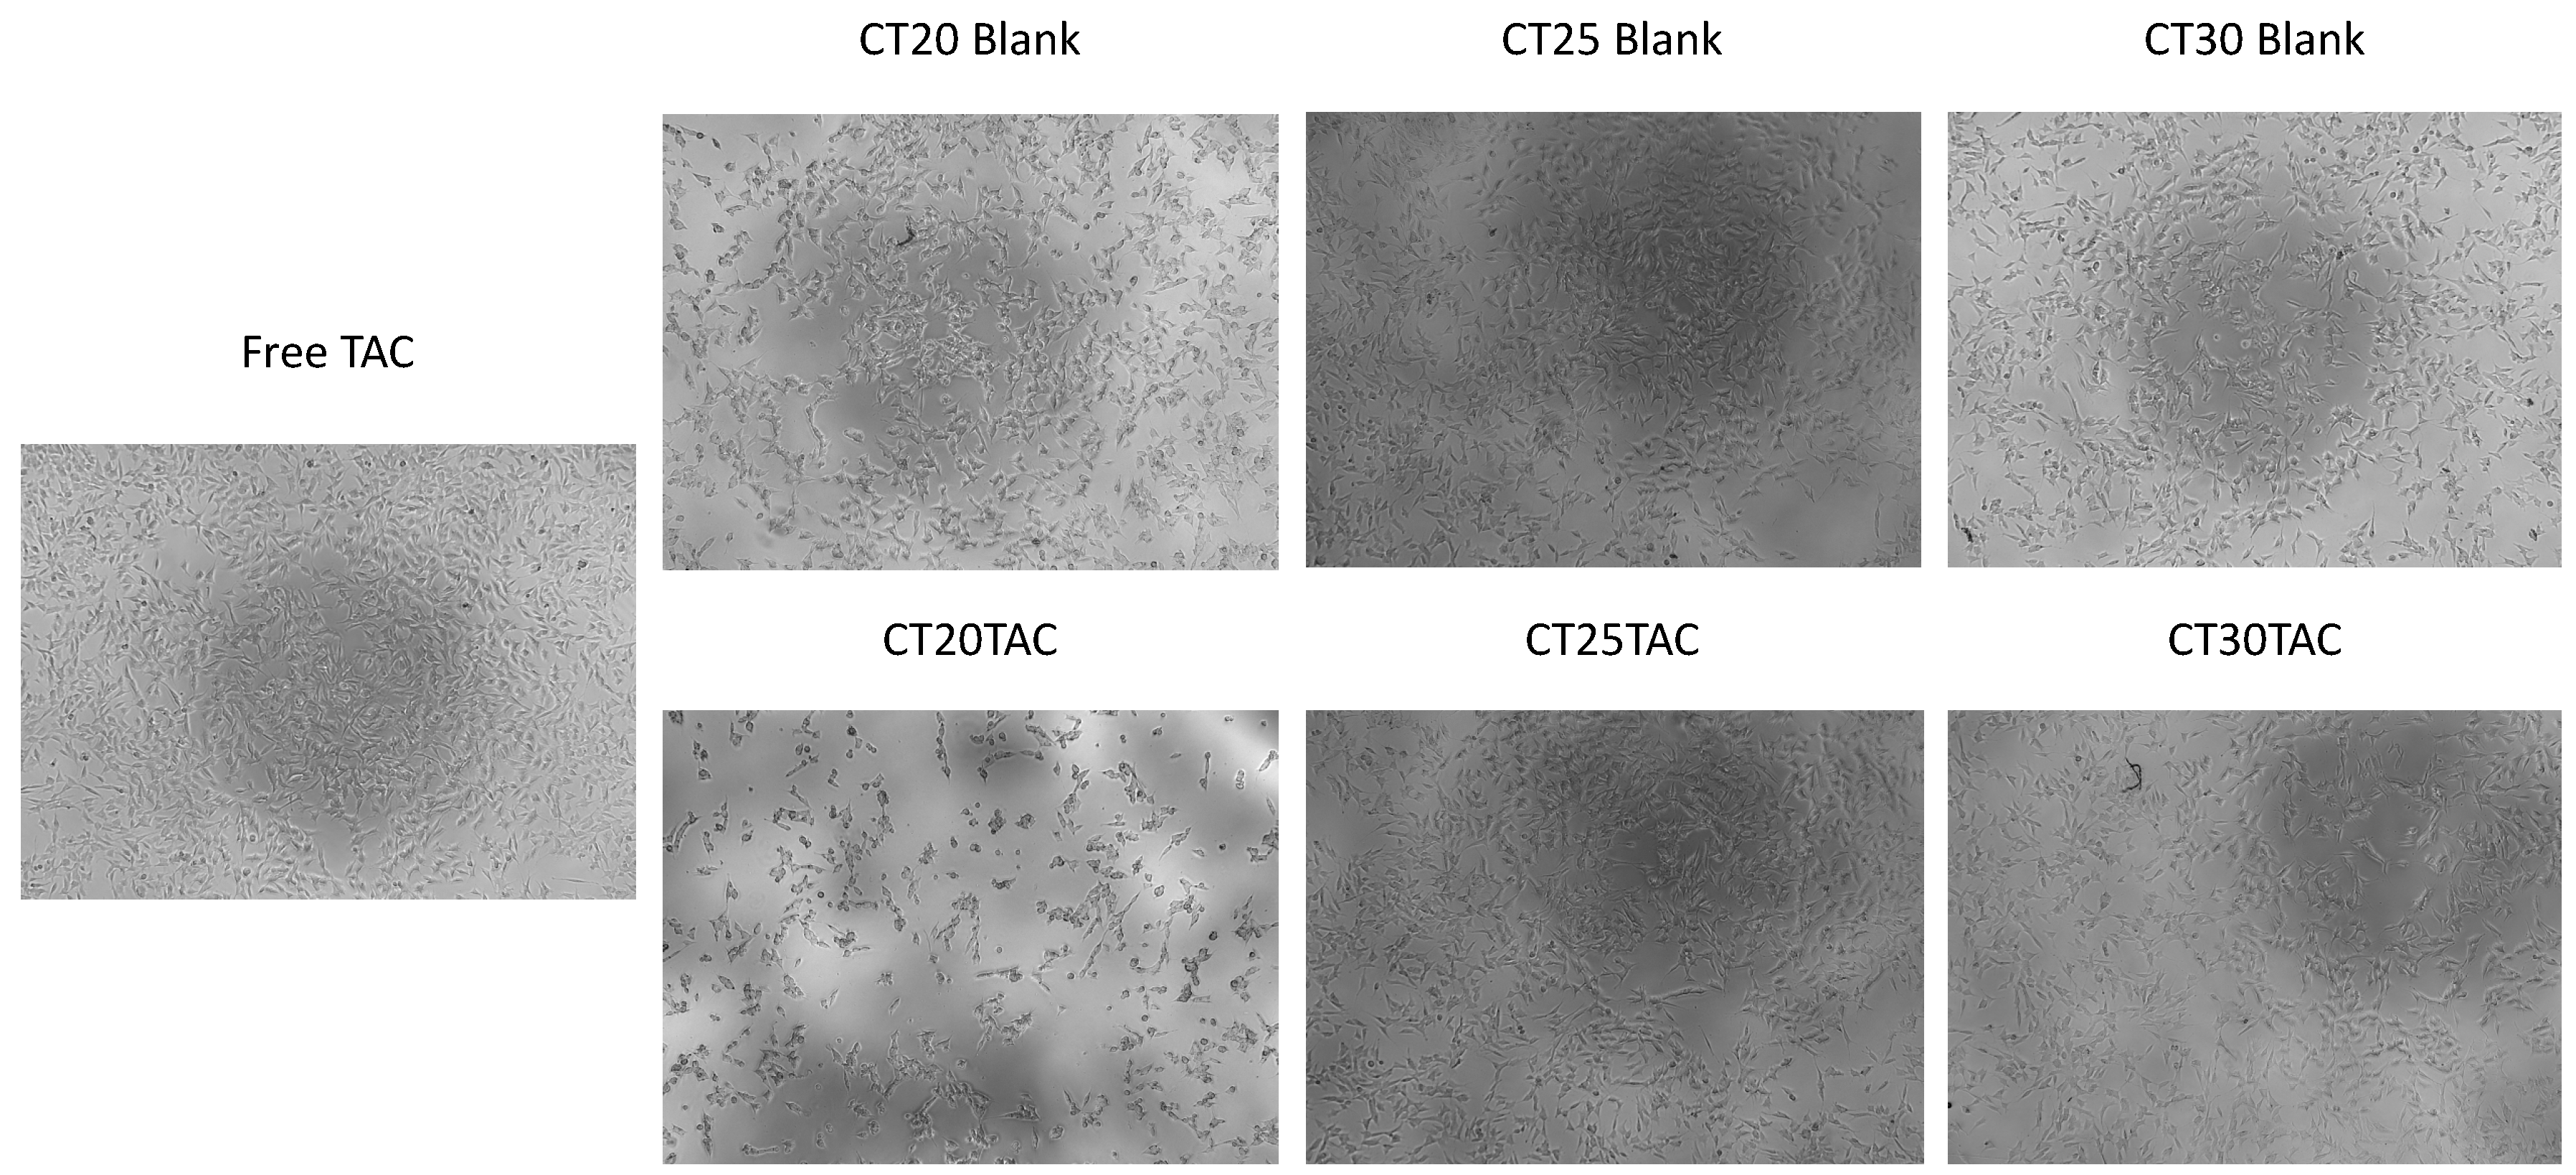
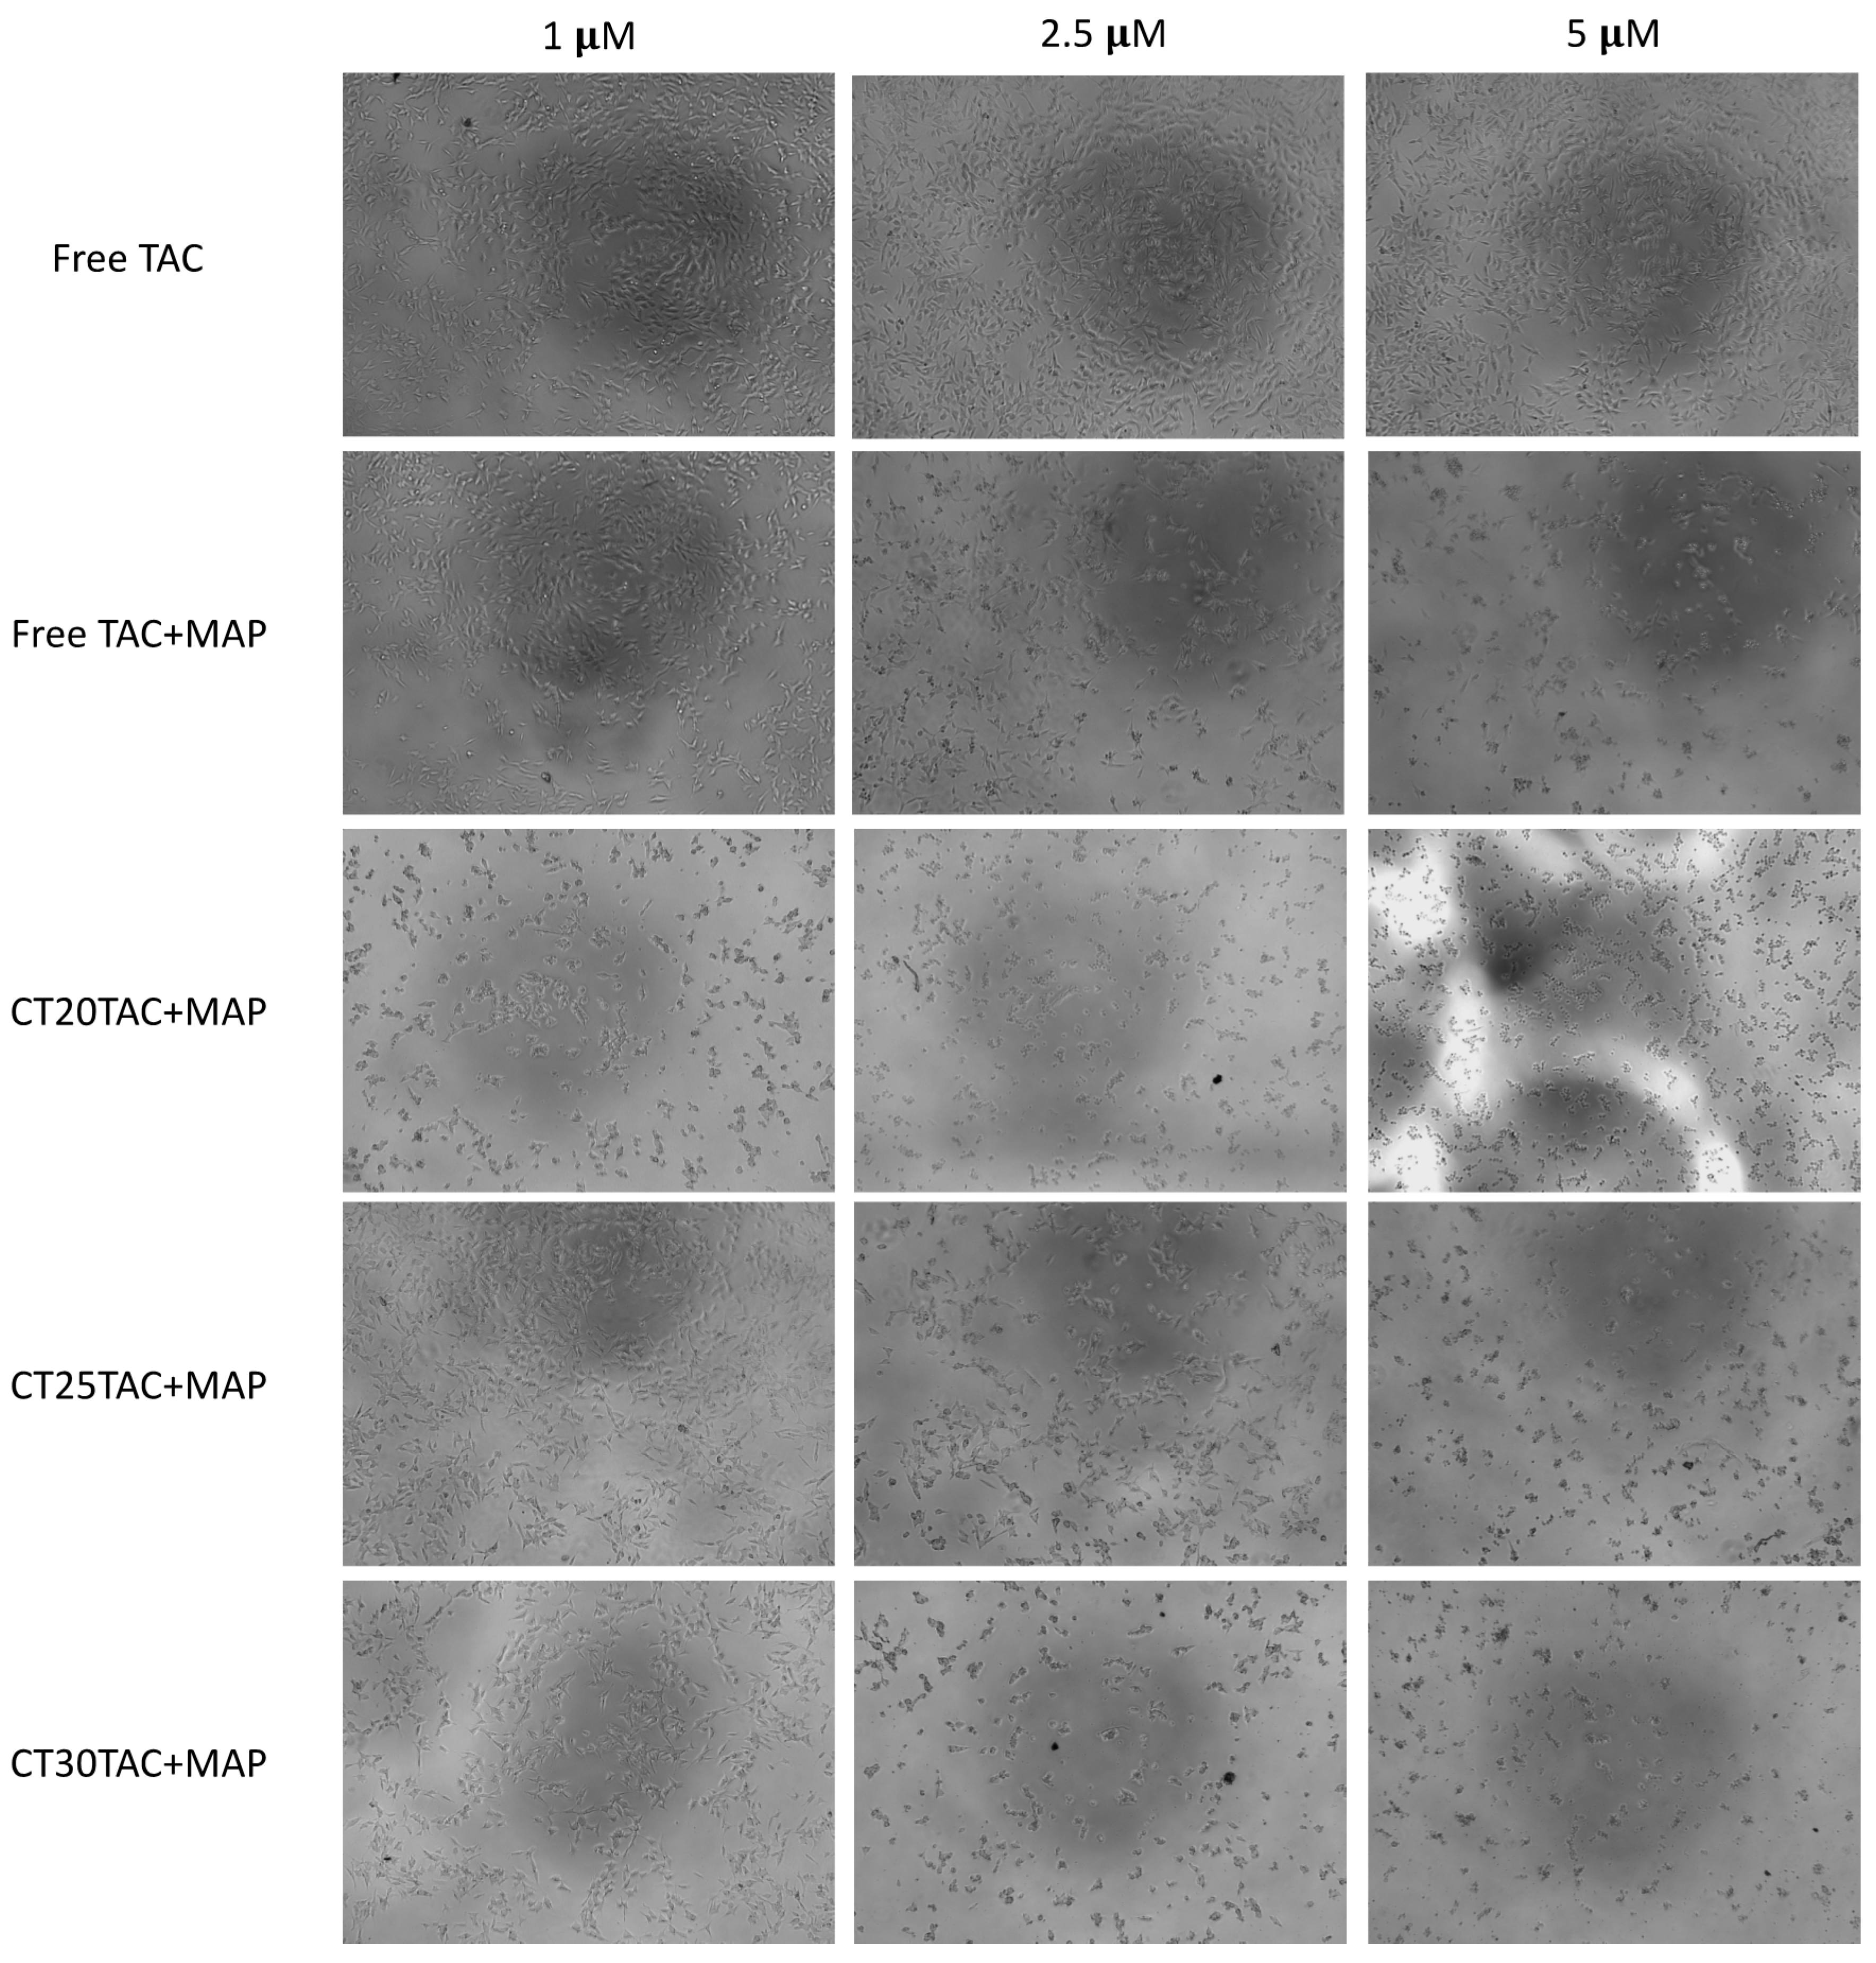
3.4. Cell Morphology Visualization
4. Conclusions
Author Contributions
Funding
Acknowledgments
Conflicts of Interest
References
- Shutske, G.M.; Pierrat, F.A.; Kapples, K.J.; Cornfeldt, M.L.; Szewczak, M.R.; Huger, F.P.; Bores, G.M.; Haroutunian, V.; Davis, K.L. 9-amino-l,2,3,4-tetrahydroacridin-l-ols: Synthesis and Evaluation As Potential Alzheimer’S Disease Therapeutics. J. Med. Chem. 1989, 32, 1805–1813. [Google Scholar] [CrossRef]
- Crismon, M.L. Tacrine: First drug approved for alzheimer’s disease. Ann. Pharmacother. 1994, 28, 744–751. [Google Scholar] [CrossRef]
- Summers, W.K.; Tachiki, K.H.; Kling, A. Tacrine in the Treatment of Alzheimer’s Disease. Eur. Neurol. 1989, 29 (Suppl. S3), 28–32. [Google Scholar] [CrossRef]
- Tumiatti, V.; Minarini, A.; Bolognesi, M.L.; Milelli, A.; Rosini, M.; Melchiorre, C. Tacrine Derivatives and Alzheimers Disease. Curr. Med. Chem. 2010, 17, 1825–1838. [Google Scholar] [CrossRef]
- Summers, W.K. Tacrine, and Alzheimer’s treatments. J. Alzheimer’s Dis. 2006, 9, 439–445. [Google Scholar] [CrossRef]
- Bales, K.R.; Verina, T.; Dodel, R.C.; Du, Y.; Altstiel, L.; Bender, M.; Hyslop, P.; Johnstone, E.M.; Little, S.P.; Cummins, D.J.; et al. Lack of apolipoprotein E dramatically reduces amyloid β-peptide deposition. Nat. Genet. 1997, 17, 263–264. [Google Scholar] [CrossRef]
- Galimberti, D.; Scarpini, E. Progress in Alzheimer’s disease. J. Neurol. 2012, 259, 201–211. [Google Scholar] [CrossRef]
- Briggs, R.; Kennelly, S.P.; O’Neill, D. Drug treatments in Alzheimer’s disease. Clin. Med. J. R. Coll. Physicians Lond. 2016. [Google Scholar] [CrossRef]
- Lane, C.A.; Hardy, J.; Schott, J.M. Alzheimer’s disease. Eur. J. Neurol. 2018, 25, 59–70. [Google Scholar] [CrossRef]
- Santello, M.; Toni, N.; Volterra, A. Astrocyte function from information processing to cognition and cognitive impairment. Nat. Neurosci. 2019, 22, 154–166. [Google Scholar] [CrossRef] [Green Version]
- Summers, W.K.; Majovski, L.V.; Marsh, G.M.; Tachiki, K.; Kling, A. Oral Tetrahydroaminoacridine in Long-Term Treatment of Senile Dementia, Alzheimer Type. N. Engl. J. Med. 1986, 315, 1241–1245. [Google Scholar] [CrossRef] [PubMed]
- Forsyth, D.R.; Surmon, D.J.; Morgan, R.A.; Wilcock, G.K. Clinical experience with and side-effects of tacrine hydrochloride in alzheimer’s disease: A pilot study. Age Ageing 1989, 18, 223–229. [Google Scholar] [CrossRef]
- Forsyth, D.R.; Wilcock, G.K.; Morgan, R.A.; Truman, C.A.; Ford, J.M.; Roberts, C.J.C. Pharmacokinetics of tacrine hydrochloride in Alzheimer’s disease. Clin. Pharmacol. Ther. 1989, 46, 634–641. [Google Scholar] [CrossRef]
- Tamilselvan, N.; Raghavan, C.V. Formulation and characterization of anti-alzheimer’s drug loaded chitosan nanoparticles and its In vitro biological evaluation. J. Young Pharm. 2015, 7, 28–35. [Google Scholar] [CrossRef] [Green Version]
- Agrawal, M.; Saraf, S.; Saraf, S.; Antimisiaris, S.G.; Chougule, M.B.; Shoyele, S.A.; Alexander, A. Nose-to-brain drug delivery: An update on clinical challenges and progress towards approval of anti-Alzheimer drugs. J. Control. Release 2018, 281, 139–177. [Google Scholar] [CrossRef]
- Agrawal, M.; Saraf, S.; Saraf, S.; Dubey, S.K.; Puri, A.; Patel, R.J.; Ajazuddin; Ravichandiran, V.; Murty, U.S.; Alexander, A. Recent strategies and advances in the fabrication of nano lipid carriers and their application towards brain targeting. J. Control. Release 2020, 321, 372–415. [Google Scholar] [CrossRef]
- Khor, S.Y.; Vu, M.N.; Pilkington, E.H.; Johnston, A.P.R.; Whittaker, M.R.; Quinn, J.F.; Truong, N.P.; Davis, T.P. Elucidating the Influences of Size, Surface Chemistry, and Dynamic Flow on Cellular Association of Nanoparticles Made by Polymerization-Induced Self-Assembly. Small 2018, 14, 1801702. [Google Scholar] [CrossRef]
- Vu, M.N.; Kelly, H.G.; Wheatley, A.K.; Peng, S.; Pilkington, E.H.; Veldhuis, N.A.; Davis, T.P.; Kent, S.J.; Truong, N.P. Cellular Interactions of Liposomes and PISA Nanoparticles during Human Blood Flow in a Microvascular Network. Small 2020, 16, 2002861. [Google Scholar] [CrossRef] [PubMed]
- Gaspar, D.P.; Faria, V.; Quintas, J.P.; Almeida, A.J. Targeted Delivery of Lipid Nanoparticles by Means of Surface Chemical Modification. Curr. Org. Chem. 2017, 21, 2360–2375. [Google Scholar] [CrossRef]
- Mohanta, B.C.; Palei, N.N.; Surendran, V.; Dinda, S.C.; Rajangam, J.; Deb, J.; Sahoo, B.M. Lipid Based Nanoparticles: Current Strategies for Brain Tumor Targeting. Curr. Nanomater. 2019, 4, 84–100. [Google Scholar] [CrossRef]
- Tapeinos, C.; Battaglini, M.; Ciofani, G. Advances in the design of solid lipid nanoparticles and nanostructured lipid carriers for targeting brain diseases. J. Control. Release 2017, 264, 306–332. [Google Scholar] [CrossRef]
- Aburahma, M.H.; Badr-Eldin, S.M. Compritol 888 ATO: A multifunctional lipid excipient in drug delivery systems and nanopharmaceuticals. Expert Opin. Drug Deliv. 2014, 11, 1865–1883. [Google Scholar] [CrossRef]
- Sullivan, D.W.; Gad, S.C.; Julien, M. A review of the nonclinical safety of Transcutol®, a highly purified form of diethylene glycol monoethyl ether (DEGEE) used as a pharmaceutical excipient. Food Chem. Toxicol. 2014, 72, 40–50. [Google Scholar] [CrossRef] [PubMed]
- Kreuter, J.; Ramge, P.; Petrov, V.; Hamm, S.; Gelperina, S.E.; Engelhardt, B.; Alyautdin, R.; Von Briesen, H.; Begley, D.J. Direct evidence that polysorbate-80-coated poly(butylcyanoacrylate) nanoparticles deliver drugs to the CNS via specific mechanisms requiring prior binding of drug to the nanoparticles. Pharm. Res. 2003, 20, 409–416. [Google Scholar] [CrossRef] [PubMed]
- Guidotti, G.; Brambilla, L.; Rossi, D. Cell-Penetrating Peptides: From Basic Research to Clinics. Trends Pharmacol. Sci. 2017, 38, 406–424. [Google Scholar] [CrossRef] [PubMed]
- Sarko, D.; Beijer, B.; Boy, R.G.; Nothelfer, E.M.; Leotta, K.; Eisenhut, M.; Altmann, A.; Haberkorn, U.; Mier, W. The pharmacokinetics of cell-penetrating peptides. Mol. Pharm. 2010, 7, 2224–2231. [Google Scholar] [CrossRef] [PubMed]
- Fei, L.; Yap, L.P.; Conti, P.S.; Shen, W.C.; Zaro, J.L. Tumor targeting of a cell penetrating peptide by fusing with a pH-sensitive histidine-glutamate co-oligopeptide. Biomaterials 2014, 35, 4082–4087. [Google Scholar] [CrossRef] [PubMed] [Green Version]
- Mo, R.H.; Zaro, J.L.; Shen, W.C. Comparison of cationic and amphipathic cell penetrating peptides for siRNA delivery and efficacy. Mol. Pharm. 2012, 9, 299–309. [Google Scholar] [CrossRef] [PubMed]
- Taniguchi, K.; Wada, S.I.; Ito, Y.; Hayashi, J.; Inomata, Y.; Lee, S.W.; Tanaka, T.; Komura, K.; Akao, Y.; Urata, H.; et al. α-Aminoisobutyric Acid-Containing Amphipathic Helical Peptide-Cyclic RGD Conjugation as a Potential Drug Delivery System for MicroRNA Replacement Therapy in Vitro. Mol. Pharm. 2019, 16, 4542–4550. [Google Scholar] [CrossRef]
- Oehlke, J.; Scheller, A.; Wiesner, B.; Krause, E.; Beyermann, M.; Klauschenz, E.; Melzig, M.; Bienert, M. Cellular uptake of an α-helical amphipathic model peptide with the potential to deliver polar compounds into the cell interior non-endocytically. Biochim. Biophys. Acta Biomembr. 1998, 1414, 127–139. [Google Scholar] [CrossRef] [Green Version]
- Vale, N.; Alves, C.; Sharma, V.; Lázaro, D.F.; Silva, S.; Gomes, P.; Outeiro, T.F. A new MAP-Rasagiline conjugate reduces α-synuclein inclusion formation in a cell model. Pharmacol. Rep. 2020, 72, 456–464. [Google Scholar] [CrossRef] [PubMed]
- Chen, Z.; Zhong, C. Oxidative stress in Alzheimer’s disease. Neurosci. Bull. 2014, 30, 271–281. [Google Scholar] [CrossRef] [PubMed]
- Cheignon, C.; Tomas, M.; Bonnefont-Rousselot, D.; Faller, P.; Hureau, C.; Collin, F. Oxidative stress and the amyloid beta peptide in Alzheimer’s disease. Redox Biol. 2018, 14, 450–464. [Google Scholar] [CrossRef] [PubMed]
- Talesa, V.N. Acetylcholinesterase in Alzheimer’s disease. Mech. Ageing Dev. 2001, 122, 1961–1969. [Google Scholar] [CrossRef]
- Gaspar, D.P.; Faria, V.; Gonçalves, L.M.D.; Taboada, P.; Remuñán-López, C.; Almeida, A.J. Rifabutin-loaded solid lipid nanoparticles for inhaled antitubercular therapy: Physicochemical and in vitro studies. Int. J. Pharm. 2016, 497, 199–209. [Google Scholar] [CrossRef]
- Yang, Q.; Williams, D.; Owusu-Ababio, G.; Ebube, N.K.; Habib, M.J. Controlled release tacrine delivery system for the treatment of Alzheimer’s disease. Drug Deliv. J. Deliv. Target. Ther. Agents 2001, 8, 93–98. [Google Scholar] [CrossRef]
- Wilson, B.; Samanta, M.K.; Santhi, K.; Kumar, K.P.S.; Paramakrishnan, N.; Suresh, B. Targeted delivery of tacrine into the brain with polysorbate 80-coated poly(n-butylcyanoacrylate) nanoparticles. Eur. J. Pharm. Biopharm. 2008, 70, 75–84. [Google Scholar] [CrossRef]
- Benítez-Martínez, S.; Caballero-Díaz, E.; Valcárcel, M. Development of a biosensing system for tacrine based on nitrogen-doped graphene quantum dots and acetylcholinesterase. Analyst 2016, 141, 2688–2695. [Google Scholar] [CrossRef] [Green Version]
- Eslami, M.; Nikkhah, S.J.; Hashemianzadeh, S.M.; Sajadi, S.A.S. The compatibility of Tacrine molecule with poly(n-butylcyanoacrylate) and Chitosan as efficient carriers for drug delivery: A molecular dynamics study. Eur. J. Pharm. Sci. 2016, 82, 79–85. [Google Scholar] [CrossRef]
- Hassanzadeh, G.; Fallahi, Z.; Khanmohammadi, M.; Elmizadeh, H. Effect of Magnetic Tacrine-Loaded Chitosan Nanoparticles on Spatial Learning, Memory, Amyloid Precursor Protein and Seladin-1 Expression in the Hippocampus Of Streptozotocin-Exposed Rats. Int. Clin. Neurosci. J. 2016, 3, 25–31. [Google Scholar] [CrossRef]
- Souto, E.B.; Almeida, A.J.; Müller, R.H. Lipid nanoparticles (SLN®, NLC®) for cutaneous drug delivery: Structure, protection and skin effects. J. Biomed. Nanotechnol. 2007, 3, 317–331. [Google Scholar] [CrossRef]
- Chu, K.S.; Schorzman, A.N.; Finniss, M.C.; Bowerman, C.J.; Peng, L.; Luft, J.C.; Madden, A.J.; Wang, A.Z.; Zamboni, W.C.; DeSimone, J.M. Nanoparticle drug loading as a design parameter to improve docetaxel pharmacokinetics and efficacy. Biomaterials 2013, 34, 8424–8429. [Google Scholar] [CrossRef] [PubMed] [Green Version]
- Wadhwani, P.; Bürck, J.; Strandberg, E.; Mink, C.; Afonin, S.; Ulrich, A.S. Using a sterically restrictive amino acid as a 19F NMR label to monitor and to control peptide aggregation in membranes. J. Am. Chem. Soc. 2008, 130, 16515–16517. [Google Scholar] [CrossRef] [PubMed]
- Kerth, A.; Erbe, A.; Dathe, M.; Blume, A. Infrared reflection absorption spectroscopy of amphipathic model peptides at the air/water interface. Biophys. J. 2004, 86, 3750–3758. [Google Scholar] [CrossRef] [PubMed] [Green Version]
- Wadhwani, P.; Reichert, J.; Bürck, J.; Ulrich, A.S. Antimicrobial and cell-penetrating peptides induce lipid vesicle fusion by folding and aggregation. Eur. Biophys. J. 2012, 41, 177–187. [Google Scholar] [CrossRef] [Green Version]
- Orellana, E.; Kasinski, A. Sulforhodamine B (SRB) Assay in Cell Culture to Investigate Cell Proliferation. Bio-Protocol 2016, 6, e1984. [Google Scholar] [CrossRef] [PubMed] [Green Version]
- Vichai, V.; Kirtikara, K. Sulforhodamine B colorimetric assay for cytotoxicity screening. Nat. Protoc. 2006, 1, 1112–1116. [Google Scholar] [CrossRef]


| NLC | NLC composition | PS (nm) | PI | ZP (mV) | EE% | DL% |
|---|---|---|---|---|---|---|
| CT20 B | Lipids: 80% C and 20% TE Surfactant: 3% T80 | 96.995 ± 15 | 0.2947 ± 0.068 | −13.589 ± 1.1 | -- | -- |
| CT25 B | Lipids: 75% C and 25% TE Surfactant: 3% T80 | 111.78 ± 35 | 0.2547 ± 0.003 | −12.017 ± 0.5 | -- | -- |
| CT30 B | Lipids: 70% C and 30% TE Surfactant: 3% T80 | 71.465 ± 5 | 0.3535 ± 0.017 | −14.633 ± 0.4 | -- | -- |
| CT20TAC | Lipids: 80% C and 20% TE Surfactant: 3% T80 | 80.415 ± 9 | 0.410 ± 0.023 | −16.021 ± 1.0 | 72.4 ± 10.3 | 1.60 ± 0.29 |
| CT25TAC | Lipids: 75% C and 25% TE Surfactant: 3% T80 | 71.857 ± 12 | 0.365 ± 0.884 | −13.484 ± 0.02 | 56.4 ± 7.8 | 1.96 ± 0.11 |
| CT30TAC | Lipids: 70% C and 30% TE Surfactant: 3% T80 | 123.733 ± 24 | 0.290 ± 0.013 | −12.250 ± 1.0 | 58.5 ± 7.0 | 3.00 ± 0.43 |
| CT20TAC + MAP | Lipids: 80% C and 20% TE Surfactant: 3% T80 | 281.634 ± 206 | 0.290 ± 0.093 | −9.774 ± 5.8 | >85.2 | >1.23 |
| CT25TAC + MAP | Lipids: 75% C and 25% TE Surfactant: 3% T80 | 101.029 ± 13 | 0.280 ± 0.021 | −8.194 ± 3.4 | >85.2 | >1.33 |
| CT30TAC + MAP | Lipids: 70% C and 30% TE Surfactant: 3% T80 | 189.284 ± 207 | 0.252 ± 0.004 | −4.908 ± 0.4 | >85.2 | >1.81 |
Publisher’s Note: MDPI stays neutral with regard to jurisdictional claims in published maps and institutional affiliations. |
© 2020 by the authors. Licensee MDPI, Basel, Switzerland. This article is an open access article distributed under the terms and conditions of the Creative Commons Attribution (CC BY) license (http://creativecommons.org/licenses/by/4.0/).
Share and Cite
Silva, S.; Marto, J.; Gonçalves, L.; Almeida, A.J.; Vale, N. Formulation, Characterization and Evaluation against SH-SY5Y Cells of New Tacrine and Tacrine-MAP Loaded with Lipid Nanoparticles. Nanomaterials 2020, 10, 2089. https://doi.org/10.3390/nano10102089
Silva S, Marto J, Gonçalves L, Almeida AJ, Vale N. Formulation, Characterization and Evaluation against SH-SY5Y Cells of New Tacrine and Tacrine-MAP Loaded with Lipid Nanoparticles. Nanomaterials. 2020; 10(10):2089. https://doi.org/10.3390/nano10102089
Chicago/Turabian StyleSilva, Sara, Joana Marto, Lídia Gonçalves, António J. Almeida, and Nuno Vale. 2020. "Formulation, Characterization and Evaluation against SH-SY5Y Cells of New Tacrine and Tacrine-MAP Loaded with Lipid Nanoparticles" Nanomaterials 10, no. 10: 2089. https://doi.org/10.3390/nano10102089