Tracing Cognitive Processes in Insight Problem Solving: Using GAMs and Change Point Analysis to Uncover Restructuring


Abstract
:1. Introduction
1.1. Temporal Dynamics of the Restructuring Process
1.2. Eye Movements and Matchstick Arithmetic Problems
1.3. Metacognitive Processes and Insight Problems
2. Methods
3. Results
3.1. Is Insight Sudden or Incremental? (Solvers vs. Non-Solvers: First 5 Min Analysis)
3.2. Do Explicit Cues Rearrange Attentional Distribution? (An Immediate Change after the Hint)
3.3. Does Metacognition Influence Insight Problem Solving? (Solvers vs. Non-Solvers after the Hint)
4. Discussion
5. Conclusions
Supplementary Materials
Author Contributions
Funding
Institutional Review Board Statement
Informed Consent Statement
Data Availability Statement
Acknowledgments
Conflicts of Interest
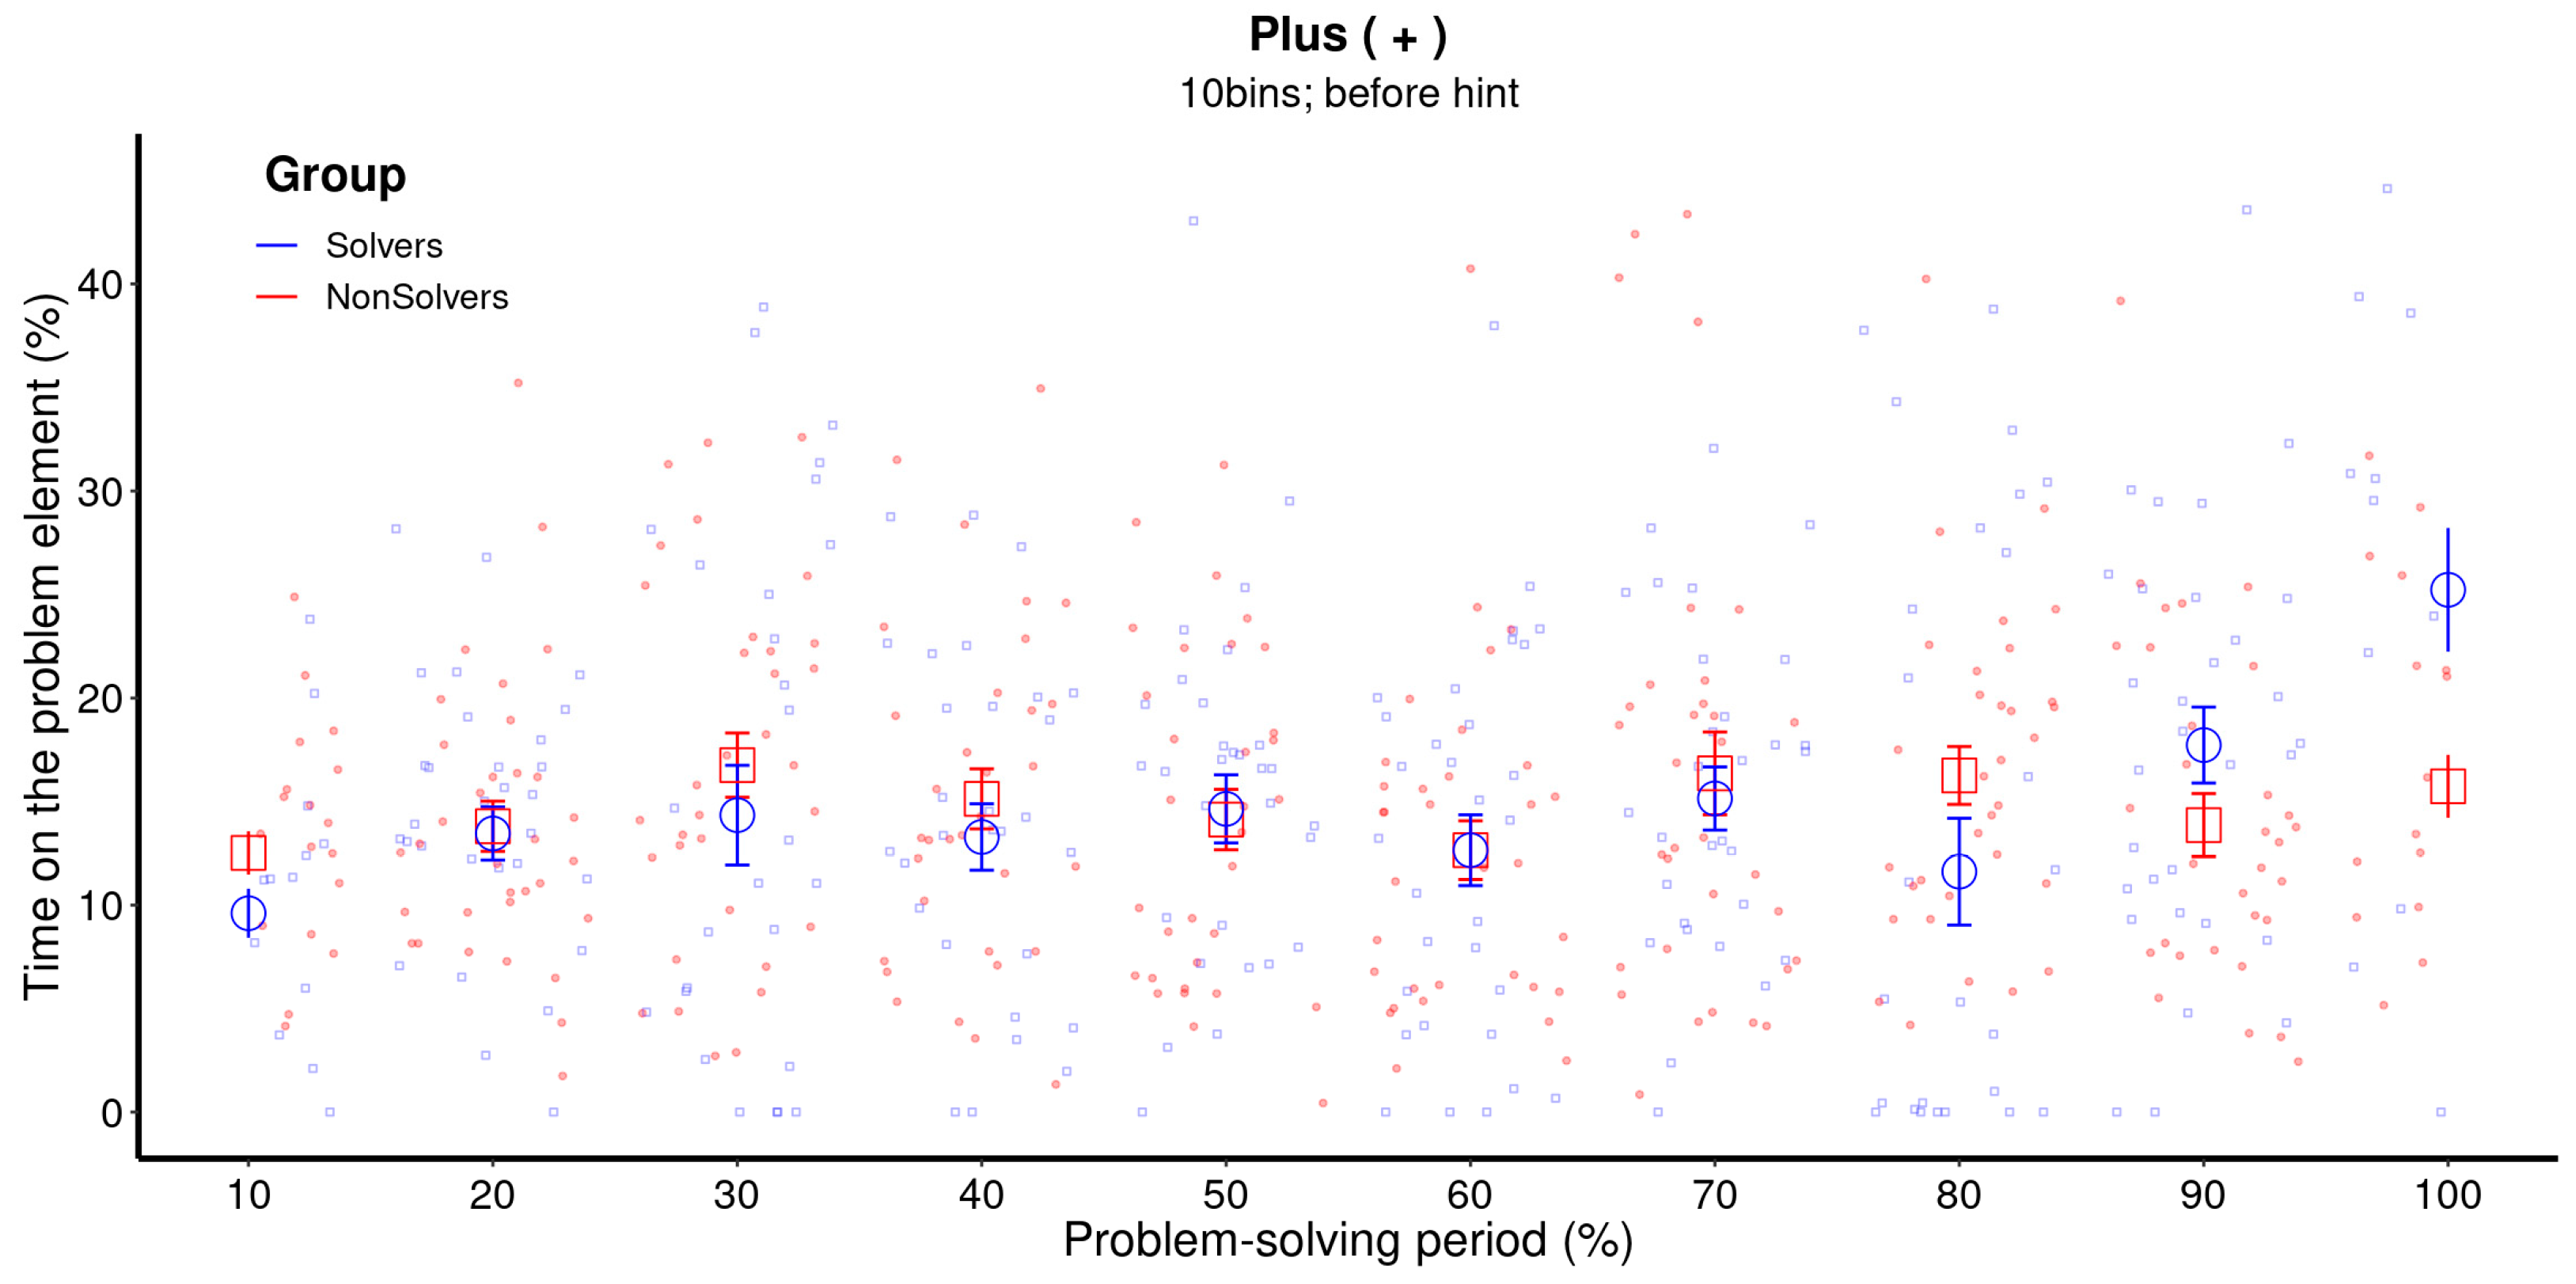
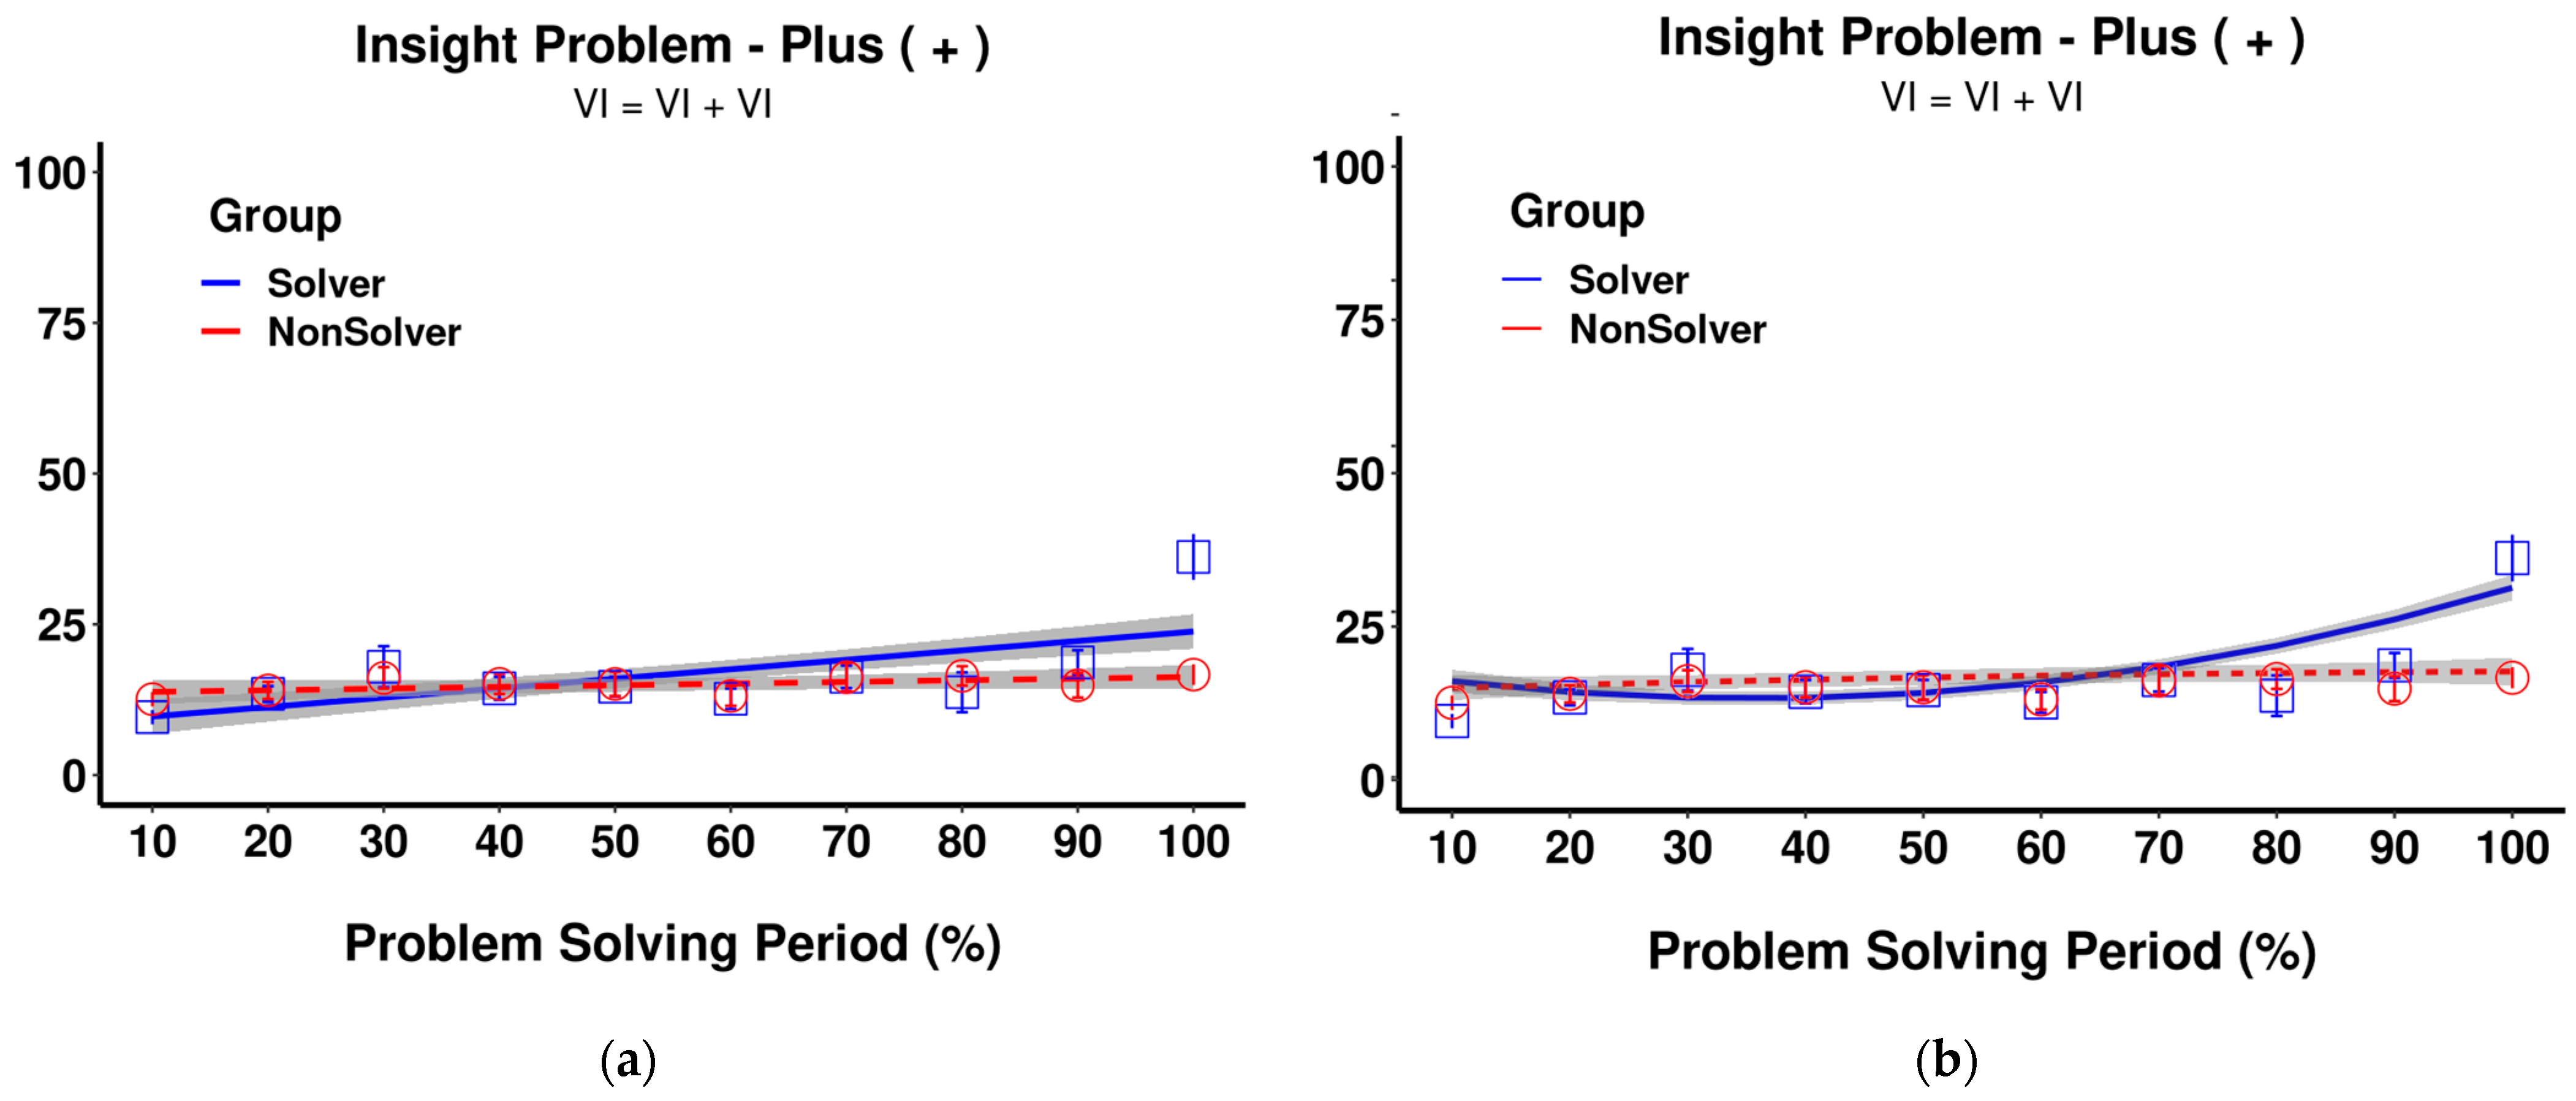
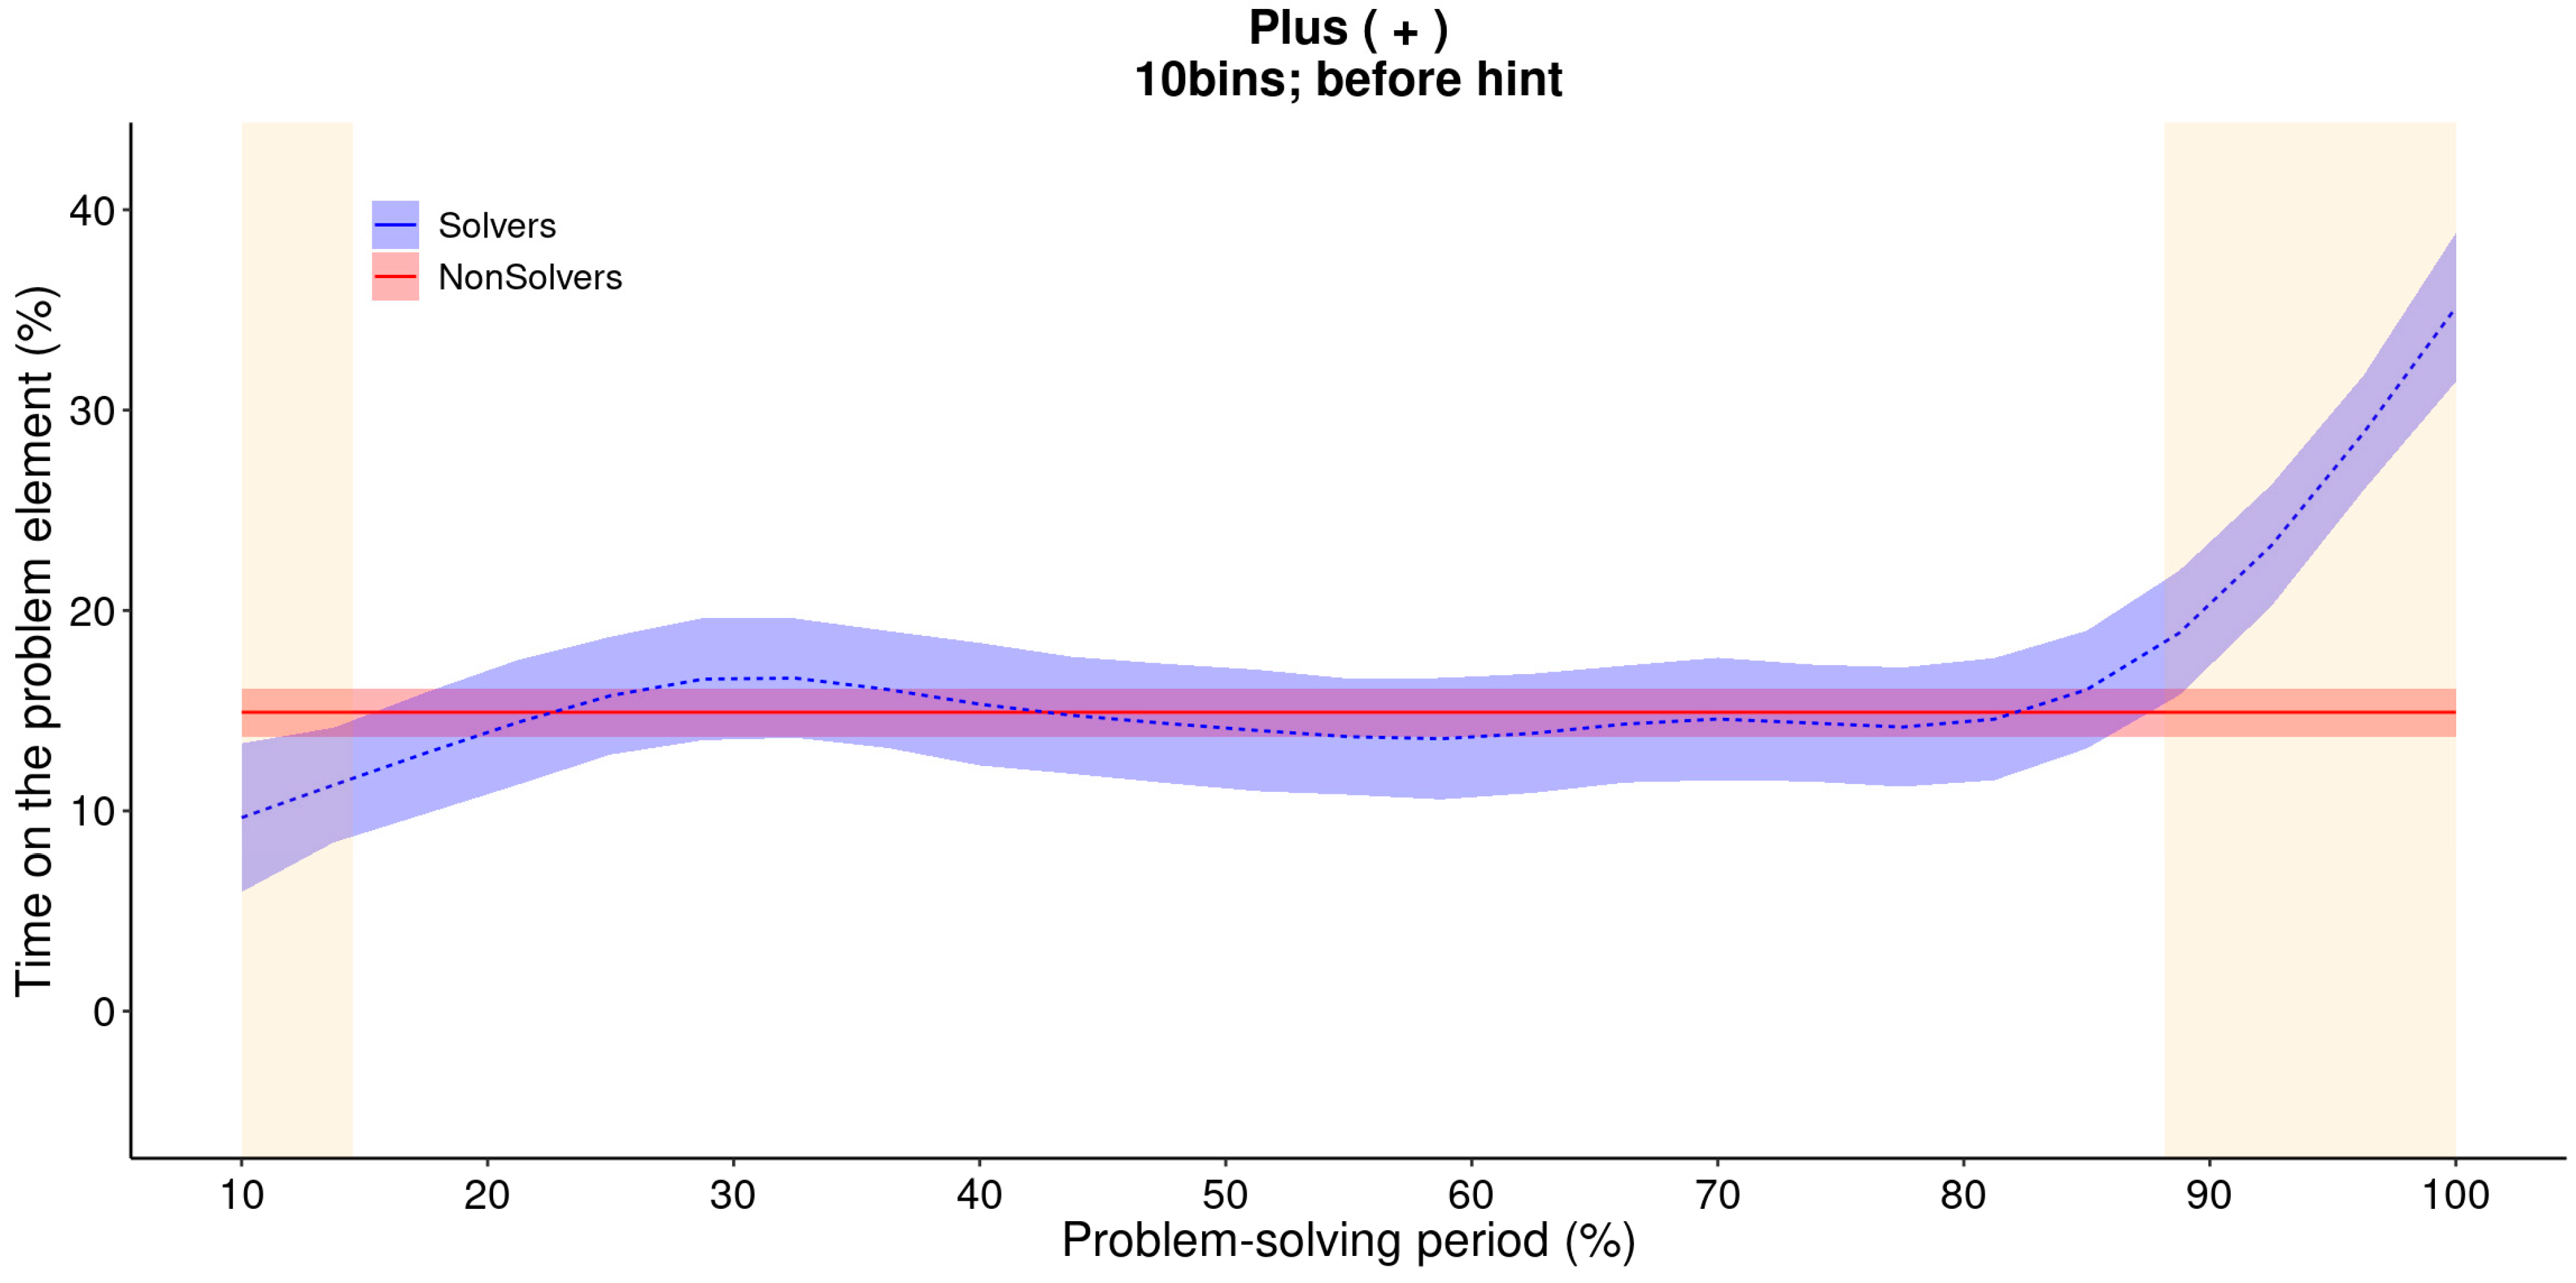
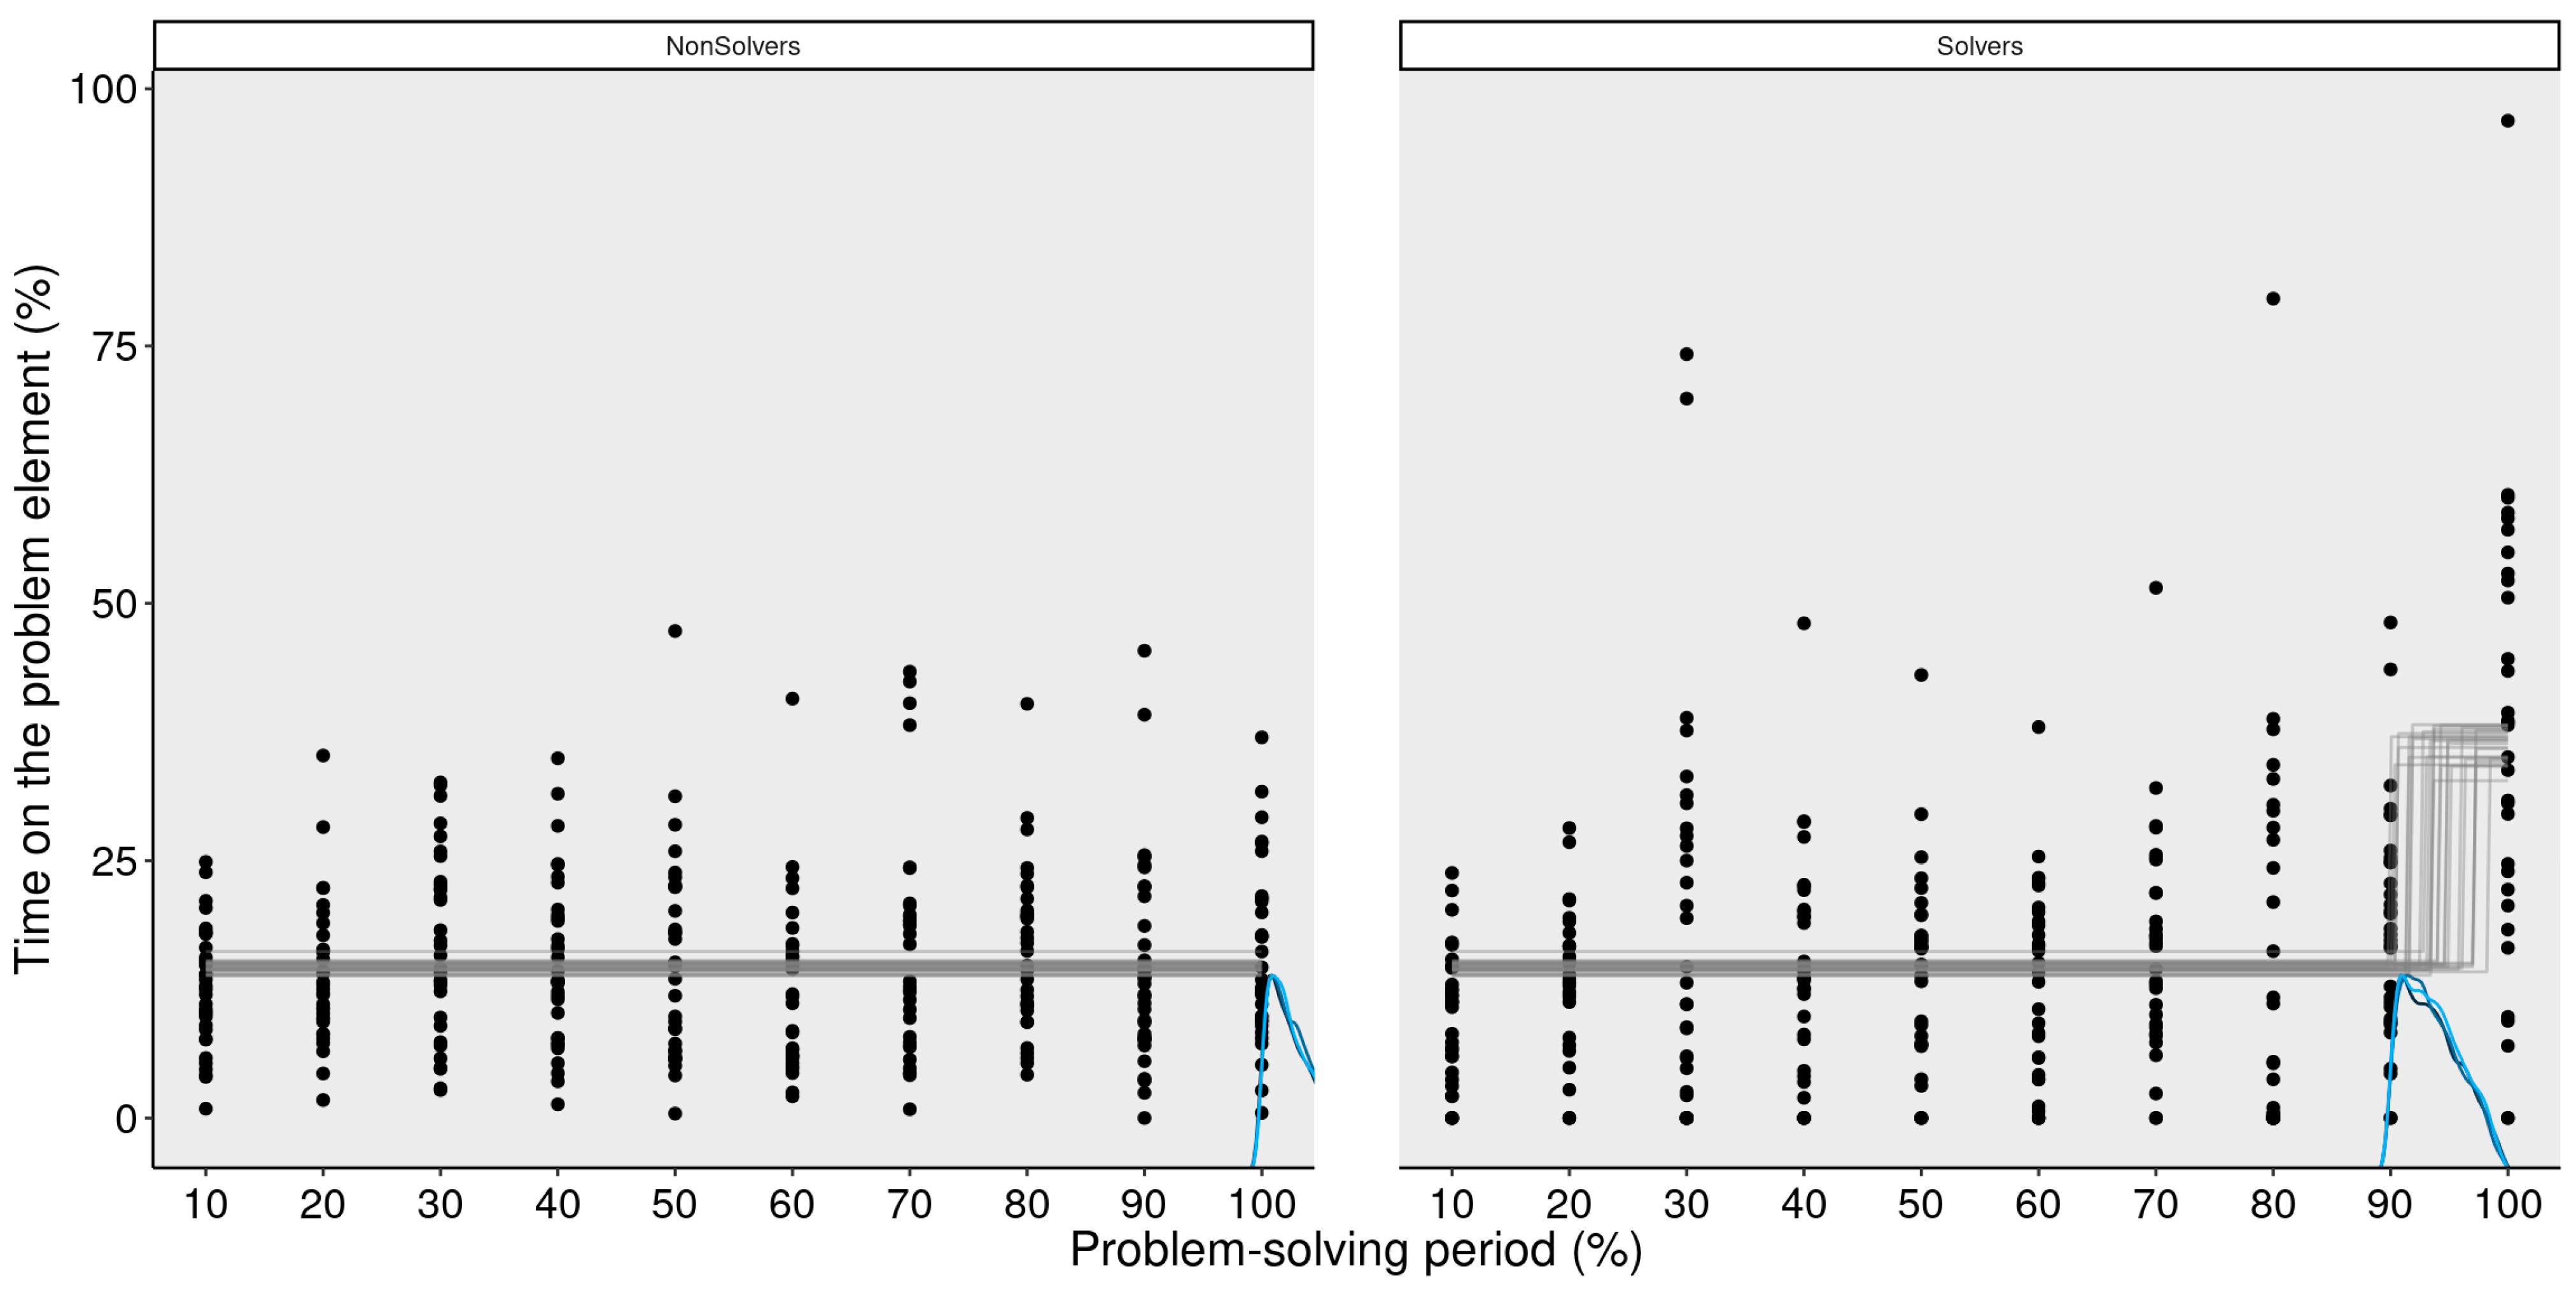
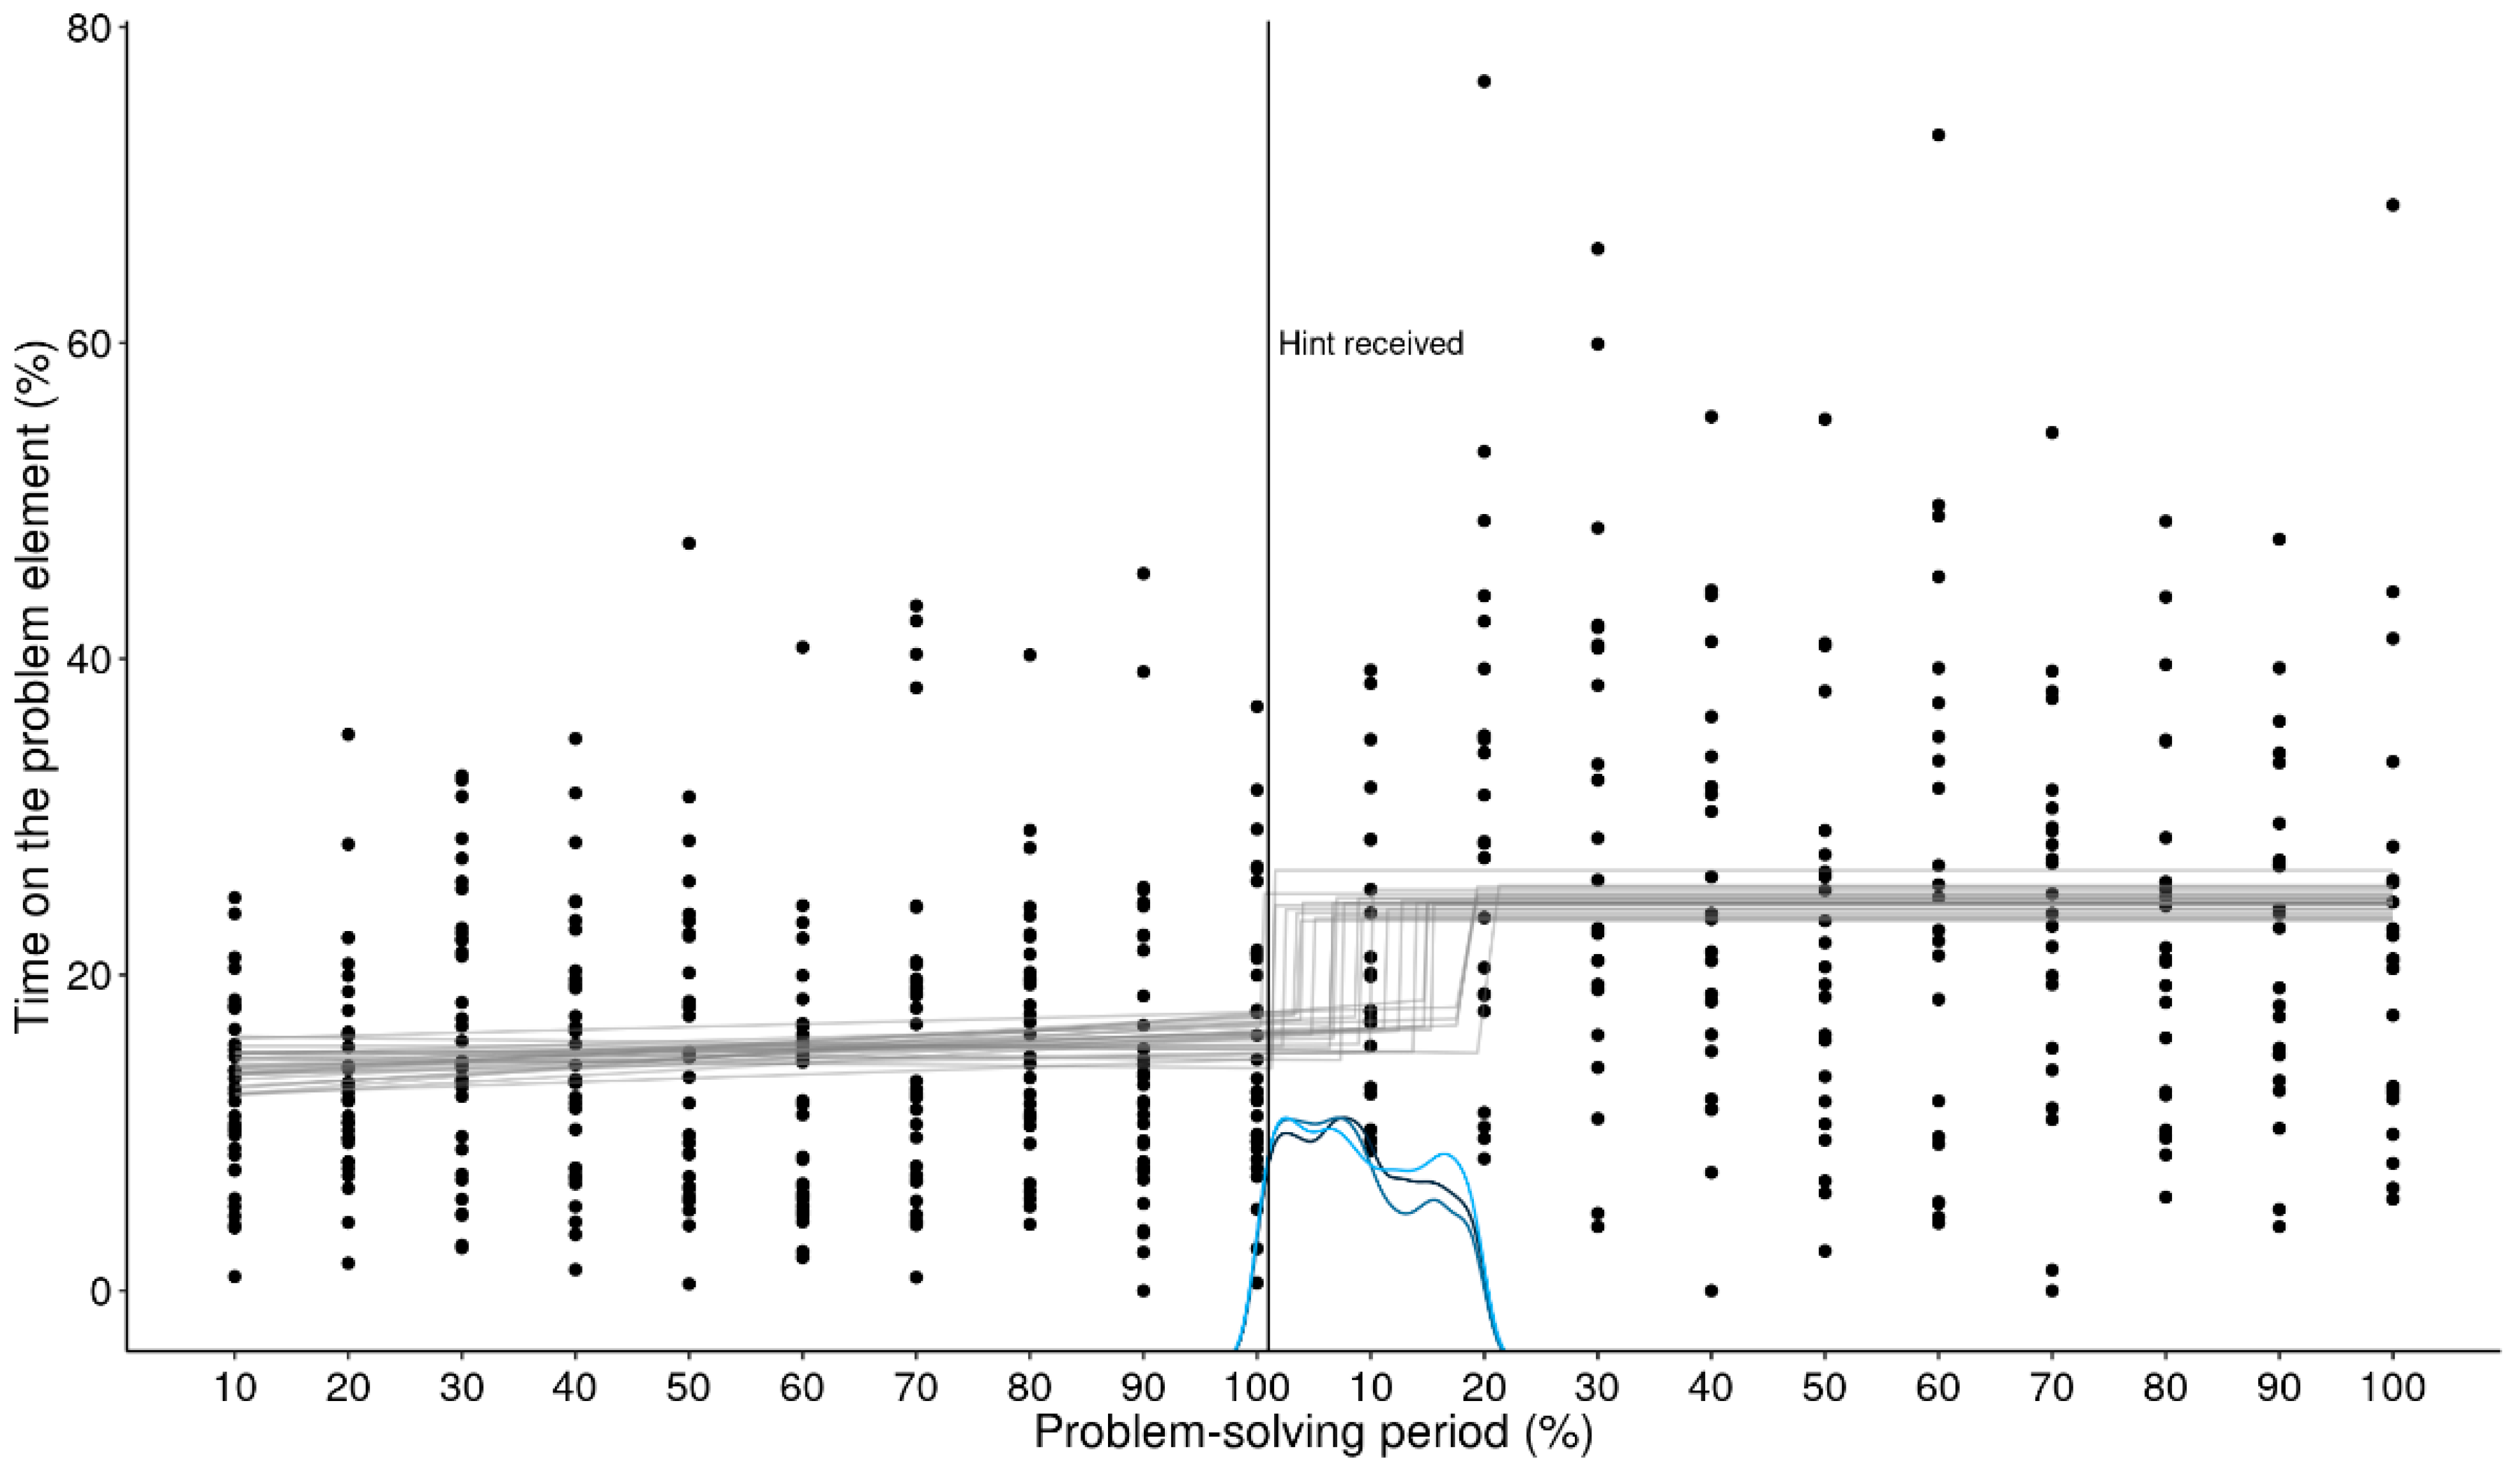
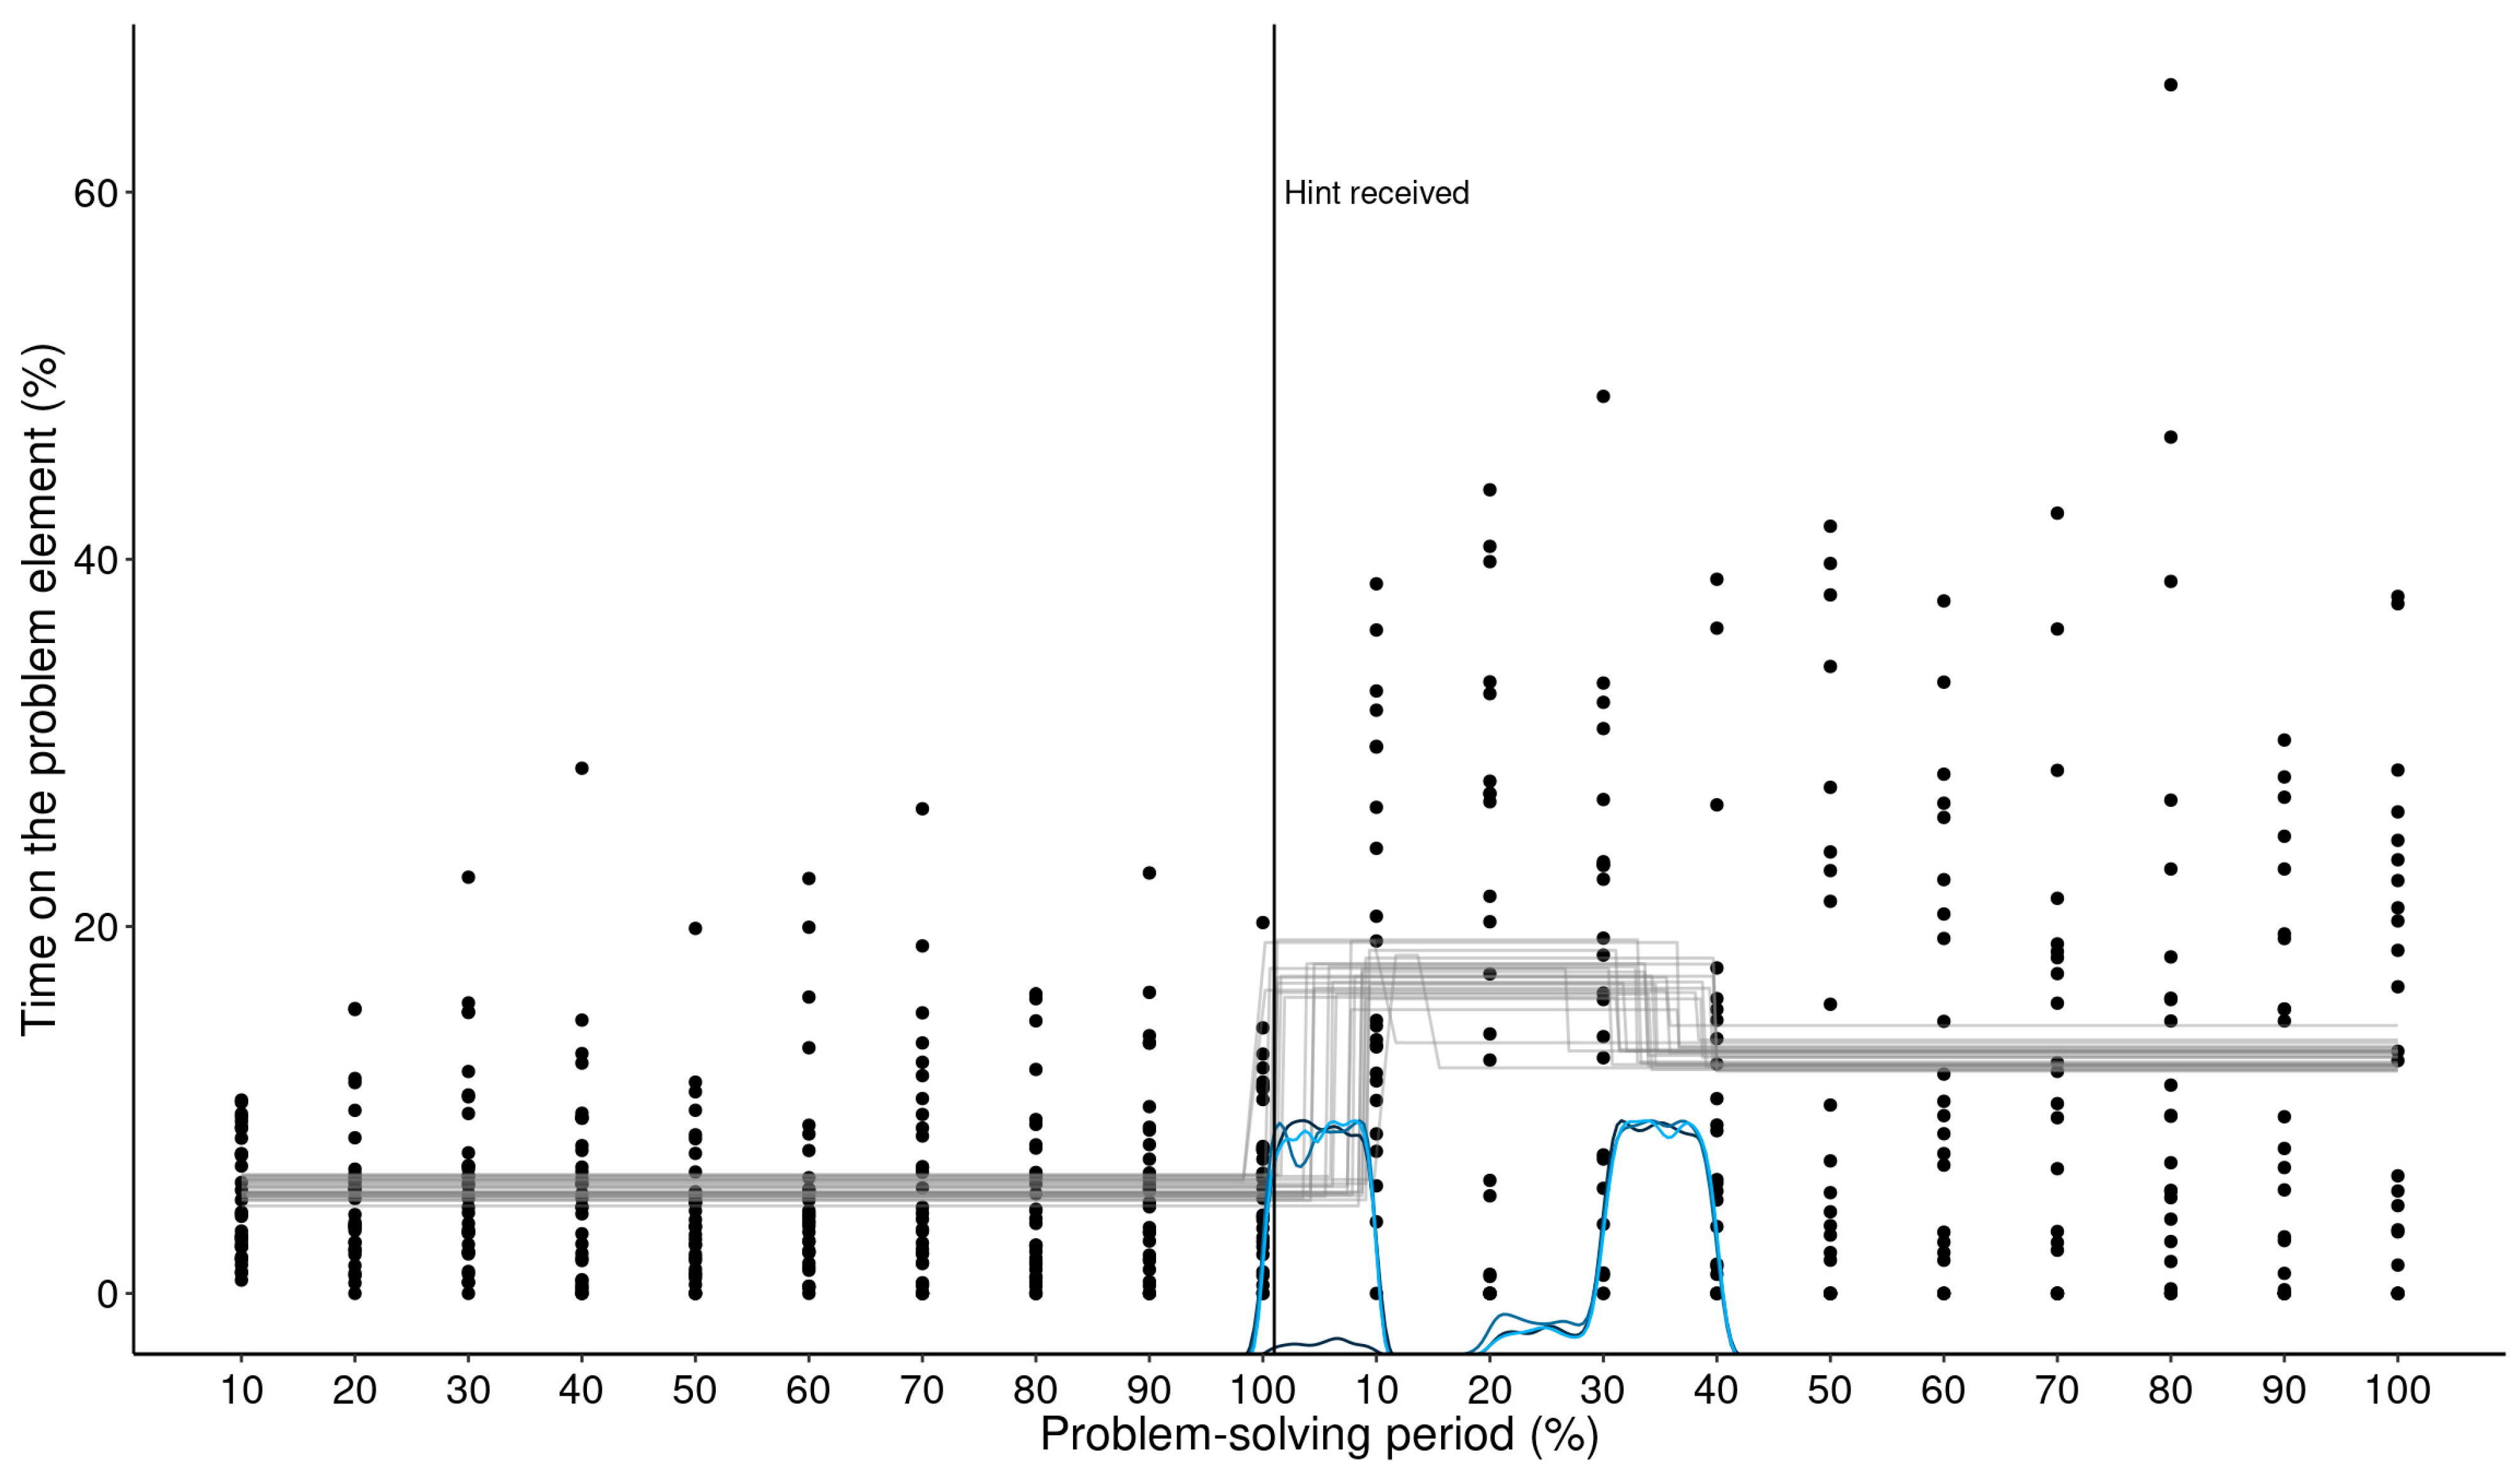
| 1 | The length of time taken to solve (or not solve) a problem is different from person to person, meaning that one cannot compare the eye tracking data directly between people. For example, some may need only 45 s to solve the problem, whereas others need four minutes to find a solution. In consequence, the data must be transformed in order to be able to compare the data between people properly. While the problem-solving period can be extended by adding more time phases, it is important to note that the duration should not be prolonged beyond a certain point. Utilizing too many time frames may leave too little data (e.g., a 10-second trial should not be divided into 100 bins, as each bin will have the duration of only 100 ms). This can lead to distorted eye movement patterns, masking the underlying effects present before the data were binned. On the other hand, choosing too few bins may not capture the full temporal dynamics of the problem-solving process. In either case, ANOVA is not suitable for analyzing a large number of problem-solving periods, unlike GAM and multiple change point analysis, which can easily accommodate a large number of time frames. MCP analysis is another adequate tool for this type of analysis as it can capture the shift of attention. However, in contrast to GAMs, one needs a priori knowledge about the number of change points and the form of the segments in between (Lindeløv 2020). |
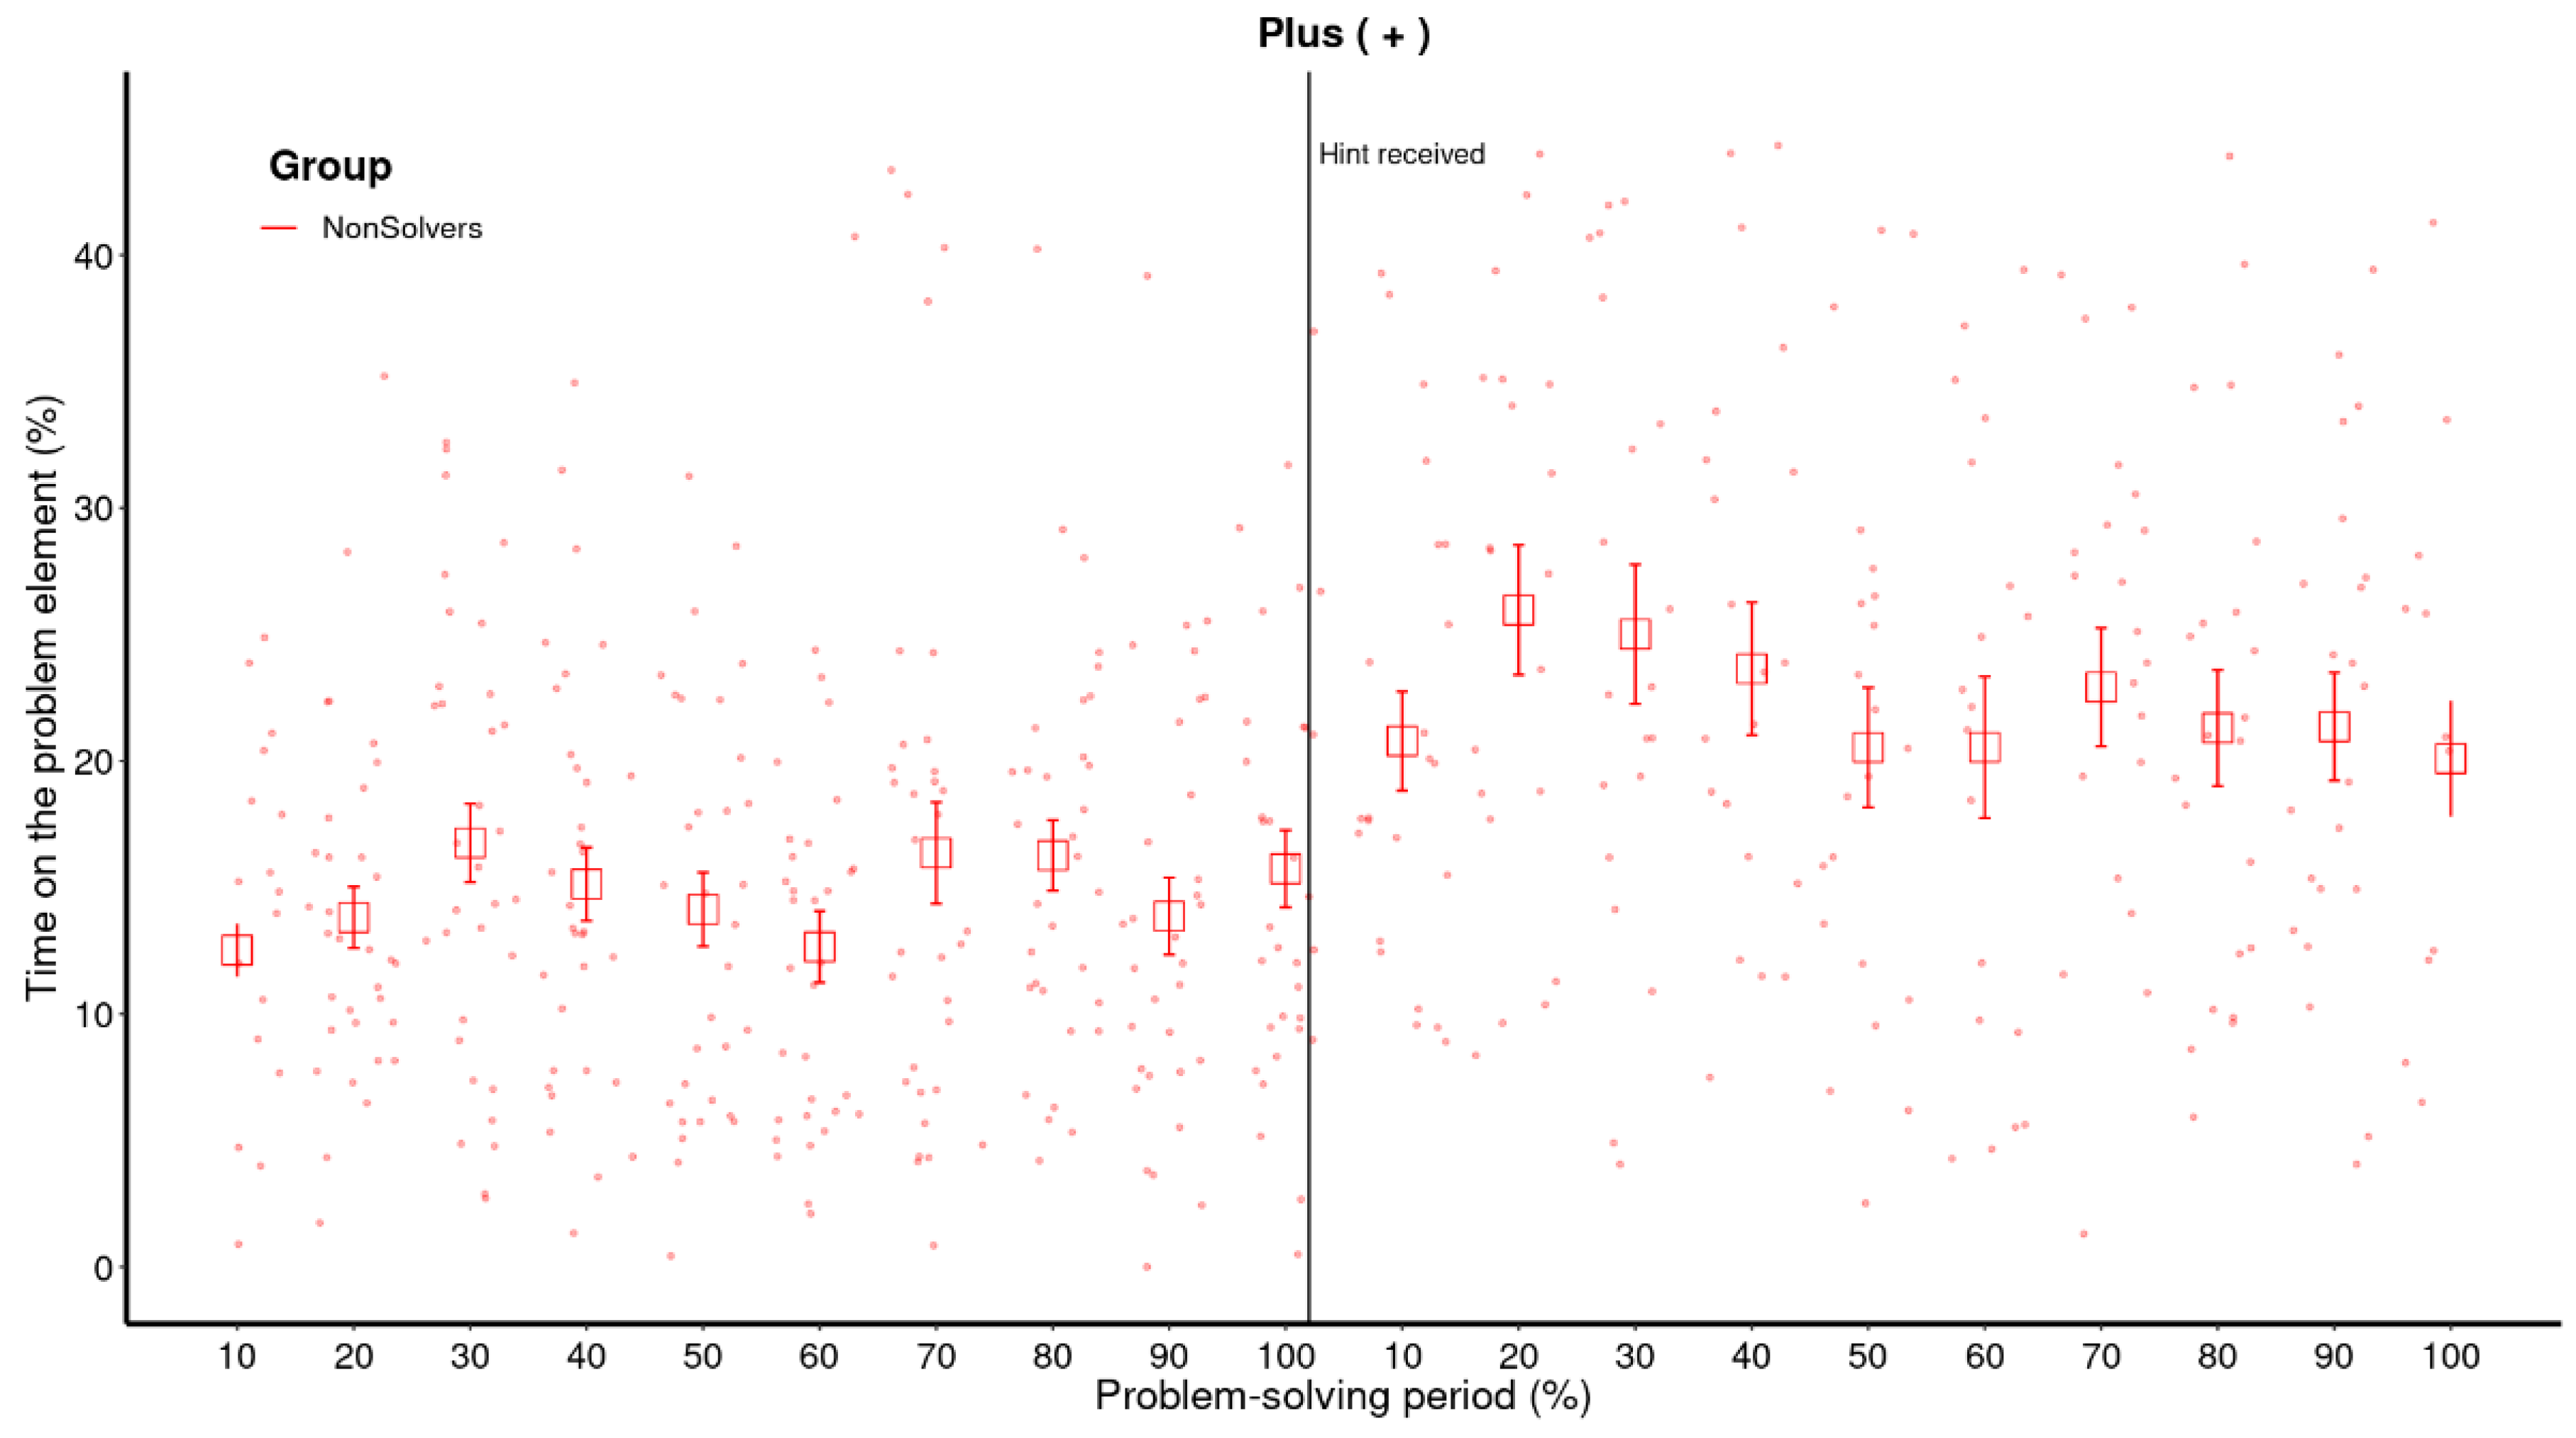
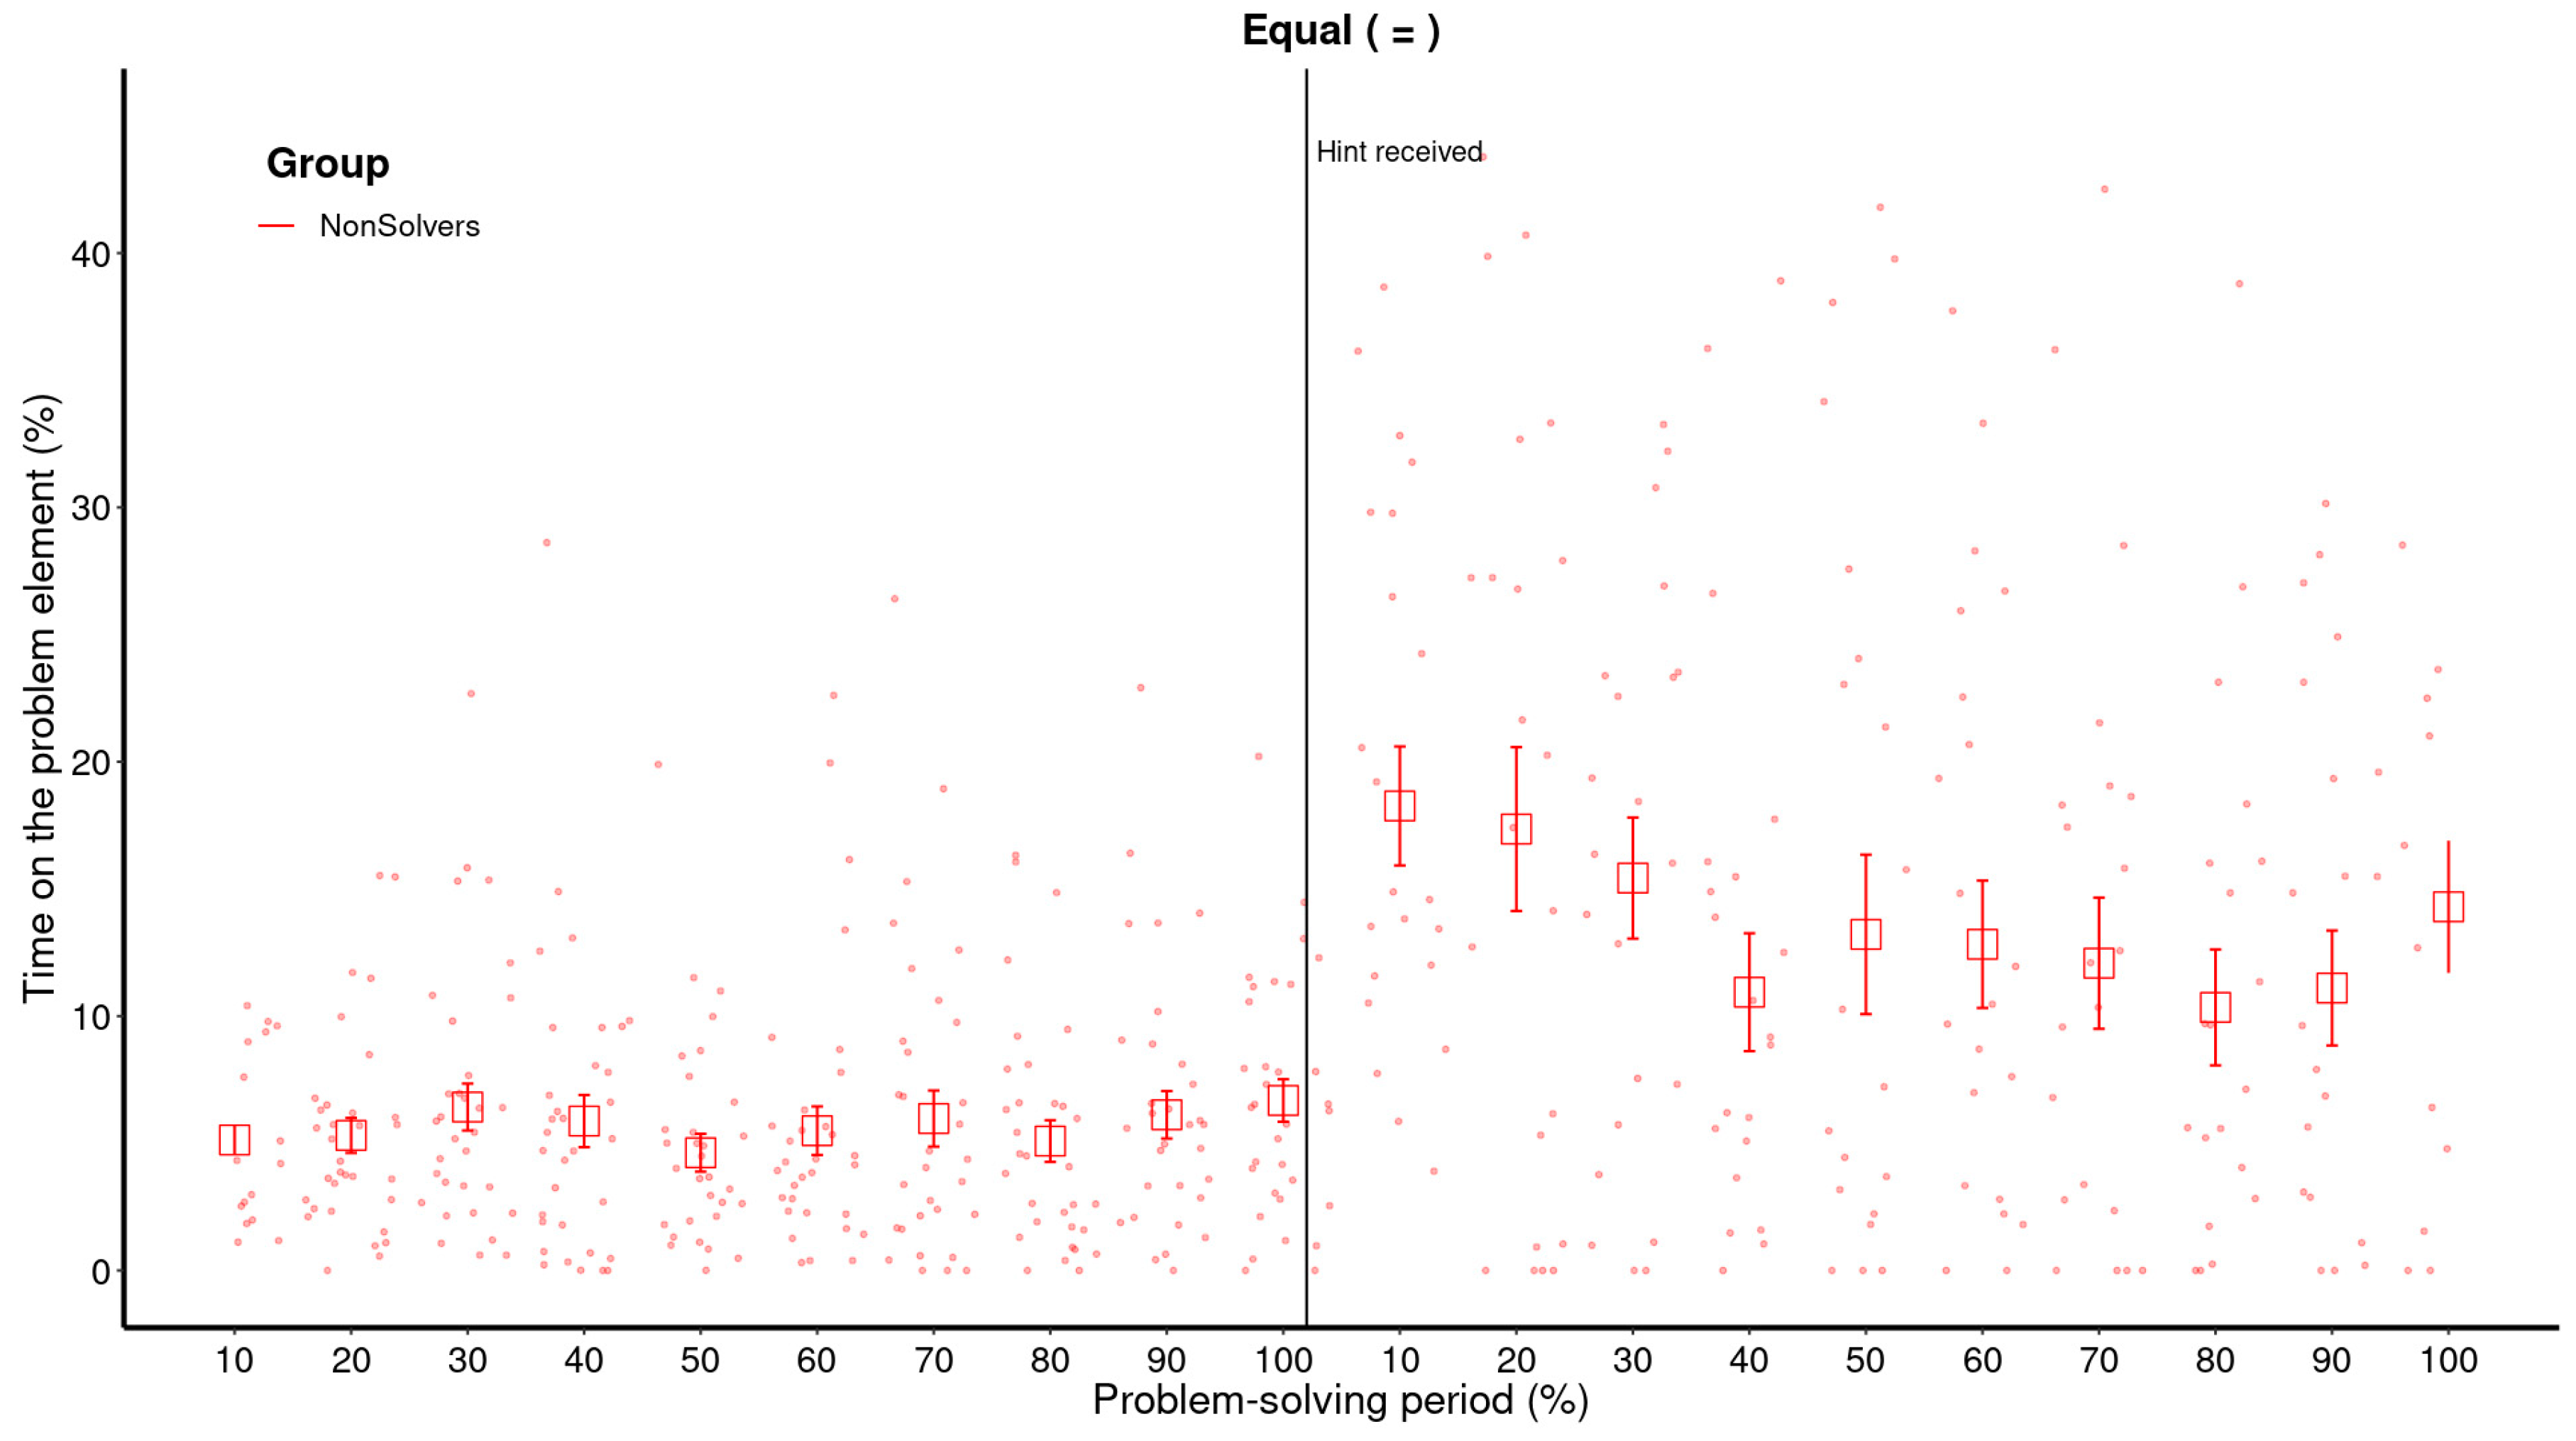
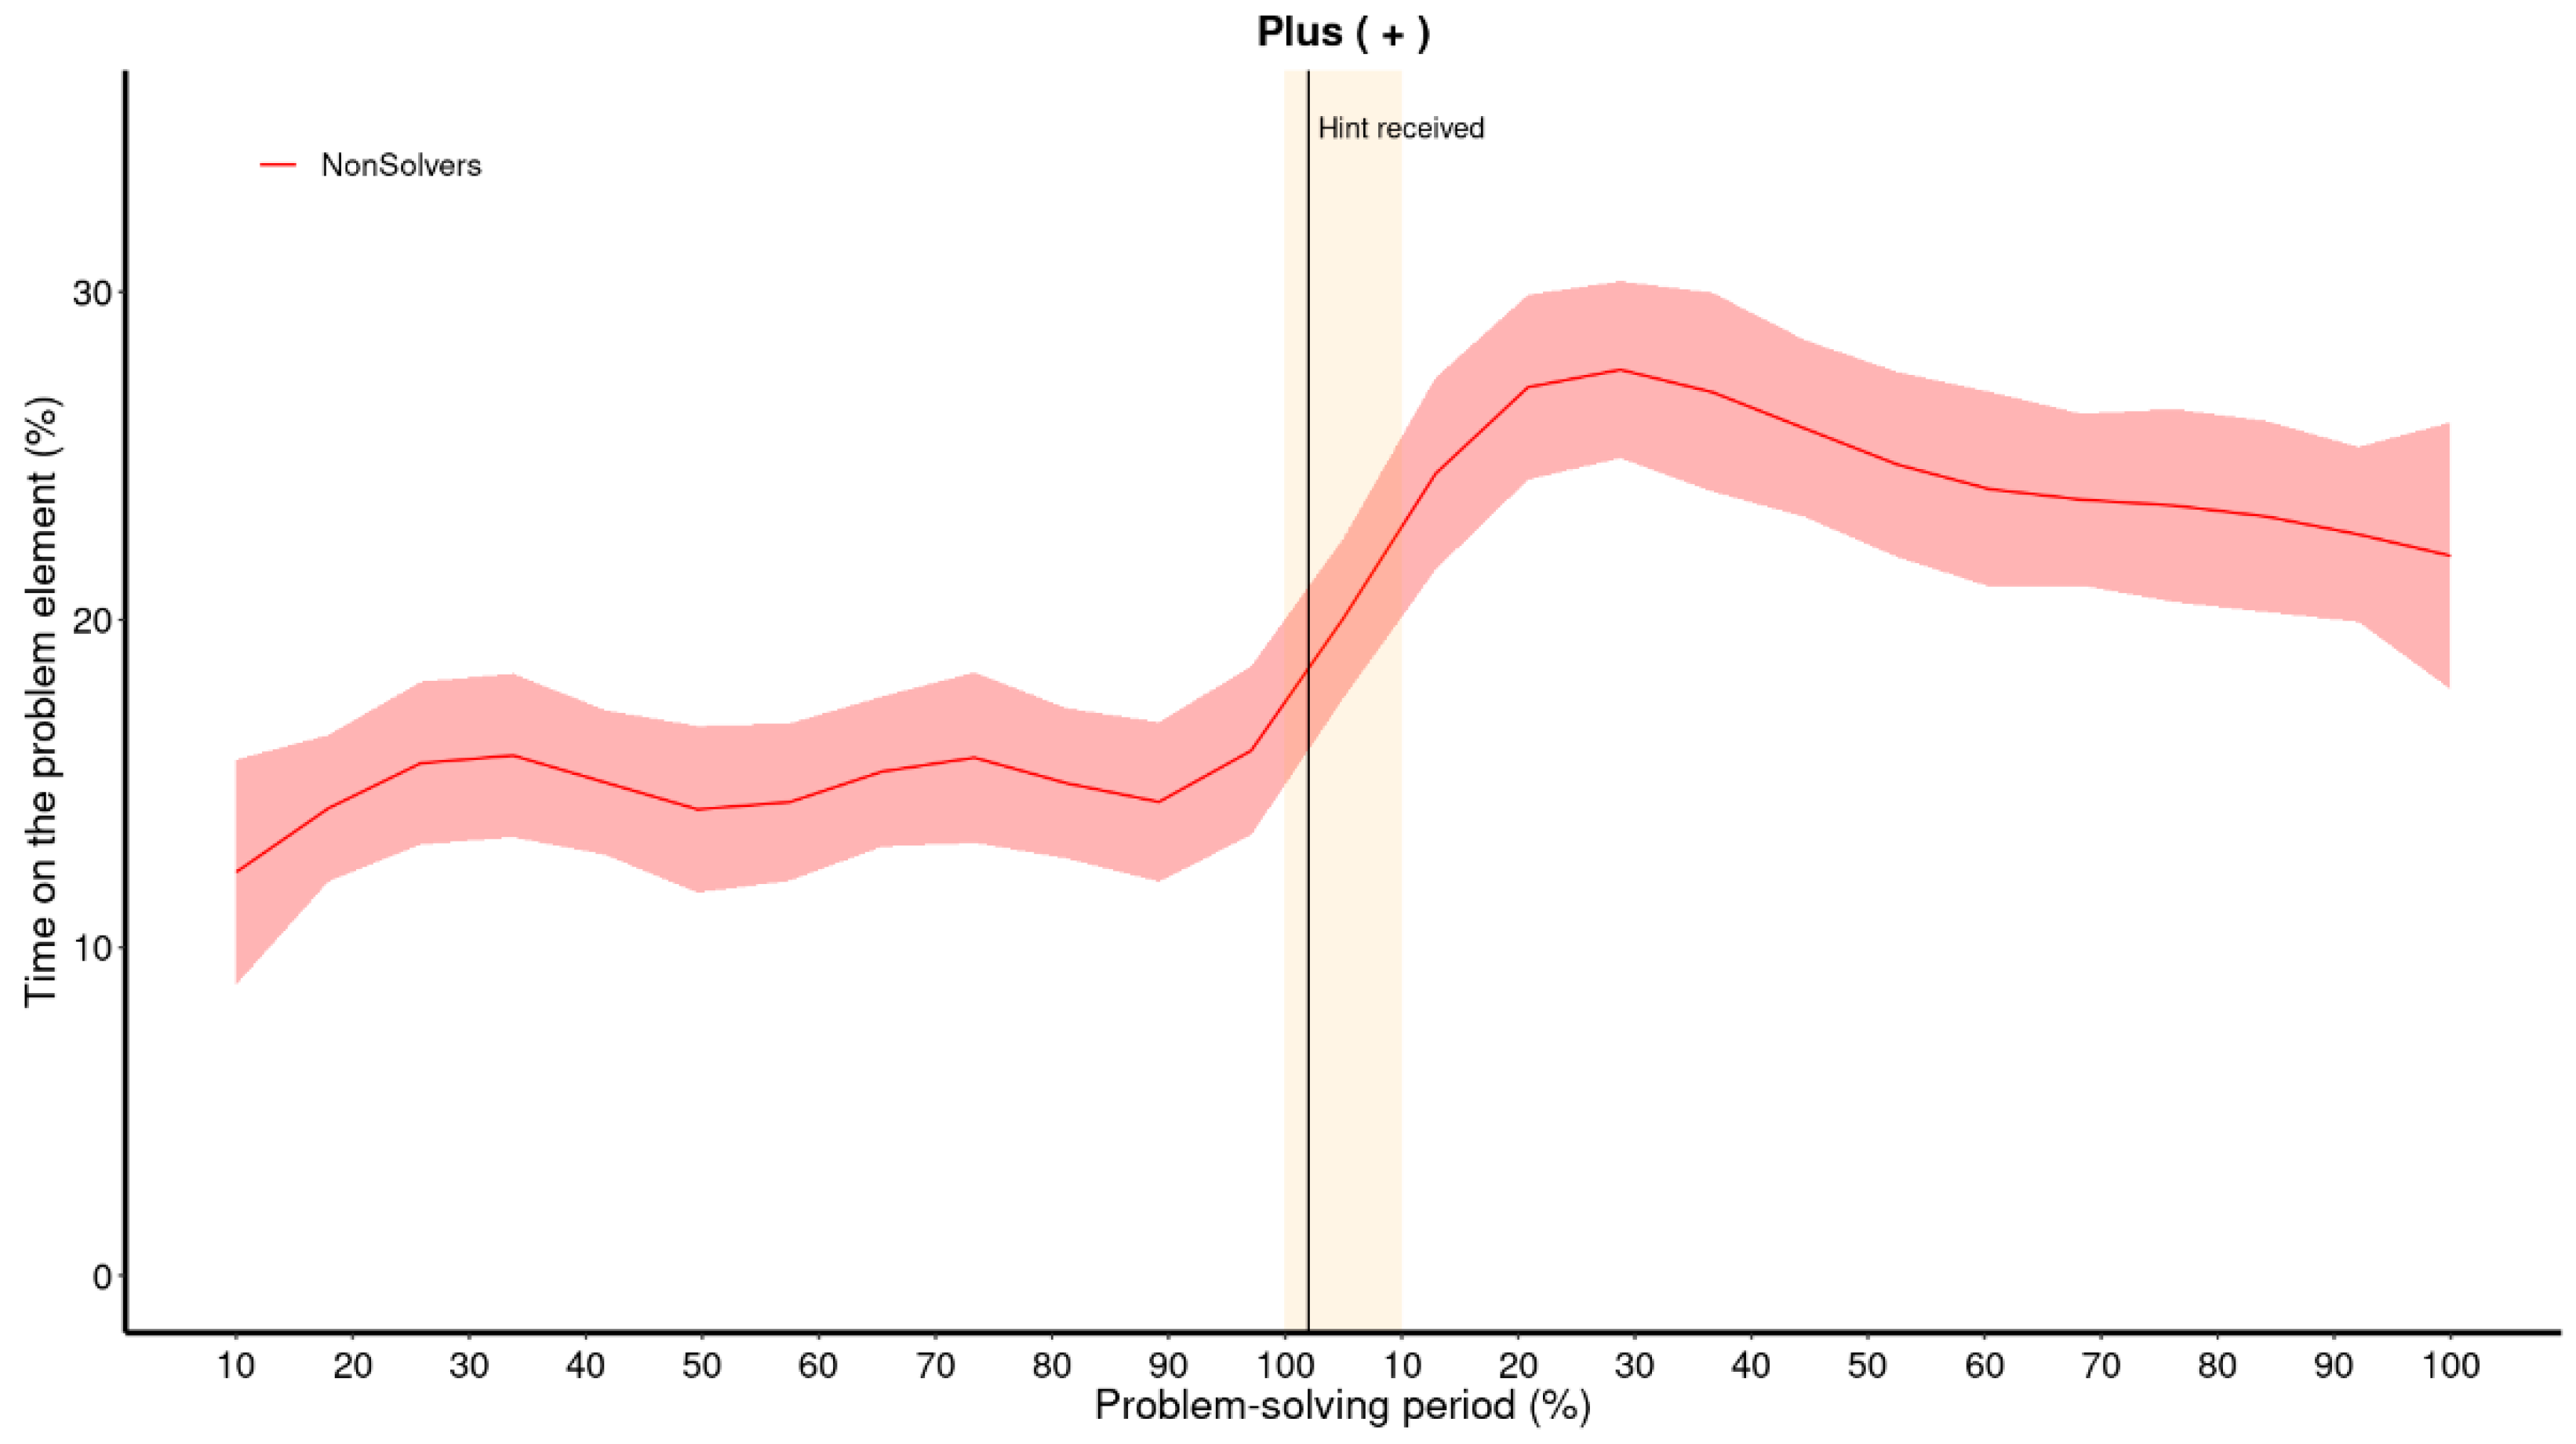
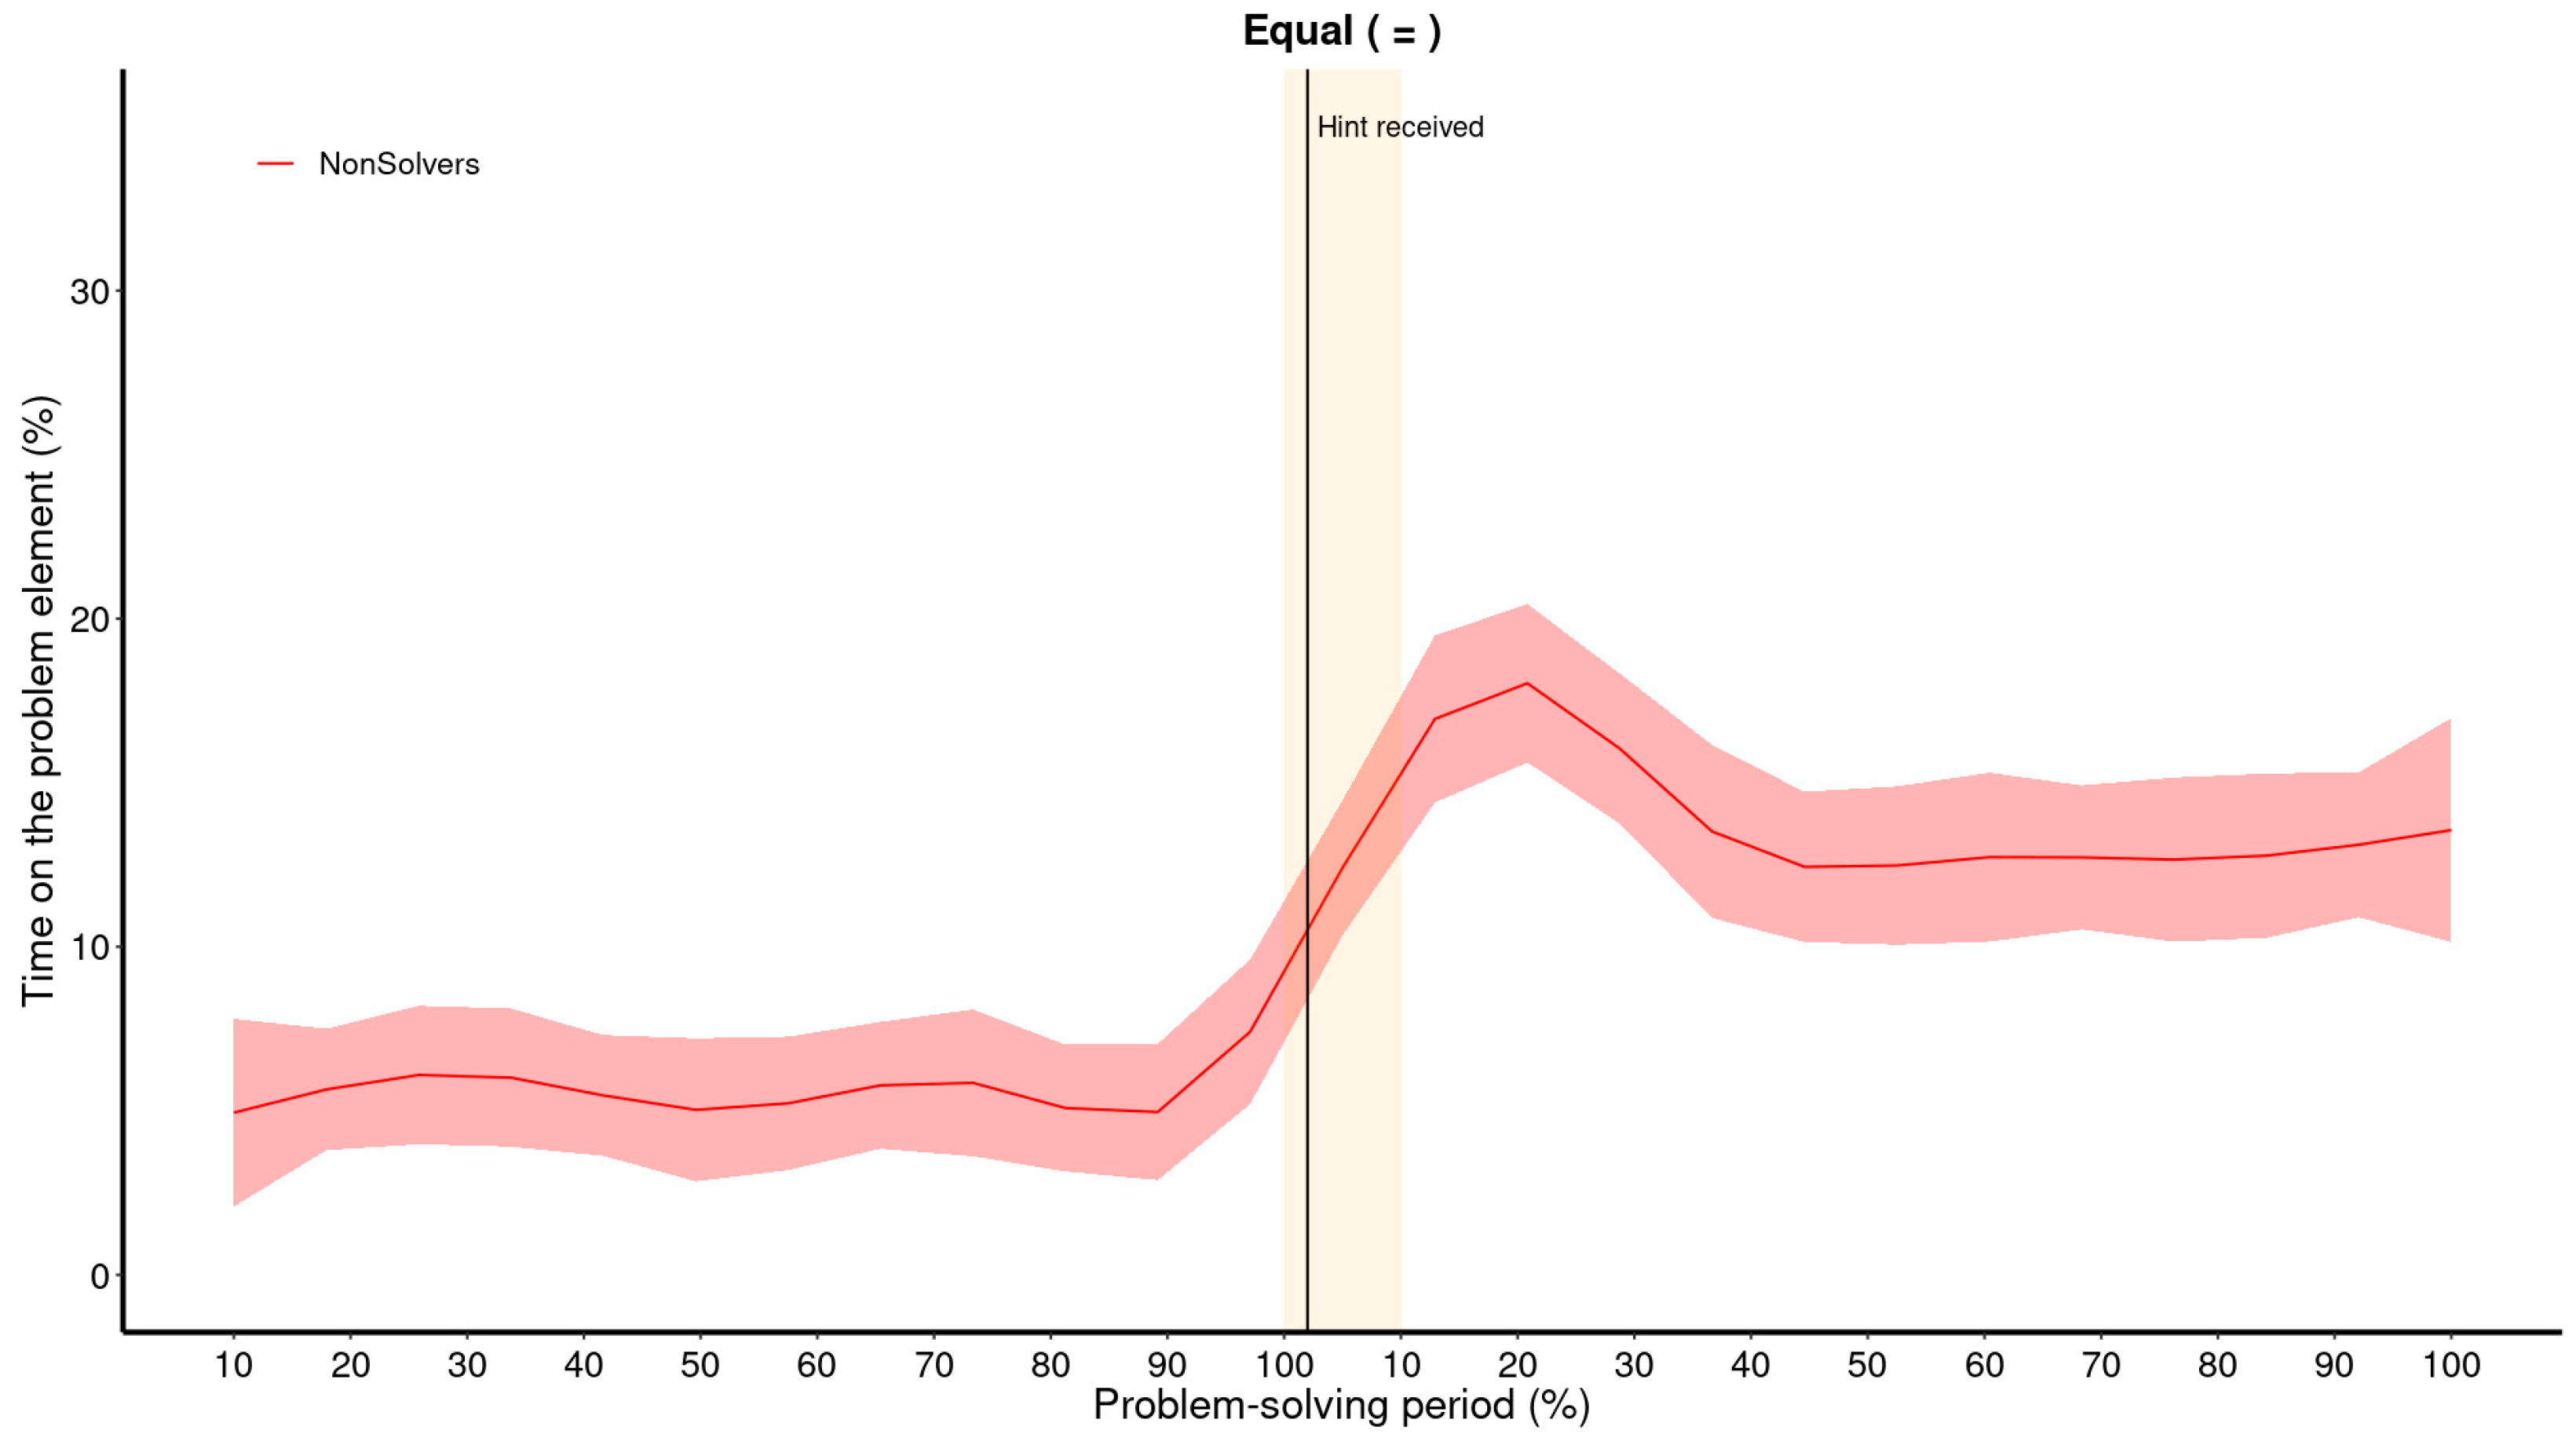
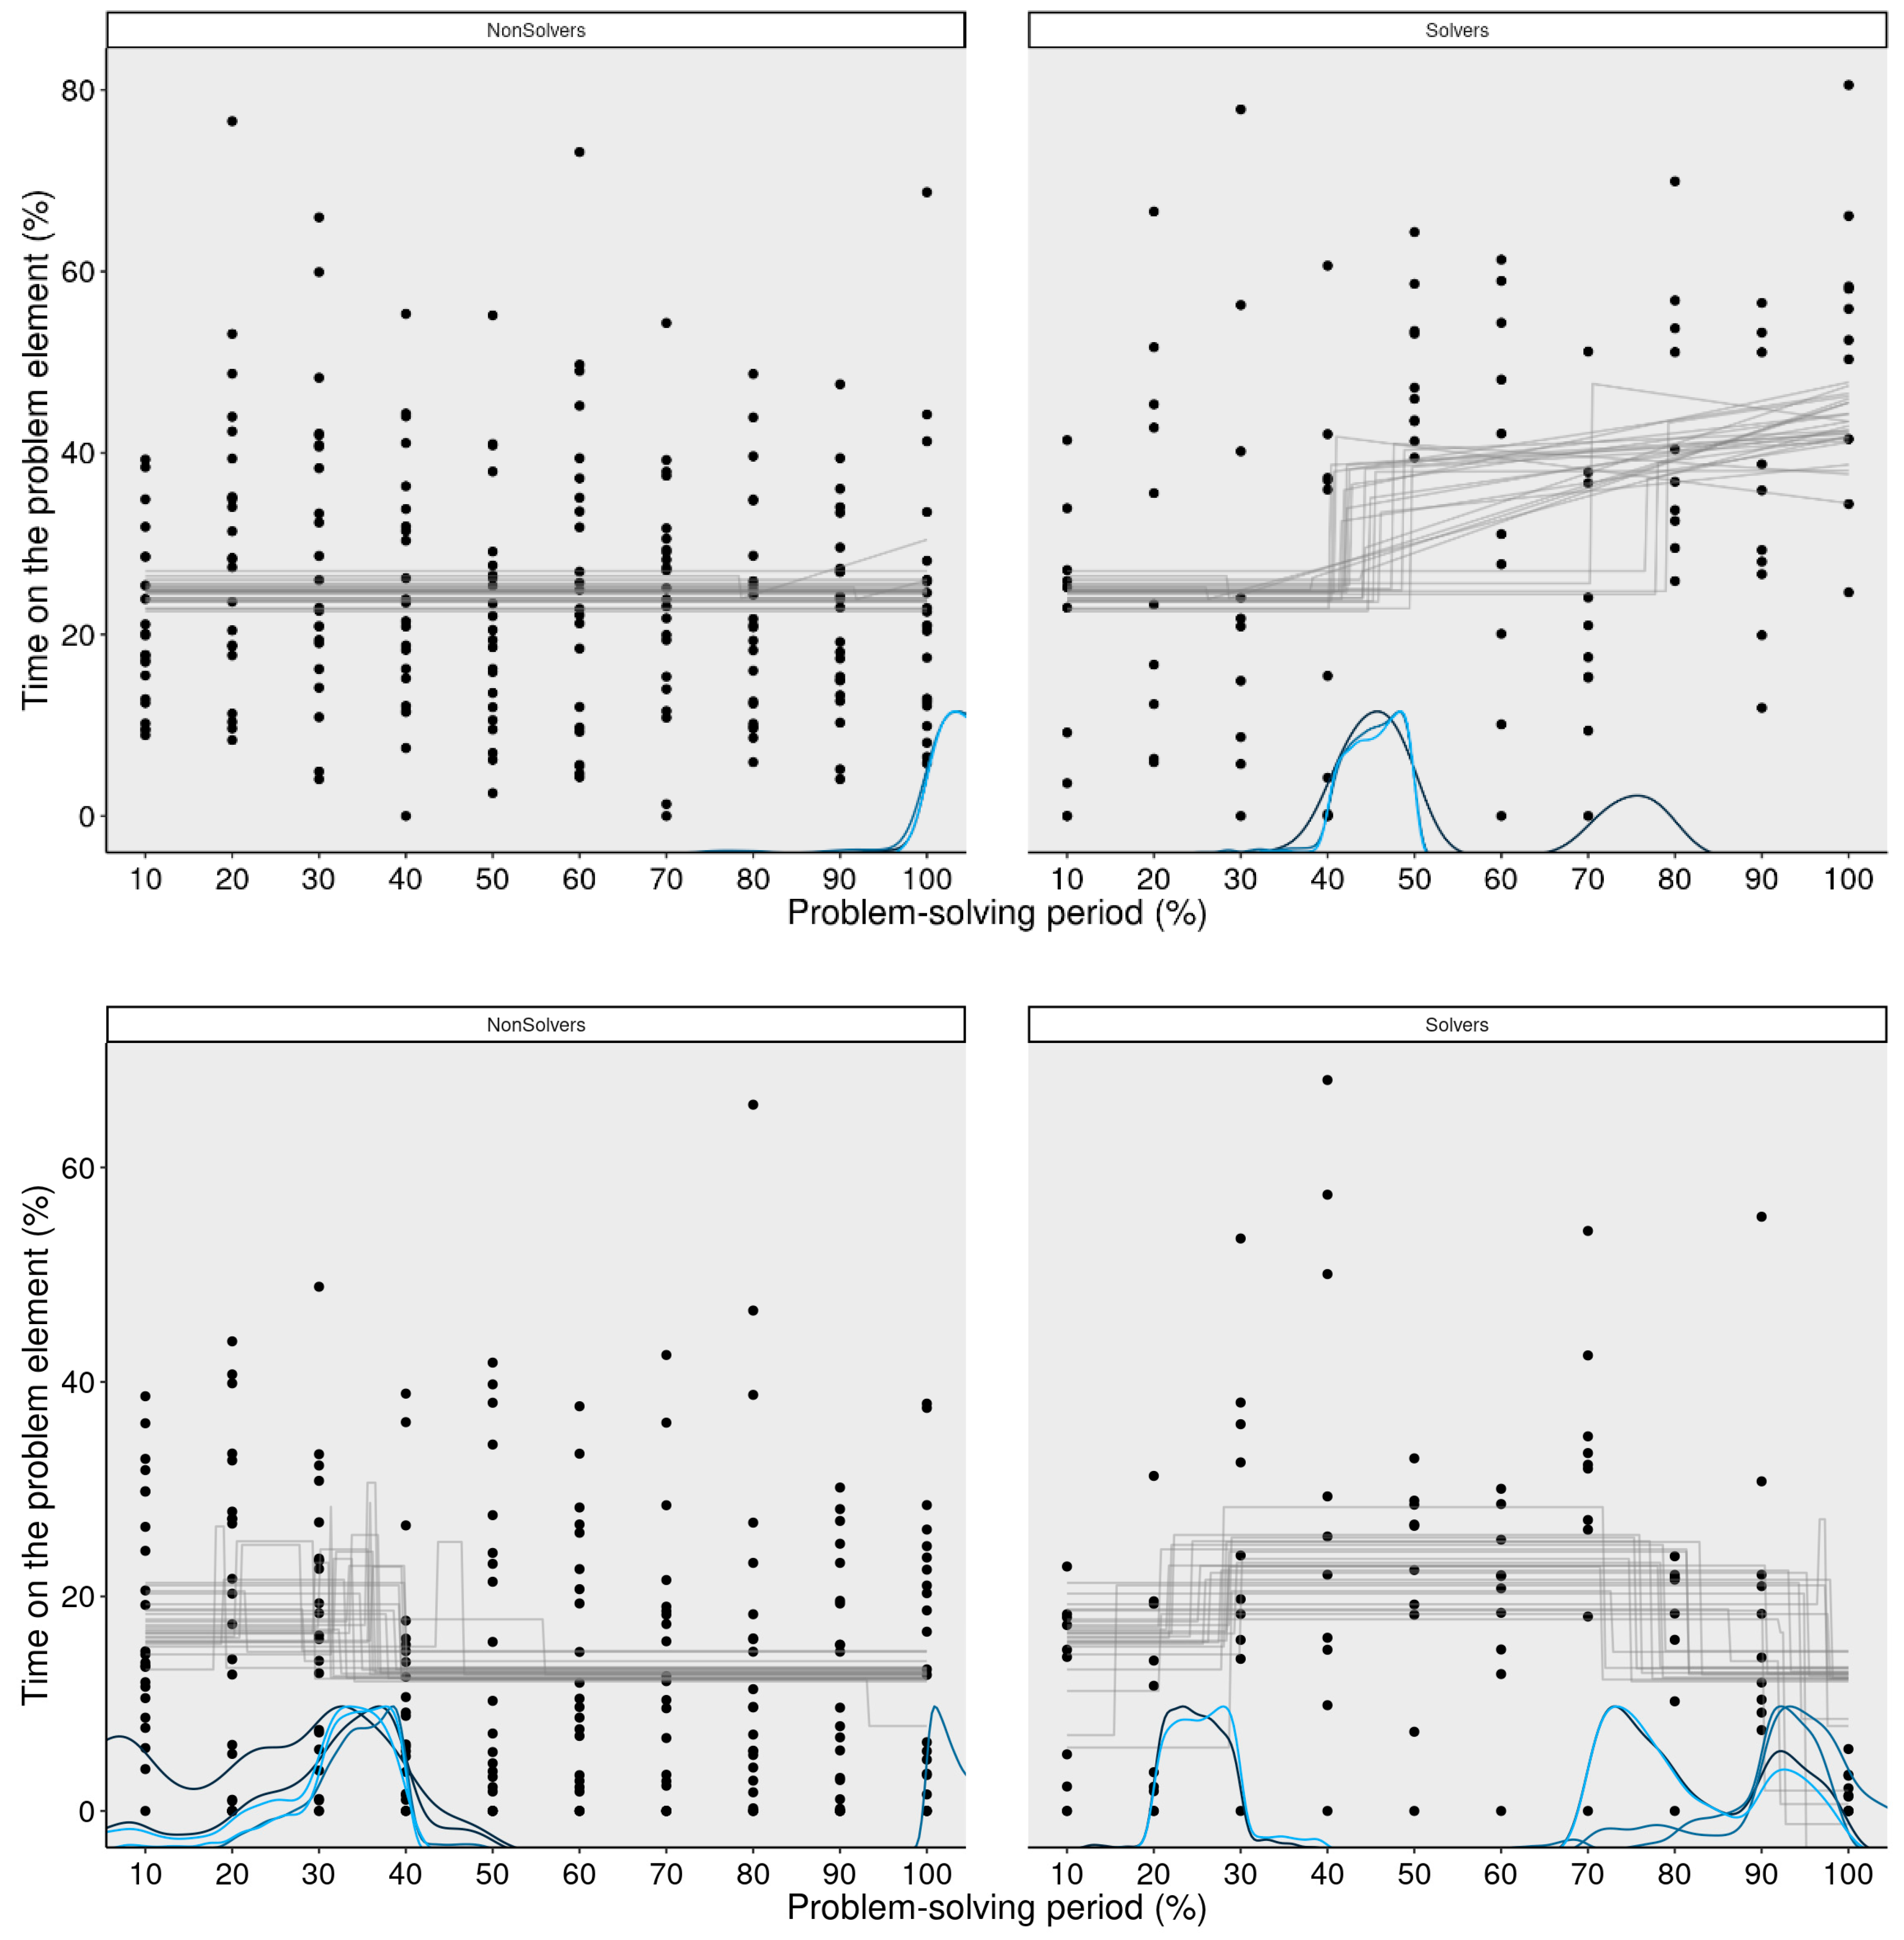
| 2 | Please note that the data presented here are simulated to represent a sudden shift, which is difficult to capture by classical analyses. The original data in Bilalić et al. (2019) indicate a gradual shift. |
References
- Ammalainen, Artur, and Nadezhda Moroshkina. 2021. The effect of true and false unreportable hints on anagram problem solving, restructuring, and the Aha!-experience. Journal of Cognitive Psychology 33: 644–58. [Google Scholar] [CrossRef]
- Ash, Ivan K., and Jennifer Wiley. 2006. The nature of restructuring in insight: An individual-differences approach. Psychonomic Bulletin & Review 13: 66–73. [Google Scholar]
- Ash, Ivan K., and Jennifer Wiley. 2008. Hindsight bias in insight and mathematical problem solving: Evidence of different reconstruction mechanisms for metacognitive versus situational judgments. Memory & Cognition 36: 822–37. [Google Scholar] [CrossRef]
- Ash, Ivan K., Benjamin Jee, and Jennifer Wiley. 2012. Investigating insight as sudden learning. The Journal of Problem Solving 4: 150–76. [Google Scholar] [CrossRef]
- Becker, Maxi, Simone Kühn, and Tobias Sommer. 2021. Verbal insight revisited—Dissociable neurocognitive processes underlying solutions accompanied by an AHA! experience with and without prior restructuring. Journal of Cognitive Psychology 33: 659–84. [Google Scholar] [CrossRef]
- Bilalić, Merim, and Peter McLeod. 2014. Why good thoughts block better ones. Scientific American 310: 74–79. [Google Scholar] [CrossRef]
- Bilalić, Merim, Peter McLeod, and Fernand Gobet. 2008. Why good thoughts block better ones: The mechanism of the pernicious Einstellung (set) effect. Cognition 108: 652–61. [Google Scholar] [CrossRef]
- Bilalić, Merim, Peter McLeod, and Fernand Gobet. 2010. The Mechanism of the Einstellung (Set) Effect: A Pervasive Source of Cognitive Bias. Current Directions in Psychological Science 19: 111–15. [Google Scholar] [CrossRef]
- Bilalić, Merim, Mario Graf, Nemanja Vaci, and Amory H. Danek. 2019. The temporal dynamics of insight problem solving–restructuring might not always be sudden. Thinking & Reasoning 27: 1–37. [Google Scholar]
- Blech, Christine, Robert Gaschler, and Merim Bilalić. 2020. Why do people fail to see simple solutions? Using think-aloud protocols to uncover the mechanism behind the Einstellung (mental set) effect. Thinking & Reasoning 26: 552–80. [Google Scholar]
- Bowden, Edward M. 1997. The effect of reportable and unreportable hints on anagram solution and the Aha! Experience. Consciousness and Cognition 6: 545–73. [Google Scholar] [CrossRef] [PubMed]
- Cushen, Patrick J., and Jennifer Wiley. 2012. Cues to solution, restructuring patterns, and reports of insight in creative problem solving. Consciousness and Cognition 21: 1166–75. [Google Scholar] [CrossRef] [PubMed]
- Danek, Amory H., and Joshua Wiley. 2020. What causes the insight memory advantage? Cognition 205: 104411. [Google Scholar] [CrossRef]
- Danek, Amory H., Joshua Williams, and Jennifer Wiley. 2020. Closing the gap: Connecting sudden representational change to the subjective Aha! experience in insightful problem solving. Psychological Research 84: 111–19. [Google Scholar] [CrossRef] [PubMed]
- Duncker, Karl. 1945. On problem-solving. Psychological Monographs 58: 270. [Google Scholar] [CrossRef]
- Durso, Francis T., Cornelia B. Rea, and Tom Dayton. 1994. Graph-theoretic confirmation of restructuring during insight. Psychological Science 5: 94–97. [Google Scholar] [CrossRef]
- Ellis, Jessica J., and Eyal M. Reingold. 2014. The Einstellung effect in anagram problem solving: Evidence from eye movements. Frontiers in Psychology 5: 679. [Google Scholar] [CrossRef]
- Ellis, Jessica J., Mackenzie G. Glaholt, and Eyal M. Reingold. 2011. Eye movements reveal solution knowledge prior to insight. Consciousness and Cognition 20: 768–76. [Google Scholar] [CrossRef] [PubMed]
- Fedor, Anna, Eörs Szathmáry, and Michael Öllinger. 2015. Problem solving stages in the five square problem. Frontiers in Psychology 6: 1050. [Google Scholar] [CrossRef]
- Fleck, Jessica I., and Robert W. Weisberg. 2013. Insight versus analysis: Evidence for diverse methods in problem solving. Journal of Cognitive Psychology 25: 436–63. [Google Scholar] [CrossRef]
- Gilhooly, Ken J., Evie Fioratou, and N. Henretty. 2010. Verbalization and problem solving: Insight and spatial factors. British Journal of Psychology 101: 81–93. [Google Scholar] [CrossRef] [PubMed]
- Hedne, Mikael R., Elisabeth Norman, and Janet Metcalfe. 2016. Intuitive feelings of warmth and confidence in insight and noninsight problem solving of magic tricks. Frontiers in Psychology 7: 1314. [Google Scholar] [CrossRef]
- Holmqvist, Kenneth, Marcus Nyström, Richard Andersson, Richard Dewhurst, Jarodzka Halszka, and Joost Van de Weijer. 2011. Eye Tracking: A Comprehensive Guide to Methods and Measures. Oxford: OUP Oxford. [Google Scholar]
- Just, Marcel A., and Patricia A. Carpenter. 1976. Eye fixations and cognitive processes. Cognitive Psychology 8: 441–80. [Google Scholar] [CrossRef]
- Kizilirmak, Jasmin M., Violetta Serger, Judith Kehl, Michael Öllinger, Kristian Folta-Schoofs, and Alan Richardson-Klavehn. 2018. Feelings-of-warmth increase more abruptly for verbal riddles solved with in contrast to without Aha! Experience. Frontiers in Psychology 9: 1404. [Google Scholar] [CrossRef] [PubMed]
- Knoblich, Günther, Stellan Ohlsson, Hilde Haider, and Detlef Rhenius. 1999. Constraint relaxation and chunk decomposition in insight problem solving. Journal of Experimental Psychology: Learning, Memory, and Cognition 25: 1534–55. [Google Scholar] [CrossRef]
- Knoblich, Günther, Stellan Ohlsson, and Gary E. Raney. 2001. An eye movement study of insight problem solving. Memory & Cognition 29: 1000–9. [Google Scholar] [CrossRef]
- Korovkin, Sergey, and Anna Savinova. 2021. The Effectiveness of Metacognitive Hints in Insight Problem Solving. In Advances in Cognitive Research, Artificial Intelligence and Neuroinformatics. Edited by Boris M. Velichkovsky, Pavel M. Balaban and Vadim L. Ushakov. Intercognsci 2020. Advances in Intelligent Systems and Computing. Cham: Springer, vol. 1358. [Google Scholar] [CrossRef]
- Kuhn, Gustav, and Michael F. Land. 2006. There’s more to magic than meets the eye. Current Biology 16: R950–R51. [Google Scholar] [CrossRef]
- Kuhn, Gustav, Benjamin W. Tatler, and Geoff. G. Cole. 2009. You look where I look! Effect of gaze cues on overt and covert attention in misdirection. Visual Cognition 17: 925–44. [Google Scholar] [CrossRef]
- Lindeløv, Jonas K. 2020. mcp: An R Package for Regression with Multiple Change Points. OSF Preprints. [Google Scholar] [CrossRef]
- Loesche, Frank, Jeremy Goslin, and Guido Bugmann. 2018. Paving the way to eureka—Introducing “dira” as an experimental paradigm to observe the process of creative problem solving. Frontiers in Psychology 9: 1773. [Google Scholar] [CrossRef]
- MacGregor, James N., and J. Barton Cunningham. 2009. The effects of number and level of restructuring in insight problem solving. The Journal of Problem Solving 2: 7. [Google Scholar] [CrossRef]
- Metcalfe, Janet, and Arthur P. Shimamura, eds. 1994. Metacognition: Knowing about Knowing. Cambridge: MIT Press. [Google Scholar]
- Newell, Allen, and Herbert A. Simon. 1972. Human Problem Solving. Englewood Cliffs: Prentice Hall. [Google Scholar]
- Novick, Laura R., and Steven J. Sherman. 2003. On the nature of insight solutions: Evidence from skill differences in anagram solution. The Quarterly Journal of Experimental Psychology Section A 56: 351–82. [Google Scholar] [CrossRef] [PubMed]
- Ohlsson, Stellan. 1984. Restructuring revisited: II. An information processing theory of restructuring and insight. Scandinavian Journal of Psychology 25: 117–29. [Google Scholar] [CrossRef]
- Ohlsson, Stellan. 1992. Information-processing explanations of insight and related phenomena. In Advances in the Psychology of Thinking. Edited by M. Keane and K. J. Gilhooly. London: Harvester-Wheatsheaf, pp. 1–44. [Google Scholar]
- Ohlsson, Stellan. 2011. Deep Learning: How the Mind Overrides Experience. New York: Cambridge University Press. [Google Scholar]
- Öllinger, Michael, Gary Jones, and Günther Knoblich. 2006. Heuristics and representational change in two-move matchstick arithmetic tasks. Advances in Cognitive Psychology 2: 239–53. [Google Scholar] [CrossRef]
- Öllinger, Michael, Gary Jones, and Günther Knoblich. 2008. Investigating the effect of mental set on insight problem solving. Experimental Psychology 55: 270–82. [Google Scholar] [CrossRef]
- Pétervári, Judit, and Amory H. Danek. 2020. Problem solving of magic tricks: Guiding to and through an impasse with solution cues. Thinking & Reasoning 26: 502–33. [Google Scholar] [CrossRef]
- Raftery, Adrian E., and V. E. Akman. 1986. Bayesian analysis of a Poisson process with a change-point. Biometrika 73: 85–89. [Google Scholar] [CrossRef]
- Rayner, Keith. 1995. Eye movements and cognitive processes in reading, visual search, and scene perception. In Studies in Visual Information Processing. Amsterdam: Elsevier, vol. 6, pp. 3–22. [Google Scholar]
- Reingold, Eyal M., Neil Charness, Richard S. Schultetus, and Dave M. Stampe. 2001. Perceptual automaticity in expert chess players: Parallel encoding of chess relations. Psychonomic Bulletin & Review 8: 504–10. [Google Scholar]
- Schooler, Jonathan W., Stellan Ohlsson, and Kevin Brooks. 1993. Thoughts beyond words: When language overshadows insight. Journal of Experimental Psychology: General 122: 166. [Google Scholar] [CrossRef]
- Spiridonov, Vladimir, Nikita Loginov, and Vladlen Ardislamov. 2021. Dissociation between the subjective experience of insight and performance in the CRA paradigm. Journal of Cognitive Psychology 33: 685–99. [Google Scholar] [CrossRef]
- Takeuchi, Naoyuki, Takayuki Mori, Yoshimi Suzukamo, and Shin I. Izumi. 2019. Activity of prefrontal cortex in teachers and students during teaching of an insight problem. Mind, Brain, and Education 13: 167–75. [Google Scholar] [CrossRef]
- Tseng, Chien-Chih, Ching-Hui Chen, Hsueh-Chih Chen, Yao-Ting Sung, and Kuo-En Chang. 2014. Verification of Dual Factors theory with eye movements during a matchstick arithmetic insight problem. Thinking Skills and Creativity 13: 129–40. [Google Scholar] [CrossRef]
- van Rij, Jacolien, Nemanja Vaci, Lee Wurm, and Laurie Feldman. 2020. Alternative quantitative methods in psycholingistics: Implications for theory and design. In Word Knowledge and Word Usage: A Cross-Disciplinary Guide to the Mental Lexicon. Edited by Vito Pirrelli, Ingo Plag and Wolfgang Dressler. Berlin and Boston: De Gruyter Mouton, pp. 83–126. [Google Scholar] [CrossRef]
- Wertheimer, Max. 1925. Über Schlussprozesse im produktiven Denken. In Drei Abhandlungen zur Gestalttheorie. Edited by Max Wertheimer. Erlangen: Verlag der Philosophischen Akademie, pp. 164–84. [Google Scholar]


Disclaimer/Publisher’s Note: The statements, opinions and data contained in all publications are solely those of the individual author(s) and contributor(s) and not of MDPI and/or the editor(s). MDPI and/or the editor(s) disclaim responsibility for any injury to people or property resulting from any ideas, methods, instructions or products referred to in the content. |
© 2023 by the authors. Licensee MDPI, Basel, Switzerland. This article is an open access article distributed under the terms and conditions of the Creative Commons Attribution (CC BY) license (https://creativecommons.org/licenses/by/4.0/).
Share and Cite
Graf, M.; Danek, A.H.; Vaci, N.; Bilalić, M. Tracing Cognitive Processes in Insight Problem Solving: Using GAMs and Change Point Analysis to Uncover Restructuring. J. Intell. 2023, 11, 86. https://doi.org/10.3390/jintelligence11050086
Graf M, Danek AH, Vaci N, Bilalić M. Tracing Cognitive Processes in Insight Problem Solving: Using GAMs and Change Point Analysis to Uncover Restructuring. Journal of Intelligence. 2023; 11(5):86. https://doi.org/10.3390/jintelligence11050086
Chicago/Turabian StyleGraf, Mario, Amory H. Danek, Nemanja Vaci, and Merim Bilalić. 2023. "Tracing Cognitive Processes in Insight Problem Solving: Using GAMs and Change Point Analysis to Uncover Restructuring" Journal of Intelligence 11, no. 5: 86. https://doi.org/10.3390/jintelligence11050086