Article

Construction and Validation of the HeiQ: An Operation-Oriented Figural Matrices Test

1
Department of Psychology, Heidelberg University, Hauptstr. 47-51, 69117 Heidelberg, Germany
2
Section Psychology, University of Applied Labour Studies, Seckenheimer Landstr. 16, 68163 Mannheim, Germany
*
Author to whom correspondence should be addressed.
J. Intell. 2023, 11(4), 73; https://doi.org/10.3390/jintelligence11040073
Submission received: 12 February 2023 / Revised: 11 April 2023 / Accepted: 12 April 2023 / Published: 18 April 2023

Abstract

:
Figural matrices tests are among the most popular and well-investigated tests used to assess inductive reasoning abilities. Solving these tests requires the selection of a target that completes a figural matrix among distractors. Despite their generally good psychometric properties, previous matrices tests have limitations associated with distractor construction that prevent them from realizing their full potential. Most tests allow participants to identify the correct response by eliminating distractors based on superficial features. The goal of this study was to develop a novel figural matrices test which is less prone to the use of response elimination strategies, and to test its psychometric properties. The new test consists of 48 items and was validated with N = 767 participants. Measurement models implied that the test is Rasch scalable, inferring a uniform underlying ability. The test showed good to very good reliability (retest-correlation: r = 0.88; Cronbach’s alpha: α = 0.93; split-half reliability: r = 0.88) and good construct validity (r = 0.81 with the Raven Progressive Matrices Test, r = 0.73 with global intelligence scores of the Intelligence Structure Test 2000R, and r = 0.58 with the global score of the Berlin Intelligence Structure Test). It even superseded the Raven Progressive Matrices Tests in criterion-related validity (correlation with final year high school grades (r = −0.49 p < .001)). We conclude that this novel test has excellent psychometric properties and can be a valuable tool for researchers interested in reasoning assessment.

1. Introduction

Fluid reasoning abilities, which are sometimes also called fluid intelligence, are one of the best predictors of educational achievement (Deary et al. 2007), job performance (Schmidt and Hunter 2004), health and longevity (Gottfredson and Deary 2004), and complex problem solving (Danner et al. 2011). Within the Cattell–Horn–Caroll taxonomy of cognitive abilities, fluid reasoning is defined as the ability to identify underlying rules or patterns in novel situations (Cattell 1963; Horn 1968; Horn and Cattell 1967; McGrew 2009). Thus, people with good fluid reasoning abilities are good at solving inductive reasoning problems without having the prior knowledge, scripts, habits, or schemata to do so (Schneider and McGrew 2012). For this reason, fluid reasoning abilities are typically assessed using figural reasoning tests, such as the prominent Raven matrices test (Carpenter et al. 1990; Marshalek et al. 1983; Raven et al. 1994; Waschl et al. 2016). Although several figural reasoning tests have been developed and their validity has been established, we believe that there is room for improvement in the assessment of inductive reasoning abilities. For this purpose, we developed a new test to overcome the psychometric weaknesses of the currently available tests.
Items of figural reasoning tests typically consist of a matrix, each cell of which shows a figure representing a combination of different elements. From cell to cell, the figures’ elements may vary in shape, texture, color, number, orientation, and/or arrangement (Formann 1973). The figures are assigned to matrix cells following certain operations, which may be applied column-wise, row-wise, or both (Formann 1973). Critically, one cell is always left empty, and the participants’ task is to identify the single figure that will complete the matrix, the so-called attractor, in accordance with the underlying operations among a set of candidate figures consisting of the attractor and several distractors. An exemplary matrices test item is displayed in Figure 1.
Items of earlier tests, such as the Raven Matrices Test (Raven 1976) or the Wiener Matrices Test (Formann and Piswanger 1979) were developed in an intuitive fashion, meaning that the items were created based on the personal intuition of the test constructors and then tested on samples to decide which items to keep (Hornke et al. 2000; Klauer 1978; Mittring and Rost 2008; Schott and Wieberg 1984). Such intuitive approaches have been criticized for being created by “testing specialists who based their advice on personal experience, wisdom and limited empirical research” (Haladyna et al. 2002, p. 310). More recently, item construction has been approached in a more rational manner, meaning that test items are created by following explicit construction guidelines (Haladyna and Downing 1989; Heydasch 2014; Hornke et al. 2000; Hornke and Habon 1986). Typical examples for matrices tests developed under a rational approach are the Hagen Matrices Test (Heydasch 2014) and the Bochumer Matrices Test (Hossiep et al. 1999). The Hagen Matrices Test also uses a 3 × 3 matrix, whilst the Bochumer Matrices Test items are arranged in a 5 × 3 matrix. They are both based on a construction framework with pre-defined rules for item generation, which is also why they are also labelled ‘rule-based’. In the given context, the term rule refers to the mental operations that participants need to detect and solve. Therefore, in the remainder of this article, we will refer to these mental operations simply as operations, in line with the nomenclature of Hornke and Habon (1986). Figural reasoning test items can also be generated in an automated fashion by using computer applications such as the MatrixDeveloper (Freund et al. 2008) or the International Cognitive Ability Resource ICAR (The International Cognitive Ability Resource Team 2014). The MatrixDeveloper features six different operations from which the user can choose for generating items (Jendryczko et al. 2019). The tool then generates the item accordingly, randomly selecting shapes, color (black or white), or symbols (Jendryczko et al. 2019).
Notably, even among the tests that used a rational approach, there is currently no royal road to test the construction of figural reasoning tests items. The construction of distractors, especially, has not received much attention to date. The few yet proposed design strategies only relate to some rather specific construction aspects, and most of them have not been validated (Becker et al. 2014). Even with the automated item generators, the distractors are not constructed in a fully systematized fashion. For this reason, we established a new rationale for a systematized distractor generation for our new test with the aim of achieving optimal psychometric properties.
When solving matrices tests, participants regularly use a constructive matching strategy, that is, they identify and apply the underlying operations, mentally construe the answer, and then choose the response option that best reflects the imagined solution (Gonthier and Roulin 2020). For the example in Figure 1, participants would look at the upper 3 × 3 matrix, the item stem, and draw a mental picture of the solution. Hence, the black dot needs to be on the right-hand side, and the inversed smaller triangle needs to be within the bigger triangle with the proportions staying equal. With this mental picture, they would look at the response options and choose the matching option, which is response option a. Sometimes, however, participants can also rely on a bypassing strategy called response elimination (Bethell-Fox et al. 1984; Hayes et al. 2011). Rather than identifying the operations underlying an item, participants inspect the candidate figures to exclude distractors (Arendasy and Sommer 2013; Becker et al. 2016). By doing so, implausible distractors that do not follow any of the operations used to construct the item can be easily eliminated (Case and Swanson 2002; Gierl et al. 2017; Haladyna and Downing 1989; La Torre and Karelitz 2009). For example, if an additional figural element is added to every cell in the third column from left to right, as it is the case in Figure 1, a distractor featuring fewer elements than the cells in the middle column can easily be dismissed. In the same vein, distractors that are visually dissimilar to all other response options can be eliminated without applying any operation (Arendasy and Sommer 2013; Jarosz and Wiley 2012). For instance, if only one distractor features a circle and all other response options solely feature triangles and squares, participants are able to directly rule out this single distractor. For the example in Figure 1, a distractor that would feature any shape other than a triangle for the inner or outer figural element would easily be identified as such.
In a worst-case scenario, participants can use a response elimination strategy to identify the correct response without considering the matrix at all (Mittring and Rost 2008). Usually, any single distractor will feature more figural elements that are also a part of the solution than elements that are not a part of the solution; however, each distractor will feature a different subset of elements from the solution. By mere inspection of all candidate figures, participants can identify the one that shows the highest number of recurring elements and, in doing so, identify the attractor without having any insight into the underlying operations. This bypassing strategy has been referred to as counting (Mittring and Rost 2008). Mittring and Rost (2008) showed that for approximately 50% of the items of the Raven Advanced Progressive Matrices (RAPM) (Raven 1976), the attractor can be unanimously identified by applying such a bypassing strategy without having seen the test matrices of these items. More recently developed matrices tests, including those that employed a rational item construction approach, do not perform much better in this regard: for the Bochum Matrices Test Advanced (Hossiep et al. 1999), 35% of items can be solved by bypassing strategies; for the Naglieri Nonverbal Ability Test (Naglieri 2003) it is 70%; for the test for intellectual giftedness (Preckel 2003) it is 60%; and for the Wiener Matrizen Test (Formann and Piswanger 1979) it is 75% of the items.
These percentages are significant in that they reflect the proportion of items for which the correct response was unequivocally identified. Therefore, even if an item cannot be solved by using bypassing strategies, the likelihood of choosing the correct response option increases when participants can dismiss certain distractors right away (Arendasy and Sommer 2013; Becker et al. 2016; Tarrant et al. 2009). For the test for intellectual giftedness (Preckel 2003), Mittring and Rost (2008) report that for an additional 15% of the test items, the guessing probability can be increased to p = .50, if the bypassing strategy of counting is used.
Participants tend to use bypassing strategies if possible because they are less cognitively effortful than constructive matching strategies (Gonthier and Roulin 2020). The downside of such bypassing attempts is that test performance typically suffers from them (Arendasy and Sommer 2013; Bethell-Fox et al. 1984; Gonthier and Roulin 2020). Although participants with better cognitive abilities are generally less likely to use bypassing strategies than participants with lower abilities, the reliance on such strategies will influence test performance beyond cognitive abilities (Gonthier and Roulin 2020). It has been shown, for example, that a participant with a lower working memory capacity who uses a constructive matching strategy can outperform a participant with a higher capacity who uses response elimination as a bypassing strategy (Gonthier and Roulin 2020). The scores of participants who used a bypassing strategy can be thus expected to be less indicative of their actual ability than the scores of participants who did not. Taken together, when participants extensively use bypassing strategies for solving a matrices test, the convergent validity with other cognitive abilities tests is likely to be reduced (Arendasy and Sommer 2013; Becker et al. 2016).
In light of these observations, we aimed to develop a novel matrices test that allows for a more precise assessment of reasoning abilities and limits and prevents participants from relying on response elimination strategies, especially counting. To our best knowledge, there are no clear construction guidelines to prevent response elimination and counting strategies. However, the work by Guttman and Schlesinger (1967) is useful in this regard, as they proposed a general systematic distractor construction approach for ability and achievement tests. According to this approach, if the test content is a priori explicated in a facet design, distractors can be generated so that they systematically follow the same design. Within the facet design framework, if a figural reasoning test features a finite number of operations, each distractor needs to portray a different combination of correctly and incorrectly applied operations, meaning distractors need to be collectively exhaustive (Guttman and Schlesinger 1967). For example, if an item consists of two operations, operations A and B, the same amount of distractors out of the total amount of distractors must correctly (1) display operation A, but not operation B, (2) correctly display operation B, but not operation A, and (3) incorrectly display operation A and operation B. Bypassing strategies make use of the fact that certain or even all distractors can be dismissed based on some visual and structural features (Arendasy and Sommer 2013). A direct consequence of the systematic distractor generation approach, however, will be that distractors will be structurally similar to the attractor, which will render them the most plausible.
Furthermore, if the operations used to construct an item are made explicit, the mental operations a participant relies on to solve a particular item can be deduced. In as much as these operations are reflective of the mental processes underlying the latent ability assessed with the item, the analysis of operation detection can be indicative of the cognitive processes at work during item solution (Hornke and Habon 1986; Undeutsch 2010). As responses to items are typically simply scored as “correct versus incorrect”, information about the participants’ reasoning that led to the selection of a particular distractor is lost (Laurence and Macedo 2022). The importance of analyzing distractors for their informative content has come into focus in recent years (Forthmann et al. 2020; Storme et al. 2019). While the focus of previous work was dedicated to analyzing single distractors for ability, our approach focuses on increasing distractor information by using the interplay of distractors and their operations resulting from the facet design (Guttman and Schlesinger 1967). Under the systematic distractor generation approach, combinations of correctly and incorrectly applied operations within each distractor can be used to infer which operations were understood and applied correctly by a participant who chose a particular distractor (Guttman and Schlesinger 1967). Simply put, distractor analysis can help us to better understand the cognitive processes at work in a given person while solving a particular item (Forthmann et al. 2020; Laurence and Macedo 2022).
Based on the considerations just outlined, for our novel matrices test we developed and used a systematic distractor generation approach with the following features:
  • Distractors and the attractor were generated so that the attractor cannot be identified by using a counting strategy (Mittring and Rost 2008);
  • Distractors and the attractor were generated so that they are of a similar visual appearance (Arendasy and Sommer 2013);
  • All distractors were generated so that they were plausible solutions to the item (Gierl et al. 2017; Haladyna et al. 2002; Haladyna and Rodriguez 2013): plausibility was achieved by applying some, but not all of the item’s underlying operations correctly when generating a distractor (Guttman and Schlesinger 1967) and by applying additional operation(s) in accordance with possible misconceptions about the operations used in the respective item (Case and Swanson 2002);
  • Each possible correct/incorrect combination of the item’s underlying operations was reflected by one particular distractor, so that distractor selection would be informative with regard to which operations were correctly applied and which were incorrectly applied (Guttman and Schlesinger 1967).
For the novel matrices test, we intended to generate items that cover a wide range of abilities and would thus allow us to measure and compare reasoning abilities across different populations. For this purpose, we intended to generate items which were more and items which were less easy to solve. We further intended to apply Rasch model scaling to the data so that item difficulties and a person’s abilities could be estimated independently. The Rasch model implies that all items load equally strongly on the latent ability they are assumed to assess, thus allowing the use of a sum score and supporting the unidimensionality of the underlying ability (Rasch 1960). In order to generate the required number of distractors per item under our approach, every item must feature at least two operations. For our test, we decided to come up with items consisting of two as well as items consisting of three operations. Items usually become more difficult when the number and complexity of their underlying operations increase (Carpenter et al. 1990; Gonthier and Roulin 2020). This is because before participants can apply the specific operations they have to distinguish the figural elements within a matrix that reflect the different operations and correspond to each other in order to identify them (Carpenter et al. 1990). Furthermore, if participants succeed in detecting and solving one operation underlying an item that features two or more operations, they have to hold this information in their memory, while trying to identify and solve the other operations (Carpenter et al. 1990). Because either two or three operations from the same finite set of operations underlie all the items of our new test, we are better able to determine item difficulties (Freund et al. 2008). Items with three underlying operations should be more difficult than items with two. Additionally, because distractors partially follow the same operations as the attractors, we should be able to more precisely determine the difficulties of distractors based on their similarity with the attractor (Guttman and Schlesinger 1967).

2. Materials and Methods

2.1. Participants

For the present study, data from 5 different sub-samples, all collected between March 2020 and December 2021, were pooled. In total, 3 sub-samples consisted of student participants; the other 2 consisted of participants from the general population. Participants were recruited in lectures, from the university participant pool, through a newspaper article, by e-mail, and through posts to Facebook groups. Data were collected partly online and partly in the laboratory. All participants filled in the HeiQ and a subset of other tests and questionnaires depending on the sub-sample they belonged to (see below). A total of N = 733 participants completed the study.
Participants who reported that they did not follow the instructions by confirming item “I often clicked something just to finish the study quickly” presented at the very end of the study were excluded (N = 13). Sub-samples 2 to 5 were presented with a catch item that was easily solvable but looked like a regular item on first sight. Participants who did not solve this item were excluded from further analysis (N = 6). Online participants (from sub-samples 1, 2, and 3) were not given a time limit, but had been instructed to perform the test without interruptions. Participants who took more than 4 h to answer all test items were excluded (N = 13) after an outlier analysis. Given the median test duration of 57.52 min for the remaining participants of the 3 sub-samples (N = 388), such long test-taking time was considered an indication of a longer interruption during test completion. Some participants completed the matrices test in less than 2 min, which indicates that they did not try to solve it properly. To exclude items that were not seriously attended to, item solution attempts that took less than 5 s were considered as overly fast and coded as missing values. A 5 s cut-off was chosen because, in our sample, the single fastest correct solution, which was provided by 1 participant who solved all of the items correctly, took 6 s. Furthermore, in the previous research on fast responses it has been argued that participants require at least 5 s to examine, understand, and answer an item (Wise 2017). Participants who showed overly fast responses on 50% of all test items in the HeiQ were completely excluded because they likely did not take the test seriously (N = 18).
The final sample consisted of N = 683 participants. These participants’ mean age was M = 25.88 (SD = 9.04); 66.2% were female, 32.7% were male, and 0.3% identified as non-binary or preferred not to say. A total of 98.4% resided in Germany, with the remainder residing in Europe. Further, N = 590 (86.4%) participants’ first language was German, N = 20 (2.9%) reported they were raised bilingual with German being 1 of the 2 mother languages, and the remaining participants reported their first language was not German or preferred not to say. Most participants were university students (84.3%). Further, N = 467 participants and performed the study online; N = 216 participants performed it in the laboratory. Demographic information for each sub-sample and an overview of the constructs assessed within each sub-sample are provided in Table 1.

2.2. Materials

2.2.1. Construction of the Heidelberg Figural Matrices Test (HeiQ)

The new test introduced in this study was the figural matrices test HeiQ (pronounced “high-q”). The test consisted of 48 items plus one catch item administered for four of the five sub-samples. Each item consisted of a 3 × 3 matrix, of which the very right field in the lowest row is empty. Participants had to identify the correct response option (the attractor) which completes the pattern within the matrix. The attractor was presented together with seven distractors for items with two operations or eight distractors for items with three operations below the matrix on the screen. The position of the attractor among the distractors varied randomly from item to item but was fixed across participants.

Operations

Each cell of the 3 × 3 matrix contains several geometric shapes (e.g., squares; triangles), lines, and/or patterns, which change from cell to cell following certain regularities. For each item, we used two or three out of eight possible operations (Hornke et al. 2000; Hornke and Habon 1986). Figure 2 illustrates the different operations we used. The operations are:
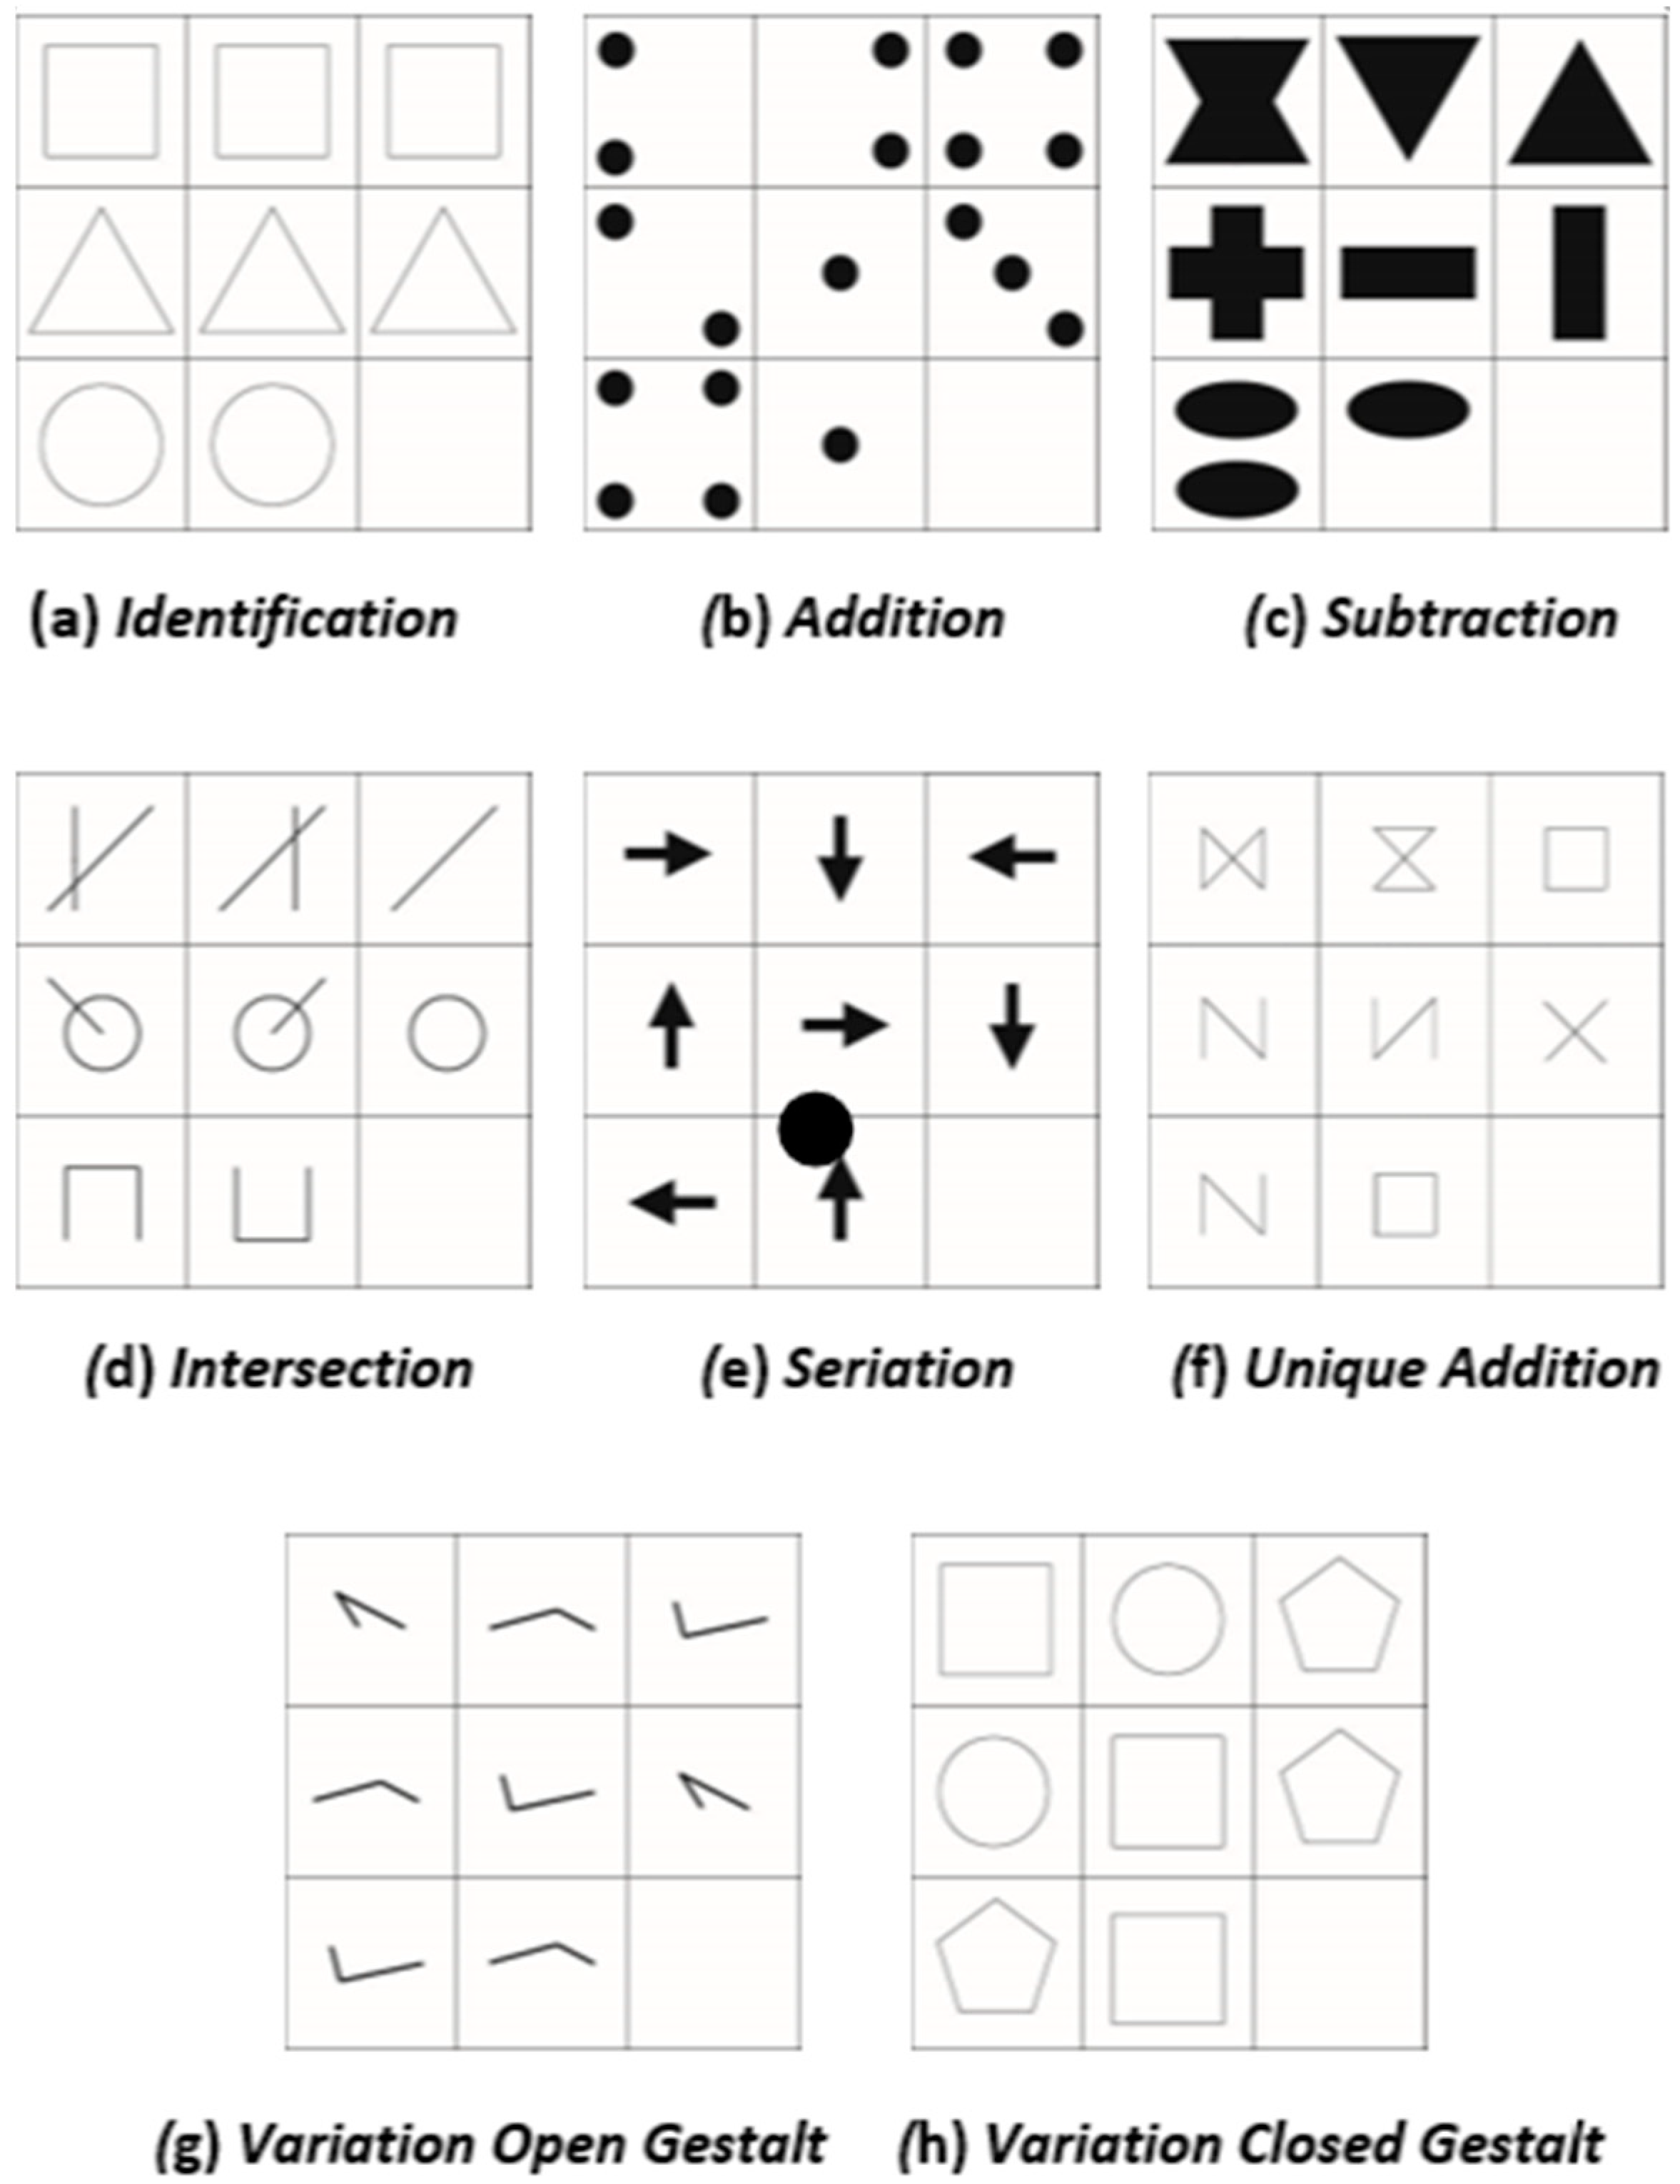
  • Identity (ID): The same figure is repeatedly displayed in each cell of a row/column, (Figure 2a);
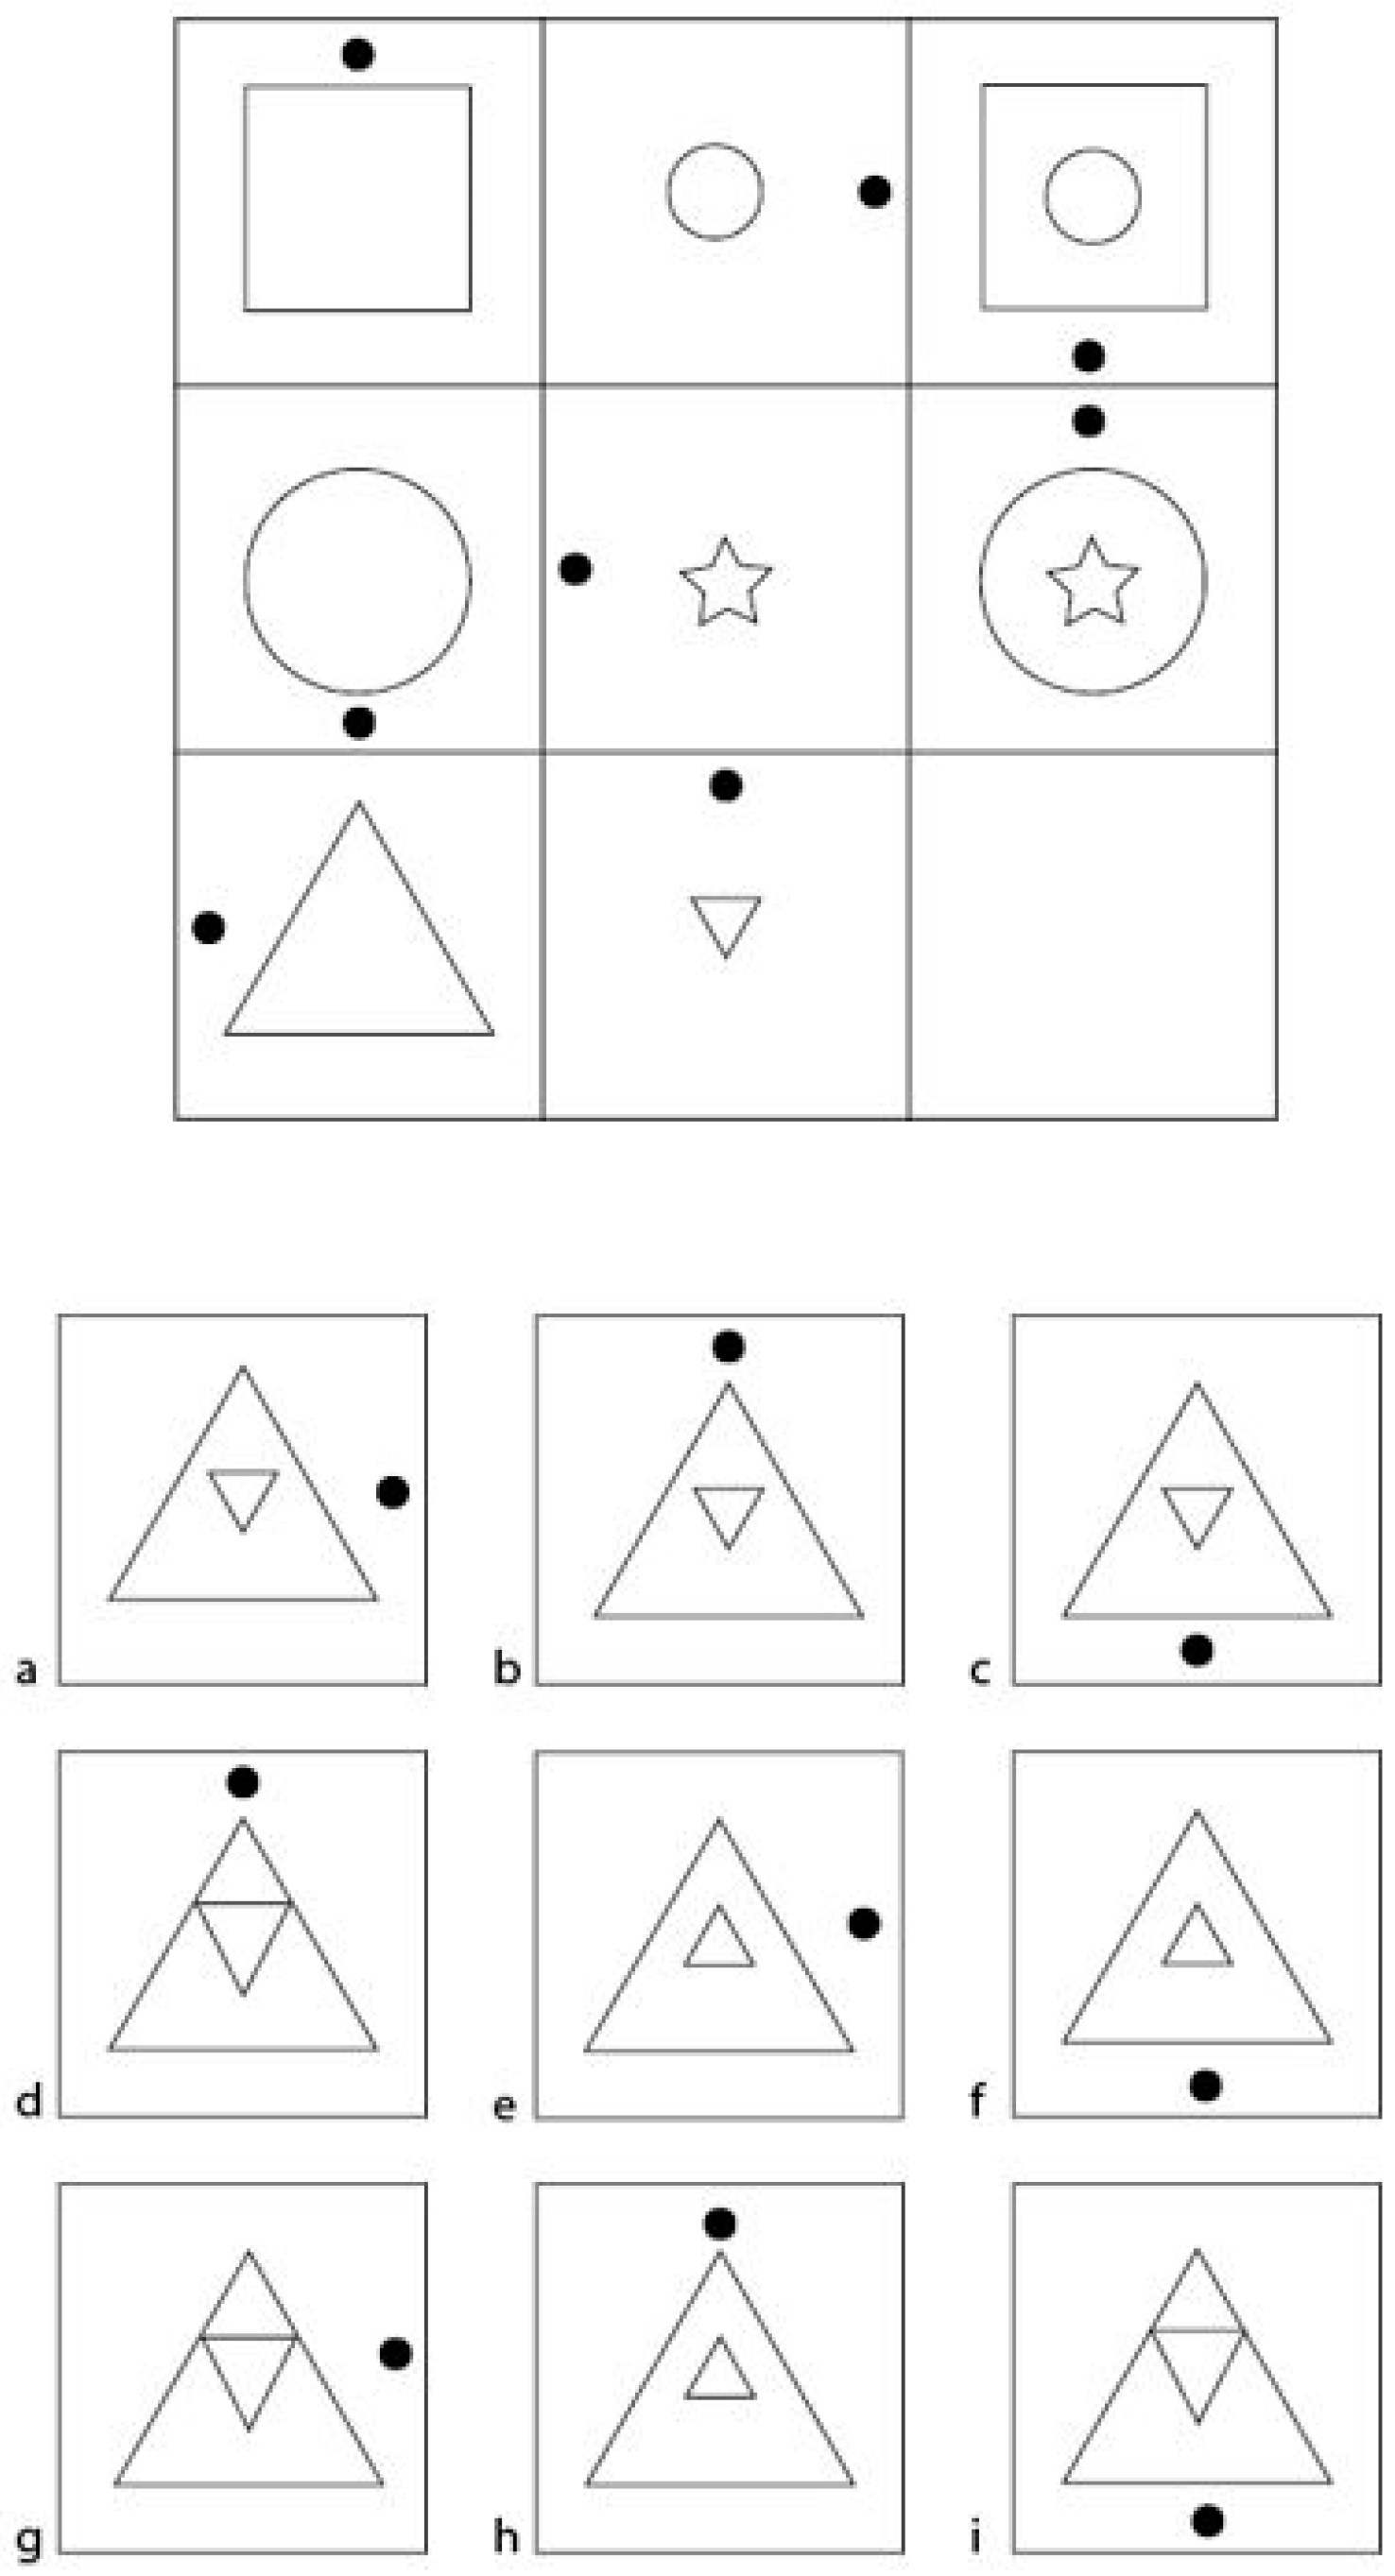
  • Addition (AD): The figures of the first two cells (row-/column-wise) are added together to form the third figure (Figure 2b);
  • Subtraction (SU): The figure of the second cells (row-/column-wise) is deducted from the figure in the first cell of the same row/column to form the figure in the third cell (Figure 2c);
  • Intersection (IN): The third figure consists of only those elements of the figures that are displayed in both the first and the second cell (Figure 2d);
  • Unique addition (UA): The third figure is made up only of those elements of the figures that are displayed in either the first or the second cell. Elements that are found in both figures are omitted (Figure 2e);
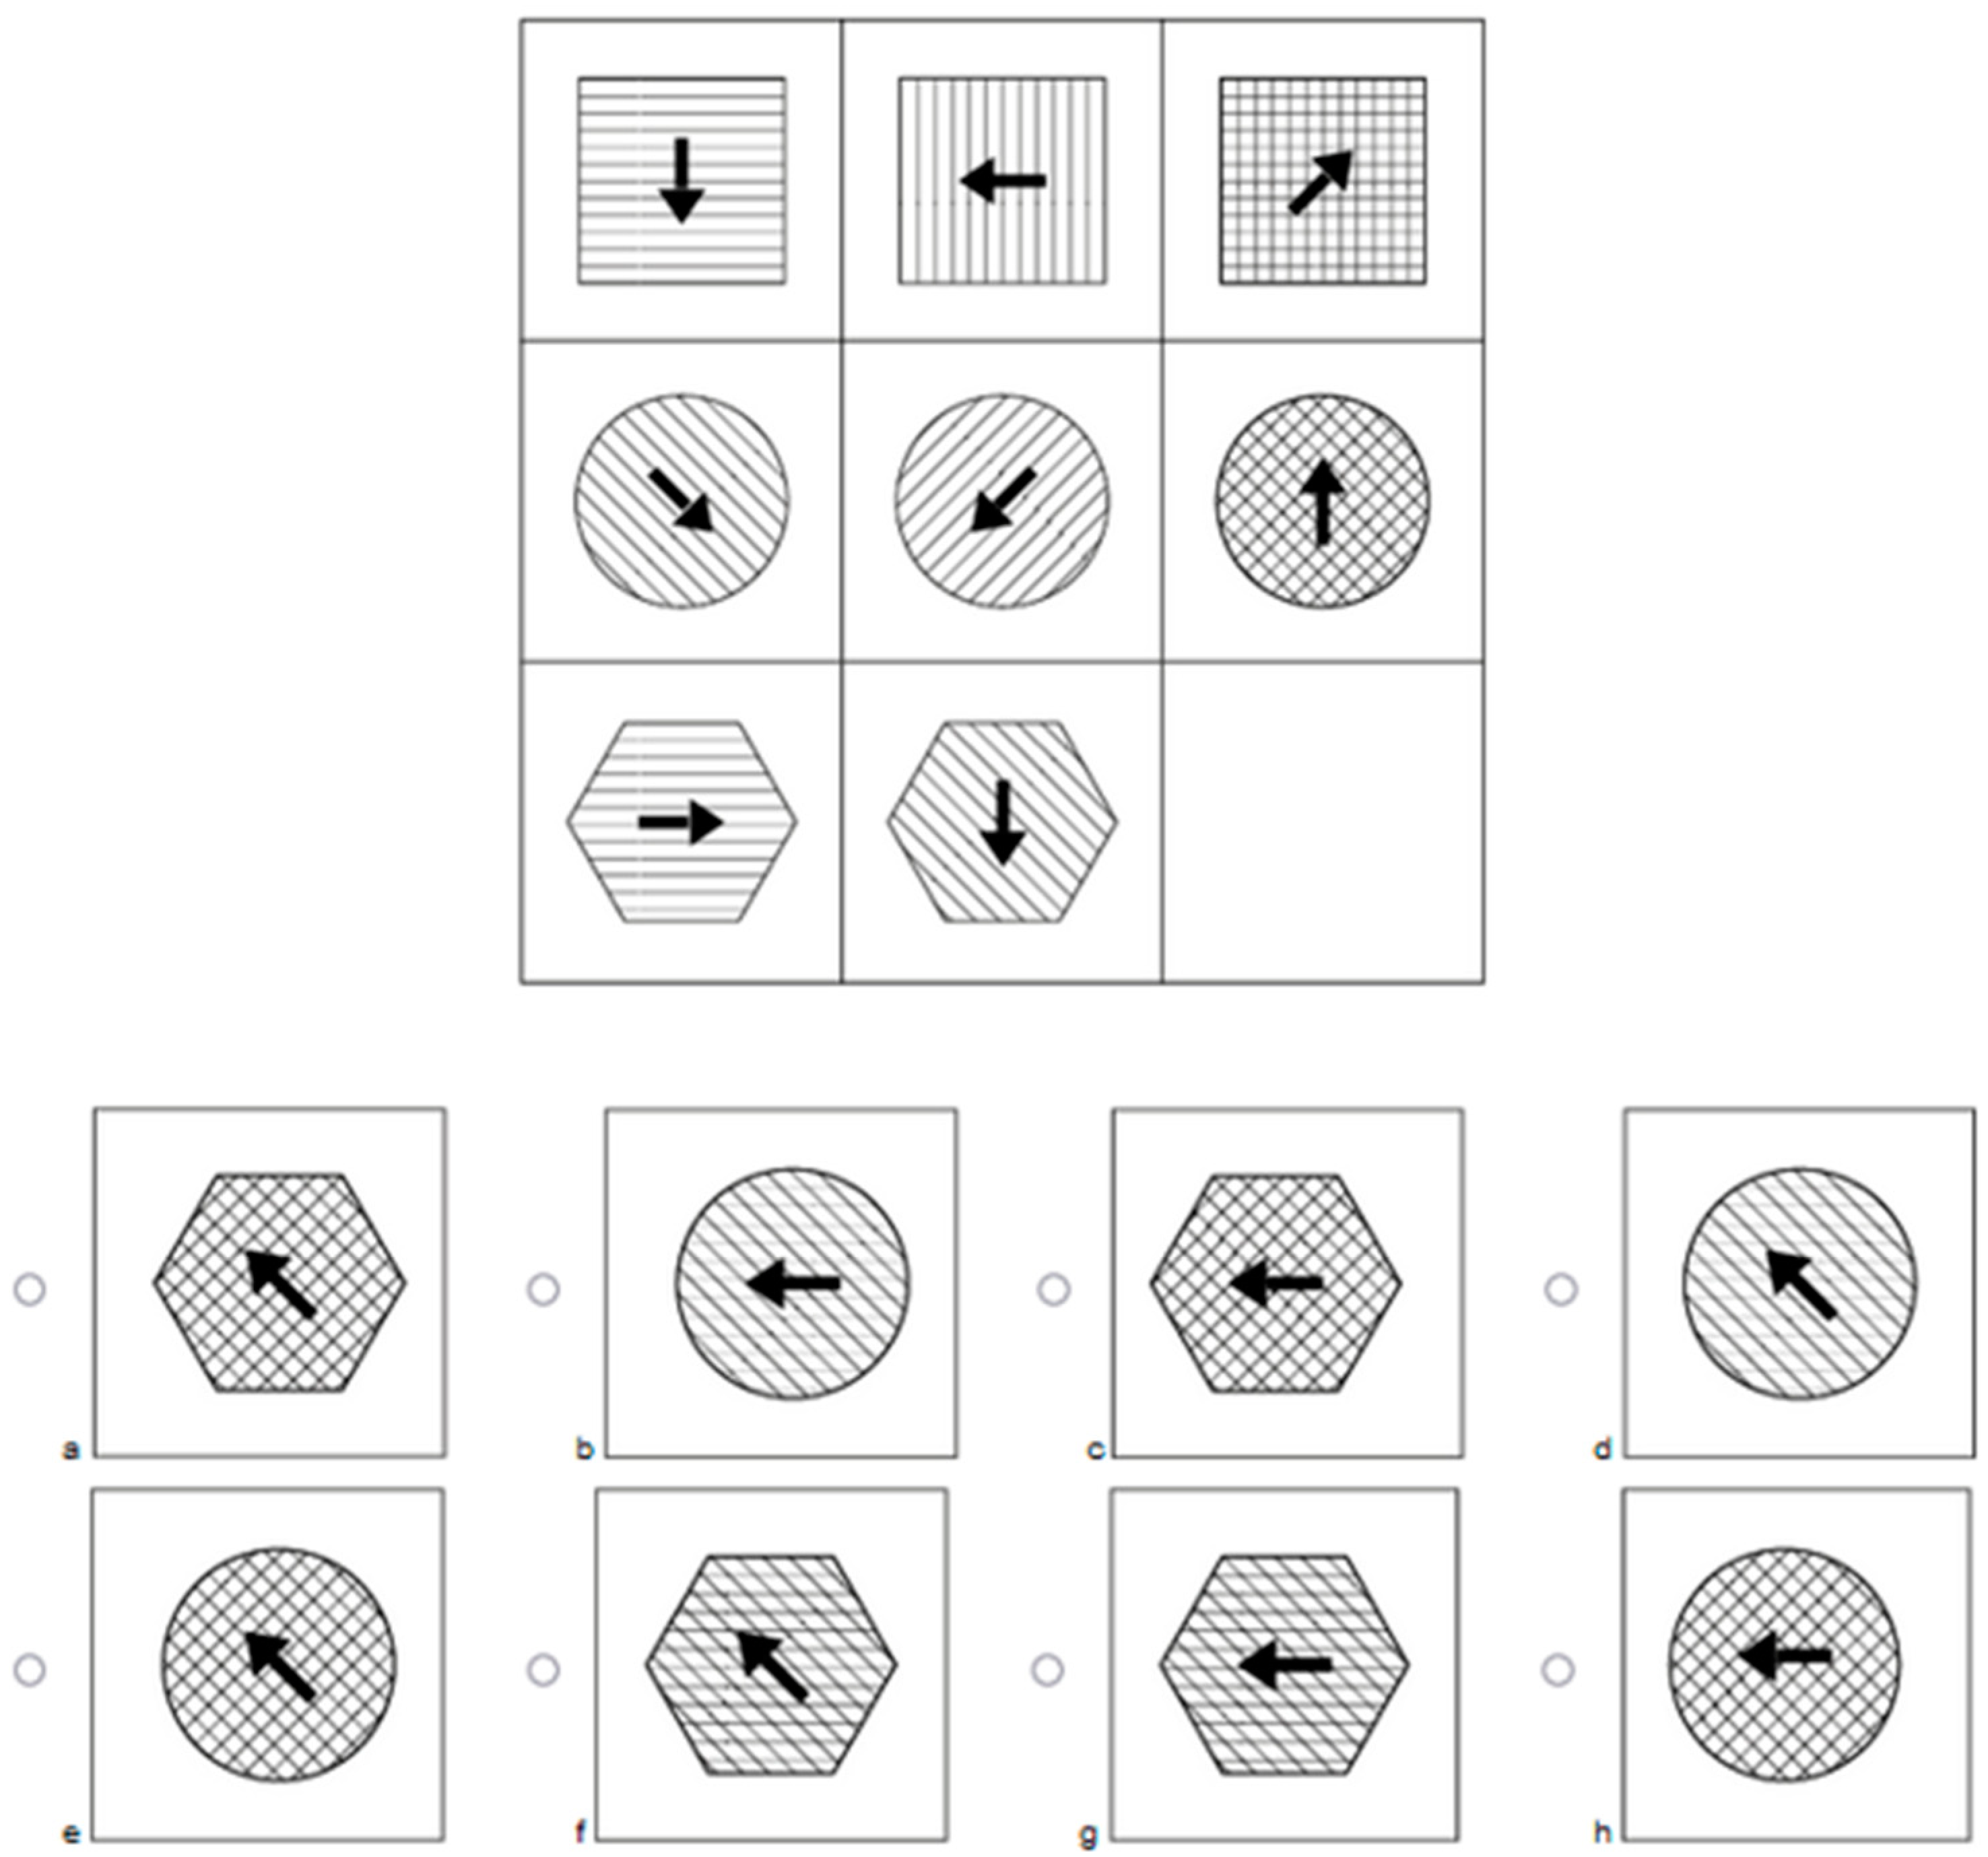
  • Seriation (SE): The rule of change from the first to the second cell (e.g., movement, rotation, change in size, or addition of elements) is applied to the figure in the second cell to generate the figure for the third cell (Figure 2f);
  • Variation of open Gestalts (VO): In each row/column, three one-dimensional figures (e.g., a line, curve, or arrow) are presented. These figures are then repeated in the other rows/columns, although not necessarily in the same order (Figure 2g). Open Gestalts in this case refers to the “one-dimensional” appearance (Hornke et al. 2000);
  • Variation of closed Gestalts (VC): In each column/row, three different figures are presented (for instance, one square, one circle, and one pentagon; see Figure 2h). The order with which the three figures appear within their respective column or row is randomly determined. Closed Gestalts refer to figures of two-dimensional nature (Hornke et al. 2000), such as squares, rectangles, or other visually “closed” figures.

Item Construction

Items were generated using different operations and combining either 2 or 3 of those operations. We applied each of the 8 operations equally, often across the test, so that participants who were able to detect 1 specific operation particularly well would not disproportionally profit from this skill. Additionally, we applied each possible operation combination equally often for the same reason. Overall, 48 items were created. Each operation was included 15 times. As all items are balanced (i.e., each operation is included the same number of times) and we wanted to keep the combinations of operations equal, 24 items with 2 operations and 24 items with 3 operations were considered the best solutions to achieve balance within a mathematical (combinatoric) framework. The 24 two operation items were assigned to the first test half, and the 24 three operation items were assigned to the second test half.

Distractor Generation

Distractors were generated following the guidelines described in the introduction to make sure that participants could not dismiss certain distractors based on superficial features. All distractors were created so that they provided plausible solutions to the empty matrix cell. Plausibility was achieved on a structural level in that all but one distractor correctly featured at least one of the operations that define the attractor. Further, incorrect solutions to an operation were kept as closely related to the existing operations as possible. For example: In the example item in Figure 1, operation Seriation is represented by the black dot that rotates 90 degrees clockwise. The incorrect display of Seriation is depicted by either a black dot that is rotated 180 degrees or a black dot that is rotated 90 degrees counterclockwise. Visual similarity was achieved by using figural elements for the incorrect solutions that are the same or similar to the correct solution. For example: As shown above, Seriation is always featured by a black dot that is either at the correct position or at an incorrect position. The visual element, however, stays the same. In the same vein, the incorrect application of Addition is displayed by the correct figural element—a triangle—but either varied in size or orientation (see Figure 1). We further prevented counting as a means of achieving a correct response. In a final step, we constructed distractors so they could be evaluated to infer which operations participants applied/missed. To achieve these requisites, certain factors had to be considered:

Balanced Occurrence of Figural Elements

In our test, all figural elements (e.g., arrows) appear equally, often across response options. As a result, participants could not estimate the likelihood of response options based on their appearance. For example, four response options might include an arrow pointing upwards, whereas the remaining four response options display an arrow pointing downwards. No response option could be ruled out heuristically. The same principle applies to the joint occurrence of figural elements (e.g., an arrow and the shape of the outer element). Some responses might show a circle with the arrow pointing upward, other responses a hexagon with the arrow pointing downward and vice versa. Thus, counting was not possible. An example is shown in Figure 3.
The item in Figure 3 features three operations: Identification, Addition, and Seriation. In this example, Identification refers to the outer shape of the figure: either a circle (false application of the operation) or a hexagon (correct application). Examining the eight response options, four options include a circle (b, d, e, and h), and four options include a hexagon (a, c, f, and g). Because both shapes occur equally often, they should be equally likely to be considered the correct shape for people who did not identify the Identification operation. The second operation in the example item is Addition. Addition in this item is displayed by the pattern inside the shapes. Again, four patterns resemble the correct application of this operation (b, d, f, and g), and four patterns represent a false application (a, c, e, and h). The last operation, Seriation, regards the direction of the arrows. There are four arrows pointing in the upper left-hand direction (a, d, e, and f; the correct display of the underlying operation) and four arrows pointing to the left-hand side (b, c, g, and h distractor elements of this operation). Again, each element is displayed the same number of times, and no element can be regarded as more or less likely. To conclude, it was not possible to rule out one of the elements by looking at the number of times each element appears. Furthermore, the combination these elements appear in also had to be considered.
Each combination of any two of the three figural elements was presented the same number of times. As can be seen in Figure 3, the two different shapes are both presented twice with the arrow pointing to the left and twice with the arrow pointing diagonally upwards, respectively, creating four different possible combinations that are all heuristically equally likely. This was to ensure that participants who correctly applied one operation were still left with response options that featured the same elements the same number of times. If this was not the case, counting would still be possible after successfully applying one operation. The technique of presenting each element and each combination of elements equally was often applied for every operation, resulting in eight unique response options. The combinations and thus the pattern of correctly applied operations can be presented in a table, as shown in Table 2.

Informative Content of Distractors

Several distractors were created so that they would serve as lures. In other words, they followed one of the operations necessary to solve the item, but not the other(s). The idea is that participants who selected these lures did so because they understood some part of the construction underlying the item, but not all of it. To be able to subsequently estimate which operations were correctly applied by a participant, a distractor for every possible combination of correctly/incorrectly applied operations was created. For example, distractors that displayed either the correct solution of operation A but not operation B, or operation B but not operation A, were included as well as distractors that did not display any correct features. For the three-operation items, this approach continued onto each possible two-way combination. For an item with operations ABC, apart from the attractor, there were three distractors where either one of the operations was correct (either A, B, or C), three distractors where any two-operation combination was correct (AB, AC, and BC, respectively), and one where none of the operations were correct. Figure 3 and Table 1 can also be used to exemplify this setup. The item in Figure 3 features three operations: Addition, Identification, and Seriation. The correct response is response option f.
Each distractor represents a different combination of a true/false depiction of the underlying operations. This is shown in Table 2. A participant selecting response option a could thus be assumed to have correctly detected and solved the operations Identification and Seriation, but not Addition. A participant selecting response option h, however, can be assumed to not have detected or solved any of the three operations. The emerging eight response options cover every combination of correct and incorrect application for each operation. Together with the guidelines presented above to include each element the same number of times, this distractor setup made it possible to identify operation knowledge for all operations while still preventing counting as an exclusion strategy.

2.2.2. Berlin Intelligence Structure Test Short Form (BIS-S)

The short form of the Berlin Intelligence Structure Test (BIS-S) was used in sub-sample 4 (Beauducel and Kersting 2002; Jäger et al. 1997). The BIS-S consists of 15 tasks that capture the mental operations reasoning, creativity, memory, and speed in verbal, numerical, and figural contents. Overall, the BIS-S is a valid indicator for general intelligence (e.g., Beauducel and Kersting 2002). The BIS-S takes approximately 45–60 min to complete, depending on the time spent on the instructions and trial items for each task. An example task is the Charkow task: Participants of this task need to complete line drawings in accordance with certain rules. The first four drawings are given, and participants have to draw the remaining two. This task can be categorized into a figural reasoning facet of the BIS model (Jäger et al. 1997).

2.2.3. Intelligence Structure Test 2000R (I-S-T 2000R)

The Intelligence Structure Test 2000R (I-S-T 2000R) was used as an additional measure of general intelligence in sub-sample 5 (Liepmann et al. 2001). With the I-S-T 2000R, three domains of cognitive abilities are tested: reasoning, knowledge, and memory. Reasoning and knowledge can each be divided into three subcategories: numeric, verbal, and figural. Furthermore, fluid intelligence (gf) and crystal intelligence (gc) are extracted from the reasoning and knowledge part of the test.

2.2.4. Raven Advanced Progressive Matrices (RAPM)

The Raven Advanced Progressive Matrices (Raven et al. 1994) is a frequently used figural matrices test and was used as a benchmark for the newly developed test in one sub-sample. Each item presents a 3 × 3 matrix with one (the bottom right) empty field. Participants need to detect the underlying structure and decide which out of the eight given response options correctly continues the given matrix. Components can differ by form, color, size, or orientation and be applied horizontally or vertically. The RAPM consists of 48 items, with 12 items (Set I) being practice items. The actual test consists of 36 items (Set II).

2.2.5. Need for Cognition (NFC) Scale

A German 4-item short form (Beißert et al. 2015) of the original NFC scale (Cacioppo and Petty 1982) was used in all sub-samples. The short version was used as it has been shown to have good psychometric properties and does not consume too much assessment session time (Beißert et al. 2015; Rammstedt et al. 2012). All 4 items (e.g., “I prefer my life to be filled with puzzles that I must solve”) of the scale employed a 7-point Likert scale that ranged from 1 (strongly disagree) to 7 (strongly agree).

2.3. Procedure

The test was always administered either in the laboratory or online via the online survey platform SoSci Survey (Leiner 2019). For participants who completed the test online from home, an online introduction was provided outlining the general aim of the study and testing procedure. Participants of sub-sample 4 who completed an additional battery of tests in the laboratory were introduced by an examiner. Examiners received training and clearly written instructions beforehand to guarantee objectivity in both test administration and test scoring when applicable. The introduction to the HeiQ (i.e., layout and number of items and response options, or introduction to the task) was embedded in the survey platform to ensure objectivity across all samples. Participants then had to complete two exemplary items (see Figure 1 for an example). The 5 sub-samples differed in the additional tests and surveys they had to complete. Samples 1–3 only completed the figural matrices test, the need for cognition questionnaire, and some basic demographic questions. No time limit was imposed. Participants took an average of M = 63.27 (SD = 36.44) minutes to complete the HeiQ. Sub-sample 4 additionally completed the BIS-S, and sub-sample 5 additionally completed the IST-2000-R and the RAPM. For these samples, participants first worked on the respective performance tests before receiving the HeiQ. They were then given a time limit of 60 min to complete the HeiQ. Participants took an average of M = 51.73 (SD = 10.00) minutes to complete the HeiQ.

3. Results

3.1. Percentage of Items Solved

Participants solved an average of M = 26.87 (SD = 10.70; Range = 3–47) out of the 48 items. Of the 24 2-operation items, M = 15.16 (63.17%); (SD = 5.26 (21.92%); and Range 3–24 (12.5–100%)) were solved. Of the 24 3-operation items, M = 11.74 (48.92%) and (SD = 6.10 (25.42%); Range 0–24 (0–100%)) were solved. Due to technical errors, 1 item was not correctly displayed for the first sub-sample, resulting in a possible maximum score of 47 for 155 people. Participants scored higher in the 2-operation condition (the first test half) than in the 3-operation condition (the second test half) t (681) = 22.38, p < .001, d = 0.86. The correlation between the 2 test-halves was r = 0.76 (p < .001). The correlation between the 2 test-halves corrected for attenuation was r = 0.87.

3.2. Missing Responses

The overall mean number of missing values was M = 2.53 (SD = 4.80) of 48 items. This included skipped responses (M = 0.36; SD = 1.33), overly fast responses (less than 5s per item; M = 1.03; SD = 3.17), and—for sub-sample 4—responses that could not be given because the time limit had been reached (N = 216; M = 2.83; and SD = 4.97). The correlation between the number of missing values and relative score (the percentage of correctly solved items out of the items that were not treated as missing) was r = −0.10 (p = .008). Taking only skipped and fast responses into account, participants missed M = 0.17 (SD = 0.70; range: 0–6) of 24 items in the first test half (2-operation items) and M = 1.23 (SD = 2.97; range: 0–22) of 24 items in the second test half (3-operation items). This difference was significant t (682) = −10.24, p < 0.001, d = −0.39. The number of skipped and fast responses correlated with a lower score on the remaining items at r = −0.26 (p < .001). Over all the sub-samples without a time limit (N = 388), performance on the first test half predicted the number of missing values in the second test half, R2 = 0.06 (adjusted R2 = 0.06), F (1, 386) = 25.89, p < .001. The correlation of the number of items that were not reached due to the time limit and the relative score on the valid items was r = 0.11 (p = .004). Percentages of participants who correctly solved the item as well as the number of valid responses are presented in Table 3.

3.3. Measurement Models

We used a Rasch model (Rasch 1960) to analyze the data. A Rasch dichotomous model is the most parsimonious model within probabilistic test theory and is sometimes also called a 1PL model. The Rasch model specifies that the probability of a person ( v ) for solving item ( i ) is a function of the ability of this person (theta θ v ) and the difficulty of this item σ i . The higher the ability θ v and/or the lower the difficulty σ i , the higher the probability of solving the item correctly Ρ χ ν i = 1 . In mathematical terms, the equation is rendered as follows:
Ρ χ ν i = 1 = e ( θ υ σ i ) 1 + e ( θ υ σ i )
As there are only two parameters in a Rasch model, item discrimination is uniform. This means that every item loads equally on the same latent construct. Although item responses are not missing at random (MAR), item and person parameter estimates of an IRT measurement model are robust and can be incorporated as such (Pohl et al. 2013). Measurement models were estimated using the means and variance adjusted weighted least square estimator (WLSMV) implemented in Mplus 8.6 (Muthén and Muthén 2017). Model fit indices are reported in Table 4. We further report outfit, infit, differential item functioning, and item difficulties for all items in Table A1 in the Appendix A.
All models were accepted according to the standardly used fit indices: With a RMSEA of ≤0.06, the Rasch model showed a good model fit (Hu and Bentler 1999; Yu 2002). An χ2/df ratio ≤ 5 also suggests an acceptable model fit (Wheaton et al. 1977).

3.4. Reliability

The split-half reliability coefficient, computed as an odd–even split, was r = 0.88 p < .001 (Spearman–Brown corrected). As a measure of internal consistency, Cronbach’s α and Revelle’s omega total (see McNeish 2018) were computed for the overall test and for the operation indicators. As there were many participants with missing data and data are assumed not to be missing at random (NMAR) (Pohl et al. 2013), listwise deletion would lead to an overestimation of alpha. As a result, pairwise deletion was imposed. With a Cronbach’s α = 0.93 and a Revelle’s omega total ωRT = 0.94, the overall test had excellent internal consistency according to the common conventions. We further computed the marginal empirical reliability based on the squared standard errors of the sample scores using the expected a posteriori (EAP) estimator as suggested by Brown and Croudace (2015). Marginal empirical reliability was ρ = 0.91. A subsample of N = 204 took the test twice. On average, the test–retest interval for this sub-sample was M = 87 days (SD = 19). The retest-correlation was r = 0.88 p < .001 (Spearman–Brown corrected).

3.5. Validity

The HeiQ’s validity was assessed by investigating its correlation with a variety of other intelligence measures, academic performance indicators, and other related constructs. In sub-sample 5 (N = 76), the HeiQ scores were highly correlated with the RAPM r = 0.81 p < .001. The correlation corrected for attenuation was r = 0.90. In the same sub-sample, the correlation of the HeiQ with the I-S-T 2000R’s general intelligence scale was r = 0.73 p < .001, and its correlation with the I-S-T 2000R’s general knowledge scale was r = 0.42 p < .001, speaking to the test’s convergent and discriminant construct-related validity. The correlational pattern of the HeiQ with the IST’s sub-scales is displayed in Table 5. In sub-sample 4 with N = 215 valid BIS-s scores, the correlation between the BIS-s and the HeiQ was found to be r = 0.58 p < .001. An overview of the association of the HeiQ with other intelligence test measures can be found in Table 5. We further report the descriptive statistics and correlations of all measures in Table A2 in the Appendix A. All measures were scored according to the advised scoring procedure in the respective test manuals. Namely, every correct response was scored as one, whilst every incorrect response was scored with zero. Sum scores for the scales of the BIS-S and the I-S-T 2000R were then calculated. The IQ score of the BIS-S was drawn from the tables included in the manuals. For the other measures, the respective sum scores were used.
Table 6 shows the correlations of the HeiQ with academic achievement indicators. Only participants with a German high-school qualification (Abitur) noted as GPA were included to guarantee comparability. In the German school system, a lower grade indicates better performance; thus, grades are expected to be negatively correlated with reasoning abilities. HeiQ scores and GPA were indeed negatively correlated; r = −0.38 p < .001. Similarly to Heydasch (2014), we also calculated correlations between GPA and HeiQ scores for participants under 24 only. Inclusion of a large age range can skew GPA measures, as the school and grading system underlies changes over time.
For participants under the age of 24, the HeiQ and GPA were strongly correlated; r = −0.48 p < .001. Furthermore, grades for the 5 different academic subjects were provided by the participants of sub-sample 4 (i.e., Mathematics, German, English, Biology, and Arts). As these grades are provided in terms of achievement points (ranging from the worst of 0 to the best of 15 points), grades should be positively correlated with the HeiQ. The HeiQ scores correlated highest with grades in mathematics r = 0.48 p < .001 (r = 0.48 p < .001 for participants under 24) and biology r = 0.32 p < .001 (r = 0.44 p < .001 for participants under 24). Lower correlations with German, r = 0.20 p < .01 (r = 0.22 p < .05 for participants under 24) and English, r = 0.17 p < .05 (r = 0.20 p < .05 for participants under 24) were found. The grade in Arts was not significantly associated with the HeiQ; r = 0.08, p = .43 (r = 0.17 p = .18 for participants under 24).
As sub-sample 5 completed both the RAPM and the HeiQ, separate correlations for GPA were computed. The correlation between GPA and the HeiQ score for those participants of sub-sample 5 that held a high school diploma (N = 72) was r = −0.49 p < .001. The correlation between GPA and the RAPM was r = −0.38 p = .001. The difference of r = −0.11 was significant (Fisher’s z = 1.67, p = 0.048) (Meng et al. 1992).

3.6. Operation-Specific Indicators

Additional scores for each cognitive operation for every participant were computed. Hereby, each response given by a participant was analyzed for the operations that were included to construct the item. For each correctly identified operation, participants received a point on that operation’s scale. For example, if a respondent completed the item shown in Figure 3 and chose response option b, d, f, or g, they correctly applied the operation Addition and, accordingly, would receive one point on the Addition scale. This was done for each participant and operation across all items. As each operation occurred on 15 test items, the resulting sum scores could vary between 0 and 15. The mean percentages of correctly identified operations are presented in Table 7.
A linear regression analysis was run to test if the HeiQ scores predicted GPA. Similarly to the analyses above, 2 separate regressions were run for the whole sample and for participants under the age of 24. The HeiQ total score significantly predicted high school GPA F (1, 470) = 78.94, p < .001. Further, R2 for the overall model was R2 = 0.14 (adjusted R2 = 0.14). For people under 24, R2 for the overall model was R2 = .23 (adjusted R2 = 0.23). This prediction was also significant F (1, 262) = 78.45, p < .001. A multiple regression was computed to test whether the operation-specific indicators led to an increase in an explained variance of GPA compared to the regression analysis for the overall test score. For people under 24, R2 increased from R2 = .23 to R2 = 0.29 (adjusted R2 = 0.27) (F (9, 254) = 11.67, p < .001). For the whole sample, R2 increased from R2 = 0.14 to R2 = 0.18 (adjusted R2 = 0.17) (F (9, 462) = 11.44, p < .001).

4. Discussion

In this study, we introduced a novel figural matrices test, the HeiQ. The test was developed to overcome construction-related shortcomings in previous matrices tests, or more specifically, to reduce the use of bypassing strategies to increase control of item difficulties, and by effect, to improve reliability and validity. These aims were achieved by adopting a systematic distractor construction approach (see Guttman and Schlesinger 1967). Because distractors were generated in accordance with a facet design, items of the HeiQ cannot be solved by counting the properties of response options. Because every correct or incorrect feature of an operation is presented equally often, none of the distractors can be eliminated without correctly applying at least one of the item’s underlying operations. Additionally, distractors were kept as visually similar to the attractor as possible, meaning that distractors and the attractor featured similar figural elements (if the correct application of an operation consisted of a circle, the incorrect responses also featured a circle, but differed, for example, in size or position). Finally, distractors were constructed so that they appeared to be plausible solutions to the item. All but one distractor features a correct application of at least one of the operations, thus guaranteeing structural similarity between distractors and the attractor. Taken together, these measures were designed to minimize the use of response elimination strategies.
The application of a systematic distractor construction approach was successful, as the HeiQ showed very good psychometric properties. The test proved to be Rasch scalable, which supports the unidimensionality of the test. This is in line with the previous research on the dimensionality of figural matrices tests (Arthur and Woehr 1993; Waschl et al. 2016). In the measurement model, factor loadings of all items could be fixed to one, meaning that all items weighed the same and suggesting that no corrections are necessary when items are combined. Consequently, the test enables the calculation of a sum score of the solved items and use of these sum scores to compare participants regarding their reasoning abilities. We have further tested a Birnbaum (2PL) model, where the probability for a person to solve an item is dependent on the ability of the person, the difficulty of the item, and an additional discrimination parameter of the item. This model fit the data better than the Rasch model. However, as the Rasch model still achieved an acceptable fit, according to conventional cut-off criteria, we preferred the more parsimonious model for our study. Furthermore, there was considerable test score variance in all sub-samples, and items of varying difficulty discriminated well between participants within all sub-samples. Both the two-operation as well as the three-operation items performed well in our test, and manipulating the number as well as the kind of operations used to construct an item seemed successful in creating items of varying difficulty. Controlling for bypassing strategies might have further enhanced the difficulty distribution of the generally easier two-operation items. Despite the fact that we collected general population and student-only sub-samples, there was no evidence of floor or ceiling effects in any sub-sample. We therefore concluded that HeiQ is a suitable tool for the assessment of reasoning abilities across different academic levels.
A high Cronbach’s alpha, Revelle’s omega total, marginal empirical reliability, and a high split-half reliability coefficient were observed for the HeiQ. The high retest-correlation speaks to the test scores’ stability over time. In sum, there is good evidence that the test scores obtained with the HeiQ are very reliable.
The HeiQ test scores correlated strongly with other intelligence measures, such as the RAPM, the BIS-S, and the I-S-T 2000R. The correlations in the different sub-samples were all between 0.58 and 0.81 in size, which is comparable with the results obtained in similar validation studies of previous figural matrices tests, for example, the HMT by Heydasch (2014). The correlations after correcting for attenuation were even higher, indicating that the HeiQ’s construct validity is excellent.
HeiQ test scores were strongly correlated with the GPA of all participants (r = −0.38) and even stronger with those of participants under the age of 24 (r = −0.48). These correlations were substantially higher than those observed with the HTM, for example (r = 0.19 and r = 0.34; see Heydasch (2014)). Furthermore, for sub-sample five that completed both the RAPM and the HeiQ, the correlation between the HeiQ and GPA was significantly higher than the correlation between the RAPM and GPA. These findings suggest that the HeiQ’s criterion-related validity is also exceptionally high.
A further advantage of our new test is that incorrect solutions can be used to assess which operations were correctly applied during the attempt to solve the item. When using operation-level scoring, the criterion-related validity of the HeiQ could be improved even further. An investigation of reasoning abilities may also be useful in order to gain better insight into the processes underlying reasoning abilities. We will elaborate on this point below as an avenue for future research.

4.1. Considerations on Bypassing Strategies Other Than Response Elimination

Although we tried to account for guessing-without-attempting-to-solve by treating overly fast responses as missing, it is not clear whether participants diligently worked on each item. This has been shown to threaten the validity of performance tests (Wise and DeMars 2010). If participants are not motivated to perform well on a test, they will either randomly choose one response option without applying any solution strategy or correctly apply one operation and then choose between the response options which feature this operation. In the latter case, participants would switch to simpler decision heuristics that they might still consider to be “good-enough”. In line with this strategy, Gonthier and Roulin (2020) pointed out that when solving matrices tests, participants apply a cost–benefit trade-off similar to satisficing in complex problem-solving heuristics (Gonthier and Roulin 2020). These authors further showed that, independent of their abilities, motivated participants will try to actively solve the matrices for a longer period than unmotivated participants, resulting in a higher test score than their peers of similar or even higher ability. The consequence of the simpler decision heuristic is that participants might sometimes attain a correct response even though they have only solved two out of three operations. This is due to the smaller number of distractors, that—in that case—include the correct features of the two operations that were solved. We are aware that this is in some way problematic, but believe there is no way to inhibit points achieved by guessing altogether. The only test type which is able to counter any kind of heuristic solution strategy is a distractor-free version of a figural matrices test introduced by Becker et al. (2014). In this computerized test, participants generate their own response by selecting figural elements from pre-existing lines and shapes and dragging them into the response field. However, distractor-free matrices tests also have their downsides. The most serious problems with these tests compared to standard multiple-choice tests are as follows: They are more difficult to implement as they require additional instructions and practice, they take more time to be solved, and there is a high variability among participants regarding how much time it takes them to solve the test, and they are more difficult to score (automatic scoring is not possible). For these reasons, we believe that the use of distractors is preferable. Further, we see that our distractor design keeps points achieved by guessing over 48 items to a minimum.

4.2. Future Applications and Opportunities of the Operation-Level Test Scoring

It has been argued that response tendencies in matrices tests can be used to identify thought processes (Laurence and Macedo 2022). In the results section, we made use of the HeiQ’s systematic distractor design to calculate test scores that supposedly reflect operation-level knowledge. These scores reflect the proportion of correctly detected and applied operations, namely, how many times a participant applied a particular operation correctly out of the total number of items that included this operation. Furthermore, an overall operation score could be computed, where every correctly identified operation is awarded one point, instead of merely scoring the complete item as being either correct or incorrect. Such a scoring procedure also takes into account how many operations were identified correctly when attending an item (i.e., zero, one, two, or three). Test scores achieved with this scoring procedure correlated more strongly with GPA than scores obtained with the simple correct/incorrect scoring. This finding suggests that these scores contain information over and above the average solution scores. The operations used in the HeiQ have shown to be of varying difficulty for the participants, which can be inferred from the large standard deviations.
One possible route for future research could be to investigate cognitive training effects in competence testing. Research has shown that, through repeated test taking, the total score of the test increases (Bors and Vigneau 2003). Bors and Vigneau (2003) have pointed out that this improvement was highly variable and not just due to participants answering more items compared to the first testing session. They further found that improvement was not due to memory effects of specific items, as participants frequently switched from the correct to incorrect response choice and vice versa. They concluded that learning relates to how items are solved and to not remembering certain items. All of this information cannot be captured by a total sum score that merely shows the number of correctly solved items. Thus, to identify determinants of cognitive performance, one needs to shift from an aggregate score to a more detailed analysis of individual differences (Bors and Vigneau 2003), and our newly developed test with the possibility of focusing on operation level changes may be a good tool for doing so.
With the HeiQ, both a change to the aggregate score and a breakdown of training effects to the individual operation level were observed and may thus be attributed to individual ability, strategies, or handling of certain operations. Researchers can also use this knowledge to analyze whether specific operations show higher learning curves than others. As all operations are included equally often, in-test training effects are assumed to be constant for each operation. Because the figural matrices test does not use verbal tasks, it may be useful for assessing reasoning within participants with restricted verbal abilities (Carpenter et al. 1990).

5. Conclusions

The HeiQ demonstrated excellent reliability as well as construct- and criterion-related validity estimates. The test successfully limits counting, and no distractor can be excluded without at least one operation being applied correctly. The underlying distractor design further encourages participants to use constructive matching as compared to bypassing strategies that are correlated with lower validity. Another excellent advantage of the current test is the possibility of forming operation-specific indicators based on a rule-based distractor analysis. Attaining a more detailed score than a sum score can aid in a more precise ability to estimate participants and diagnose their differences. The operation-specific indicators retrieved from the HeiQ showed good psychometric properties and explained more variance in external criteria than the sum scores.

Author Contributions

Conceptualization, V.S.P., D.D. and J.R.; methodology, V.S.P., D.D. and J.R.; software, V.S.P. and D.D.; validation, D.D. and J.R.; formal analysis, V.S.P. and D.D.; investigation, V.S.P., D.D. and J.R.; resources, V.S.P., D.D. and J.R.; data curation, V.S.P., D.D. and J.R.; writing—original draft preparation, V.S.P.; writing—review and editing, V.S.P., D.D. and J.R.; supervision, D.D. and J.R.; project administration, V.S.P. All authors have read and agreed to the published version of the manuscript.

Funding

This research received no external funding.

Institutional Review Board Statement

Ethical review and approval were waived for this study in accordance with university rules.

Informed Consent Statement

Informed consent was obtained from all subjects involved in this study.

Data Availability Statement

The data reported in this article can be requested from the authors.

Acknowledgments

We thank the Friedrich Naumann Foundation for providing support and granting Vanessa S. Pallentin a PhD scholarship (not used to fund the underlying study).

Conflicts of Interest

The authors declare no conflict of interest.

Appendix A

Table A1. Outfit, infit, differential item functioning, and item difficulties for all items.
ItemOutfit Mean-SquareInfit Mean-SquareDifferential Item FunctioningItem Difficulty
11.5131.3671.976 *−0.027
20.9891.0141.554−0.430
31.0200.985−1.068−0.048
40.6950.841−0.305−0.662
51.5211.3160.3730.246
60.7370.8590.384−2.395
71.1761.1170.7550.349
81.1671.1480.6020.068
91.3611.1930.397−0.882
100.9490.9591.000−1.964
110.9600.913−1.4580.947
121.0651.050−1.6630.623
130.8020.856−0.939−0.838
141.0621.068−0.935−1.413
150.9140.903−2.190 *−0.420
160.8390.924−0.701−0.407
170.7490.807−0.344−0.932
181.2271.1940.432−1.301
191.3111.0190.455−1.366
200.5900.796−0.464−1.434
211.0340.934−1.796−0.922
220.8150.855−0.821−0.228
230.8210.882−1.105−1.788
240.6720.752−2.559 *0.078
251.1171.0942.307 *−0.344
260.9830.932−1.878−1.012
270.8510.930−1.360−0.668
280.8950.937−0.8480.548
290.8680.895−0.673−0.913
301.4371.2150.1221.146
311.2351.141−0.239−0.061
320.8850.895−1.8360.546
330.9781.0051.361−1.145
341.0581.007−1.102−0.494
351.6661.3966.102 *−0.437
360.8090.877−0.881−0.386
370.8460.890−0.3350.212
381.4351.330−0.1180.136
390.7830.837−1.425−0.073
400.7800.815−0.1370.039
410.6970.765−0.9680.481
421.1090.9980.9670.395
430.9771.0371.196−0.678
440.7650.8020.8260.308
450.9360.9862.588 *−0.204
460.8560.8962.396 *−0.221
470.9700.9751.006−0.206
480.9570.9662.155 *−0.213
Note: * = p < .05.
Table A2. Descriptive statistics and correlations of all measures.
MeasureMSDRangeSkewnessCurtosis123.13.2
HeiQ26.8710.683–470.04−1.03
BIS-S97.6318.2355–145−0.27−0.300.58 *** (0.70)
I-S-T 2000R
 Reasoning113.5321.8962–153−0.18−0.640.73 *** (0.79)-
 Knowledge54.7211.7621–78−0.42−0.090.43 ** (0.47)-0.53 *** (0.58)
RAPM23.646.589–35−0.34−0.900.81 *** (0.90)-0.73 *** (0.81)0.36 ** (0.41)
Note: The correlations with the HeiQ differ in sample size, as they refer to different sub-samples. They are as follows: HeiQ and BIS-S N = 215; HeiQ and I-S-T 2000R and RAPM N = 76. Descriptions of the HeiQ are given based on the whole sample. As no participant took the I-S-T 2000R and the BIS/RAPM, there are no correlations for this field. The numbers in brackets refer to the correlations corrected for attenuation. ** p < 0.01, *** p < 0.001

References

  1. Arendasy, Martin E., and Markus Sommer. 2013. Reducing response elimination strategies enhances the construct validity of figural matrices. Intelligence 41: 234–43. [Google Scholar] [CrossRef]
  2. Arthur, Winfred, and David J. Woehr. 1993. A confirmatory factor analytic study examining the dimensionality of the Raven’s Advanced Progressive Matrices. Educational and Psychological Measurement 53: 471–78. [Google Scholar] [CrossRef]
  3. Beauducel, André, and Martin Kersting. 2002. Fluid and crystallized intelligence and the Berlin Model of Intelligence Structure (BIS). European Journal of Psychological Assessment 18: 97–112. [Google Scholar] [CrossRef]
  4. Becker, Nicolas, Franzis Preckel, Julia Karbach, Nathalie Raffel, and Frank M. Spinath. 2014. Die Matrizenkonstruktionsaufgabe. Diagnostica 61: 22–33. [Google Scholar] [CrossRef]
  5. Becker, Nicolas, Florian Schmitz, Anke Falk, Jasmin Feldbrügge, Daniel R. Recktenwald, Oliver Wilhelm, Franzis Preckel, and Frank M. Spinath. 2016. Preventing Response Elimination Strategies Improves the Convergent Validity of Figural Matrices. Journal of Intelligence 4: 2. [Google Scholar] [CrossRef]
  6. Beißert, Hanna, Meike Köhler, Marina Rempel, and Constanze Beierlein. 2015. Eine Deutschsprachige Kurzskala zur Messung des Konstrukts Need for Cognition (NFC-K). Mannheim: GESIS—Leibniz-Institut für Sozialwissenschaften. [Google Scholar] [CrossRef]
  7. Bethell-Fox, Charles E., David F. Lohman, and Richard E. Snow. 1984. Adaptive reasoning: Componential and eye movement analysis of geometric analogy performance. Intelligence 8: 205–38. [Google Scholar] [CrossRef]
  8. Bors, Douglas A., and François Vigneau. 2003. The effect of practice on Raven’s Advanced Progressive Matrices. Learning and Individual Differences 13: 291–312. [Google Scholar] [CrossRef]
  9. Brown, Anna, and Tim J. Croudace. 2015. Scoring and estimating score precision using multidimensional IRT models. In Handbook of Item Response Theory Modeling: Applications to Typical Performance Assessment. Multivariate Applications Series; New York: Routledge/Taylor & Francis Group, pp. 307–33. [Google Scholar]
  10. Cacioppo, John T., and Richard E. Petty. 1982. The need for cognition. Journal of Personality and Social Psychology 42: 116–31. [Google Scholar] [CrossRef]
  11. Carpenter, Patricia A., Marcel A. Just, and Peter Shell. 1990. What one intelligence test measures: A theoretical account of the processing in the Raven Progressive Matrices Test. Psychological Review 97: 404–31. [Google Scholar] [CrossRef]
  12. Case, Susan, and David Swanson. 2002. Constructing Written Test Questions for the Basic and Clinical Sciences. Philadelphia: National Board of Examiners. [Google Scholar]
  13. Cattell, Raymond B. 1963. Theory of fluid and crystallized intelligence: A critical experiment (No. 1). Journal of Educational Psychology 54: 1–22. [Google Scholar] [CrossRef]
  14. Danner, Daniel, Dirk Hagemann, Andrea Schankin, Marieke Hager, and Joachim Funke. 2011. Beyond IQ: A latent state trait analysis of general intelligence, dynamic decision making, and implicit learning. Intelligence 39: 323–34. [Google Scholar] [CrossRef]
  15. Deary, Ian J., Steve Strand, Pauline Smith, and Cres Fernandes. 2007. Intelligence and educational achievement. Intelligence 35: 13–21. [Google Scholar] [CrossRef]
  16. Formann, Anton K. 1973. Die Konstruktion eines neuen Matrizentest und die Untersuchung des Lösungsverhaltens mit Hilfe des Linearen Logistischen Testmodells. Unpublished Ph.D. dissertation, Universität Wien, Vienna, Austria. [Google Scholar]
  17. Formann, Anton K., and Karl Piswanger. 1979. WMT Wiener Matrizen-Test. Weinheim: Beltz. [Google Scholar]
  18. Forthmann, Boris, Natalie Förster, Birgit Schütze, Karin Hebbecker, Janis Flessner, Martin T. Peters, and Elmar Souvignier. 2020. How Much g Is in the Distractor? Re-Thinking Item-Analysis of Multiple-Choice Items. Journal of Intelligence 8: 11. [Google Scholar] [CrossRef]
  19. Freund, Philipp A., Stefan Hofer, and Heinz Holling. 2008. Explaining and Controlling for the Psychometric Properties of Computer-Generated Figural Matrix Items. Thousand Oaks: SAGE Publications, Applied Psychological Measurement 32. [Google Scholar]
  20. Gierl, Mark J., Okan Bulut, Qi Guo, and Xinxin Zhang. 2017. Developing, Analyzing, and Using Distractors for Multiple-Choice Tests in Education: A Comprehensive Review. Review of Educational Research 87: 1082–116. [Google Scholar] [CrossRef]
  21. Gonthier, Corentin, and Jean-Luc Roulin. 2020. Intraindividual strategy shifts in Raven’s matrices, and their dependence on working memory capacity and need for cognition. Journal of Experimental Psychology: General 149: 564–79. [Google Scholar] [CrossRef]
  22. Gottfredson, Linda S., and Ian J. Deary. 2004. Intelligence Predicts Health and Longevity, but Why? (No. 1). Oxford: Blackwell Publishing, Current Directions in Psychological Science 13. [Google Scholar]
  23. Guttman, Louis, and I. M. Schlesinger. 1967. Systematic Construction of Distractors for Ability and Achievement Test Items. Educational and Psychological Measurement 27: 569–80. [Google Scholar] [CrossRef]
  24. Haladyna, Thomas M., and Michael Rodriguez. 2013. Developing and Validating Test Items. London: Routledge. [Google Scholar] [CrossRef]
  25. Haladyna, Thomas M., and Steven M. Downing. 1989. A Taxonomy of Multiple-Choice Item-Writing Rules. Applied Measurement in Education 2: 37–50. [Google Scholar] [CrossRef]
  26. Haladyna, Thomas M., Steven M. Downing, and Michael C. Rodriguez. 2002. A review of multiple-choice item-writing guidelines for classroom assessment. Applied Measurement in Education 15: 309–34. [Google Scholar] [CrossRef]
  27. Hayes, Taylor R., Alexander A. Petrov, and Per B. Sederberg. 2011. A novel method for analyzing sequential eye movements reveals strategic influence on Raven’s Advanced Progressive Matrices. Journal of Vision 11: 10. [Google Scholar] [CrossRef]
  28. Heydasch, Timo. 2014. The Hagen Matrices Test (HMT). DataCite, Unpublished. [Google Scholar]
  29. Horn, John L. 1968. Organization of abilities and the development of intelligence. Psychological Review 75: 242–59. [Google Scholar] [CrossRef] [PubMed]
  30. Horn, John L., and Raymond B. Cattell. 1967. Age Differences in Fluid and Crystallized Intelligence (No. 2). Amsterdam: Elsevier Science. [Google Scholar]
  31. Hornke, Lutz F., and Michael W. Habon. 1986. Rule-Based Item Bank Construction and Evaluation Within the Linear Logistic Framework. Applied Psychological Measurement 10: 369–80. [Google Scholar] [CrossRef]
  32. Hornke, Lutz F., Anja Küppers, and Stefan Etzel. 2000. Konstruktion und Evaluation eines adaptiven Matrizentests. Diagnostica 46: 182–88. [Google Scholar] [CrossRef]
  33. Hossiep, Rüdiger, Daniela Turck, and Michele Hasella. 1999. BOMAT—Advanced—Bochumer Matrizentest. Goettingen: Hogrefe. [Google Scholar]
  34. Hu, Li-tze, and Peter M. Bentler. 1999. Cutoff criteria for fit indexes in covariance structure analysis: Conventional criteria versus new alternatives. Structural Equation Modeling: A Multidisciplinary Journal 6: 1–55. [Google Scholar] [CrossRef]
  35. Jäger, Adolf Otto, Heinz-Martin Süß, and André Beauducel. 1997. Mehrdimensionale Intelligenzdiagnostik Mit Dem “Berliner Intelligenzstruktur-Test” (BIS-Test, Form 4). Goettingen: Hogrefe Verlag für Psychologie. [Google Scholar]
  36. Jarosz, Andrew F., and Jennifer Wiley. 2012. Why does working memory capacity predict RAPM performance? A possible role of distraction. Intelligence 40: 427–38. [Google Scholar] [CrossRef]
  37. Jendryczko, David, Jana Scharfen, and Heinz Holling. 2019. The Impact of Situational Test Anxiety on Retest Effects in Cognitive Ability Testing: A Structural Equation Modeling Approach. Journal of Intelligence 7: 22. [Google Scholar] [CrossRef]
  38. Klauer, Karl-Josef, ed. 1978. Handbuch der Pädagogischen Diagnostik. Düsseldorf: Pädagogischer Verlag Schwann. [Google Scholar]
  39. La Torre, Jimmy de, and Tzur Karelitz. 2009. Impact of diagnosticity on the adequacy of models for cognitive diagnosis under a linear attribute structure: A simulation study. Journal of Educational Measurement 46: 450–69. [Google Scholar] [CrossRef]
  40. Laurence, Paulo G., and Elizeu C. Macedo. 2022. Cognitive strategies in matrix-reasoning tasks: State of the art. Psychonomic Bulletin & Review. [Google Scholar] [CrossRef]
  41. Leiner, D. J. 2019. SoSci Survey (version 3.4.03). Computer Software. Available online: https://www.soscisurvey.de (accessed on 15 September 2020).
  42. Liepmann, Detlev, André Beauducel, Burkhard Brocke, and Rudolf Amthauer. 2001. Intelligenz-Struktur-Test 2000 R. I-S-T 2000 R—[Intelligence Structure Test 2000 R]. Göttingen: Hogrefe. [Google Scholar]
  43. Marshalek, Brachia, David F. Lohman, and Richard E. Snow. 1983. The complexity continuum in the radex and hierarchical models of intelligence. Intelligence 7: 107–27. [Google Scholar] [CrossRef]
  44. McGrew, Kevin S. 2009. CHC theory and the human cognitive abilities project: Standing on the shoulders of the giants of psychometric intelligence research. Intelligence 37: 1–10. [Google Scholar] [CrossRef]
  45. McNeish, Daniel. 2018. Thanks coefficient alpha, we’ll take it from here. Psychological Methods 23: 412–33. [Google Scholar] [CrossRef] [PubMed]
  46. Meng, Xiao-Li, Robert Rosenthal, and Donald B. Rubin. 1992. Comparing correlated correlation coefficients. Psychological Bulletin 111: 172–75. [Google Scholar] [CrossRef]
  47. Mittring, Gert, and Detlef H. Rost. 2008. Die verflixten Distraktoren. Diagnostica 54: 193–201. [Google Scholar] [CrossRef]
  48. Muthén, Linda K., and Bengt O. Muthén. 2017. Mplus User’s Guide, 8th ed. Los Angeles: Muthén & Muthén. [Google Scholar]
  49. Naglieri, Jack A. 2003. NNAT Naglieri Nonverbal Ability Test. Individual Administration. Stimulus Book. San Antonio: The Psychological Corporation. [Google Scholar]
  50. Pohl, Steffi, Linda Gräfe, and Norman Rose. 2013. Dealing With Omitted and Not-Reached Items in Competence Tests: Evaluating Approaches Accounting for Missing Responses in Item Response Theory Models. Educational and Psychological Measurement 74: 423–52. [Google Scholar] [CrossRef]
  51. Preckel, Franzis. 2003. Diagnostik Intellektueller Hochbegabung: Testentwicklung zur Erfassung der Fluiden Intelligenz. Zugl.: Münster, University, Diss. 2002 u.d.T.: Preckel. Franzis: Regelgeleitete Entwicklung eines figuralen Matrizentests zur Erfassung intellektueller Hochbegabung, Hochbegabung. Göttingen: Hogrefe Verl. für Psychologie. [Google Scholar]
  52. Rammstedt, Beatrice, Christoph Kemper, Mira Klein, Constanze Beierlein, and A. Kovaleva. 2012. Eine kurze Skala zur Messung der fünf Dimensionen der Persönlichkeit: Big-Five-Inventory-10 (BFI-10) (GESIS Working Papers 2012|23). Köln: GESIS. [Google Scholar]
  53. Rasch, Georg. 1960. Studies in Mathematical Psychology: I. Probabilistic Models for Some Intelligence and Attainment Tests. New York: Nielsen & Lydiche. [Google Scholar]
  54. Raven, John C. 1976. Advanced Progressive Matrices, Set II. New York: Oxford University Press. [Google Scholar]
  55. Raven, John C., John H. Court, and Jean Raven. 1994. Manual for Raven’s Progressive Matrices and Mill Hill Vocabulary Scales. In Advanced Progressive Matrices. New York: Oxford Psychologists Press. [Google Scholar]
  56. Schmidt, Frank L., and John Hunter. 2004. General mental ability in the world of work: Occupational attainment and job performance. Journal of Personality and Social Psychology 86: 162–73. [Google Scholar] [CrossRef]
  57. Schneider, W. Joel, and Kevin S. McGrew. 2012. The Cattell-Horn-Carroll model of intelligence. In Contemporary Intellectual Assessment: Theories, Tests, and Issues, 3rd ed. New York: The Guilford Press, pp. 99–144. [Google Scholar]
  58. Schott, Franz, and Hans-Jürgen W. Wieberg. 1984. Regelgeleitete Itemkonstruktion [Rule-governed construction of items.]. Diagnostica 30: 47–66. [Google Scholar]
  59. Storme, Martin, Nils Myszkowski, Simon Baron, and David Bernard. 2019. Same Test, Better Scores: Boosting the Reliability of Short Online Intelligence Recruitment Tests with Nested Logit Item Response Theory Models. Journal of Intelligence 7: 17. [Google Scholar] [CrossRef] [PubMed]
  60. Tarrant, Marie, James Ware, and Ahmed M. Mohammed. 2009. An assessment of functioning and non-functioning distractors in multiple-choice questions: A descriptive analysis. BMC Medical Education 9: 40. [Google Scholar] [CrossRef]
  61. The International Cognitive Ability Resource Team. 2014. Available online: https://icar-project.com/ (accessed on 6 April 2023).
  62. Undeutsch, Nicole. 2010. Zwei neue Subtests für das “Self-Assessment” Psychologie Durch Regelgeleitete Konstruktion. Wien: Diplomarbeit, Universität Wien, DataCite. [Google Scholar]
  63. Waschl, Nicolette A., Ted Nettelbeck, Simon A. Jackson, and Nicholas R. Burns. 2016. Dimensionality of the Raven’s Advanced Progressive Matrices: Sex differences and visuospatial ability. Personality and Individual Differences 100: 157–66. [Google Scholar] [CrossRef]
  64. Wheaton, Blair, Bengt Muthén, Duane F. Alwin, and Gene F. Summers. 1977. Assessing Reliability and Stability in Panel Models. Sociological Methodology 8: 84–136. [Google Scholar] [CrossRef]
  65. Wise, Steven L. 2017. Rapid-Guessing Behavior: Its Identification, Interpretation, and Implications. Educational Measurement: Issues and Practice 36: 52–61. [Google Scholar] [CrossRef]
  66. Wise, Steven L., and Christine E. DeMars. 2010. Examinee Noneffort and the Validity of Program Assessment Results. Educational Assessment 15: 27–41. [Google Scholar] [CrossRef]
  67. Yu, Ching-Yun. 2002. Evaluating Cutoff Criteria of Model Fit Indices for Latent Variable Models with Binary and Continuous Outcomes. Doctoral dissertation, University of California, Los Angeles, CA, USA. [Google Scholar]
Figure 1. Illustration of a typical (easy) matrices test item. This test item is taken from the practice item section of our newly developed figural matrices test. In this example item, response option a is correct and options b to i are incorrect. Both operations used to construct the figures are vertically applied. The two central elements of the two figures on the left and in the middle are combined to form the third figure in each matrix row, while the black dot rotates clockwise in steps of 90 degrees from left to right.
Jintelligence 11 00073 g001
Figure 2. Overview of the eight operations that are used to construct the items. See (Hornke and Habon 1986) for a similar example.
Jintelligence 11 00073 g002
Figure 3. This example item features the three operations Identification, Addition, and Seriation. Response option f correctly follows all operations and hence completes the item stem.
Jintelligence 11 00073 g003
Table 1. Sub-sample specific demographics and assessed measures.
Sub-Sample NAgeGender
(Female (%))
PopulationLocationCognitive MeasuresAdditional QuestionnairesAcademic
MSD
115523.815.49112 (72.3)UniversityOnline
210724.183.4272 (67.3)University of Applied SciencesOnline NFCGPA
312624.664.4792 (73.0)University of Applied SciencesOnline NFCGPA
421626.0211.18136 (63.0)University and general populationIn personBIS-SNFCGPA
57933.8113.5440 (50.6)General populationOnlineI-S-T 2000R
RAPM
NFCGPA
Note: NFC: Need for Cognition. GPA: Grade point average for high school and university degree (if applicable). BIS-S = Berlin Intelligence Structure Test Short Form. I-S-T 2000R = Intelligence Structure Test 2000R. RAPM = Raven Advanced Progressive Matrices.
Table 2. Distractors and their correct/incorrect setup of underlying operations for the example item.
Response OptionAdditionIdentificationSeriationOperations Correct
A0112
B1001
C0101
D1012
E0011
F1113
G1102
H0000
Note: Response option labels refer to the letter assigned in Figure 3. The number 1 is used to specify that the operation is correctly displayed in the response option, the number 0 when the operation is incorrectly displayed. Response option f is the correct response; hence, all three operations are correctly displayed.
Table 3. Percentage correctly solved and missing responses per item.
ItemCorrectly Solved
(in %)
Valid Responses
(N)
150.66677
260.59680
351.19670
466.03680
543.91681
693.27683
741.38679
848.32683
970.90677
1089.00682
1127.71682
1234.85680
1369.96679
1481.11683
1560.35681
1660.03683
1771.98678
1879.18682
1980.32681
2081.47680
2171.76680
2255.67670
2386.78681
2448.07672
2558,49677
2673.63675
2766.17677
2836.61672
2971.58665
3023.72662
3151.51662
3236.67660
3376.28666
3462.11665
3560.76660
3659.51657
3744.73626
3846.63489
3951.81635
4049.03620
4138.21602
4240.27596
4366.39607
4442.37557
4555.06563
4655.50564
4755.12557
4855.29539
Note: Percentage correctly solved refers to the people who attempted the item (excluding missing responses).
Table 4. Model fit indices for Rasch measurement model.
Modelχ2dfpCFIRMSEAχ2/df
3542.681127<.0010.880.0563.14
Note: CFI = comparative fit index; RMSEA = root mean square error of approximation; N = 683.
Table 5. Correlations between the HeiQ and intelligence measures.
Variable Sample Size (N)Correlation
RAPM 760.81 *** (0.90)
BIS-S 2150.58 *** (0.70)
I-S-T 2000R 76
Reasoning
Overall 0.73 *** (0.79)
Verbal 0.42 *** (0.49)
Numeric 0.66 *** (0.71)
Figural 0.63 *** (0.79)
Knowledge
Overall 0.43 ** (0.47)
Verbal 0.23 (0.27)
Numeric 0.51 *** (0.61)
Figural 0.39 *** (0.48)
Note: RAPM = Raven Advanced Progressive Matrices; BIS-S = Berlin Intelligence Structure Test Short Form; I-S-T 200R = Intelligence Structure Test 2000R. The numbers in parentheses refer to the correlations corrected for attenuation. ** p < .01, *** p < .001.
Table 6. Correlations between HeiQ scores and academic achievement indicators.
Variable Sample SizeCorrelation
High School
GPA472 (264)−0.38 *** (−0.48 ***)
Mathematics194 (126)0.48 *** (48 ***)
German192 (125)0.20 ** (0.22 *)
English186 (118)0.17 * (0.20 *)
Biology142 (91)0.32 ***(0.44 ***)
Arts107 (64)0.08 (0.17)
Note: Numbers in parentheses refer to participants under the age of 24. * p < .05, ** p < .01, *** p < .001.
Table 7. Mean, standard deviation, Cronbach’s alpha, and correlations among operation indicators.
OperationMSDAlpha1234567HeiQBIS
Addition81.6915.230.68 0.74 *** (0.93)0.38 *** (0.51)
Subtraction77.8619.510.770.67 0.83 *** (0.98)0.55 *** (0.70)
Identification91.9311.080.660.610.62 0.55 *** (0.70)0.32 *** (0.44)
Variation of Open Gestalts77.9516.380.640.630.640.61 0.72 *** (0.93)0.42 *** (0.58)
Variation of Closed Gestalts78.0515.980.620.620.630.560.65 0.72 *** (0.95)0.40 *** (0.56)
Intersection63.4420.210.690.580.650.470.560.54 0.81 *** (0.99)0.42 *** (0.56)
Unique Addition61.7924.440.800.610.720.500.590.560.72 0.84 *** (0.97)0.51 *** (0.63)
Seriation76.6019.160.730.650.720.570.640.620.660.690.80 *** (0.97)0.53 *** (0.69)
Note: Variation of Closed Gestalts, Unique Addition, and Seriation only consist of 14 items for N = 155 people, since 1 item was erroneous and had been excluded from analysis. The numbers in parentheses refer to the correlations corrected for attenuation. *** p < .001.
Disclaimer/Publisher’s Note: The statements, opinions and data contained in all publications are solely those of the individual author(s) and contributor(s) and not of MDPI and/or the editor(s). MDPI and/or the editor(s) disclaim responsibility for any injury to people or property resulting from any ideas, methods, instructions or products referred to in the content.

