Computer-Based Intervention Closes Learning Gap in Maths Accumulated in Remote Learning


Abstract
:1. Introduction
2. Aspects of Designing an Effective Computer-Based Intervention Programme for Students
3. Aim and Research Questions
4. Methods
4.1. Participants
4.2. Instruments
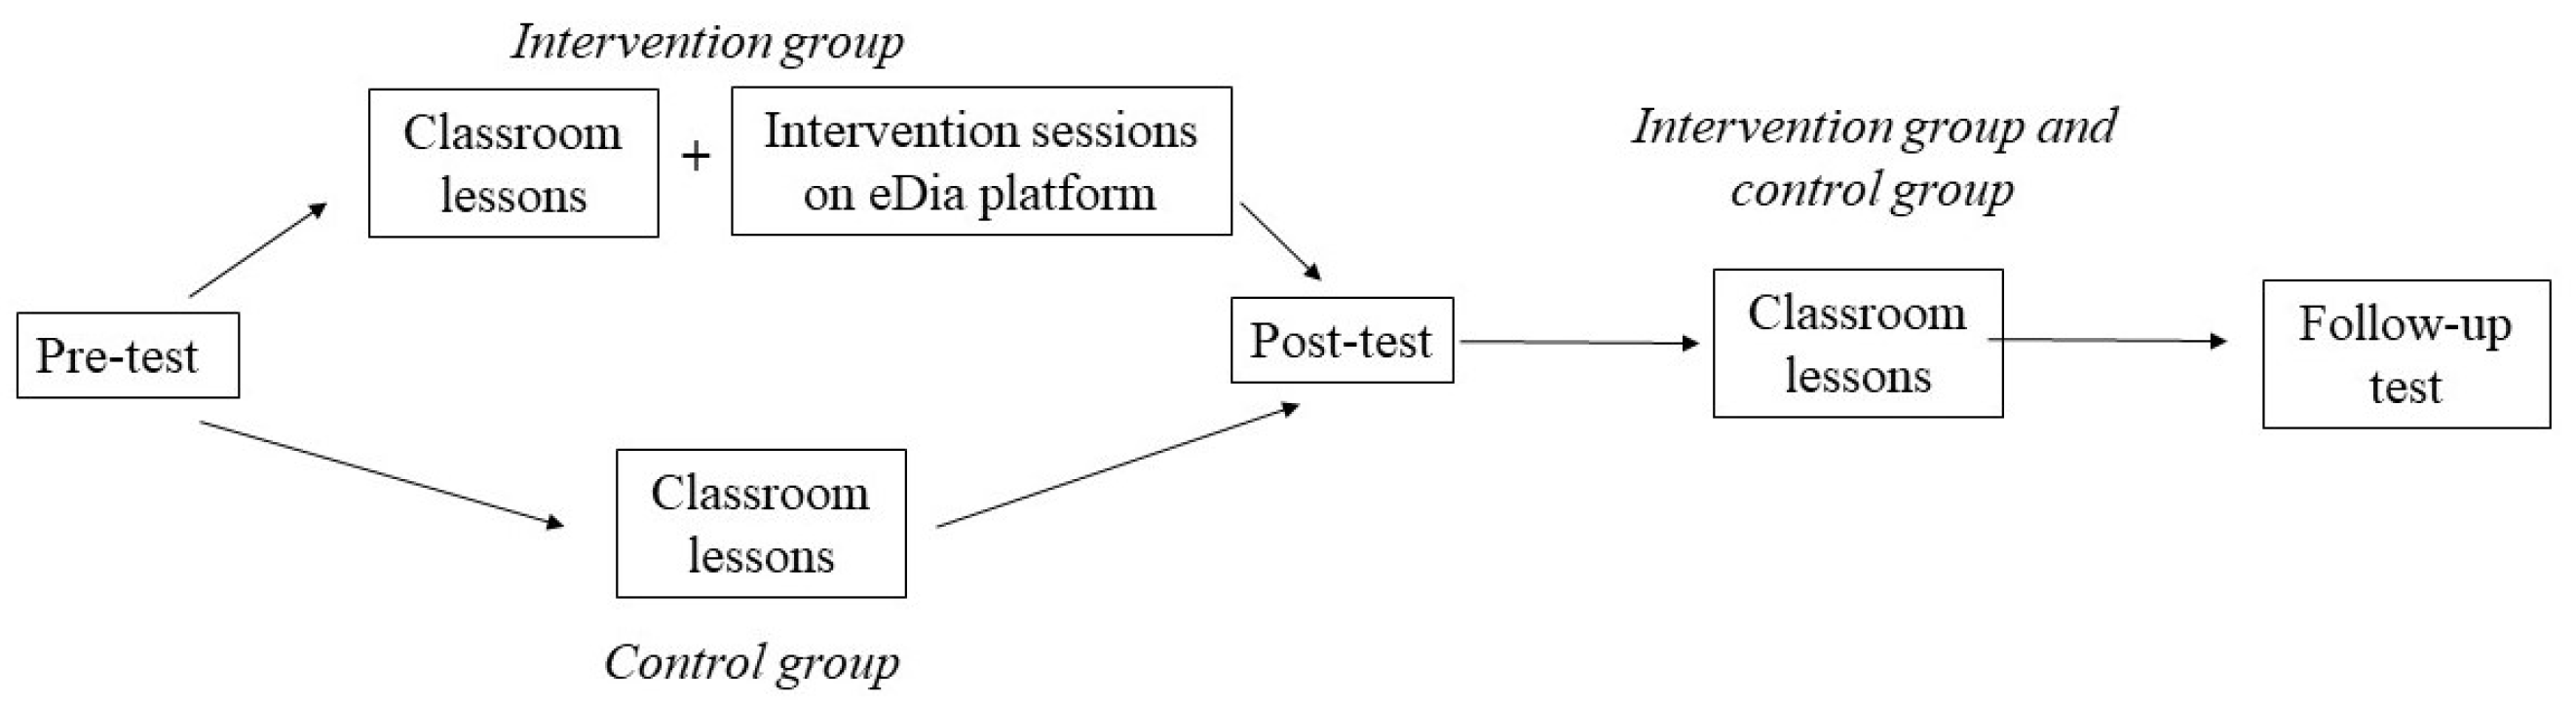
4.3. Design
4.4. Procedures
5. Results
5.1. Results for Research Question 1 (RQ1)
- RQ1: How effectively can a computer-based intervention programme for mathematical reasoning develop basic maths skills among pupils aged 9 to 11 in the short and longer term (i.e., assessed in the post- and follow-up tests)?
5.2. Results for Research Question 2 (RQ2)
- RQ2: How does the intervention programme impact on the mathematical skills of third and fourth graders with different educational backgrounds and experience in the short and longer term?
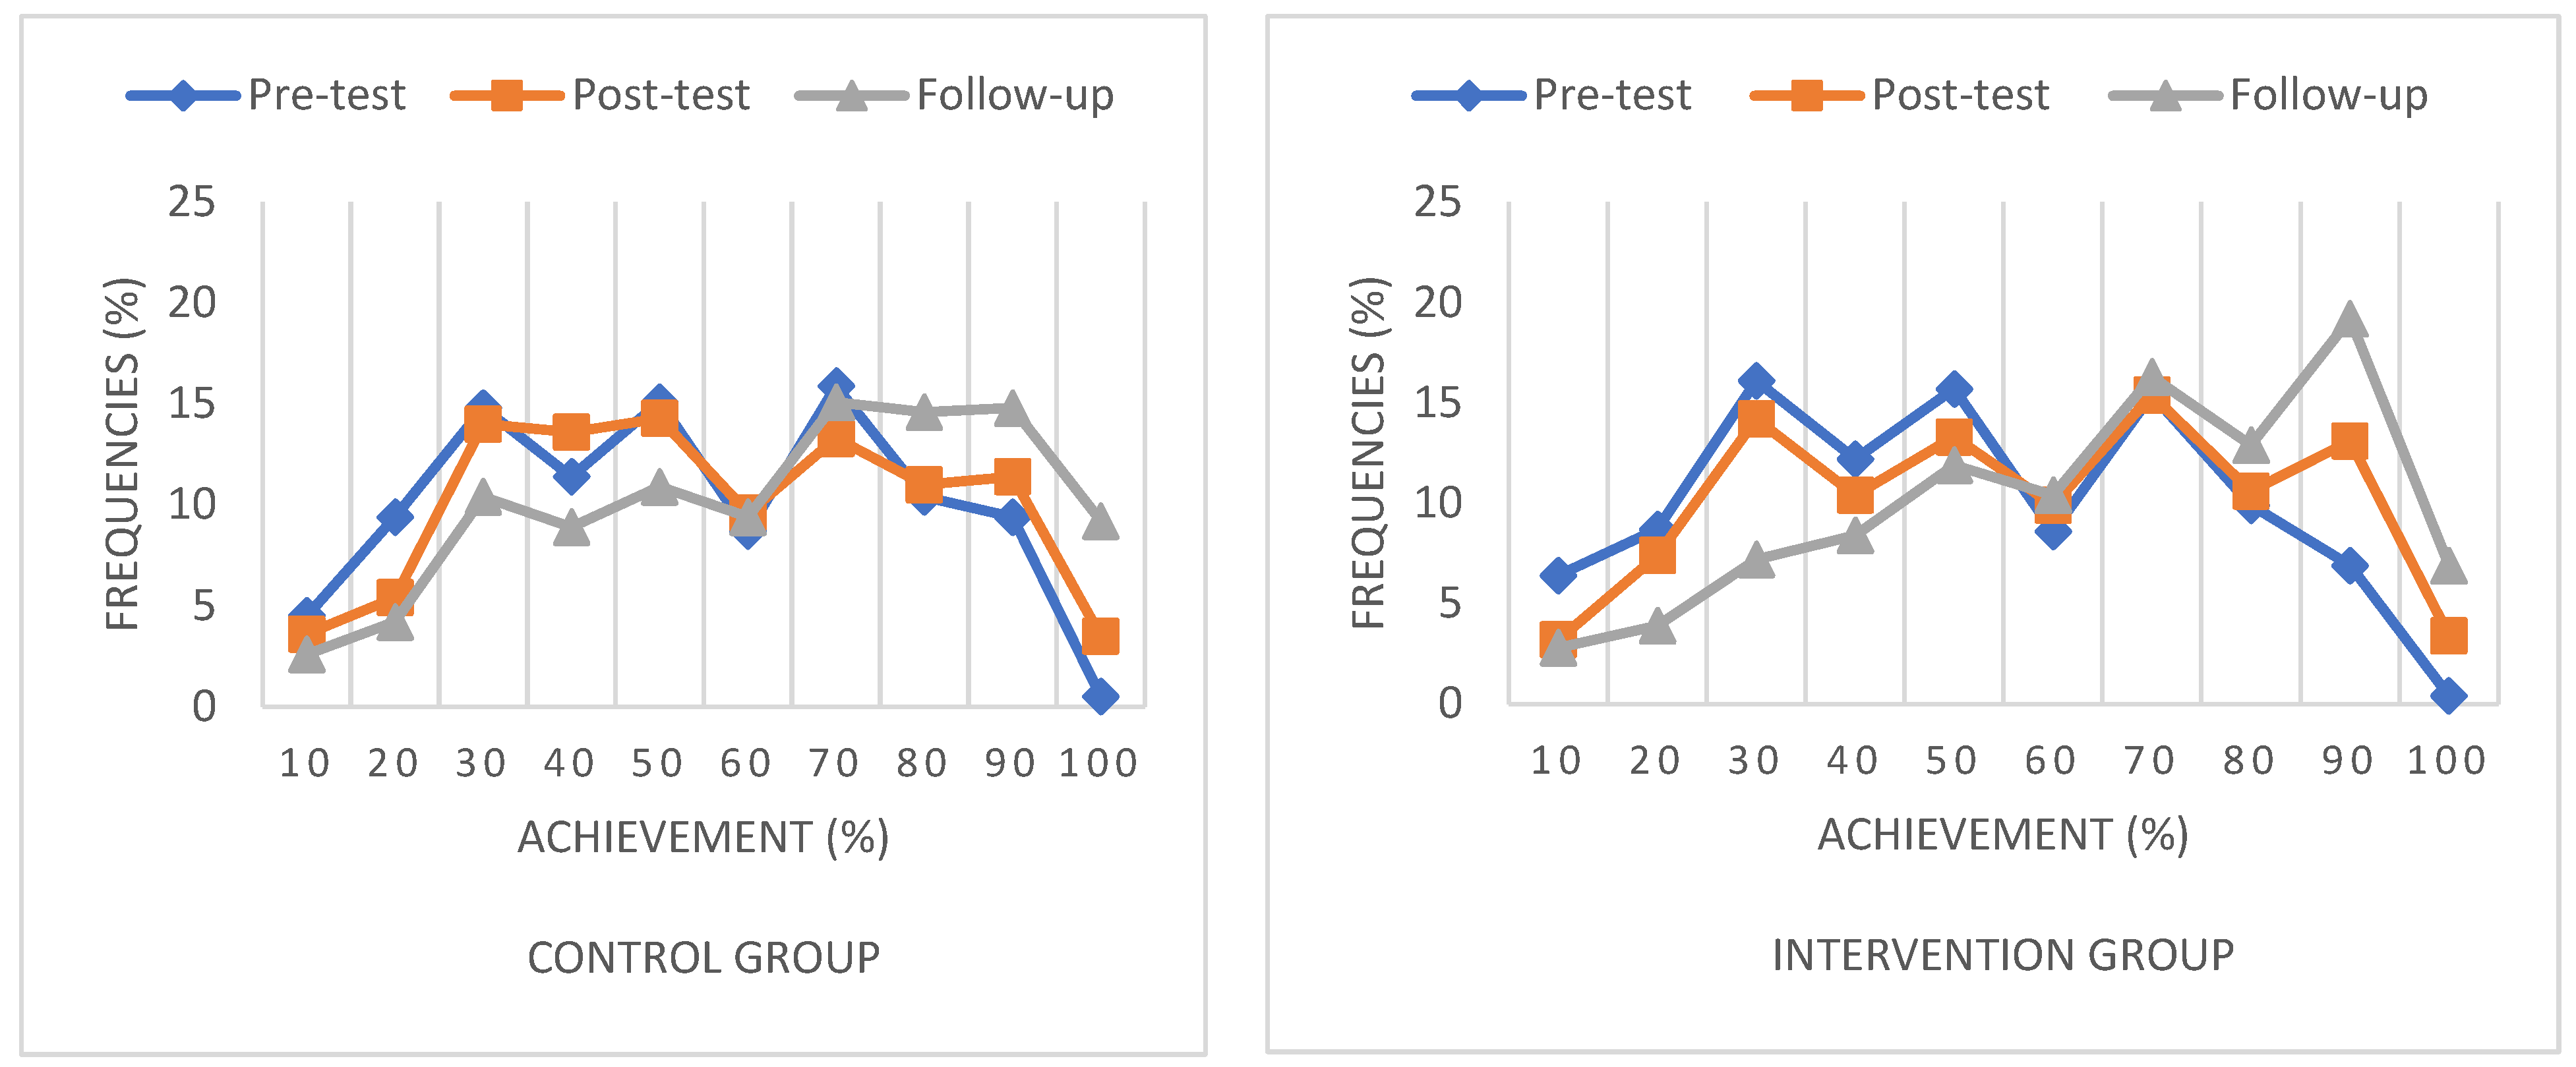
5.3. Results for Research Question 3 (RQ3)
- RQ3: What changes can be observed in the distribution of pupils’ performances in the pre-, post- and follow-up tests?
5.4. Results for Research Question 4 (RQ4)
- RQ4: What are the short and long-term impacts on pupils’ thinking skills needed to understand the concept of multiplication and division and to solve specific word problems?
5.5. Results for Research Question 5 (RQ5)
- RQ5: Which starting level of mathematical reasoning is the most sensitive to the intervention programme in the short and longer term?
5.6. Results for Research Question 6 (RQ 6)
- RQ6: How generalizable are the results at skill and sub-skills level? Are the effects proven by the project confirmed by latent level analyses using a latent change model in the intervention group and a no-change model in the control group?
6. Discussion
7. Conclusions
8. Limitations and Further Studies
Author Contributions
Funding
Institutional Review Board Statement
Informed Consent Statement
Data Availability Statement
Conflicts of Interest
References
- Alessandri, Guido, Antonio Zuffianò, and Enrico Perinelli. 2017. Evaluating intervention programs with apretest-posttest design: A structural equation modeling approach. Frontiers in Psychology 8: 223. [Google Scholar] [CrossRef] [PubMed]
- Benavides-Varela, Silvia, Claudio Zandonella Callegher, Barbara Fagiolini, Irene Leo, Gianmarco Altoè, and Daniela Lucageli. 2020. Effectiveness of digital-based interventions for children with mathematical learning difficulties: A meta-analysis. Computers and Education 157: 103953. [Google Scholar] [CrossRef]
- Blaskó, Zsuzsa, Patricia da Costa, and Sylke V. Scnepf. 2021. Learning Loss and Educational Inequalities in Europe: Mapping the Potential Consequences of the COVID-19 Crisis. Bonn: IZA Institute of Labor Economics, Unpublished Manuscript. Available online: https://www.iza.org/publications/dp/14298/learning-loss-and-educational-inequalities-in-europe-mapping-the-potential-consequences-of-the-covid-19-crisis (accessed on 5 July 2021).
- Capone, Roberto, Federica Filiberti, and Alice Lemmo. 2021. Analyzing Difficulties in Arithmetic Word Problem Solving: An Epistemological Case Study in Primary School. Education Sciences 11: 596. [Google Scholar] [CrossRef]
- Chen, Fang Fang. 2007. Sensitivity of Goodness of Fit Indexes to Lack of Measurement Invariance. Structural Equation Modeling. A Multidisciplinary Journal 14: 464–504. [Google Scholar] [CrossRef]
- Choppin, Jeffrey, and Zenon Borys. 2017. Trends in the design, development and use of digital curriculum materials. ZDM: The International Journal on Mathematics Education 49: 663–74. [Google Scholar] [CrossRef]
- Cohen, Jacob. 1988. Statistical Power Analysis for the Behavioral Sciences, 2nd ed. Hillsdale: Lawrence Erlbaum Associates. [Google Scholar]
- Csapó, Benő, and Gyöngyvér Molnár. 2019. Online diagnostic assessment in support of personalized teaching and learning: The eDia system. Frontiers in Psychology 10: 1522. [Google Scholar] [CrossRef]
- Csapó, Benő, András Lőrincz, and Gyöngyvér Molnár. 2012a. Innovative assessment technologies in educational games designed for young students. In Assessment in Game-Based Learning: Foundations, Innovations, and Perspectives. Edited by Dirk Ifenthaler, Deniz Eseryel and Xun Ge. New York: Springer, pp. 235–54. [Google Scholar] [CrossRef]
- Csapó, Benő, John Ainley, Randy E. Bennett, Thibaud Latour, and Nancy Law. 2012b. Technological issues for computer-based assessment. In Assessment and Teaching of 21st Century Skills. Edited by Patrick Griffin, Barry McGaw and Esther Care. New York: Springer, pp. 143–230. [Google Scholar] [CrossRef]
- Cuban, Larry. 2001. Oversold and Underused. Computers in the Classroom. Cambridge: Harvard University. [Google Scholar]
- Dorn, Emma, Bryan Hancock, Jimmy Sarakatsannis, and Ellen Viruleg. 2020. COVID-19 and Learning Loss—Disparities Grow, and Students Need Help. December 8. Available online: https://www.mckinsey.com/industries/publi-and-social-sector/ourinsights/covid-19-and-learning-loss-disparities-grow-and-students-need-help (accessed on 29 June 2021).
- Engzell, Per, Arun Frey, and Mark D. Verhagen. 2021. Learning loss due to school closures during the COVID-19 pandemic. Proceedings of the National Academy of Sciences of the United States of America 118: 1–7. [Google Scholar] [CrossRef] [PubMed]
- Gaffney, Michael. 2010. Enhancing Teachers’ Take-Up of Digital Content: Factors and Design Principles in Technology Adoption. Melbourne: Education Services Australia. Available online: https://www.semanticscholar.org/paper/Enhancing-Teachers’-Take-up-of-Digital-Content%3A-and-Gaffney/74c2ca8e261c10a209cb6e1929a6162682b991f3?sort=relevance&citedPapersSort=relevance&citedPapersLimit=10&citedPapersOffset=10 (accessed on 20 January 2021).
- Gore, Jennifer, Leanne Fray, Andrew Miller, Jess Harris, and Wendy Taggart. 2021. The impact of COVID-19 on student learning in New South Wales primary schools: An empirical study. The Australian Educational Researcher 48: 605–37. [Google Scholar] [CrossRef]
- Hanson, Katherine, and Bethany Carlson. 2005. Effective Access: Teachers’ Use of Digital Resources in STEM Teaching; Waltham: Education Development Center. Available online: https://eric.ed.gov/?id=ED485602 (accessed on 27 June 2021).
- Kline, Rex B. 2016. Principles and Practice of Structural Equation Modeling, 4th ed. New York: The Guilford Press. [Google Scholar]
- Kliziene, Irina, Grazina Taujanskiene, Aldona Augustiniene, Berita Simonaitiene, and Gintautas Cibulskas. 2021. The Impact of the Virtual Learning Platform EDUKA on the Academic Performance of Primary School Children. Sustainability 13: 2268. [Google Scholar] [CrossRef]
- Kuhfeld, Megan, Jim Soland, Beth Tarasawa, Angela Johnson, Erik Ruzek, and Karyn Lewis. 2020. How Is COVID-19 Affecting Student Learning? Initial Findings from Fall 2020. Washington, DC: Brookings Institution. Available online: https://www.brookings.edu/blog/brown-center-chalkboard/2020/12/03/how-is-covid-19-affecting-student-learning/ (accessed on 11 January 2022).
- Kuhn, Juliane, Larissa Rauscher, Karin Kucian, Tanja Käser, Anne Wyschkon, Günter Esser, and Michael von Aster. 2020. Efficacy of a Computer-Based Learning Program in Children with Developmental Dyscalculia. What Influences Individual Responsiveness? Frontiers in Psyschology 11: 1115. [Google Scholar] [CrossRef]
- Lee, Mal, and Arthur Winzenried. 2009. The Use of Instructional Technology in Schools. Lessons to Be Learned. Melbourne: ACER Press. [Google Scholar]
- Little, Todd D., William A. Cunningham, Golan Shahar, and Keith F. Widaman. 2002. To parcel or not to parcel: Exploring the question, weighing the merits. Structural Equation Modeling 9: 151–73. [Google Scholar] [CrossRef]
- Maldonado, Joana Elisa, and Kristof De Witte. 2020. The Effect of School Closures on Standardized Student Test Outcomes. British Educational Research Journal 48: 49–94. [Google Scholar] [CrossRef]
- Mayer, Richard E. 2014. Incorporating motivation into multimedia learning. Learning and Instruction 29: 171–73. [Google Scholar] [CrossRef]
- Ministry of Administration and Justice. 2012. A Nemzeti Alaptanterv kiadásáról, bevezetéséről és alkalmazásáról [On the Publication, Introduction and Application of the National Core Curriculum]. Available online: https://magyarkozlony.hu/dokumentumok/f8260c6149a4ab7ff14dea4fd427f10a7dc972f8/megtekintes (accessed on 11 January 2022).
- Mishra, Punia, and Matthew J. Koehler. 2006. Technological pedagogical content knowledge: A framework for teacher knowledge. Teachers College Record 108: 1017–54. [Google Scholar] [CrossRef]
- Molnár, Gyöngyvér, and Benő Csapó. 2019. Making the Psychological Dimension of Learning Visible: Using Technology-Based Assessment to Monitor Students’ Cognitive Development. Frontiers in Psychology 10: 1368. [Google Scholar] [CrossRef]
- Molnár, Gyöngyvér, Samuel Greiff, Sascha Wüstenberg, and Andreas Fischer. 2017. Empirical study of computer based assessment of domain-general dynamic problem solving skills. In The Nature of Problem Solving Using Research to Inspire 21st Century Learning. Edited by Benő Csapó and Joachim Funke. Paris: OECD Publishing, pp. 123–43. [Google Scholar] [CrossRef]
- Molnár, Gyöngyvér. 2021. Challenges and Developments in Technology-Based Assessment: Possibilities in Science Education. Europhysics 52: 16–19. [Google Scholar] [CrossRef]
- Nunes, Terezinha, and Peter Bryant. 2009. Key Understandings in Mathematics Learning. Paper 2: Understanding Extensive Quantities and Whole Numbers. London: Nuffield Foundation. Available online: https://www.nuffieldfoundation.org/project/key-understandings-in-mathematics-learning (accessed on 19 September 2019).
- Nunes, Terezinha, and Benő Csapó. 2011. Developing and Assessing Mathematical Reasoning. In Framework for Diagnostic Assessment of Mathematics. Edited by Benő Csapó and Mária Szendrei. Budapest: Nemzeti Tankönyvkiadó, pp. 17–56. [Google Scholar]
- Pachler, Norbert, Caroline Daly, Yishay Mor, and Harvey Mellar. 2010. Formative e-assessment: Practitioner cases. Computers & Education 54: 715–21. [Google Scholar] [CrossRef]
- Phelps, Renata, Damian Maher, Nikkita Urane, and Mal Lee. 2012. Primary school teachers’ use of digital resources with interactive whiteboards: The Australian context. Australasian Journal of Educational Technology 28: 138–58. [Google Scholar] [CrossRef]
- Seo, You-Jin, and Honguk Woo. 2010. The identification, implementation, and evaluation of critical user interface design features of computer-assisted instruction programs in mathematics for students with learning disabilities. Computers & Education 55: 363–77. [Google Scholar] [CrossRef]
- Simon, Tünde, and Andrea Kárpáti. 2020. A vizuális kommunikációs képesség online diagnosztikus mérése 4–6. évfolyamon [Online diagnostic assessment of visual communication skills in grades 4–6]. Magyar Pedagógia 120: 3–31. [Google Scholar] [CrossRef]
- Smarkola, Claudia. 2007. Technology acceptance predictors among student teachers and experienced classroom teachers. Journal of Educational Computing Research 37: 65–82. [Google Scholar] [CrossRef]
- Steyer, Rolf, Michael Eid, and Peter Schwenkmezger. 1997. Modeling true intraindividual change: True change as a latent variable. Methods of Psychological Research 2: 21–33. [Google Scholar]
- UNESCO. 2020. Responding to COVID-19 and Beyond, the Global Education Coalition in Action. Paris: UNESCO, Global Education Coalition. Available online: https://unesdoc.unesco.org/ark:/48223/pf0000374364 (accessed on 10 January 2022).
- Weidmann, Ben, Rebecca Allen, Dave Bibby, Rob Coe, Laura James, Natasha Plaister, and Dave Thomson. 2021. COVID-19 disruptions: Attainment Gaps and Primary School Responses. London: Education Endowment Foundation. Available online: https://educationendowmentfoundation.org.uk/public/files/Covid-19_disruptions_attainment_gaps_and_primary_school_responses_-_May_2021.pdf (accessed on 30 June 2021).
- Wendt, Staci, John Rice, and Jonathan Nakamoto. 2019. A Cross-State Evaluation of MIND Research Institute’s ST Math Program and Math Performance. San Francisco: WestEd. Available online: https://www.wested.org/wp-content/uploads/2019/07/ST-Math-Evaluation-Report-June-2019.pdf (accessed on 27 June 2021).


| Grade | N of Participants | N_intervention Group | N_control Group |
|---|---|---|---|
| 3 | 414 | 207 | 207 |
| 4 | 396 | 198 | 198 |
| Test | Multiplication (15 Items) | Division (12 Items) | Word Problem (8 Items) | |
|---|---|---|---|---|
| Pre-test | 0.90 | .80 | .84 | .70 |
| Post-test | 0.91 | .82 | .86 | .71 |
| Follow-up | 0.92 | .86 | .84 | .75 |
| N | Pre-Test (T1) | Post-Test (T2) | Follow-Up (T3) | t (T1_T2) | p (T1_T2) | d_T1_T2 | d_T2_T3 | ||||
|---|---|---|---|---|---|---|---|---|---|---|---|
| M | SD | M | SD | M | SD | ||||||
| Intervention | 405 | 50.2 | 23.4 | 57.1 | 24.4 | 64.4 | 24.0 | −8.08 | <.001 | 0.29 | 0.30 |
| Control | 405 | 52.3 | 23.6 | 56.0 | 24.0 | 63.2 | 24.8 | −4.04 | <.001 | 0.15 | 0.29 |
| N | Pre-Test (T1) | Post-Test (T2) | Follow-Up (T3) | t T1_T2 | p T1_T2 | d_T1_T2 | d_T2_T3 | ||||
|---|---|---|---|---|---|---|---|---|---|---|---|
| M | SD | M | SD | M | SD | ||||||
| Intervention Grade 3 | 207 | 47.2 | 22.9 | 52.2 | 24.2 | 60.9 | 25.3 | −4.0 | <.001 | 0.22 | 0.35 |
| Control Grade 3 | 207 | 50.1 | 24.1 | 52.1 | 23.7 | 60.8 | 25.8 | −7.6 | <.05 | 0.08 | 0.35 |
| Intervention Grade 4 | 198 | 53.3 | 23.5 | 62.2 | 23.5 | 68.1 | 21.9 | −7.8 | <.001 | 0.38 | 0.26 |
| Control Grade 4 | 198 | 54.8 | 22.9 | 60.1 | 23.6 | 65.7 | 23.7 | −4.0 | <.001 | 0.23 | 0.24 |
| d_T1_T2 | d_T2_T3 | |||
|---|---|---|---|---|
| Intervention | Control | Intervention | Control | |
| Multiplication subtest | 0.31 | 0.22 | 0.31 | 0.24 |
| Division subtest | 0.19 | 0.09 | 0.25 | 0.27 |
| Word problem subtest | 0.26 | 0.05 | 0.22 | 0.25 |
| N | Pre-Test (T1) | Post-Test (T2) | Follow-Up (T3) | t | p | d_T1_T2 | d_T2_T3 | ||||
|---|---|---|---|---|---|---|---|---|---|---|---|
| M | SD | M | SD | M | SD | ||||||
| Intervention_A | 72 | 16.6 | 7.5 | 32.9 | 15.8 | 40.5 | 19.5 | −8.4 | <0.001 | 1.32 | 0.42 |
| Control_A | 68 | 18.1 | 6.1 | 33.3 | 17.6 | 38.3 | 20.9 | −7.4 | <0.001 | 1.15 | 0.25 |
| Intervention_B | 250 | 49.8 | 15.8 | 56.1 | 21.2 | 64.4 | 21.3 | −6.5 | <0.001 | 0.34 | 0.39 |
| Control_B | 243 | 49.8 | 13.6 | 53.5 | 20.4 | 61.5 | 21.4 | −3.1 | <0.001 | 0.21 | 0.38 |
| Intervention_C | 83 | 83.9 | 6.6 | 82.0 | 13.9 | 86.9 | 12.0 | −2.2 | <0.05 | - | 0.31 (T1_T3) |
| Control_C | 94 | 84.4 | 6.3 | 79.1 | 15.8 | 85.3 | 14.5 | 5.8 | n.s. | - | 0.08 (T1_T3) |
| Model | Χ2 | df | CFI | TLI | RMSEA | CI |
|---|---|---|---|---|---|---|
| Three-dimensional | 2742.9 | 556 | .924 | .924 | .070 | [.067 .075] |
| One-dimensional | 3230.0 | 464 | .902 | .896 | .086 | [.083 .089] |
| Model | χ2 | df | CFI | TLI | RMSEA [90% CI] |
|---|---|---|---|---|---|
| Latent change model for both groups | 171.3 | 10 | .935 | .922 | .200 [.174 .227] |
| No-change model for the control and latent change model for the intervention group | 233.3 | 11 | .910 | .902 | .224 [.199 .249] |
| No-change model for both groups | 250.8 | 12 | .903 | .903 | .222 [.199 .246] |
| Model | χ2 | df | CFI | TLI | RMSEA [90% CI] | |
|---|---|---|---|---|---|---|
| Multiplication | Latent change model for both groups | 73.6 | 10 | .960 | .951 | .125 [.100 .153] |
| No-change model for the control and latent change model for the intervention group | 91.7 | 11 | .949 | .944 | .135 [.110 .161] | |
| No-change model for both groups | 136.4 | 12 | 921 | 921 | .160 [.137 .185] | |
| Division | Latent change model for both groups | 107.9 | 10 | .928 | .913 | .156 [.130 .183] |
| No-change model for the control and latent change model for the intervention group | 112.2 | 11 | .925 | .919 | .151 [.126 .177] | |
| No-change model for both groups | 134.6 | 12 | .910 | .910 | .159 [.135 .184] | |
| Word problem | Latent change model for both groups | 12.4 | 10 | .996 | .996 | .025 [.000 .062] |
| No-change model for the control and latent change model for the intervention group | 12.4 | 11 | .998 | .998 | .018 [.000 .057] | |
| No-change model for both groups | 29.9 | 12 | .974 | .974 | .061 [.034 .089] |
Publisher’s Note: MDPI stays neutral with regard to jurisdictional claims in published maps and institutional affiliations. |
© 2022 by the authors. Licensee MDPI, Basel, Switzerland. This article is an open access article distributed under the terms and conditions of the Creative Commons Attribution (CC BY) license (https://creativecommons.org/licenses/by/4.0/).
Share and Cite
Ökördi, R.; Molnár, G. Computer-Based Intervention Closes Learning Gap in Maths Accumulated in Remote Learning. J. Intell. 2022, 10, 58. https://doi.org/10.3390/jintelligence10030058
Ökördi R, Molnár G. Computer-Based Intervention Closes Learning Gap in Maths Accumulated in Remote Learning. Journal of Intelligence. 2022; 10(3):58. https://doi.org/10.3390/jintelligence10030058
Chicago/Turabian StyleÖkördi, Réka, and Gyöngyvér Molnár. 2022. "Computer-Based Intervention Closes Learning Gap in Maths Accumulated in Remote Learning" Journal of Intelligence 10, no. 3: 58. https://doi.org/10.3390/jintelligence10030058