

Optimization and Prediction of Different Building Forms for Thermal Energy Performance in the Hot Climate of Cairo Using Genetic Algorithm and Machine Learning

Abstract
:1. Introduction
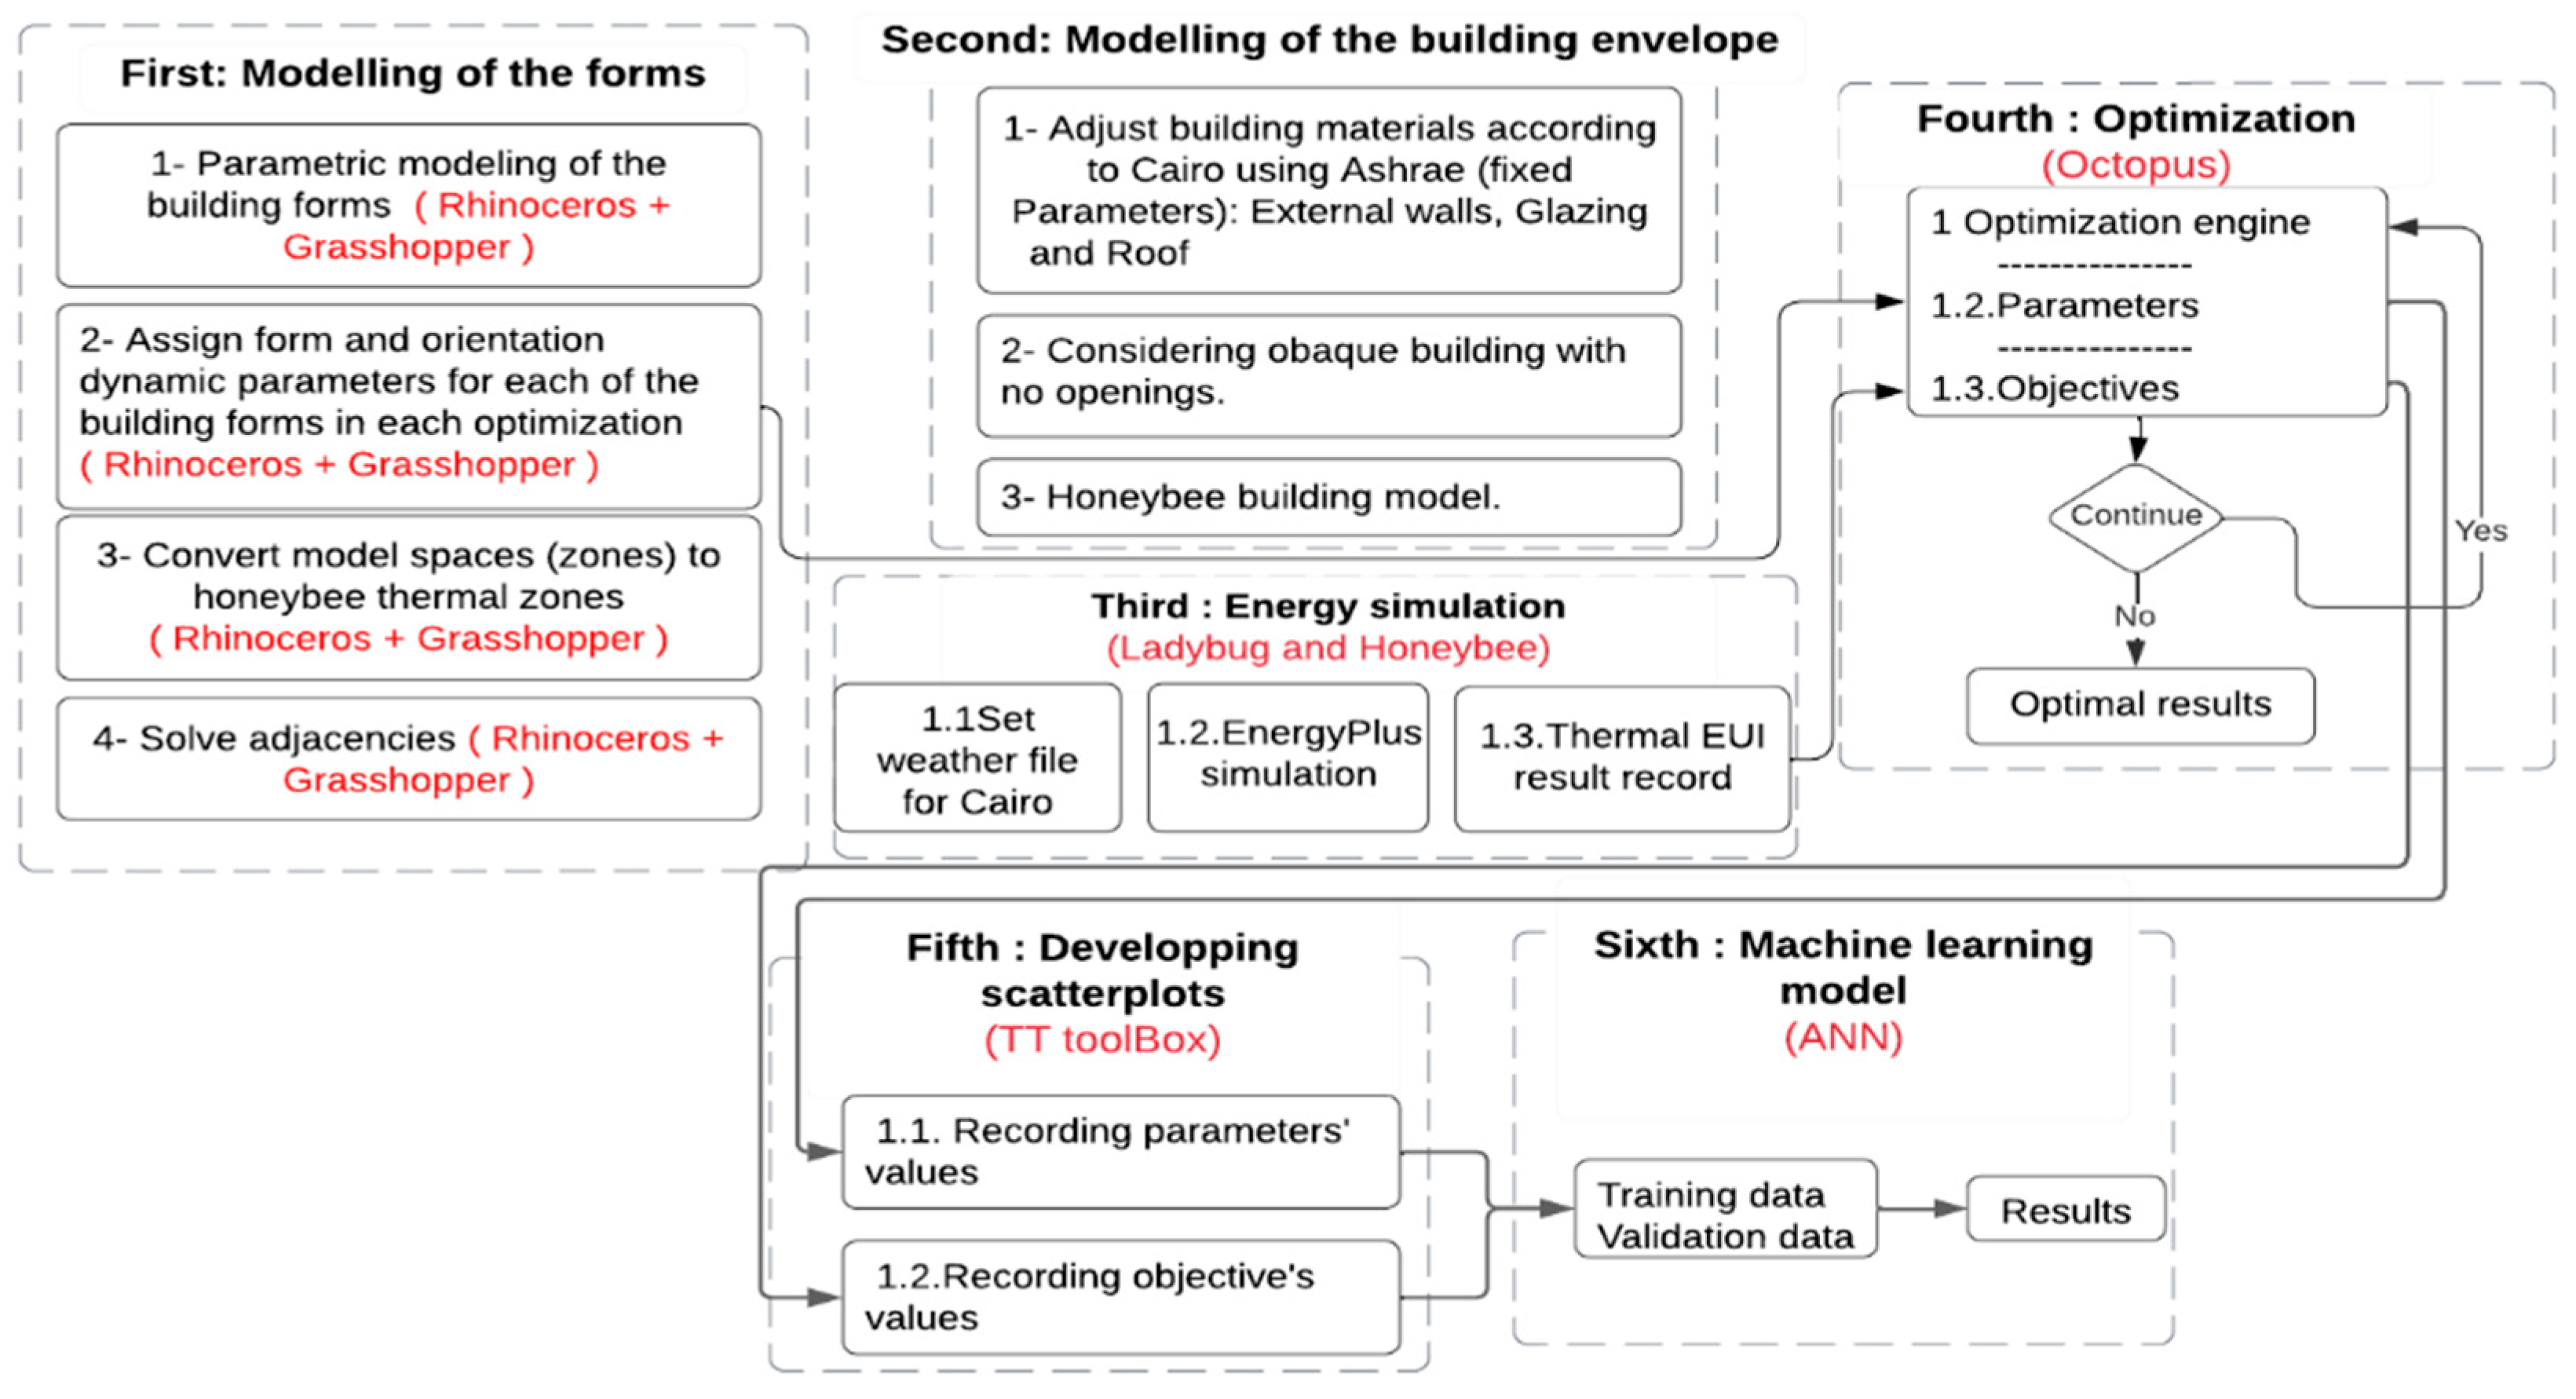
2. Workflow
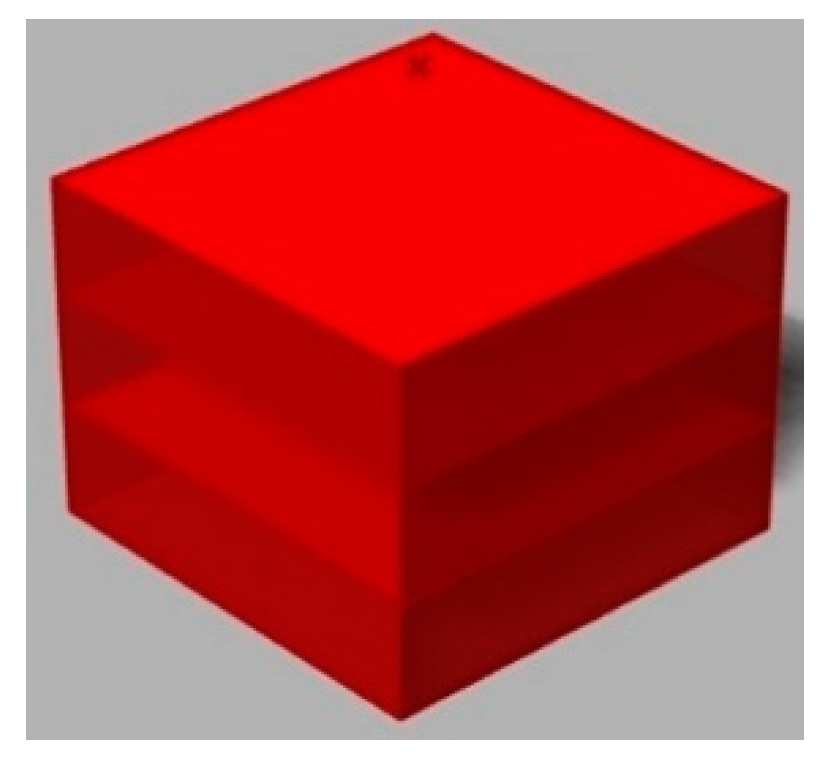
2.1. Base Case
2.2. Model Architectural Building Form
2.3. Run Thermal Energy Simulation
2.4. Optimization and Machine Learning
3. Results
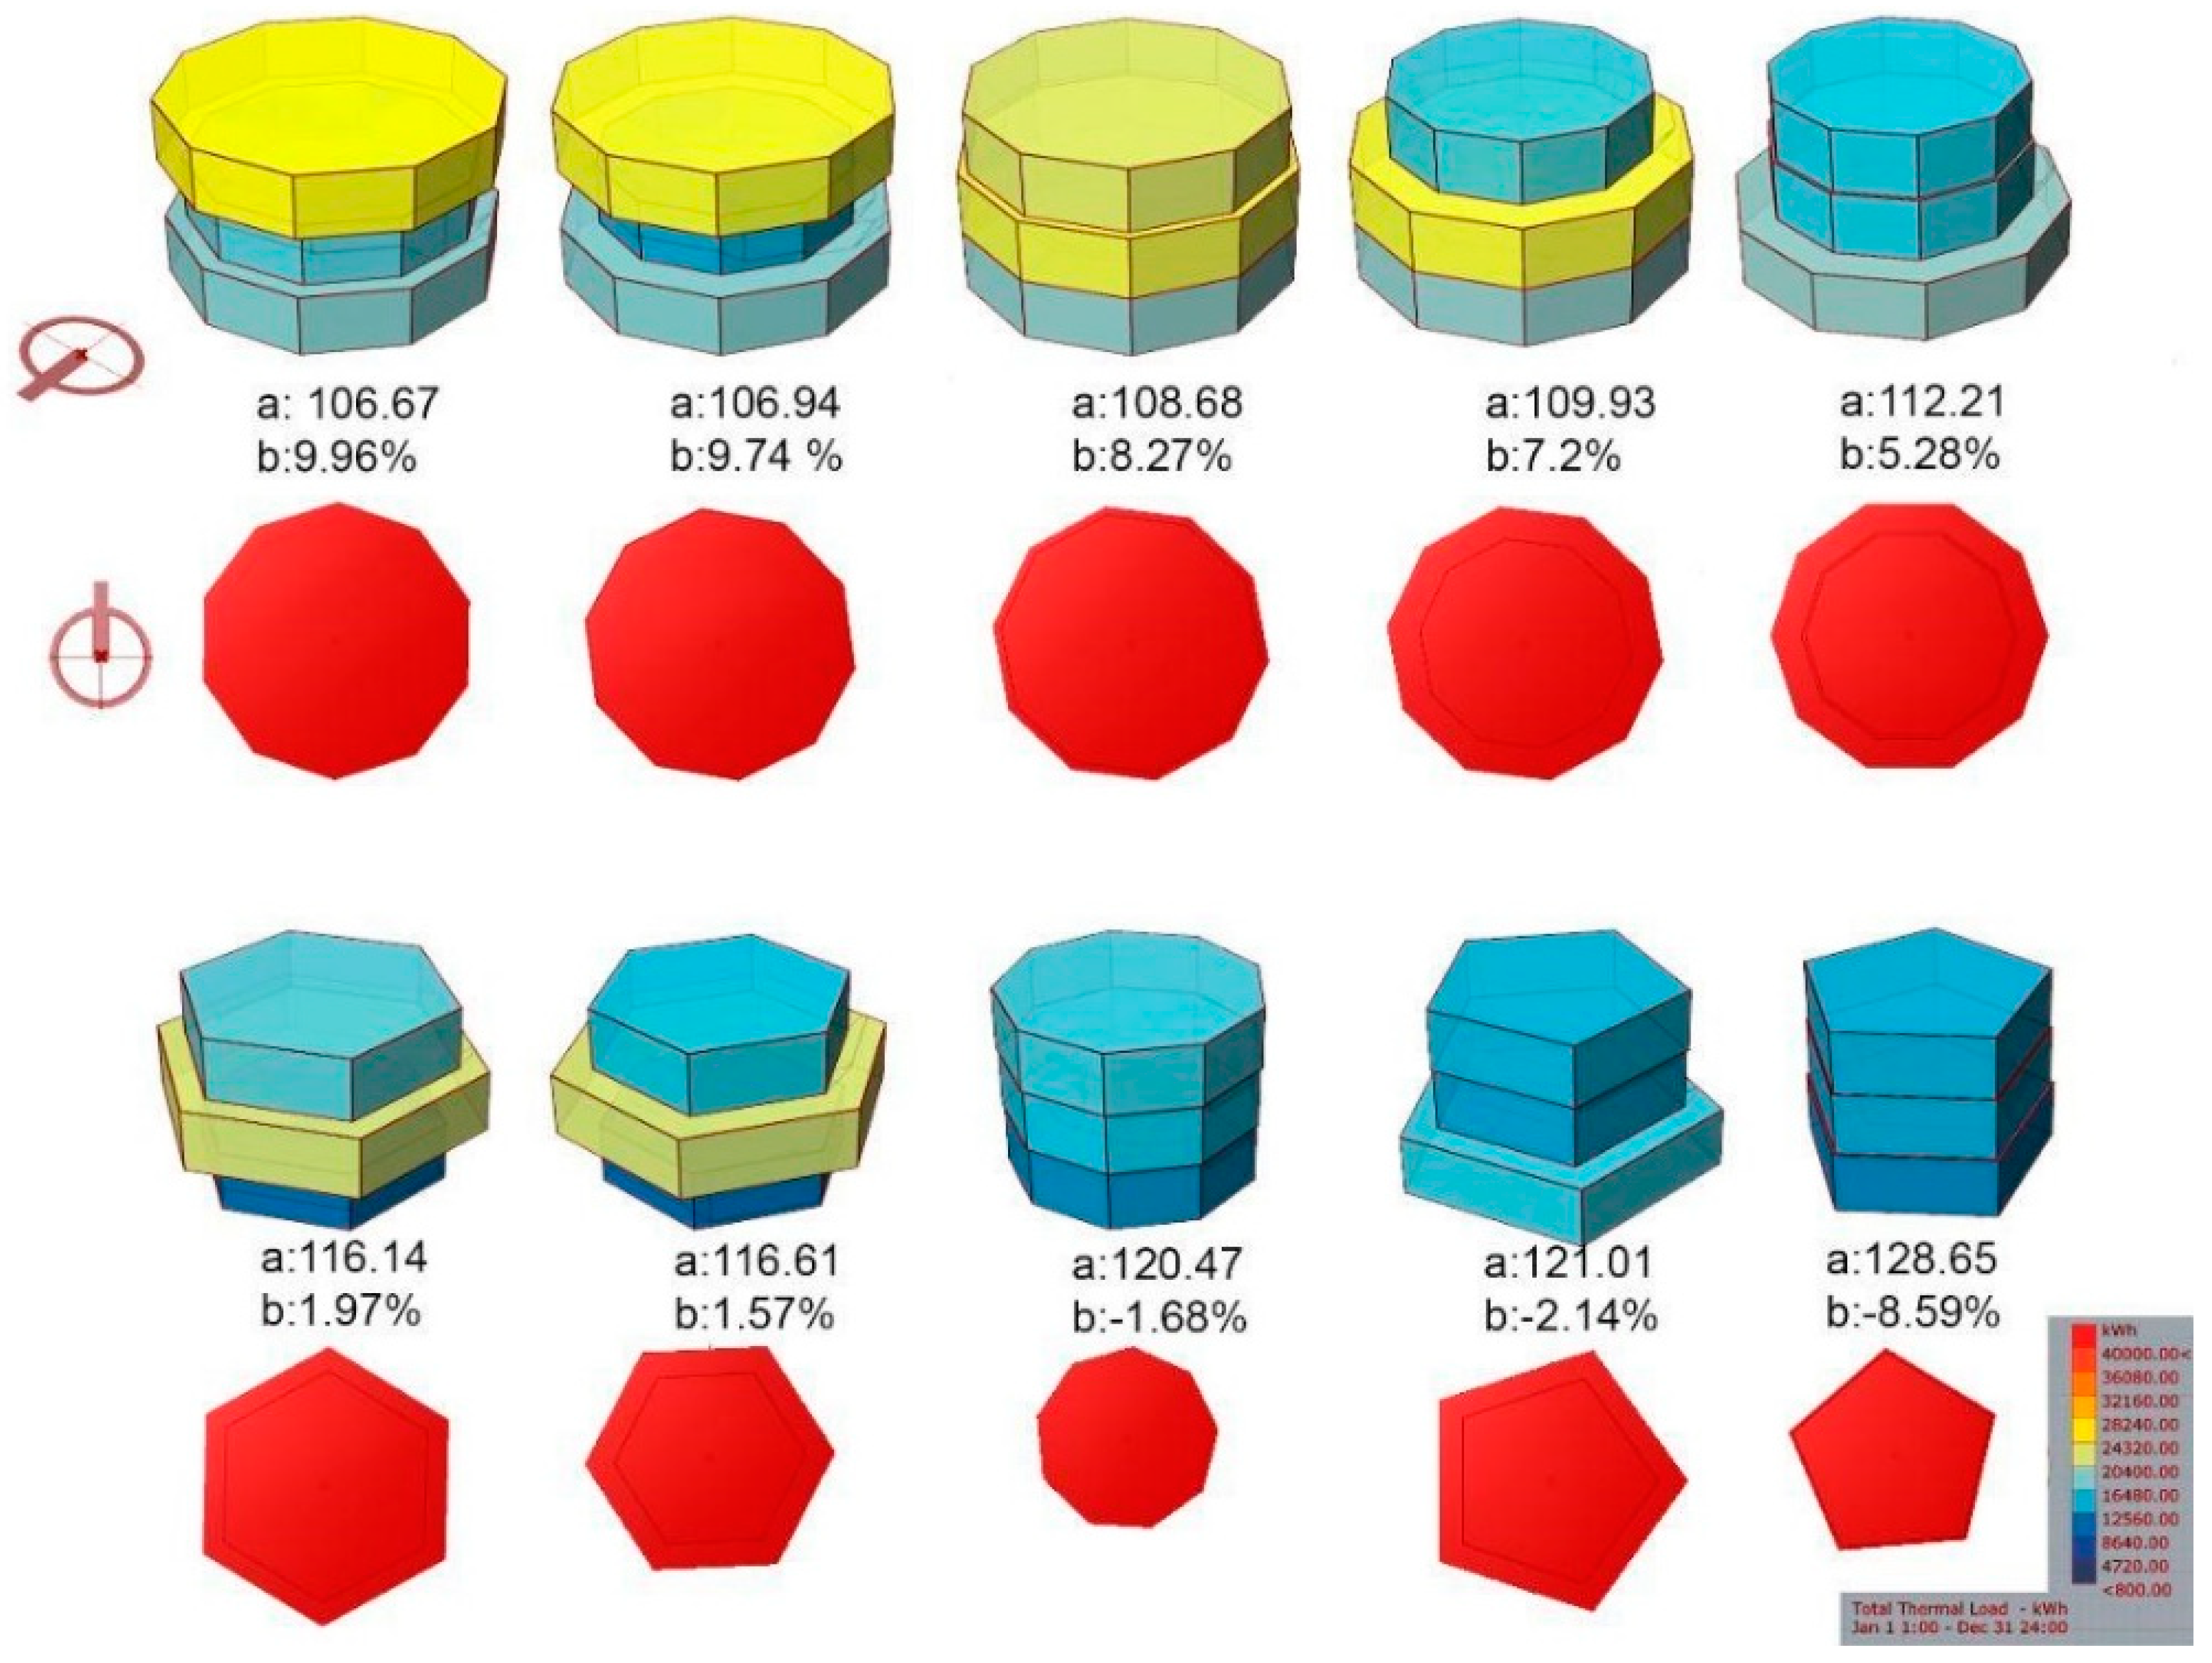
3.1. The First Building Form Family: Polygon Shape
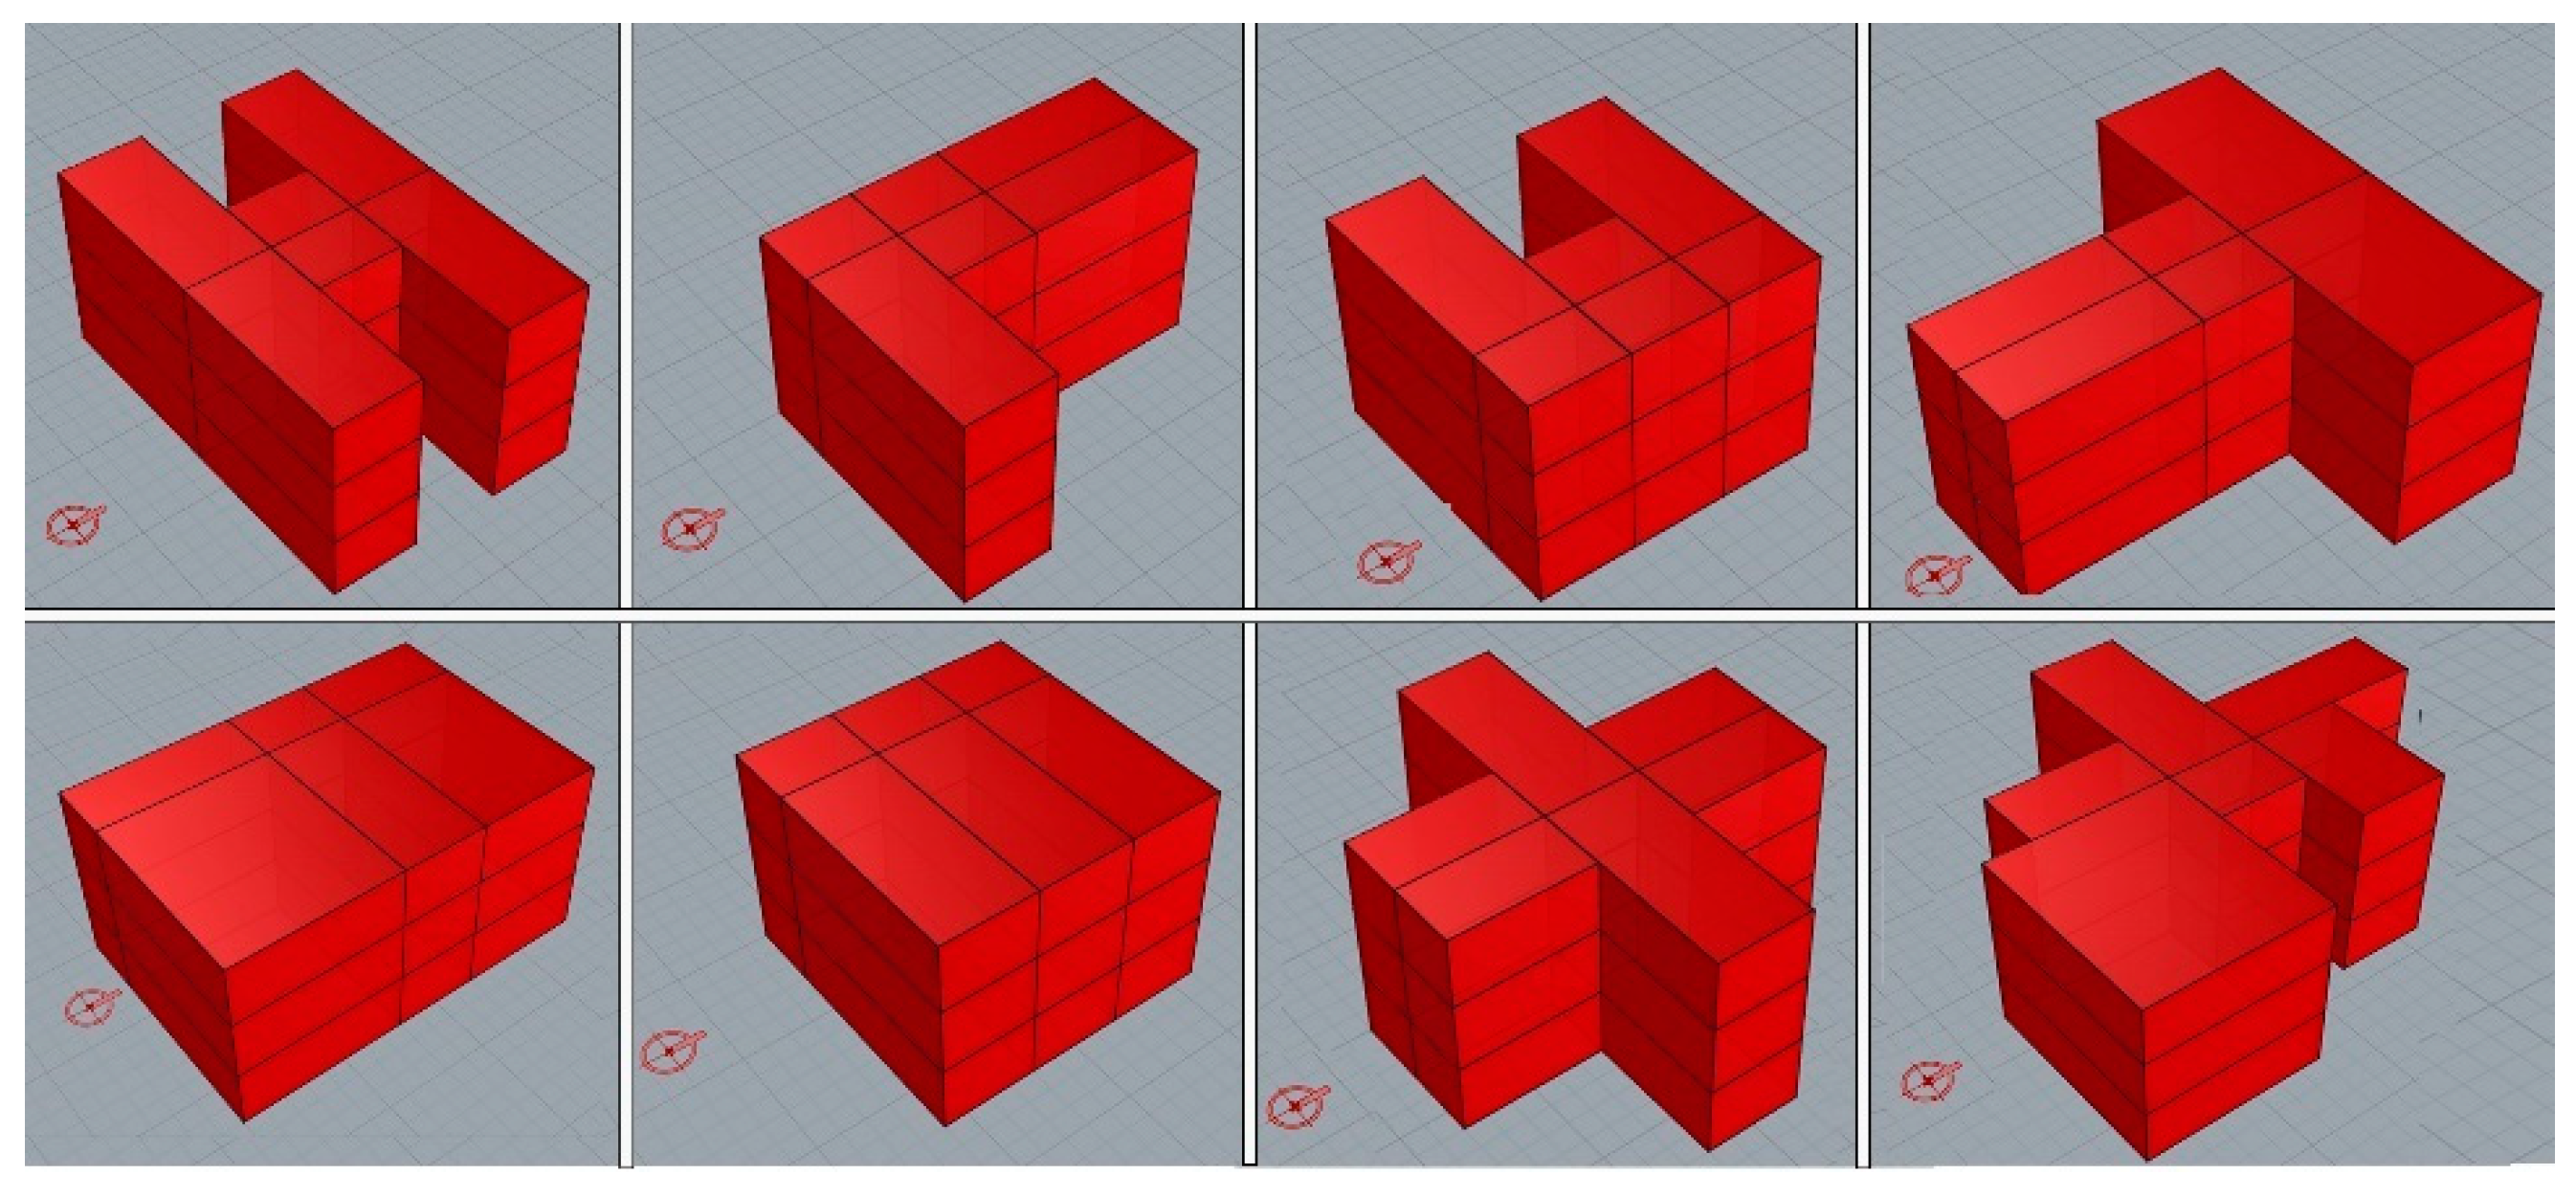
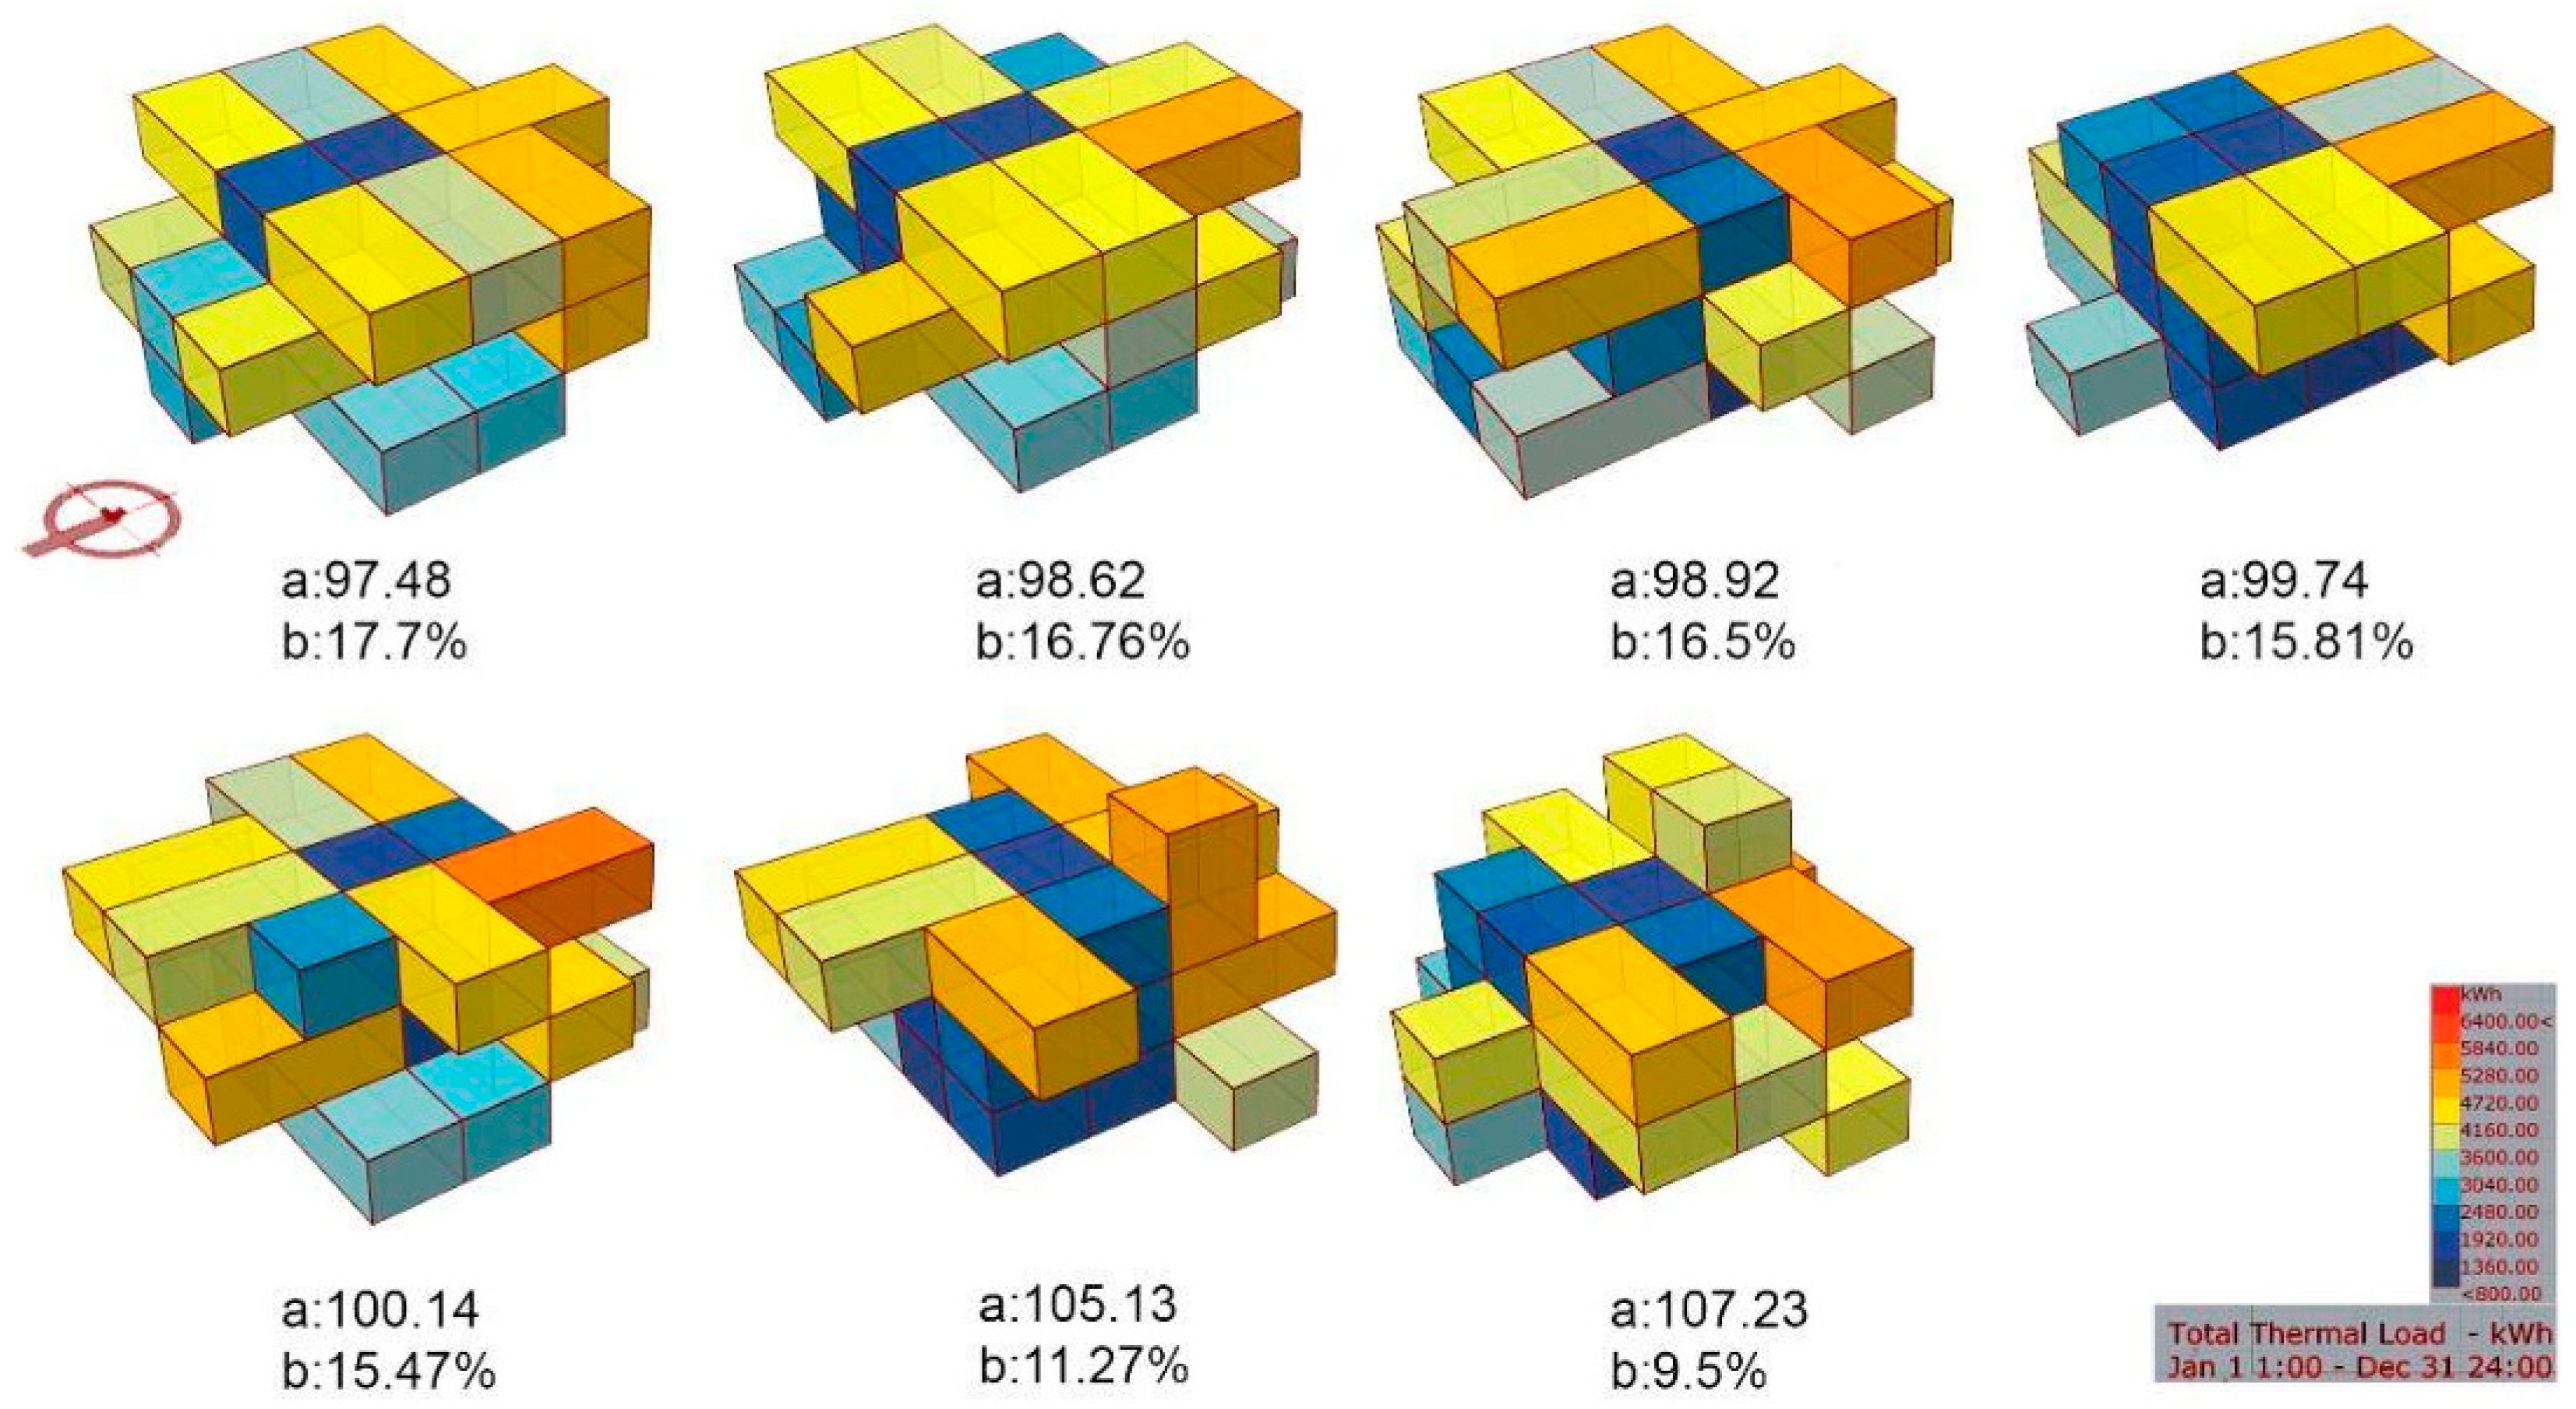
3.2. The Second Building Form Family: Pixels
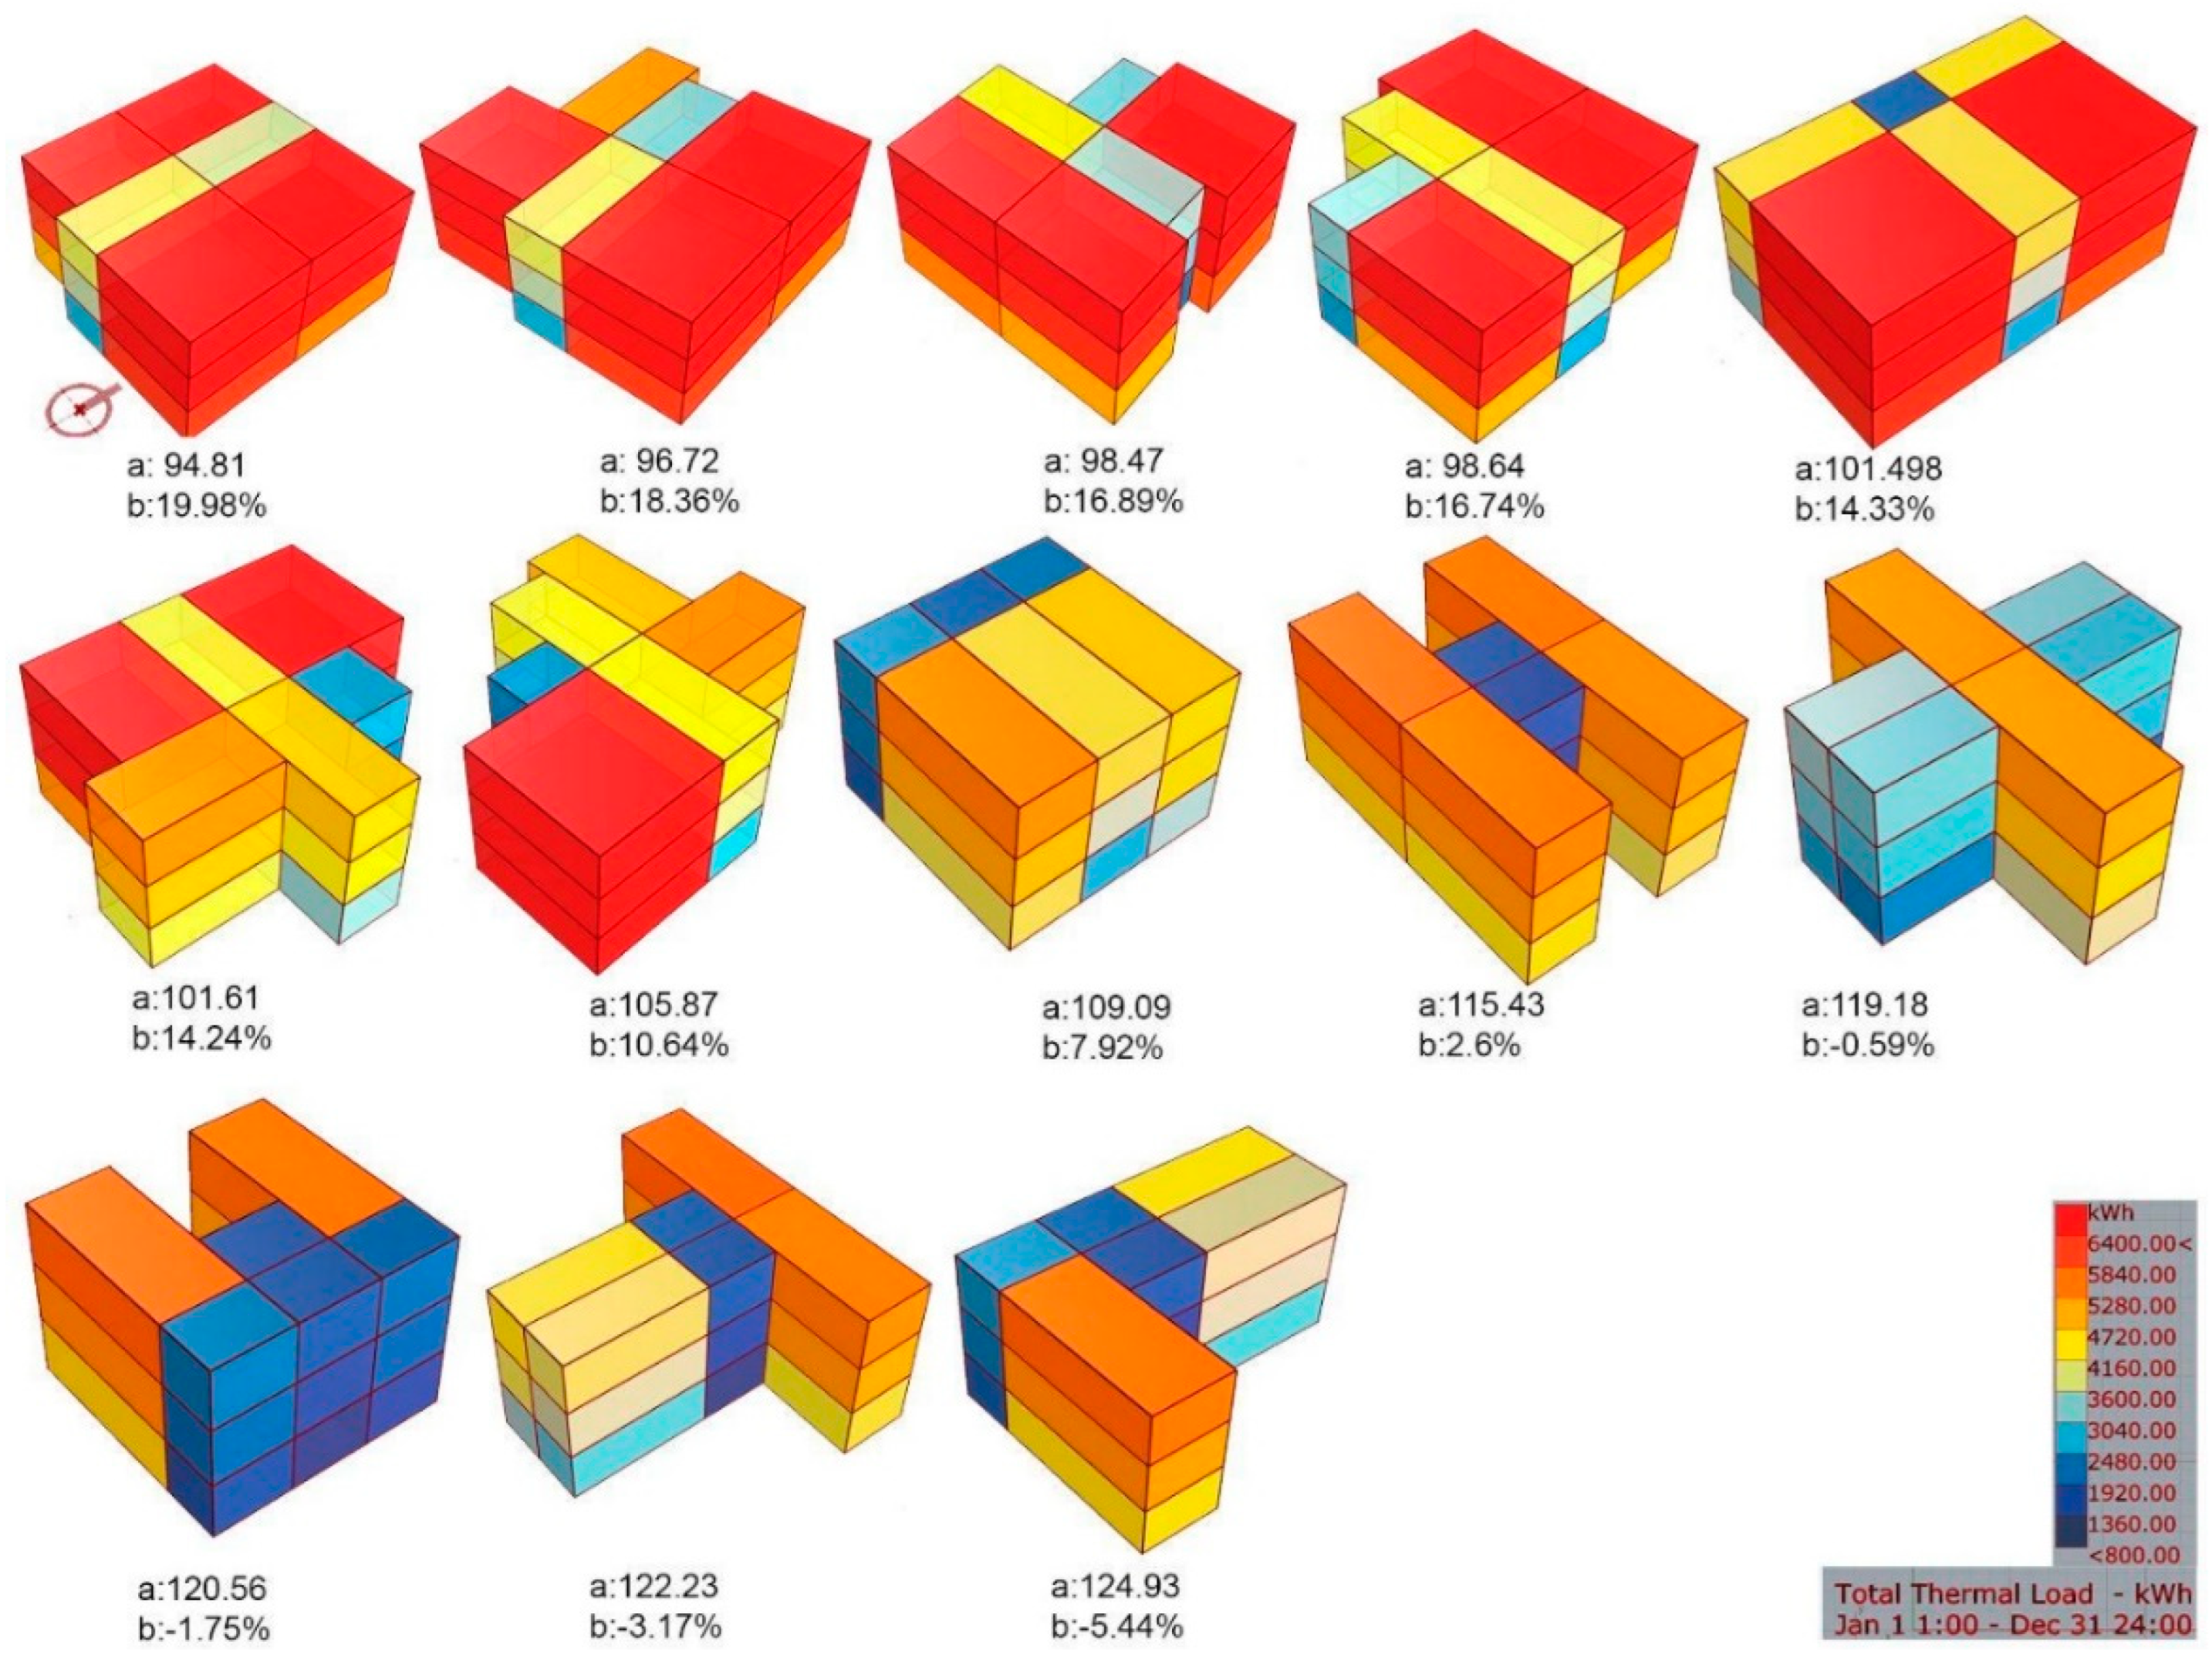
3.3. The Third Building Form Family: Letters Shape
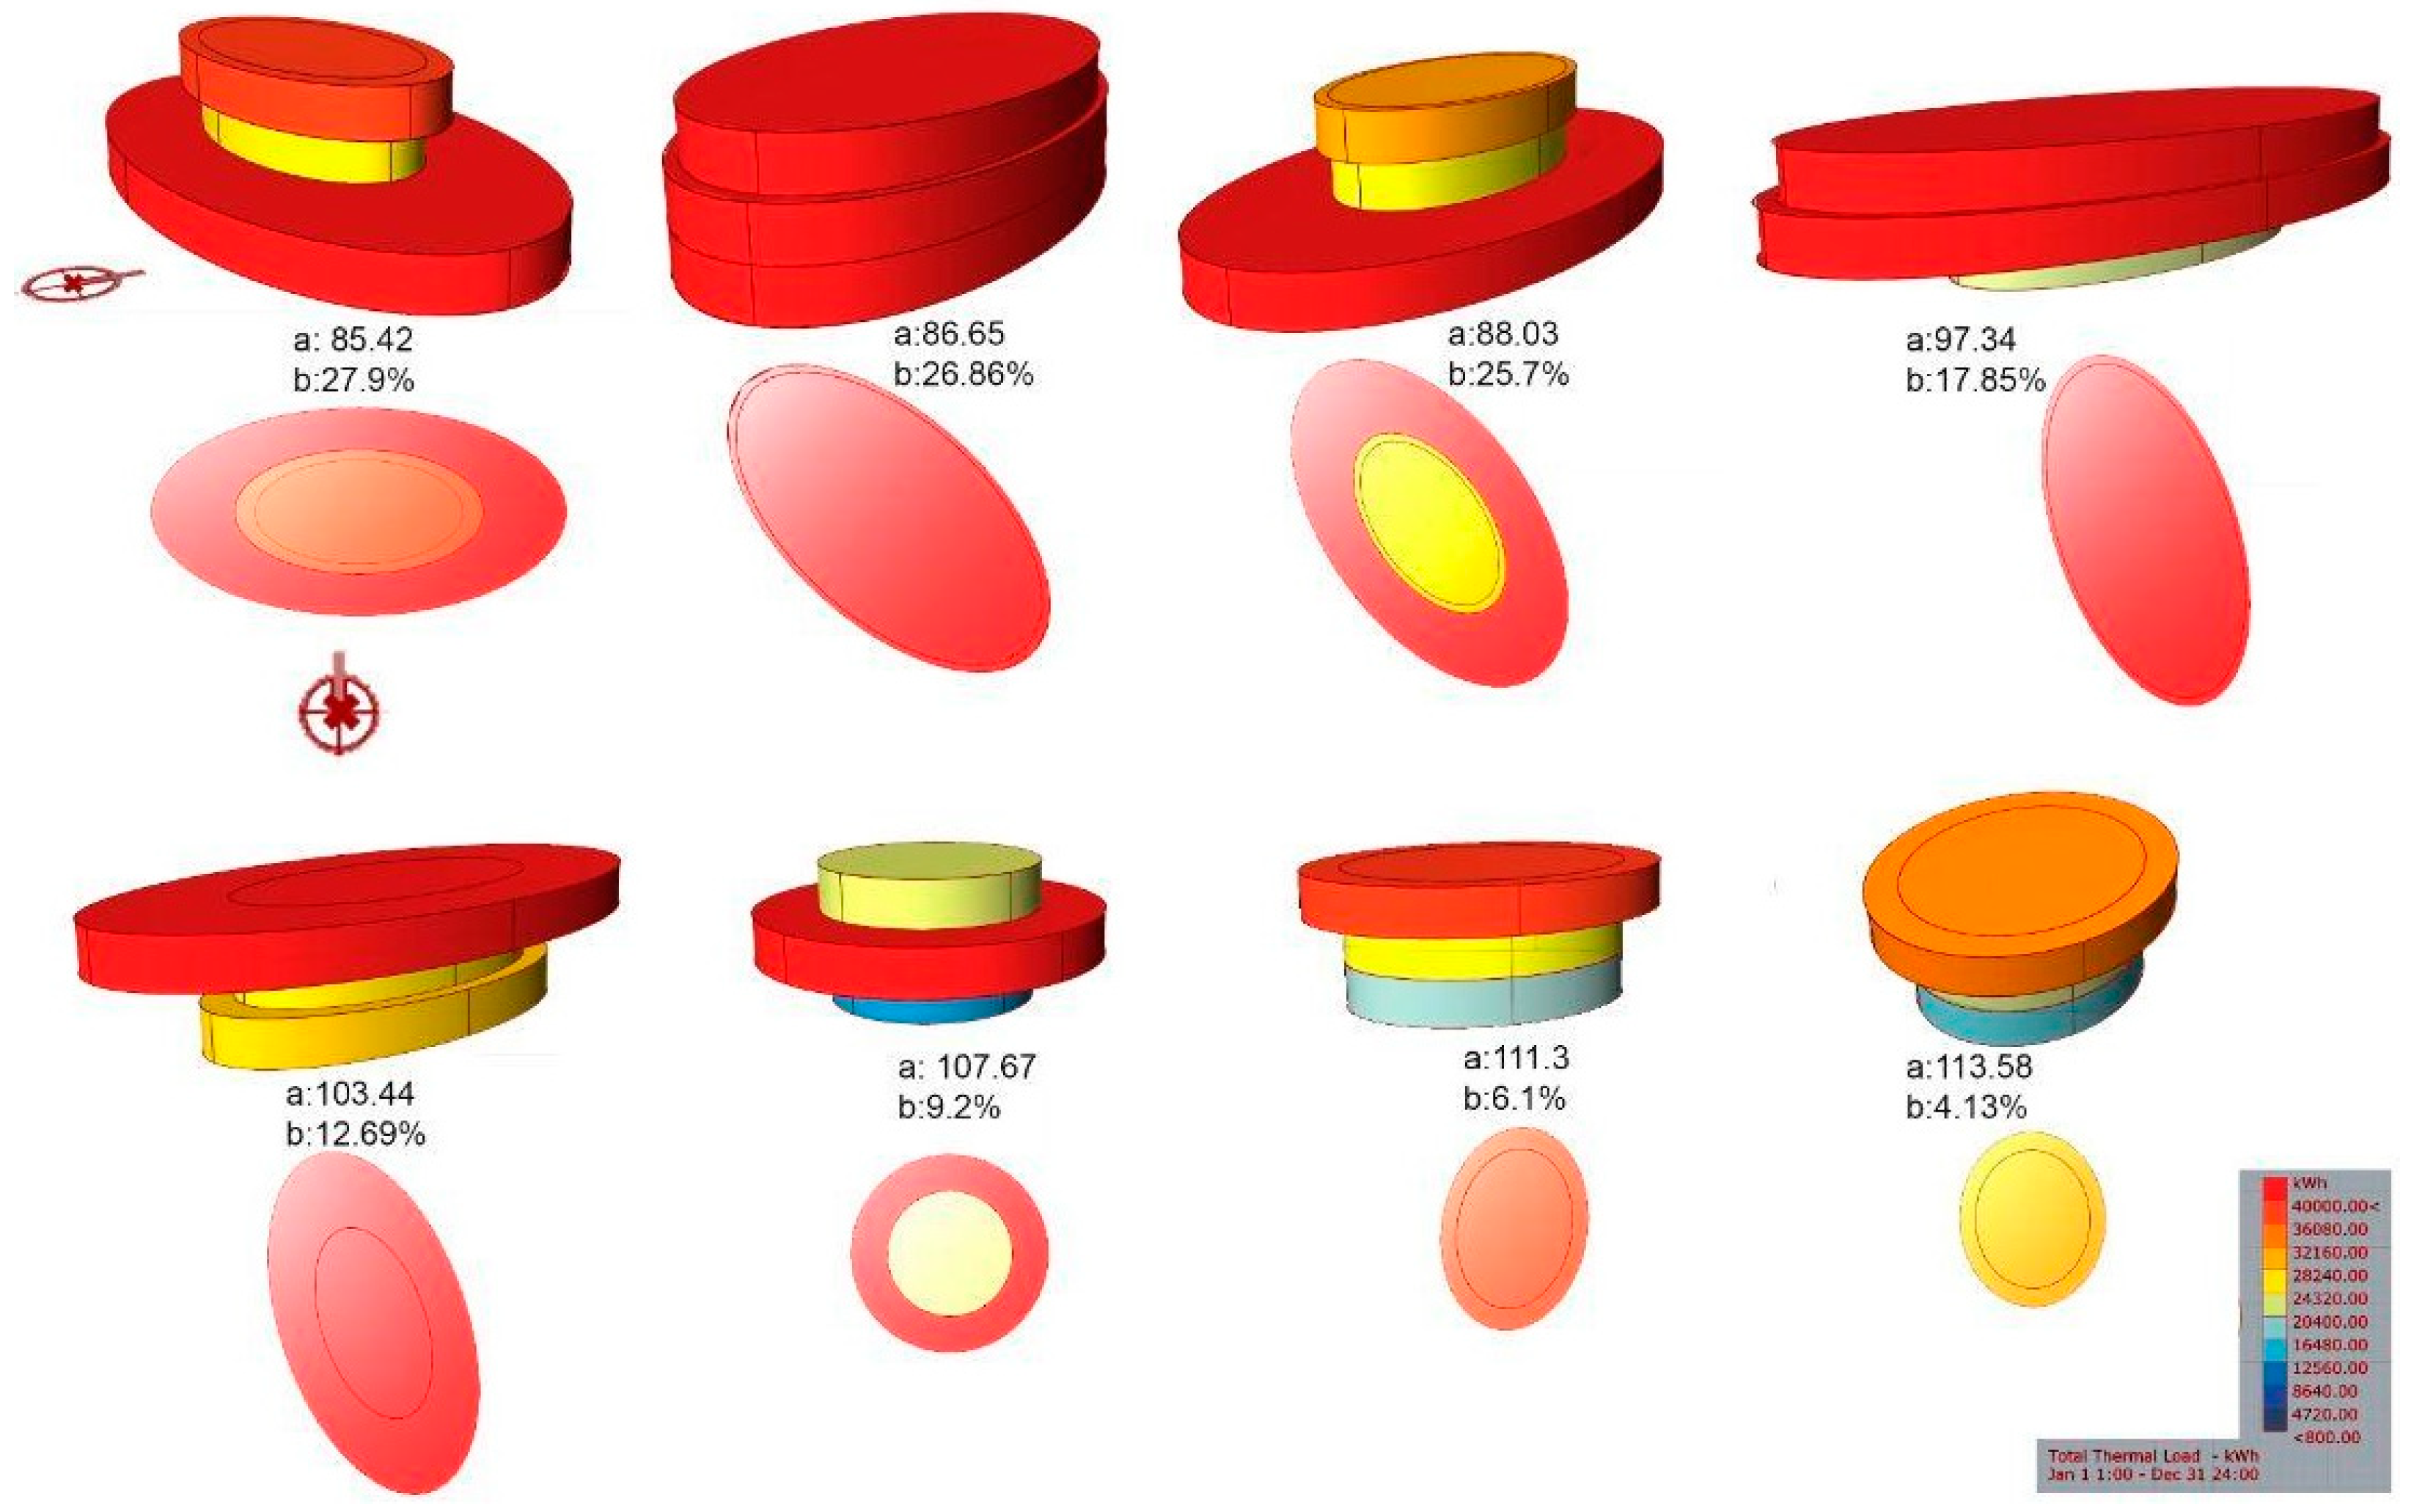
3.4. The Fourth Building Form Family: Round Shape
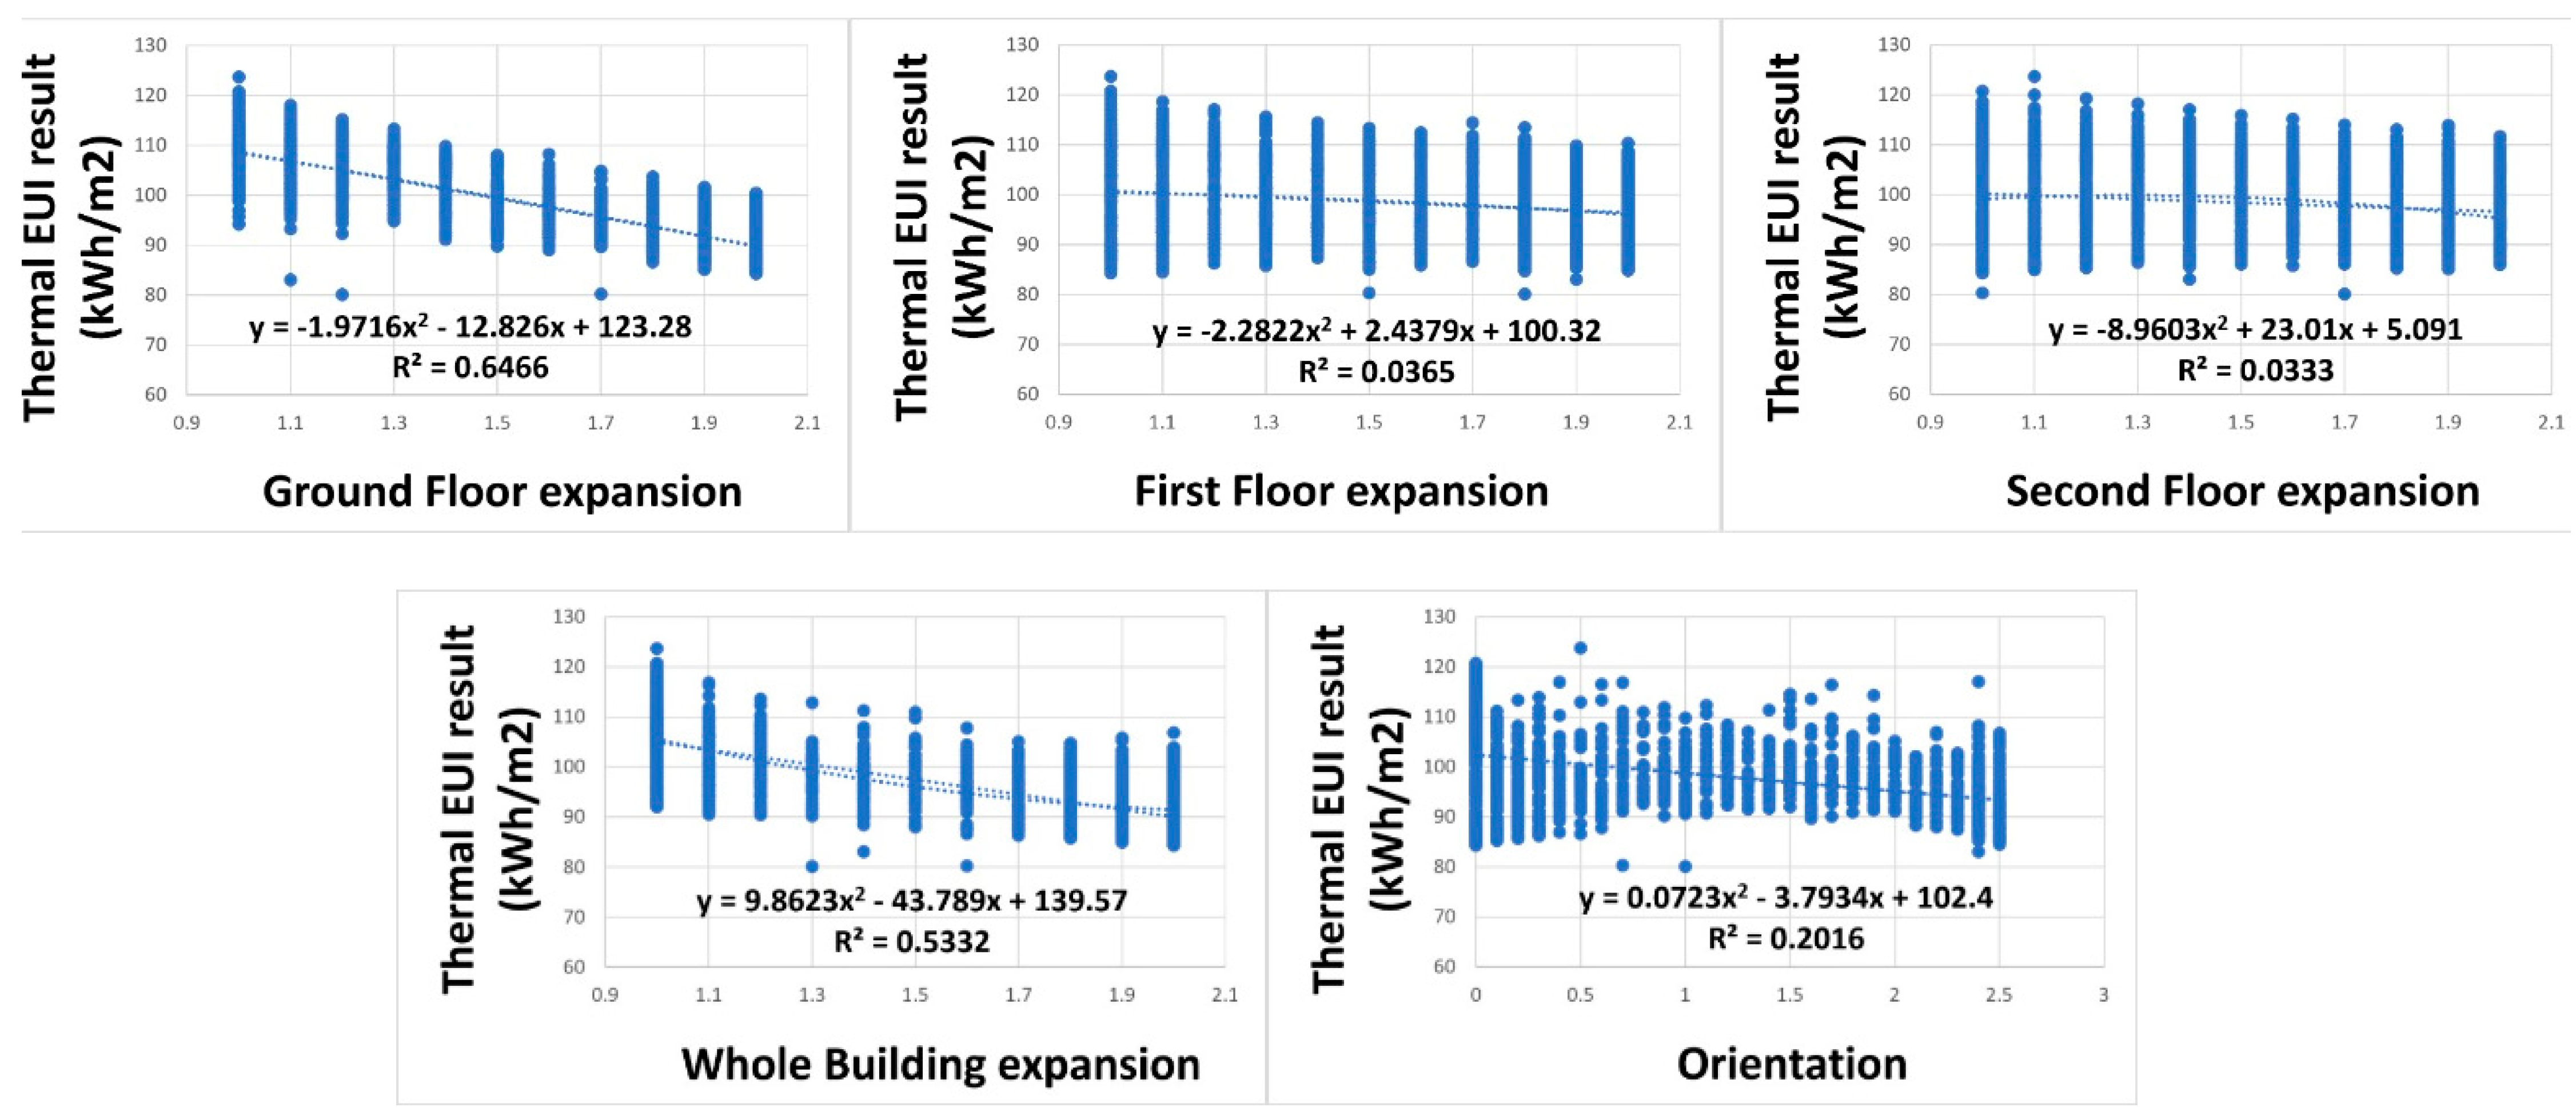
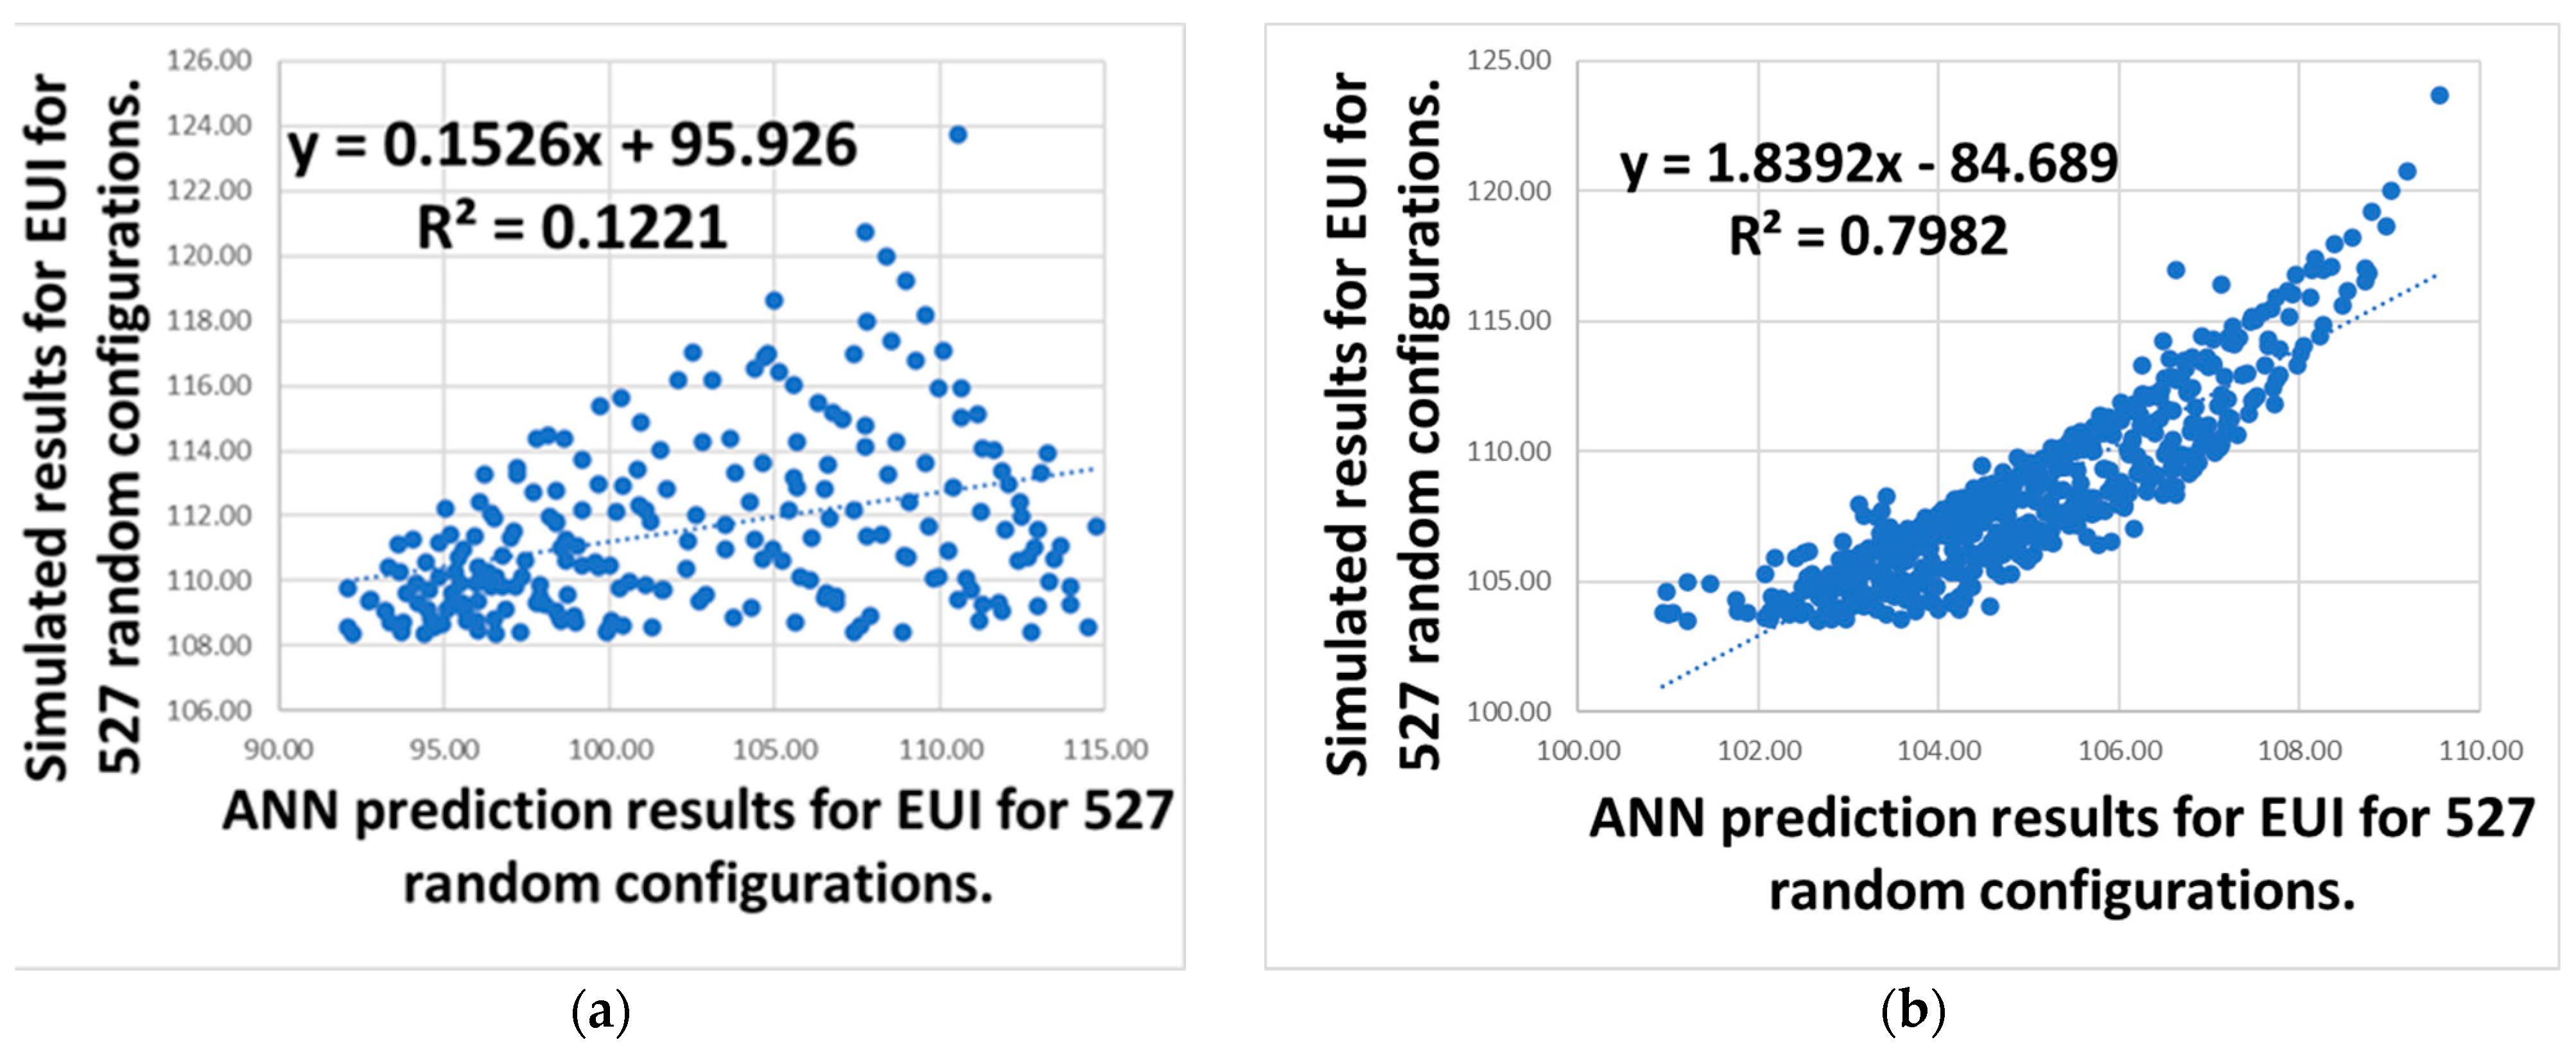
3.5. Scatterplots and Machine Learning of the Round Form
4. Conclusions
Author Contributions
Funding
Data Availability Statement
Conflicts of Interest
References
- Cao, X.; Dai, X.; Liu, J. Building energy-consumption status worldwide and the state-of-the-art technologies for zero-energy buildings during the past decade. Energy Build. 2016, 128, 198–213. [Google Scholar] [CrossRef]
- Elharidi, A.M.; Tuohy, P.G.; Teamah, M.A.; Hanafy, A.A. Energy and indoor environmental performance of typical Egyptian offices: Survey, baseline model and uncertainties. Energy Build. 2017, 135, 367–384. [Google Scholar] [CrossRef]
- Emil, F.; Diab, A. Energy rationalization for an educational building in Egypt: Towards a zero energy building. J. Build. Eng. 2021, 44, 103247. [Google Scholar] [CrossRef]
- Oral, G.K.; Yilmaz, Z. The limit U values for building envelope related to building form in temperate and cold climatic zones. Build. Environ. 2002, 37, 1173–1180. [Google Scholar] [CrossRef]
- Caldas, L. Generation of energy-efficient architecture solutions applying GENE_ARCH: An evolution-based generative design system. Adv. Eng. Inform. 2008, 22, 59–70. [Google Scholar] [CrossRef]
- Dong, Y.; Sun, C.; Han, Y.; Liu, Q. Intelligent optimization: A novel framework to automatize multi-objective optimization of building daylighting and energy performances. J. Build. Eng. 2021, 43, 102804. [Google Scholar] [CrossRef]
- Lu, Y.; Li, P.; Lee, Y.P.; Song, X. An integrated decision-making framework for existing building retrofits based on energy simulation and cost-benefit analysis. J. Build. Eng. 2021, 43, 103200. [Google Scholar] [CrossRef]
- Zou, Y.; Zhan, Q.; Xiang, K. A comprehensive method for optimizing the design of a regular architectural space to improve building performance. Energy Rep. 2021, 7, 981–996. [Google Scholar] [CrossRef]
- Ascione, F.; Bianco, N.; Mauro, G.M.; Vanoli, G.P. A new comprehensive framework for the multi-objective optimization of building energy design: Harlequin. Appl. Energy 2019, 241, 331–361. [Google Scholar] [CrossRef]
- Zhang, A.; Bokel, R.; van den Dobbelsteen, A.; Sun, Y.; Huang, Q.; Zhang, Q. Optimization of thermal and daylight performance of school buildings based on a multi-objective genetic algorithm in the cold climate of China. Energy Build. 2017, 139, 371–384. [Google Scholar] [CrossRef]
- Konis, K.; Gamas, A.; Kensek, K. Passive performance and building form: An optimization framework for early-stage design support. Sol. Energy 2016, 125, 161–179. [Google Scholar] [CrossRef]
- Tuhus-Dubrow, D.; Krarti, M. Genetic-algorithm based approach to optimize building envelope design for residential buildings. Build. Environ. 2010, 45, 1574–1581. [Google Scholar] [CrossRef]
- Kiss, B.; Szalay, Z. Modular approach to multi-objective environmental optimization of buildings. Autom. Constr. 2020, 111, 103044. [Google Scholar] [CrossRef]
- Zhu, L.; Wang, B.; Sun, Y. Multi-objective optimization for energy consumption, daylighting and thermal comfort performance of rural tourism buildings in north China. Build. Environ. 2020, 176, 106841. [Google Scholar] [CrossRef]
- Camporeale, P.E.; Mercader-Moyano, P. Towards nearly Zero Energy Buildings: Shape optimization of typical housing typologies in Ibero-American temperate climate cities from a holistic perspective. Sol. Energy 2019, 193, 738–765. [Google Scholar] [CrossRef]
- Fang, Y.; Cho, S. Design optimization of building geometry and fenestration for daylighting and energy performance. Sol. Energy 2019, 191, 7–18. [Google Scholar] [CrossRef]
- Yi, Y.K.; Malkawi, A.M. Site-specific optimal energy form generation based on hierarchical geometry relation. Autom. Constr. 2012, 26, 77–91. [Google Scholar] [CrossRef]
- Yi, Y.K.; Malkawi, A.M. Optimizing building form for energy performance based on hierarchical geometry relation. Autom. Constr. 2009, 18, 825–833. [Google Scholar] [CrossRef]
- Boonstra, S.; van der Blom, K.; Hofmeyer, H.; Emmerich, M.T.M.; van Schijndel, J.; de Wilde, P. Toolbox for super-structured and super-structure free multi-disciplinary building spatial design optimisation. Adv. Eng. Inform. 2018, 36, 86–100. [Google Scholar] [CrossRef]
- Lin, B.; Chen, H.; Yu, Q.; Zhou, X.; Lv, S.; He, Q.; Li, Z. MOOSAS—A systematic solution for multiple objective building performance optimization in the early design stage. Build. Environ. 2021, 200, 107929. [Google Scholar] [CrossRef]
- Du, T.; Turrin, M.; Jansen, S.; van den Dobbelsteen, A.; De Luca, F. Relationship Analysis and Optimisation of Space Layout to Improve the Energy Performance of Office Buildings. Energies 2022, 15, 1268. [Google Scholar] [CrossRef]
- Granadeiro, V.; Duarte, J.P.; Correia, J.R.; Leal, V.M.S. Building envelope shape design in early stages of the design process: Integrating architectural design systems and energy simulation. Autom. Constr. 2013, 32, 196–209. [Google Scholar] [CrossRef]
- Du, T. Space layout and energy performance: Parametric optimisation of space layout for the energy performance of office buildings. A+BE|Archit. Built Environ. 2021, 15, 1–248. [Google Scholar] [CrossRef]
- Jin, J.-T.; Jeong, J.-W. Optimization of a free-form building shape to minimize external thermal load using genetic algorithm. Energy Build. 2014, 85, 473–482. [Google Scholar] [CrossRef]
- Futrell, B.J.; Ozelkan, E.C.; Brentrup, D. Bi-objective optimization of building enclosure design for thermal and lighting performance. Build. Environ. 2015, 92, 591–602. [Google Scholar] [CrossRef]
- Taleb, S.; Yeretzian, A.; Jabr, R.A.; Hajj, H. Optimization of building form to reduce incident solar radiation. J. Build. Eng. 2020, 28, 101025. [Google Scholar] [CrossRef]
- Rodrigues, E.; Gaspar, A.R.; Gomes, Á. Automated approach for design generation and thermal assessment of alternative floor plans. Energy Build. 2014, 81, 170–181. [Google Scholar] [CrossRef]
- Caruso, G.; Kämpf, J.H. Building shape optimisation to reduce air-conditioning needs using constrained evolutionary algorithms. Sol. Energy 2015, 118, 186–196. [Google Scholar] [CrossRef]
- Lu, S.; Wang, C.; Fan, Y.; Lin, B. Robustness of building energy optimization with uncertainties using deterministic and stochastic methods: Analysis of two forms. Build. Environ. 2021, 205, 108185. [Google Scholar] [CrossRef]
- Khalil, A.; Tolba, O.; Ezzeldin, S. Optimization of an office building form using a lattice incubate boxes method. Adv. Eng. Inform. 2023, 55, 101847. [Google Scholar] [CrossRef]
- Chatzikonstantinou, I. Architectural Design Performance Through Computational Intelligence: A Comprehensive Decision Support Framework. Ph.D. Dissertation, Delft University of Technology, Delft, The Netherlands, 2021. [Google Scholar] [CrossRef]
- Lila, A.; Jabi, W.; Lannon, S. Predicting solar radiation with Artificial Neural Network based on urban geometrical classification. In Proceedings of the Building Simulation 2021 Conference, Bruges, Belgium, 1–3 September 2021. [Google Scholar] [CrossRef]
- Attia, S.; Hensen, J.L.M.; Beltrán, L.; De Herde, A. Selection criteria for building performance simulation tools: Contrasting architects’ and engineers’ needs. J. Build. Perform. Simul. 2012, 5, 155–169. [Google Scholar] [CrossRef]
- Robert McNeel & Associates. Rhino 6 for Windows and Mac. 2021. Available online: https://www.rhino3d.com/ (accessed on 16 January 2020).
- Khalil, A.; Tolba, O.; Ezzeldin, S. Design Optimization of Open Office Building Form for Thermal Energy Performance using Genetic Algorithm. Adv. Sci. Technol. Eng. Syst. J. 2021, 6, 254–261. [Google Scholar] [CrossRef]
- Roudsari, M.S. Ladybug Tools|Home Page. 2021. Available online: https://www.ladybug.tools/ (accessed on 9 October 2021).
- Wortmann, T. Genetic evolution vs. function approximation: Benchmarking algorithms for architectural design optimization. J. Comput. Des. Eng. 2019, 6, 414–428. [Google Scholar] [CrossRef]
- Kheiri, F. A review on optimization methods applied in energy-efficient building geometry and envelope design. Renew. Sustain. Energy Rev. 2018, 92, 897–920. [Google Scholar] [CrossRef]
- Sönmez, N.O. A review of the use of examples for automating architectural design tasks. Comput.-Aided Des. 2018, 96, 13–30. [Google Scholar] [CrossRef]
- Vierlinger Octopus Food4Rhino. 2021. Available online: https://www.food4rhino.com/app/octopus (accessed on 20 January 2020).
- Vier, C.B.R.; Groups, V. Octopus. 2021. Available online: https://www.grasshopper3d.com/group/octopus (accessed on 30 August 2020).
- Lila, A.; Lannon, S. Classifying Urban Geometry Impact on Solar Radiation. Presented at the Building Simulation 2019: 16th Conference of IBPSA, Rome, Italy, September 2019. Available online: https://orca.cardiff.ac.uk/id/eprint/126536/ (accessed on 24 June 2023).


| Form Dynamic Parameters |  |  |  | Building Rotation |
| No. of parameters | Initial form Dimensions | 6 | 4 | 1 |
| Attributes for each parameter | The dimensions are in meters and are regarded as 1 in the values. | 1 (base case), 1.5, 2, 2.5, and 3. Values are in percentages (%). | 1 (base case),1.5, and 2. Values are in percentages (%). | 0 (base case), 0.1, 0.2, 0.3, 0.4, 0.5, 0.6, 0.7, 0.8, 0.9, 1, 1.1, 1.2, 1.3, 1.4, 1.5, 1.6, 1.7, 1.8, 1.9, and 2. Angles are in radians. |
| Form Dynamic Parameters |  | Building Expansion along One Axis | Floor Expansion along the Other Axis  | Building Rotation  |
| No. of parameters | Initial form Dimensions | 1 | 3 | 1 |
| Attributes for each parameter | The dimensions are in meters and are regarded as 1 in the values. | 1 (base case), 1.1, 1.2, 1.3, 1.4, 1.5, 1.6, 1.7, 1.8, 1.9, and 2. Values are in percentages (%). | 1 (base case), 1.1, 1.2, 1.3, 1.4, 1.5, 1.6, 1.7, 1.8, 1.9, and 2. Values are in percentages (%). | 0 (base case), 0.1, 0.2, 0.3, 0.4, 0.5, 0.6, 0.7, 0.8, 0.9, 1, 1.1, 1.2, 1.3, 1.4, 1.5, 1.6, 1.7, 1.8, 1.9, and 2. Angles are in radians. |
| Form Dynamic Parameters |  | Polygon Sides | Floor Expansion | Building Rotation |
| No. of parameters | Initial form Dimensions | 1 | 3 | 1 |
| Attributes for each parameter | The dimensions are in meters and are regarded as 1 in the values. | 5, 6, 7, 8, 9, or 10. | 1 (base case), 1.1, 1.2, 1.3, 1.4, 1.5, 1.6, 1.7, 1.8, 1.9, and 2. Values are in percentages. | 0 (base case), 0.1, 0.2, 0.3, 0.4, 0.5, 0.6, 0.7, 0.8, 0.9, 1, 1.1, 1.2, 1.3, 1.4, 1.5, 1.6, 1.7, 1.8, 1.9, and 2. Angles are in radians. |
| Form Dynamic Parameters |  Plan |  Elevation |  |
| No. of parameters | Initial form Dimensions | 27 | |
| Attributes for each parameter | The dimensions are in meters and are regarded as 1 in the values. | 0 (base case), 4 m in the x, y, or z directions. | |
| Static Parameters | Values (Cairo) |
|---|---|
| Floors number | 3 |
| Letters form thermal zones no. | 18 |
| Pixels form thermal zones no. | 27 |
| Circular forms thermal zones no. | 3 |
| Pentagonal forms thermal zones no. | 3 |
| Floor Height in all forms | 3 m |
| Building Height | 9 m, but it varies for the pixel’s family. |
| Windows | No |
| Roof shape of each family | Flat except for the pixel’s family |
| Interior & exposed floors U-value | 1.449209 W/m2-K |
| External walls | CBECS 1980–2004 Exterior Wall MASS, Climate Zone 2B |
| External walls U-value | 3.573262 W/m2-K |
| Window | ASHRAE 189.1–2009 EXTWINDOW CLIMATEZONE 2B |
| Glazing U-value | 13.833333 W/m2-K |
| Roof | CBECS 1980–2004 EXTROOF IEAD CLIMATEZONE 2B |
| Roof U-value | 0.274975 W/m2-K |
| Interior walls U-value | 2.58 W/m2-K |
| Interior & exposed floors U-value | 1.449209 W/m2-K |
| Equipment load per area | 7.64 W/m2 |
| Infiltration rate per area | 0.0002 m3/s m2 |
| Number of people per area | 0.0565 ppl/m2 |
| Ventilation per area | 0.0003 m3/s m2 |
| Ventilation per person | 0.0024 m3/s |
Disclaimer/Publisher’s Note: The statements, opinions and data contained in all publications are solely those of the individual author(s) and contributor(s) and not of MDPI and/or the editor(s). MDPI and/or the editor(s) disclaim responsibility for any injury to people or property resulting from any ideas, methods, instructions or products referred to in the content. |
© 2023 by the authors. Licensee MDPI, Basel, Switzerland. This article is an open access article distributed under the terms and conditions of the Creative Commons Attribution (CC BY) license (https://creativecommons.org/licenses/by/4.0/).
Share and Cite
Khalil, A.; Lila, A.M.H.; Ashraf, N. Optimization and Prediction of Different Building Forms for Thermal Energy Performance in the Hot Climate of Cairo Using Genetic Algorithm and Machine Learning. Computation 2023, 11, 192. https://doi.org/10.3390/computation11100192
Khalil A, Lila AMH, Ashraf N. Optimization and Prediction of Different Building Forms for Thermal Energy Performance in the Hot Climate of Cairo Using Genetic Algorithm and Machine Learning. Computation. 2023; 11(10):192. https://doi.org/10.3390/computation11100192
Chicago/Turabian StyleKhalil, Amany, Anas M. Hosney Lila, and Nouran Ashraf. 2023. "Optimization and Prediction of Different Building Forms for Thermal Energy Performance in the Hot Climate of Cairo Using Genetic Algorithm and Machine Learning" Computation 11, no. 10: 192. https://doi.org/10.3390/computation11100192