

Factors Affecting Demand and Supply in the Housing Market: A Study on Three Major Cities in Turkey

 ,
,  ,
,  and
and 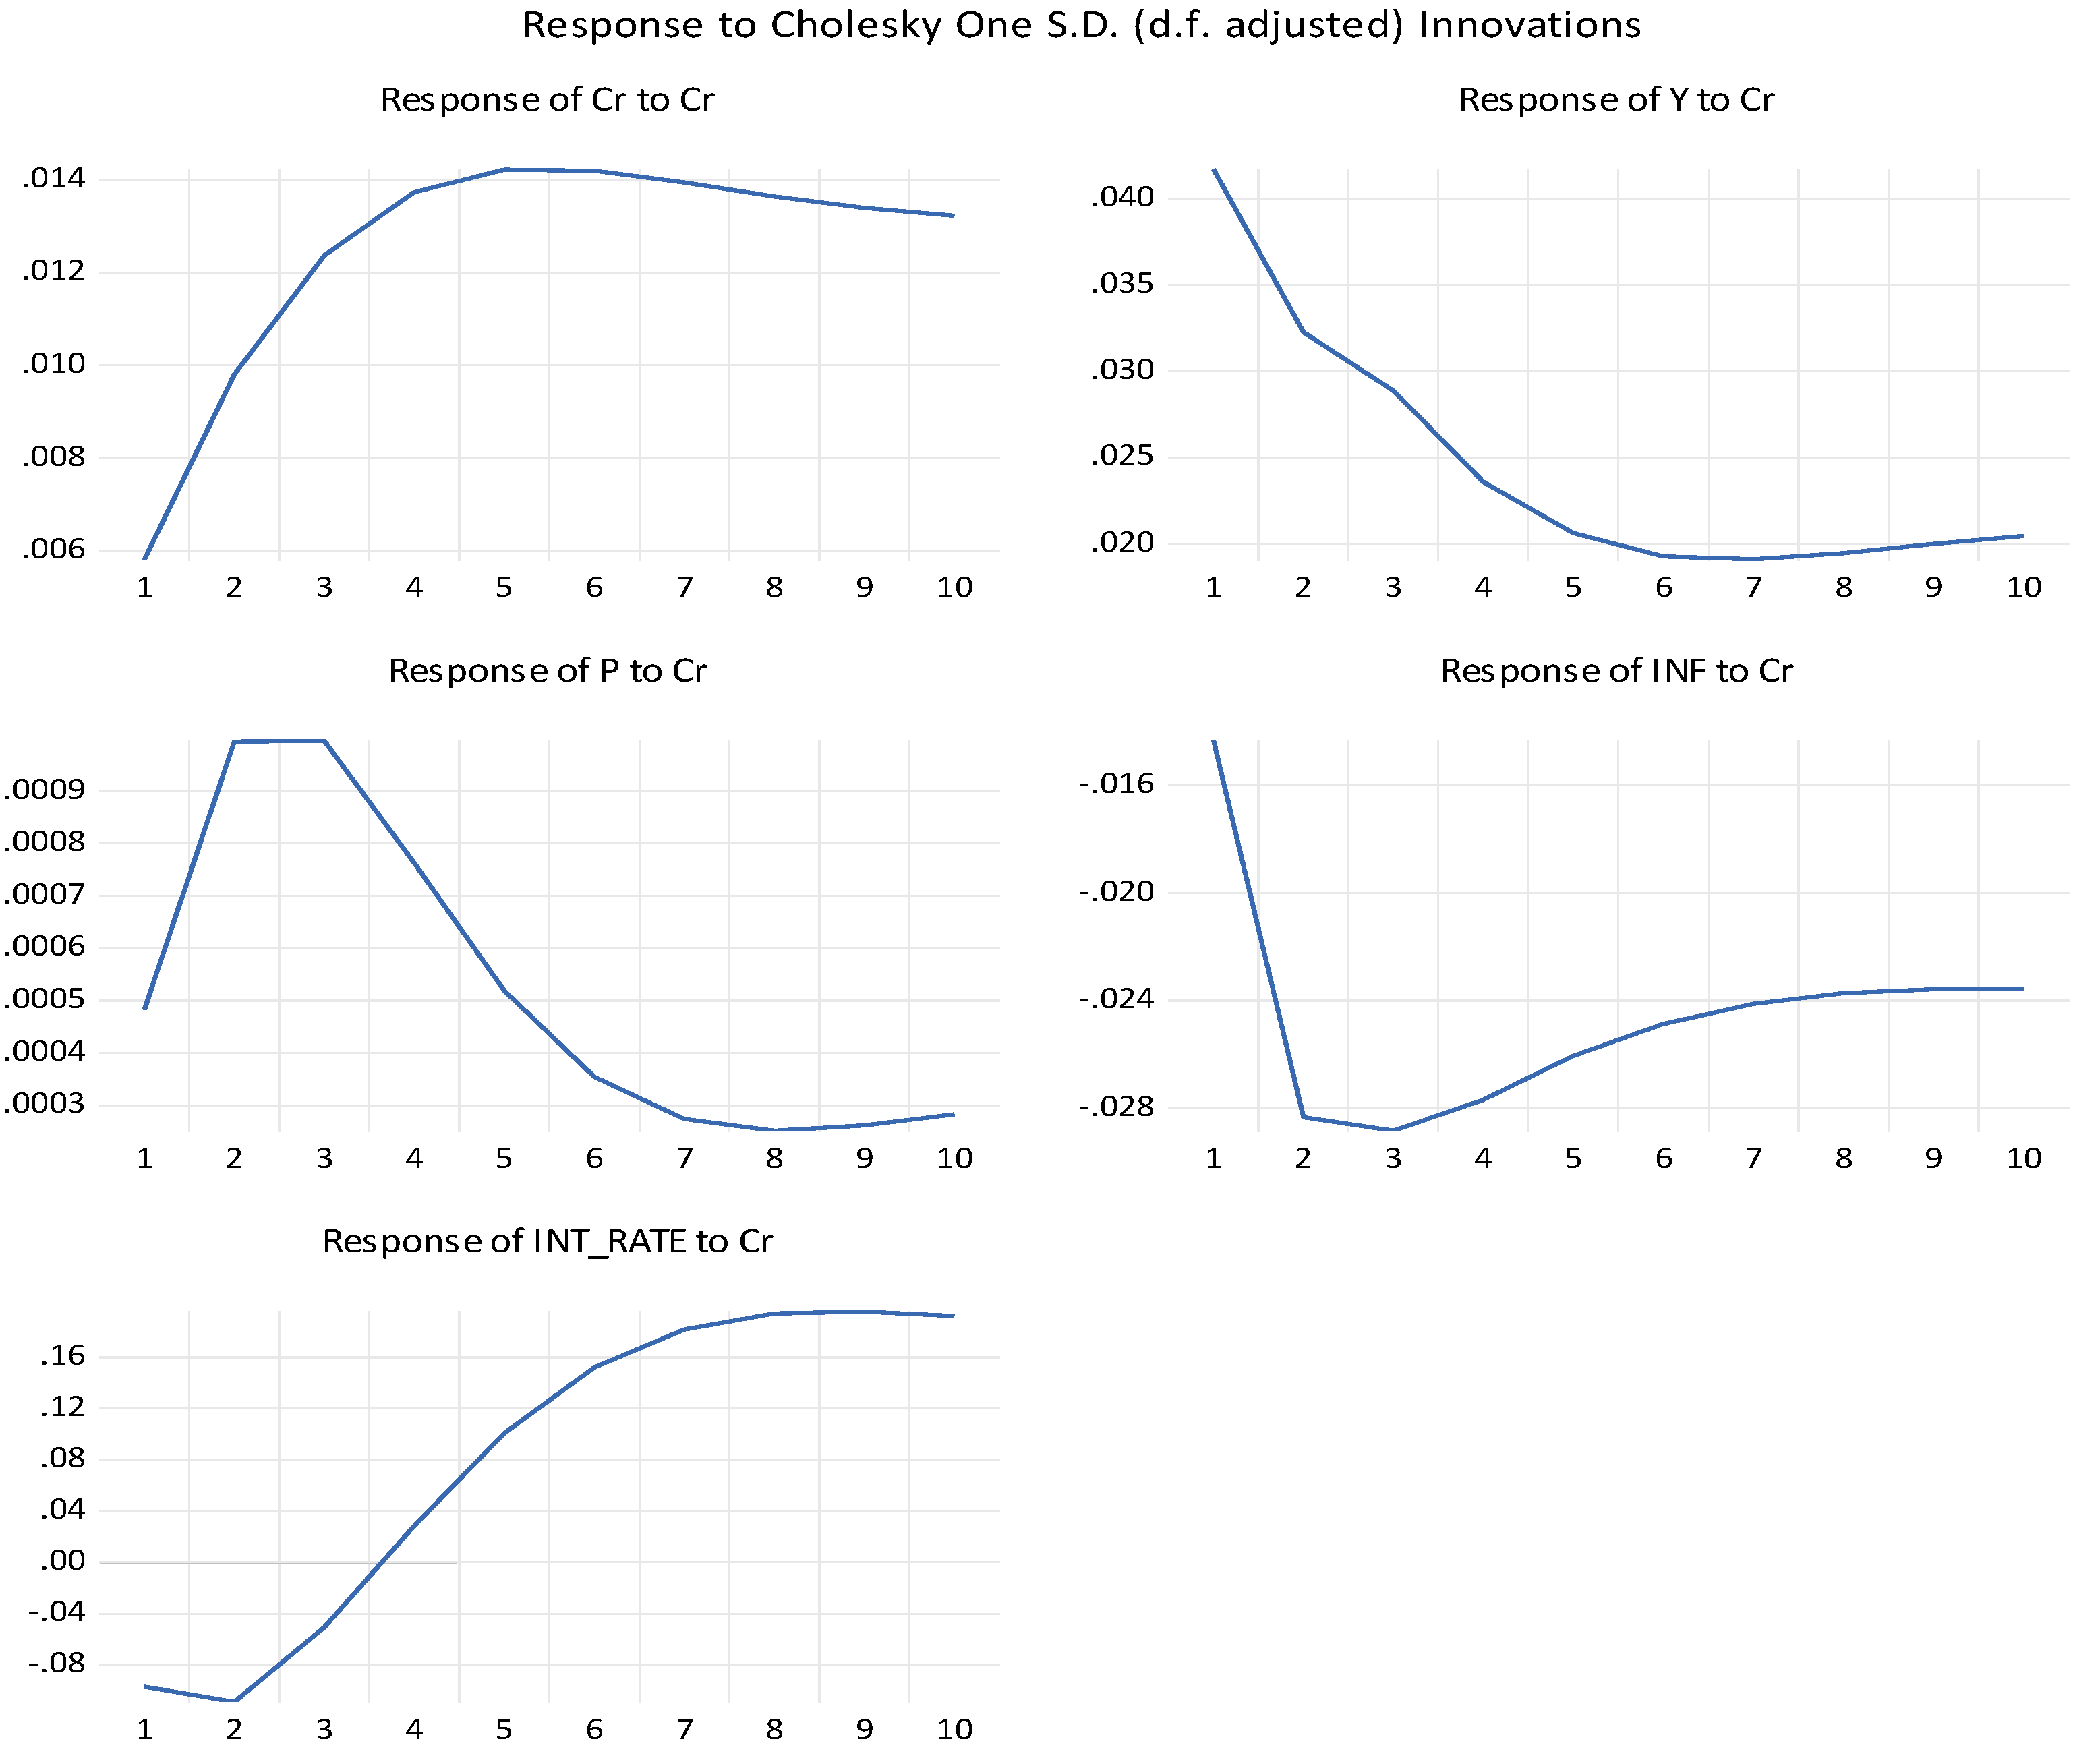
Abstract
:1. Introduction
2. Literature Review
3. Materials and Methods
4. Results
4.1. Cointegration Test
4.1.1. For Ankara
4.1.2. For Istanbul
4.1.3. For Izmir
4.2. Vector Error Correction Model
4.2.1. VECM (for Ankara)
4.2.2. VECM (for Istanbul)
4.2.3. VECM (for Izmir)
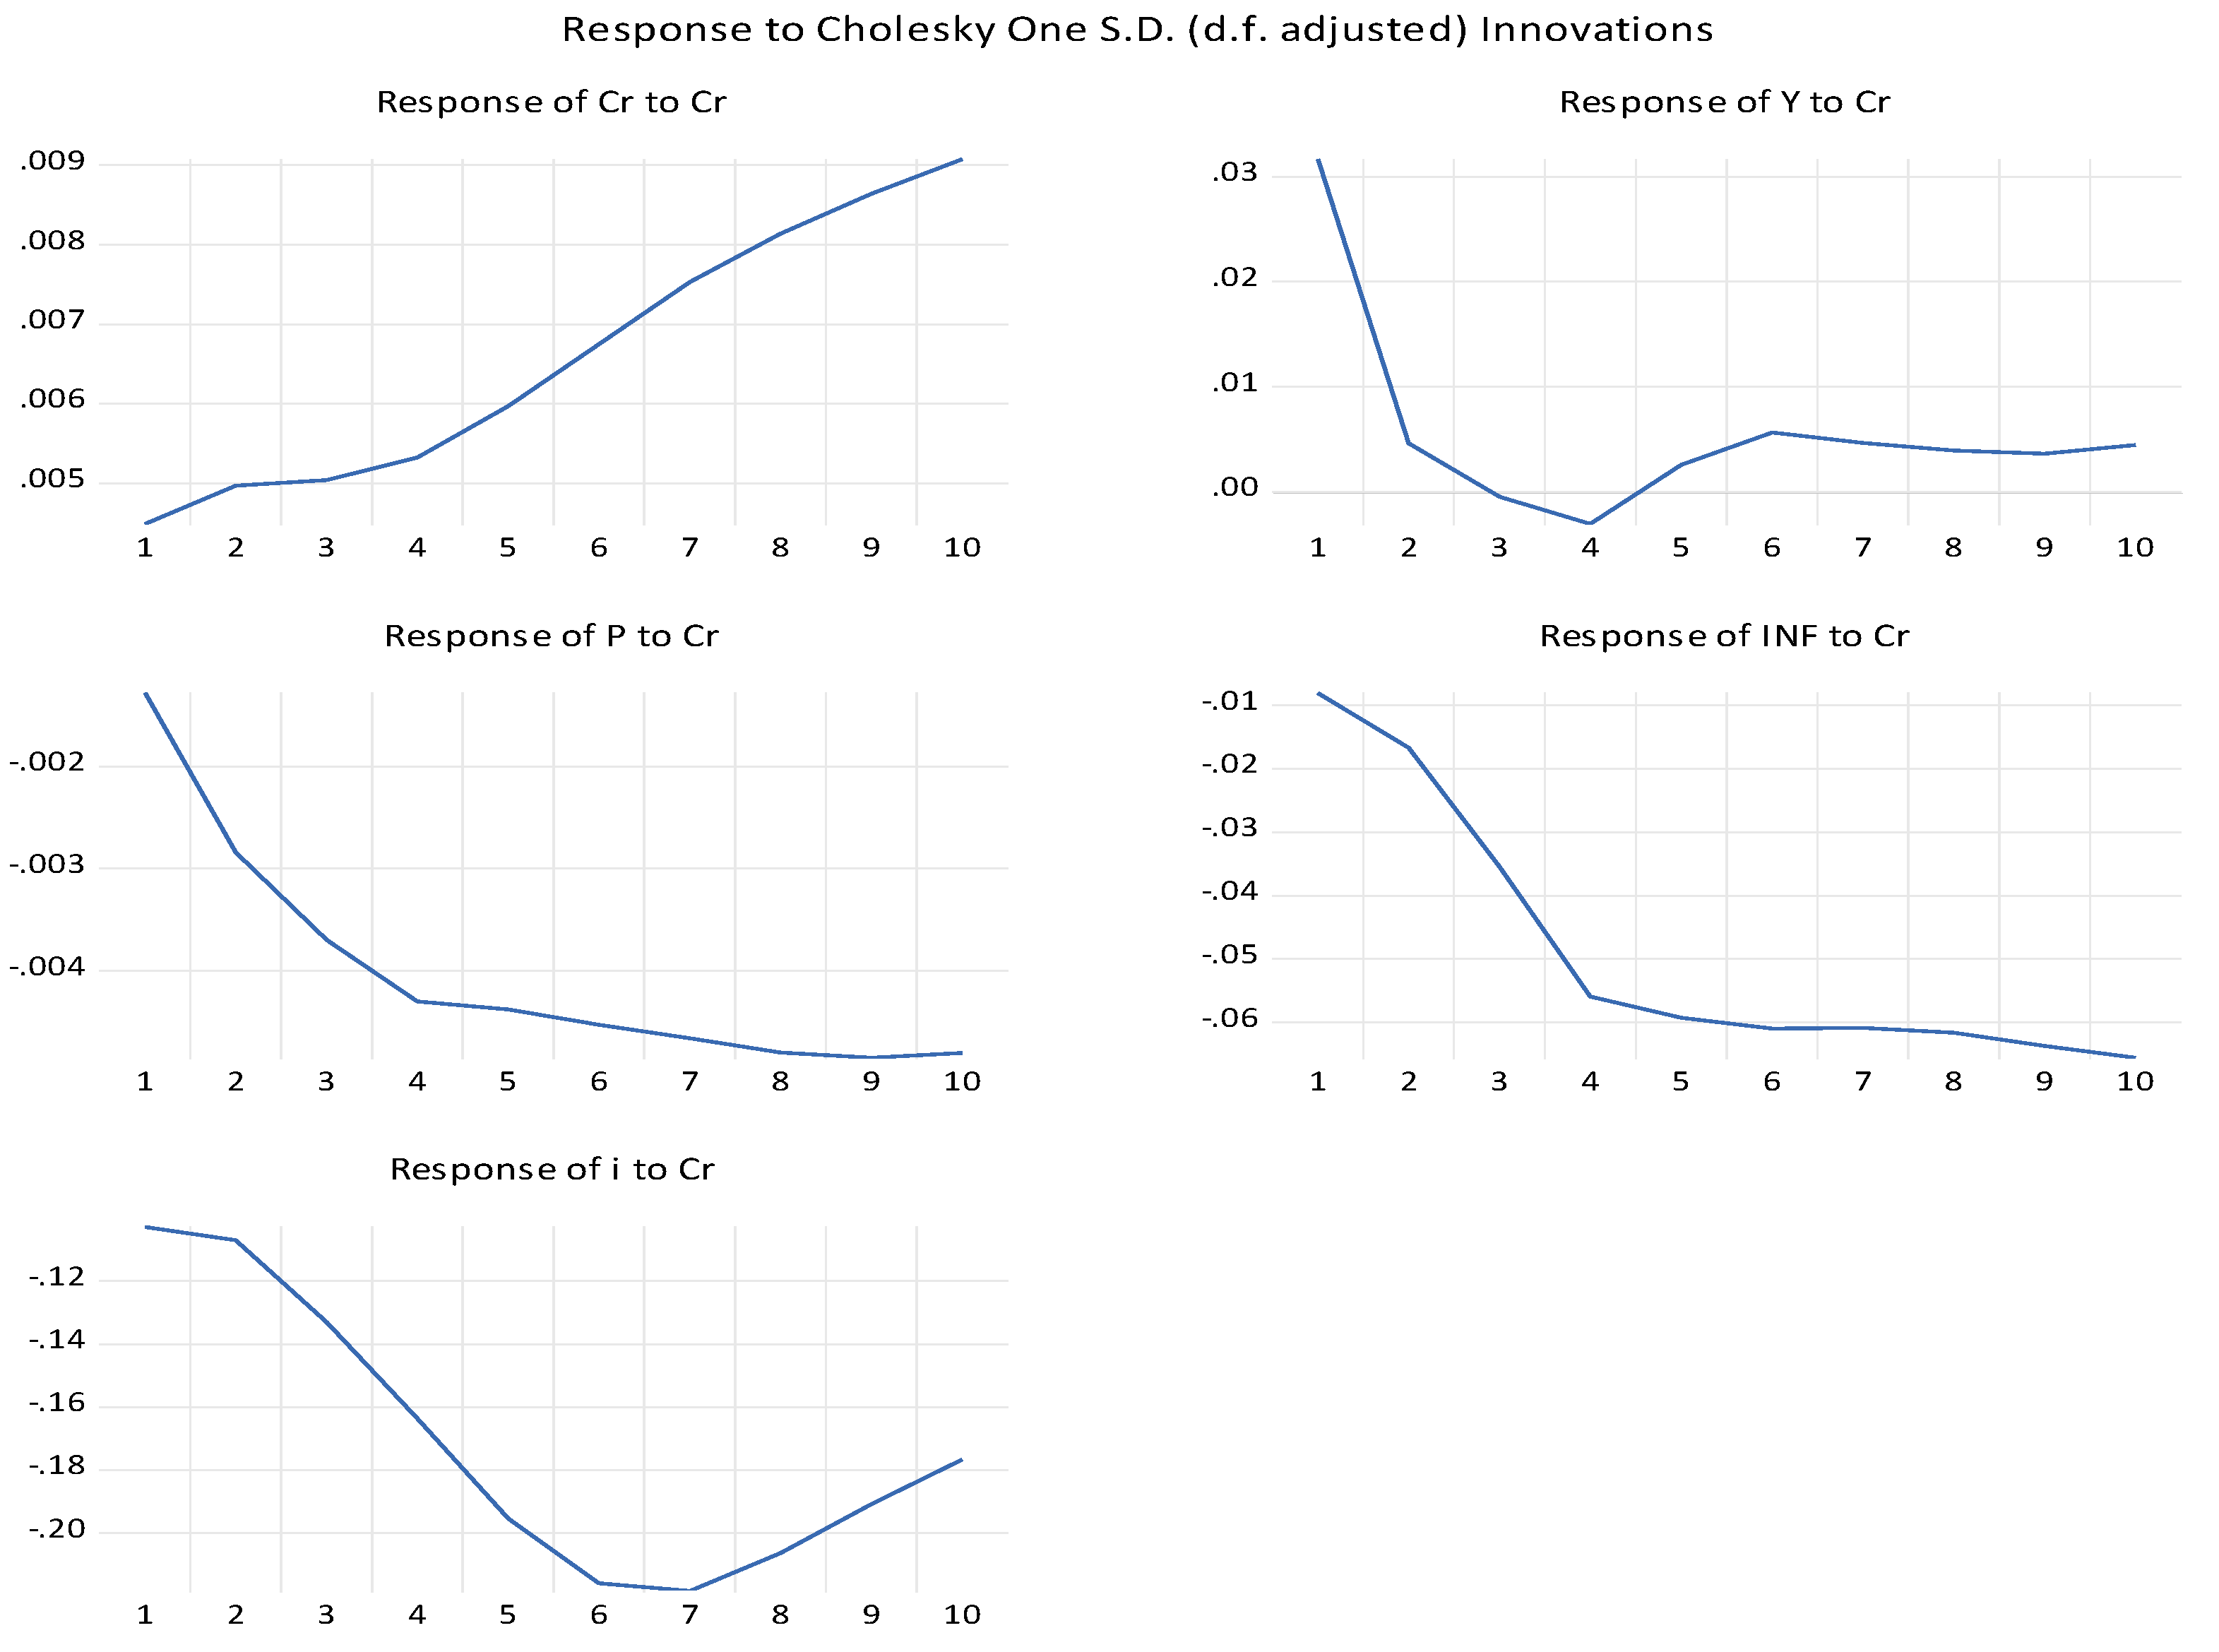
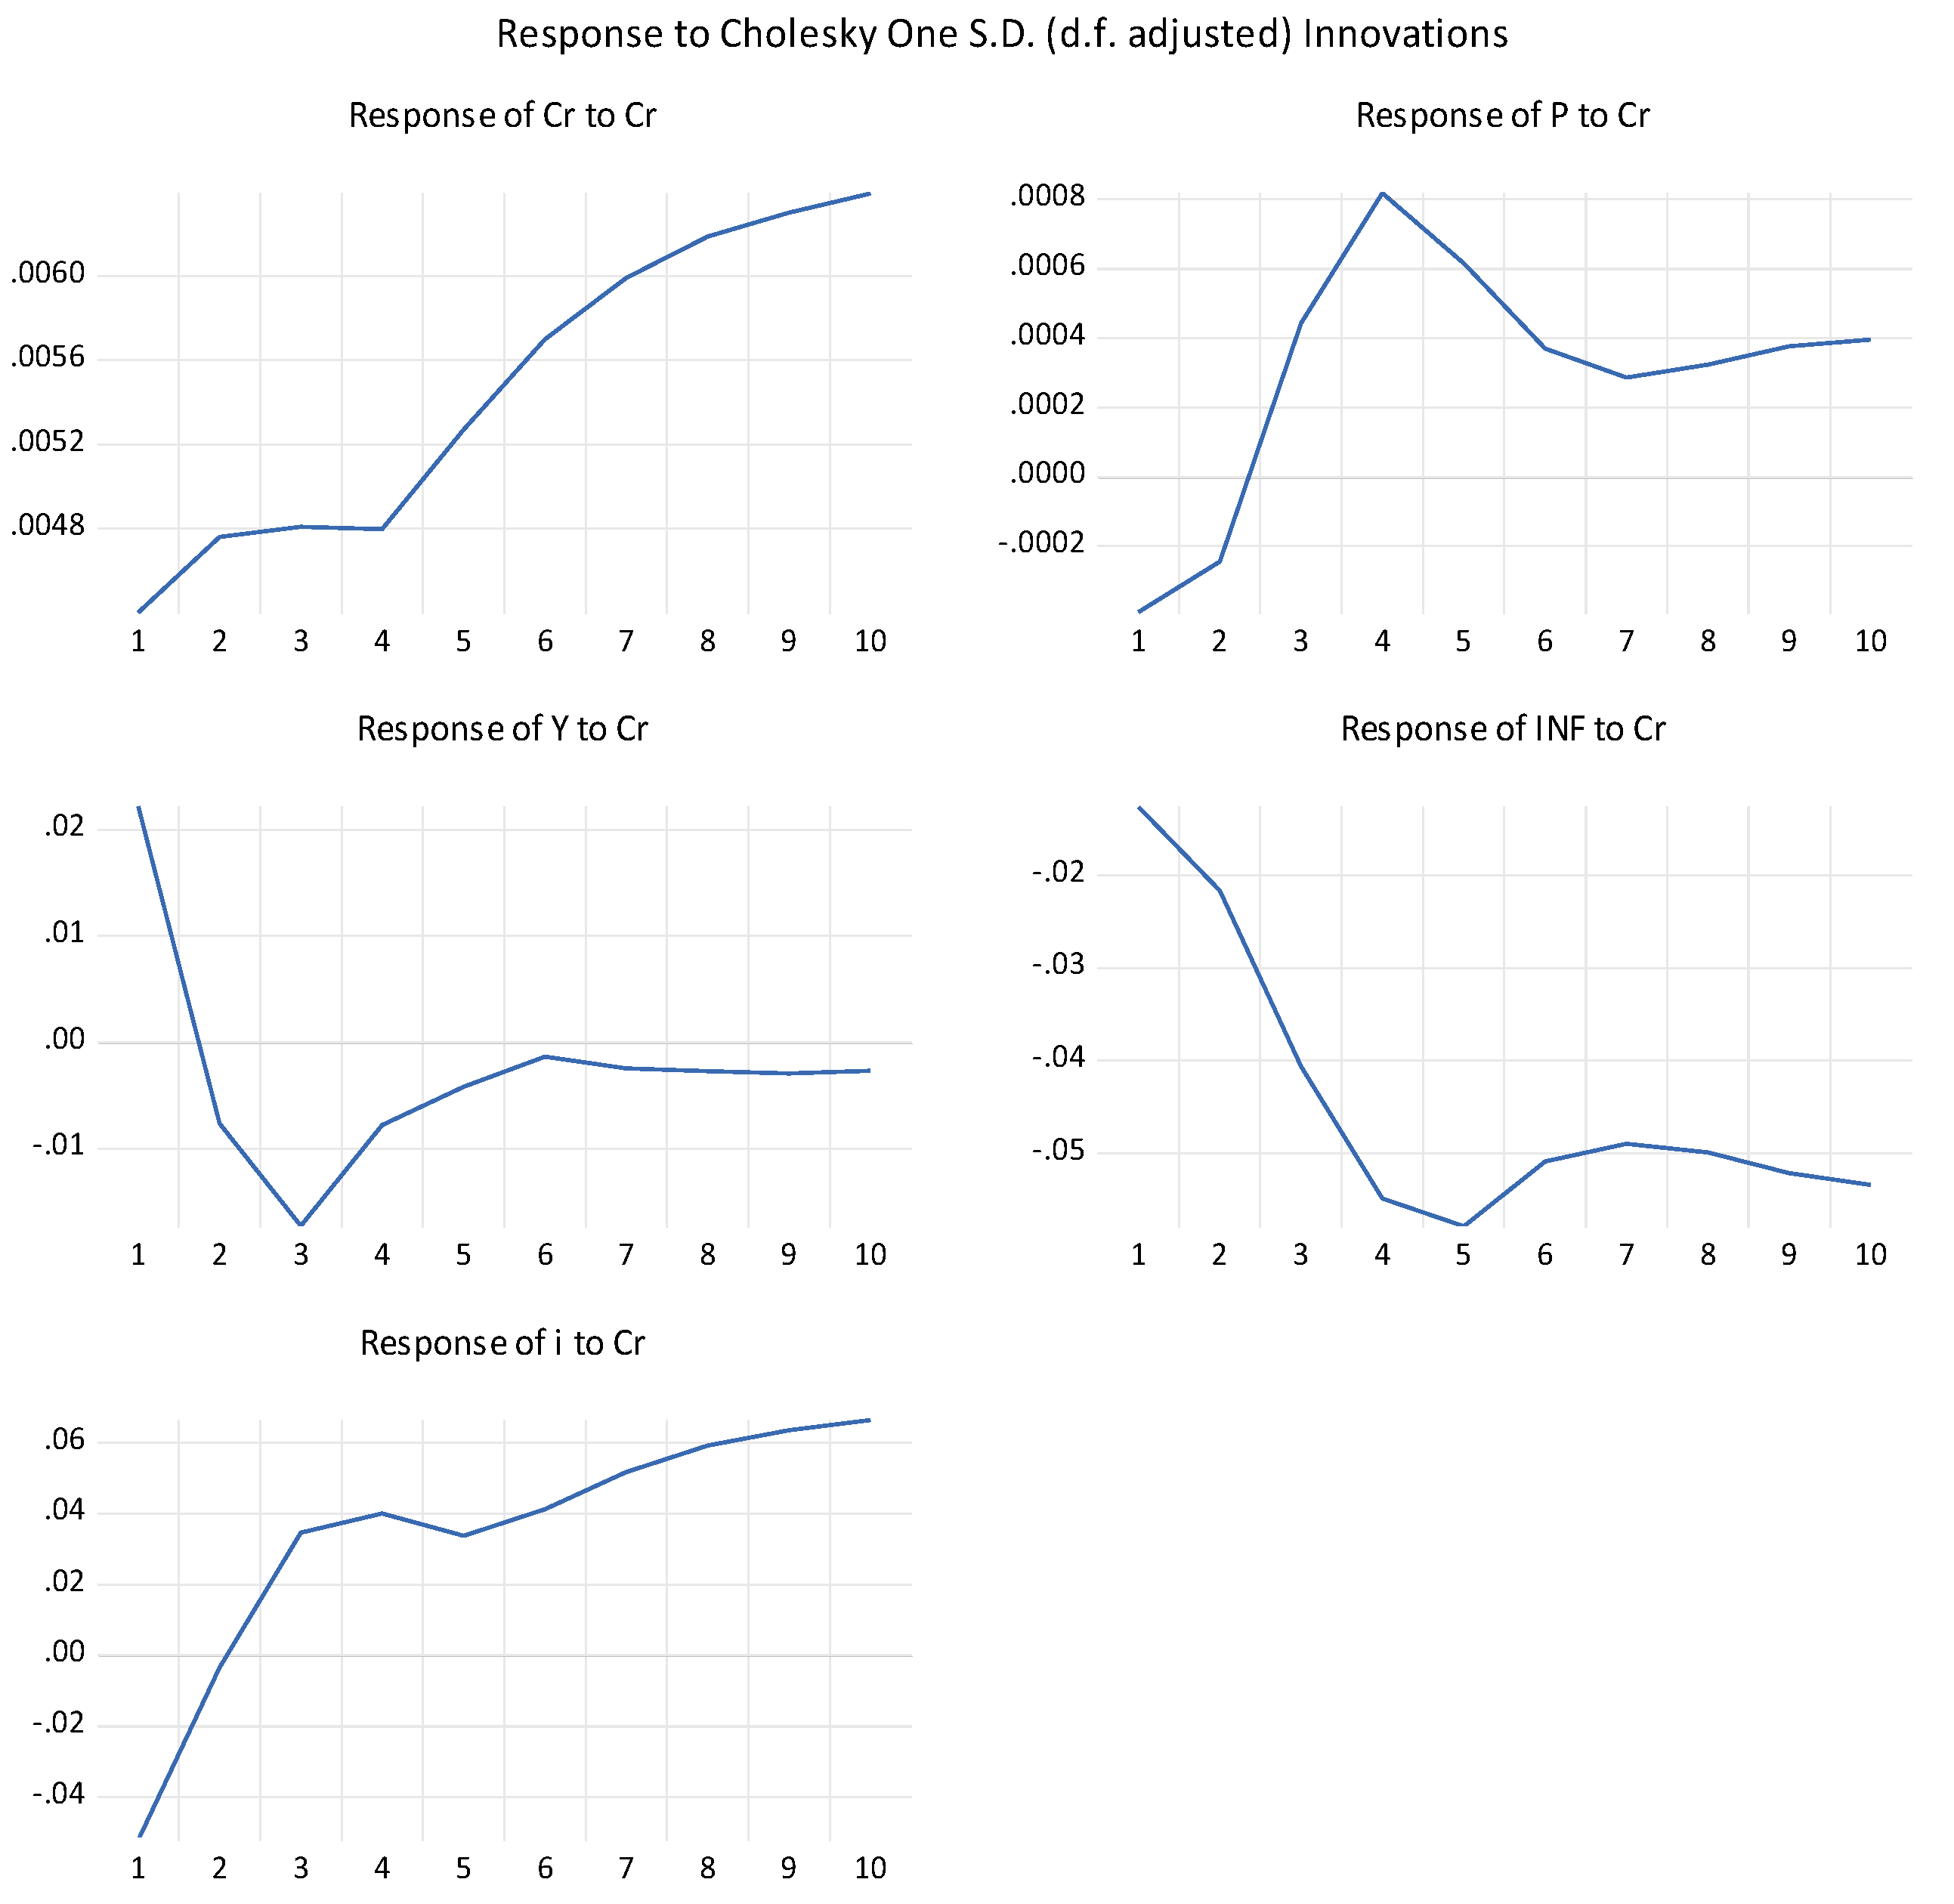
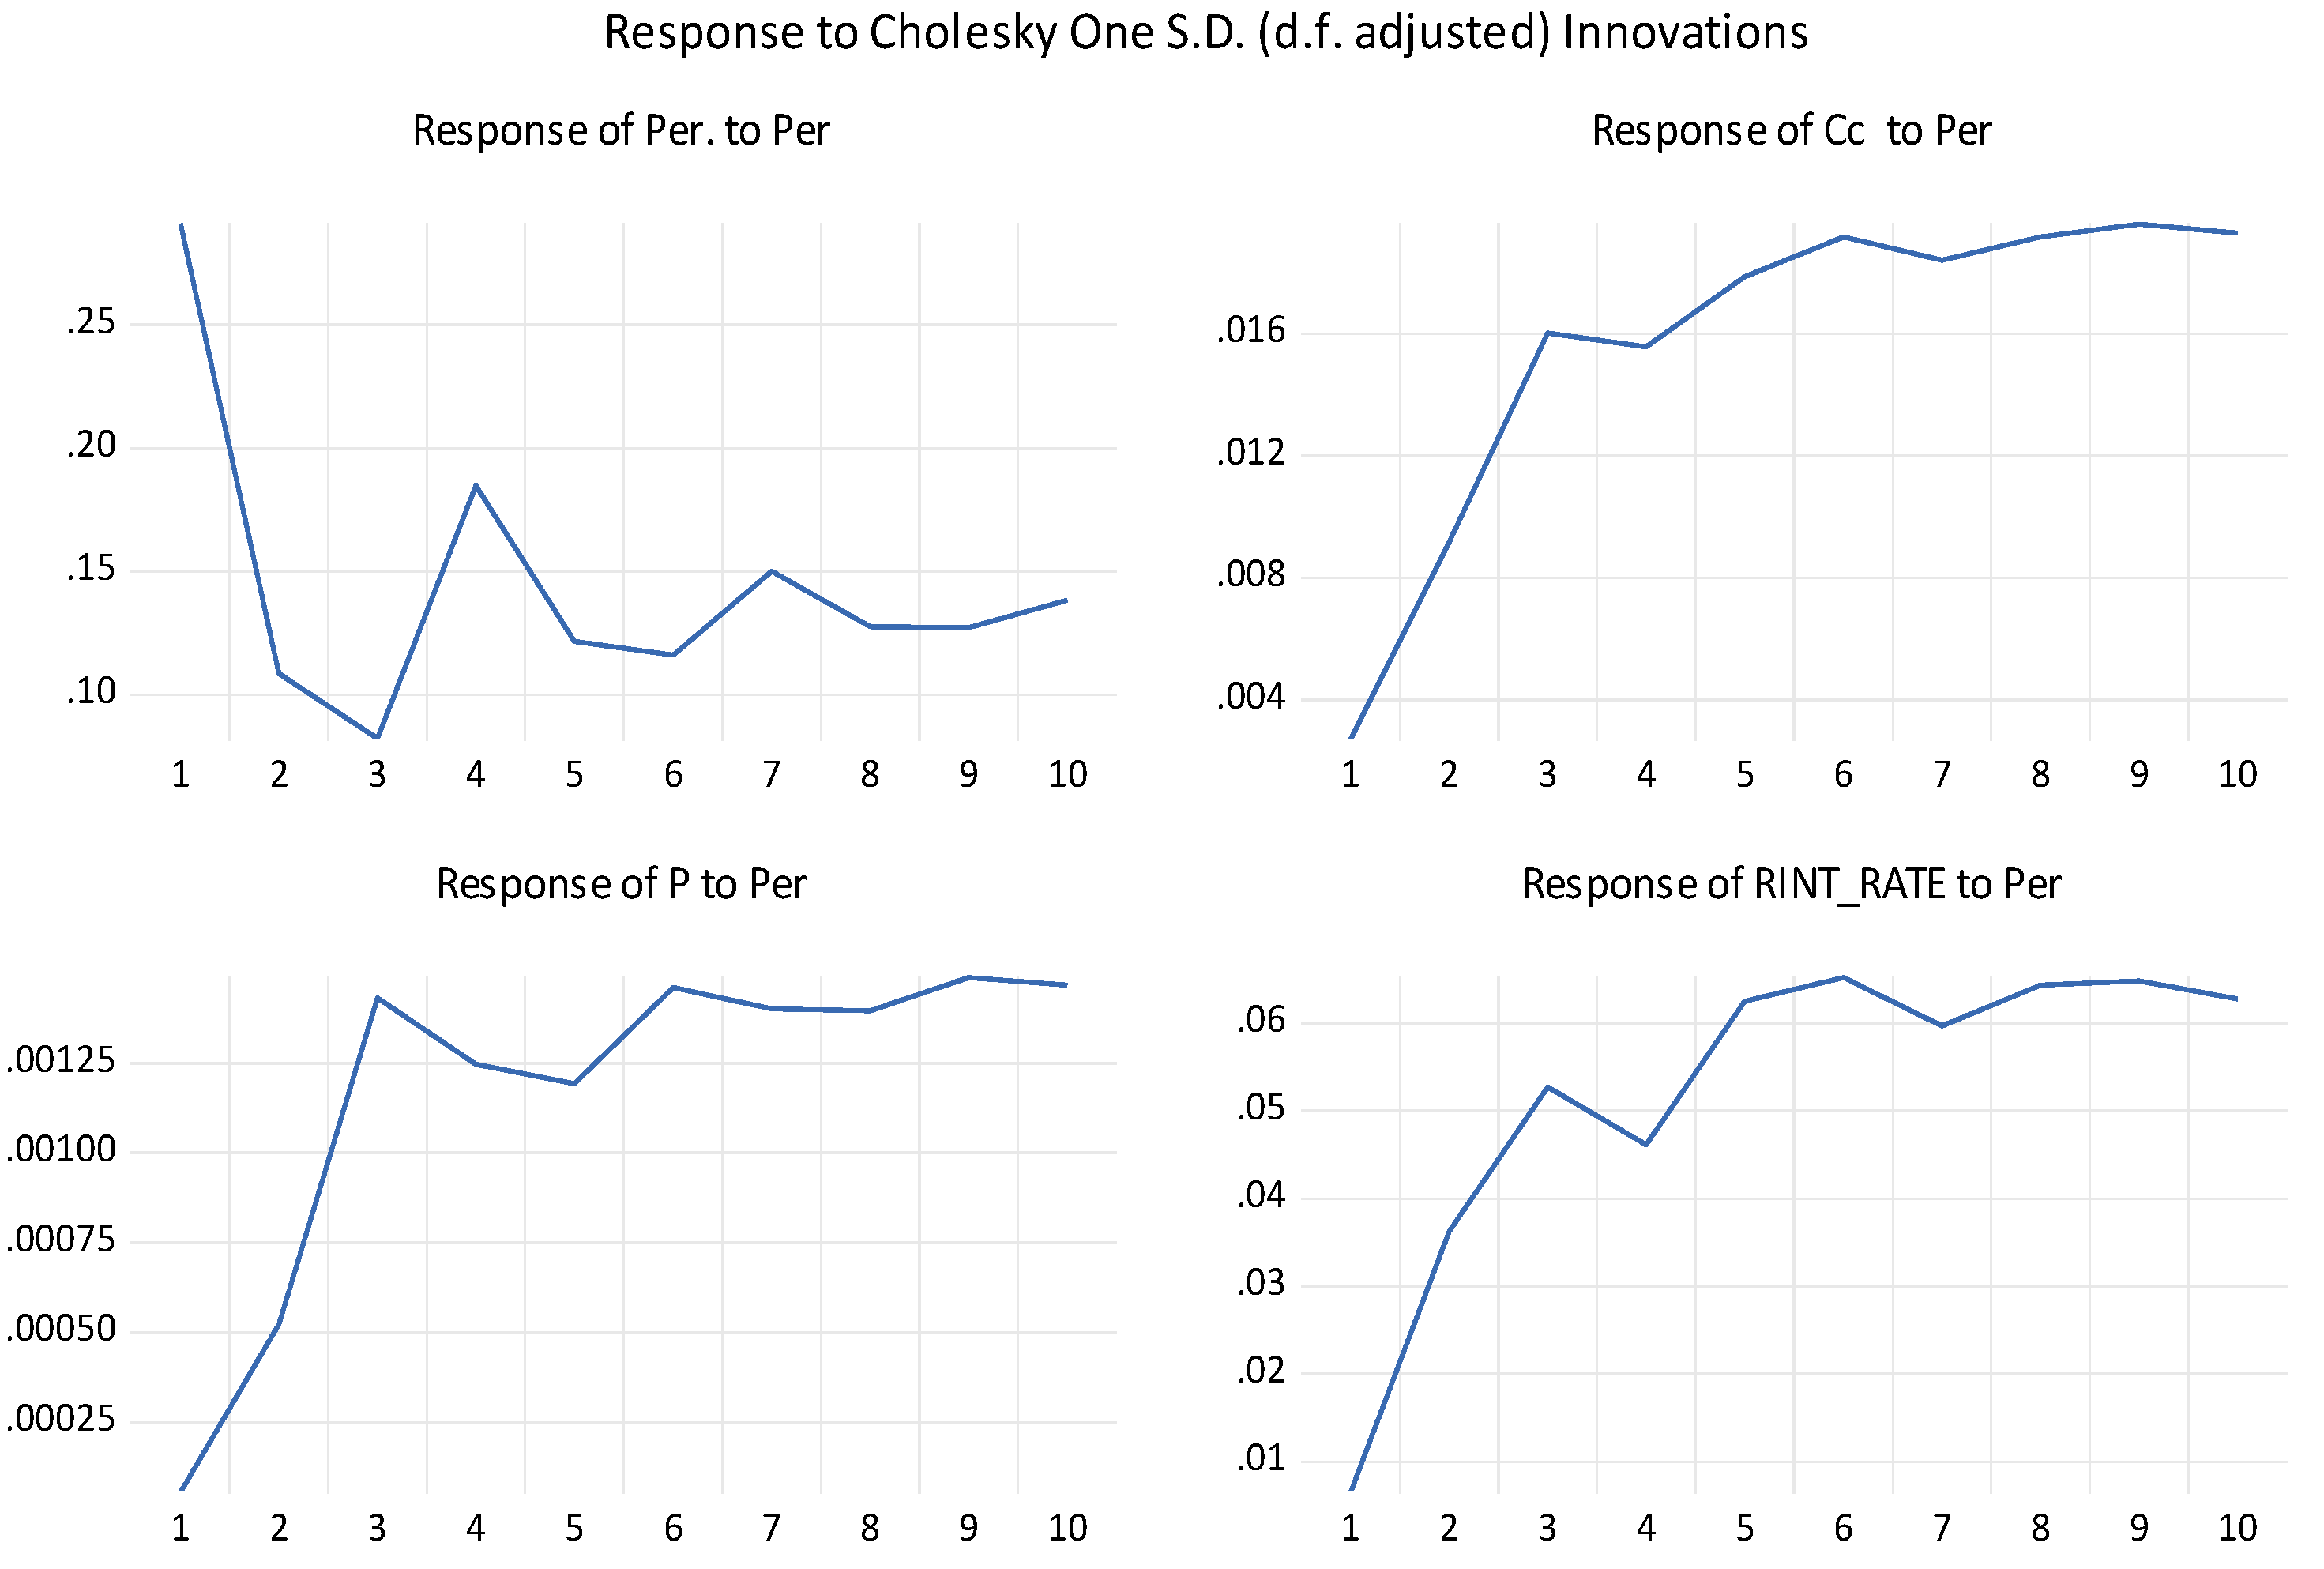
4.3. Impulse Response Analysis
4.3.1. Ankara (Housing Demand Model)
4.3.2. Ankara (Housing Supply Model)
4.3.3. Istanbul (Housing Demand Model)
4.3.4. Istanbul (Housing Supply Model)
4.3.5. Izmir (Housing Demand Model)
4.3.6. Izmir (Housing Supply Model)
4.4. Forecast Variance Decomposition
5. Discussion and Conclusions
Author Contributions
Funding
Institutional Review Board Statement
Informed Consent Statement
Data Availability Statement
Conflicts of Interest
References
- Krupskyi, O. Role of organisational culture in innovation development of tourism and hospitality enterprises providing. Econ. Ann. XXI 2015, 155, 96–99. [Google Scholar]
- Rozin, V. The pandemic, the crisis of modernity, and the need for a new semantic project of civilization. Philos. Cosmol. 2020, 25, 32–42. [Google Scholar] [CrossRef]
- Perevozova, I.; Horal, L.; Daliak, N.; Karlova, O.; Chekmasova, I.; Shyiko, V. Experimental management of ecological security of territorial facilities for forecasting the developing economy dynamics. IOP Conf. Ser. Earth Environ. Sci. 2021, 628, 012022. [Google Scholar] [CrossRef]
- Sun, X.; Su, Y.; Liu, H.; Li, C. The impact of house price on urban household consumption: Micro evidence from China. Sustainability 2022, 14, 12592. [Google Scholar] [CrossRef]
- Mohamed, B.E.; Carbone, C. Mass customization of housing: A framework for harmonizing individual needs with factory produced housing. Buildings 2022, 12, 955. [Google Scholar] [CrossRef]
- Ellis, L. The Housing Meltdown: Why Did It Happen in the United States? BIS Working Paper No. 259. 2008. Available online: https://doi.org/10.2139/ssrn.1307629 (accessed on 12 September 2022). [CrossRef] [Green Version]
- Verick, S.; Islam, I. The Great recession of 2008–2009: Causes, consequences and policy responses. IZA Discussion Paper No. 4934. Conseq. Policy Responses 2010. [Google Scholar] [CrossRef]
- Leamer, E.E. Housing really is the business cycle: What survives the lessons of 2008–09? J. Money Credit Bank. 2015, 47, 43–50. [Google Scholar] [CrossRef]
- Justiniano, A.; Primiceri, G.E.; Tambalotti, A. Credit supply and the housing boom. J. Political Econ. 2019, 127, 1317–1350. [Google Scholar] [CrossRef] [Green Version]
- Favara, G.; Imbs, J. Credit supply and the price of housing. Am. Econ. Rev. 2015, 105, 958–992. [Google Scholar] [CrossRef] [Green Version]
- Kwoun, M.-J.; Lee, S.-H.; Kim, J.-H.; Kim, J.-J. Dynamic cycles of unsold new housing stocks, investment in housing, and housing supply–demand. Math. Comput. Model. 2013, 57, 2094–2105. [Google Scholar] [CrossRef]
- Puradkar, R.A.P. Concept of Social Justice through the lenses of Dr. B.R. Ambedkar: An Appraisal. Future Hum. Image 2022, 17, 6–13. [Google Scholar] [CrossRef]
- De Leeuw, F. The demand for housing: A review of cross-section evidence. Rev. Econ. Stat. 1971, 53, 1–10. [Google Scholar] [CrossRef]
- Petrova, M.; Koval, V.; Tepavicharova, M.; Zerkal, A.; Radchenko, A.; Bondarchuk, N. The interaction between the human resources motivation and the commitment to the organization. J. Secur. Sustain. Issues 2020, 9, 897–907. [Google Scholar] [CrossRef]
- Engerstam, S.; Warsame, A.; Wilhelmsson, M. Long-term dynamics of new residential supply: A case study of the apartment segment in Sweden. Buildings 2022, 12, 970. [Google Scholar] [CrossRef]
- Federico, d.A. What advantages do adaptive industrial heritage reuse processes provide? An econometric model for estimating the impact on the surrounding residential housing market. Heritage 2022, 5, 1572–1592. [Google Scholar] [CrossRef]
- San Ong, T. Factors affecting the price of housing in Malaysia. J. Emerg. Issues Econ. Financ. Bank 2013, 1, 414–429. [Google Scholar]
- Kovalchuk, Y.; Furman, I.; Humenyuk, H.; Kucher, A. Potential and opportunities for development of tourism in Ukraine. J. Environ. Manag. Tour. 2020, 11, 194–201. [Google Scholar] [CrossRef]
- Bergantino, A.S.; Biscione, A.; de Felice, A.; Porcelli, F.; Zagaria, R. Kindergarten Proximity and the Housing Market Price in Italy. Economies 2022, 10, 222. [Google Scholar] [CrossRef]
- Afxentiou, D.; Harris, P.; Kutasovic, P. The COVID-19 housing boom: Is a 2007–2009-type crisis on the horizon? J. Risk Financ. Manag. 2022, 15, 371. [Google Scholar] [CrossRef]
- Gao, X.; Kong, W.; Hu, Z. The effects of national fundamental factors on regional house prices: A factor-augmented VAR analysis. J. Risk Financ. Manag. 2022, 15, 309. [Google Scholar] [CrossRef]
- Solak, A.O.; Kabadayi, B. An econometric analysis of housing demand in Turkey. Adv. Manag. Appl. Econ. 2016, 6, 47–57. [Google Scholar]
- Krupskyi, O.P.; Sardak, S.E.; Kolbushkin, Y.P.; Stasyuk, Y.M. Formation of the economic security system of tourism and hospitality enterprises. J. Adv. Res. Law Econ. 2019, 10, 1159–1175. [Google Scholar] [CrossRef]
- Zyma, O.; Soloviova, O. Sanitary protection and space activities. Adv. Space Law 2020, 6, 72–79. [Google Scholar] [CrossRef]
- Piliaiev, I. The east-west dichotomy in the globalizing perspective. Ukr. Policymaker 2021, 9, 86–92. [Google Scholar] [CrossRef] [PubMed]
- Isti’Anah, M.; Suhud, U.; Usman, O. Analyzing decision-making factors for using social media: The role trust and information sharing. Eur. J. Manag. Issues 2022, 30, 142–151. [Google Scholar] [CrossRef]
- Ramphele, M.; Msosa, S.K. Determinants of social media marketing adoption in small, medium and micro enterprises during the COVID-19 pandemic. Eur. J. Manag. Issues 2022, 30, 92–99. [Google Scholar] [CrossRef]
- Kuttner, K.N.; Shim, I. Can Non-Interest Rate Policies Stabilise Housing Markets? Evidence from a Panel of 2013. BIS Working Papers. 2013. Available online: https://www.bis.org/publ/work433.pdf (accessed on 22 September 2022).
- Grimes, A.; Aitken, A. Housing supply, land costs and price adjustment. Real Estate Econ. 2010, 38, 325–353. [Google Scholar] [CrossRef]
- Phillips, B.; Joseph, C. Regional Housing Supply and Demand in Australia; CSRM Working Paper No. 1/2017; The Australian National University: Canberra, Australia, 2017. [Google Scholar]
- Wang, S.; Chan, S.H.; Xu, B. The estimation and determinants of the price elasticity of housing supply: Evidence from China. J. Real Estate Res. 2012, 34, 311–344. [Google Scholar] [CrossRef]
- Guo, M.; Wu, Q. The empirical analysis of affecting factors of Shanghai housing prices. Int. J. Bus. Soc. Sci. 2013, 4, 218–223. [Google Scholar]
- Wang, Z.; Zhang, Q. Fundamental factors in the housing markets of China. J. Hous. Econ. 2014, 25, 53–61. [Google Scholar] [CrossRef]
- Sari, R.; Ewing, B.T.; Aydin, B.; Aydin, B. Macroeconomic Variables and the Housing Market in Turkey. Emerg. Mark. Financ. Trade 2007, 43, 5–19. [Google Scholar] [CrossRef]
- Varli, Y.; Erdem, O. The demand and supply model of housing: Evidence from the turkish housing market. SSRN Electron. J. 2014. [Google Scholar] [CrossRef]
- Zayed, N.M.; Khan, S.; Shahi, S.K.; Afrin, M. Impact of coronavirus (COVID-19) on the world economy, 2020: A conceptual analysis. J. Humanit. Arts Soc. Sci. 2021, 5, 1–5. [Google Scholar] [CrossRef]
- Beridze, T.; Cherep, A.; Baranik, Z.; Korenyev, V.; Vasylchuk, I. Analysis of the regression model of the enterprise’s financial activity by research on residual error. Nauk. Visnyk Natsionalnoho Hirnychoho Universytetu 2021, 2, 193–197. [Google Scholar] [CrossRef]
- Pustoviit, R.; Kuklin, O.; Azmuk, N.; Yakushyk, I.; Gunko, V. Institutional genesis of kleptocratic economy and its formation in Ukraine. Nauk. Visnyk Natsionalnoho Hirnychoho Universytetu 2021, 5, 180–187. [Google Scholar] [CrossRef]
- Iqbal, M.M.; Zayed, N.M.; Shahi, S.K. An analysis of the effects of corona virus (COVID-19) on the demand for & supply of goods/services in international economy, 2020. Shodh Sarita 2020, 7, 61–66. [Google Scholar]
- Saduakasovna, A.A.; Kuandykovna, K.A.; Karahanovna, S.U.; Kuanyshbekovna, M.A.; Amangeldievna, D.S.; Muhtarovich, B.N.; Zayed, N.M. Theoretical and applied aspects of the regulation characteristics of a lease of commercial housing. J. Leg. Ethical Regul. Issues 2021, 24, 1–7. [Google Scholar]


Publisher’s Note: MDPI stays neutral with regard to jurisdictional claims in published maps and institutional affiliations. |
© 2022 by the authors. Licensee MDPI, Basel, Switzerland. This article is an open access article distributed under the terms and conditions of the Creative Commons Attribution (CC BY) license (https://creativecommons.org/licenses/by/4.0/).
Share and Cite
Kader, S.A.; Zayed, N.M.; Faisal-E-Alam, M.; Salah Uddin, M.; Nitsenko, V.; Klius, Y. Factors Affecting Demand and Supply in the Housing Market: A Study on Three Major Cities in Turkey. Computation 2022, 10, 196. https://doi.org/10.3390/computation10110196
Kader SA, Zayed NM, Faisal-E-Alam M, Salah Uddin M, Nitsenko V, Klius Y. Factors Affecting Demand and Supply in the Housing Market: A Study on Three Major Cities in Turkey. Computation. 2022; 10(11):196. https://doi.org/10.3390/computation10110196
Chicago/Turabian StyleKader, Sheikh Abdul, Nurul Mohammad Zayed, Md. Faisal-E-Alam, Muhammad Salah Uddin, Vitalii Nitsenko, and Yuliia Klius. 2022. "Factors Affecting Demand and Supply in the Housing Market: A Study on Three Major Cities in Turkey" Computation 10, no. 11: 196. https://doi.org/10.3390/computation10110196