

Synthetic Displays and Their Potential for Driver Assistance Systems

Abstract
:1. Introduction
1.1. Evolution of Information Displays in Vehicles
1.1.1. The Beginning—Natural Displays
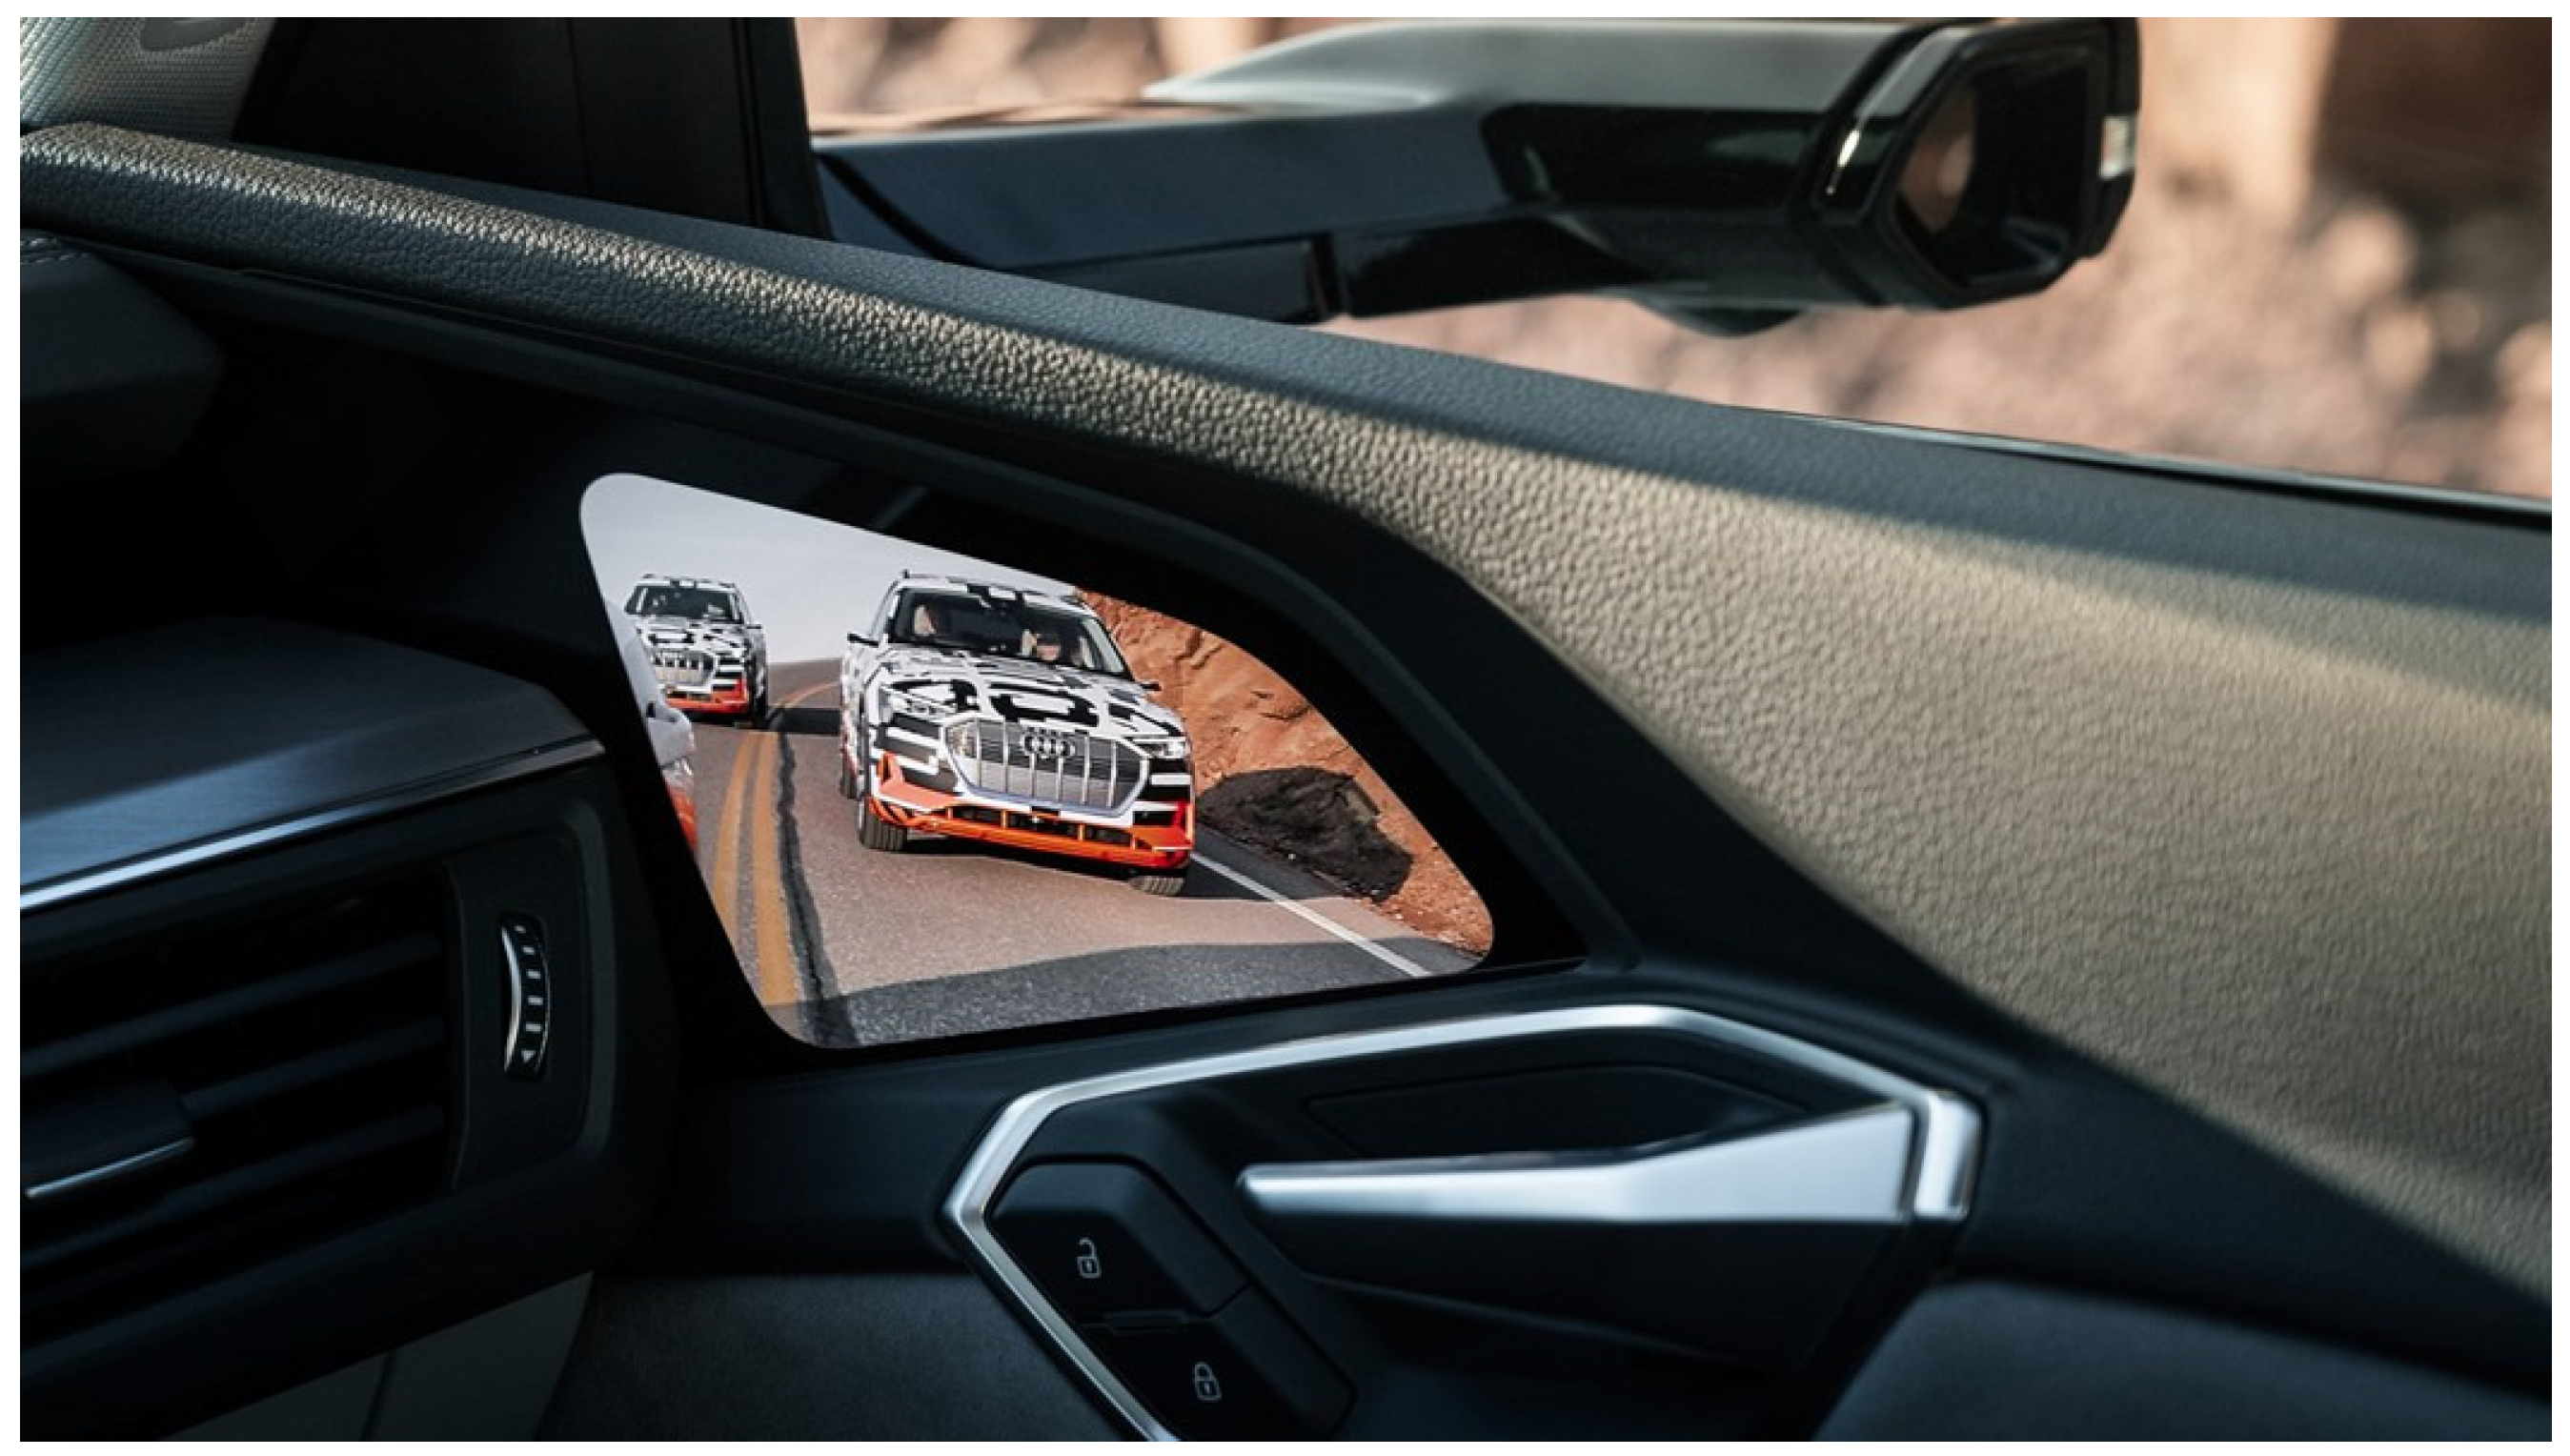
1.1.2. The Evolution—Video-Based Displays
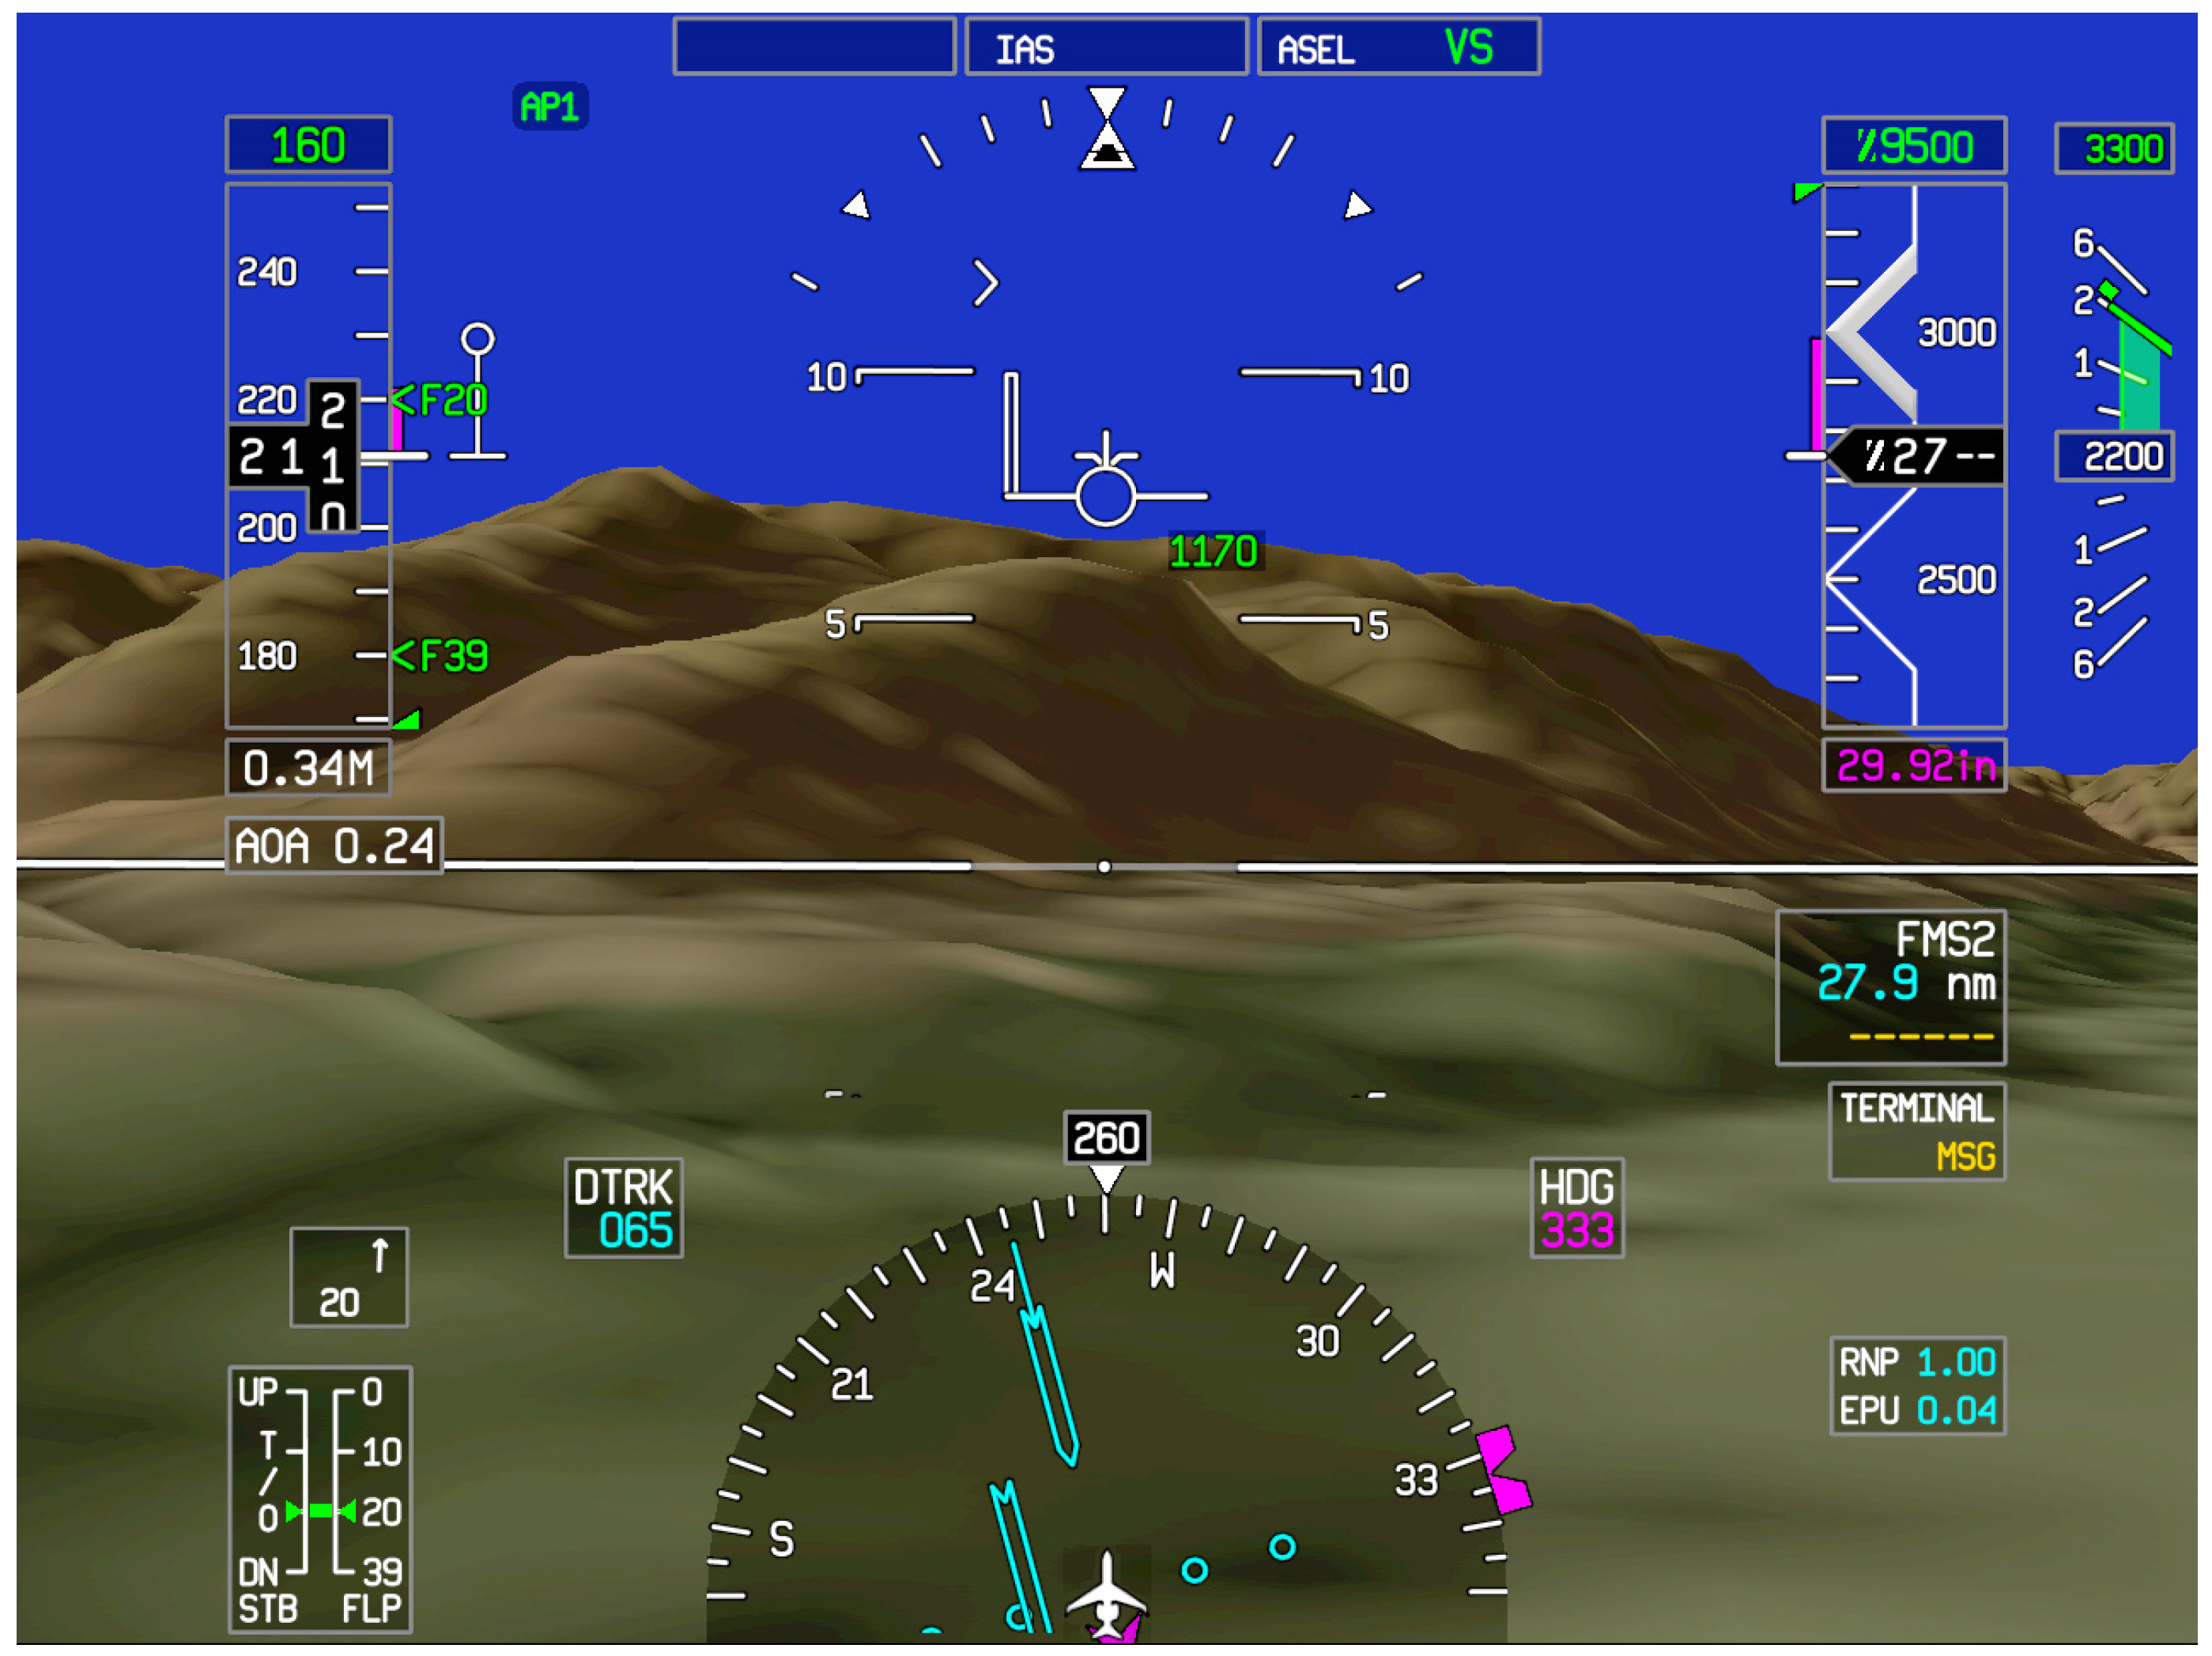
1.1.3. A Revolution—Synthetic Vision Displays
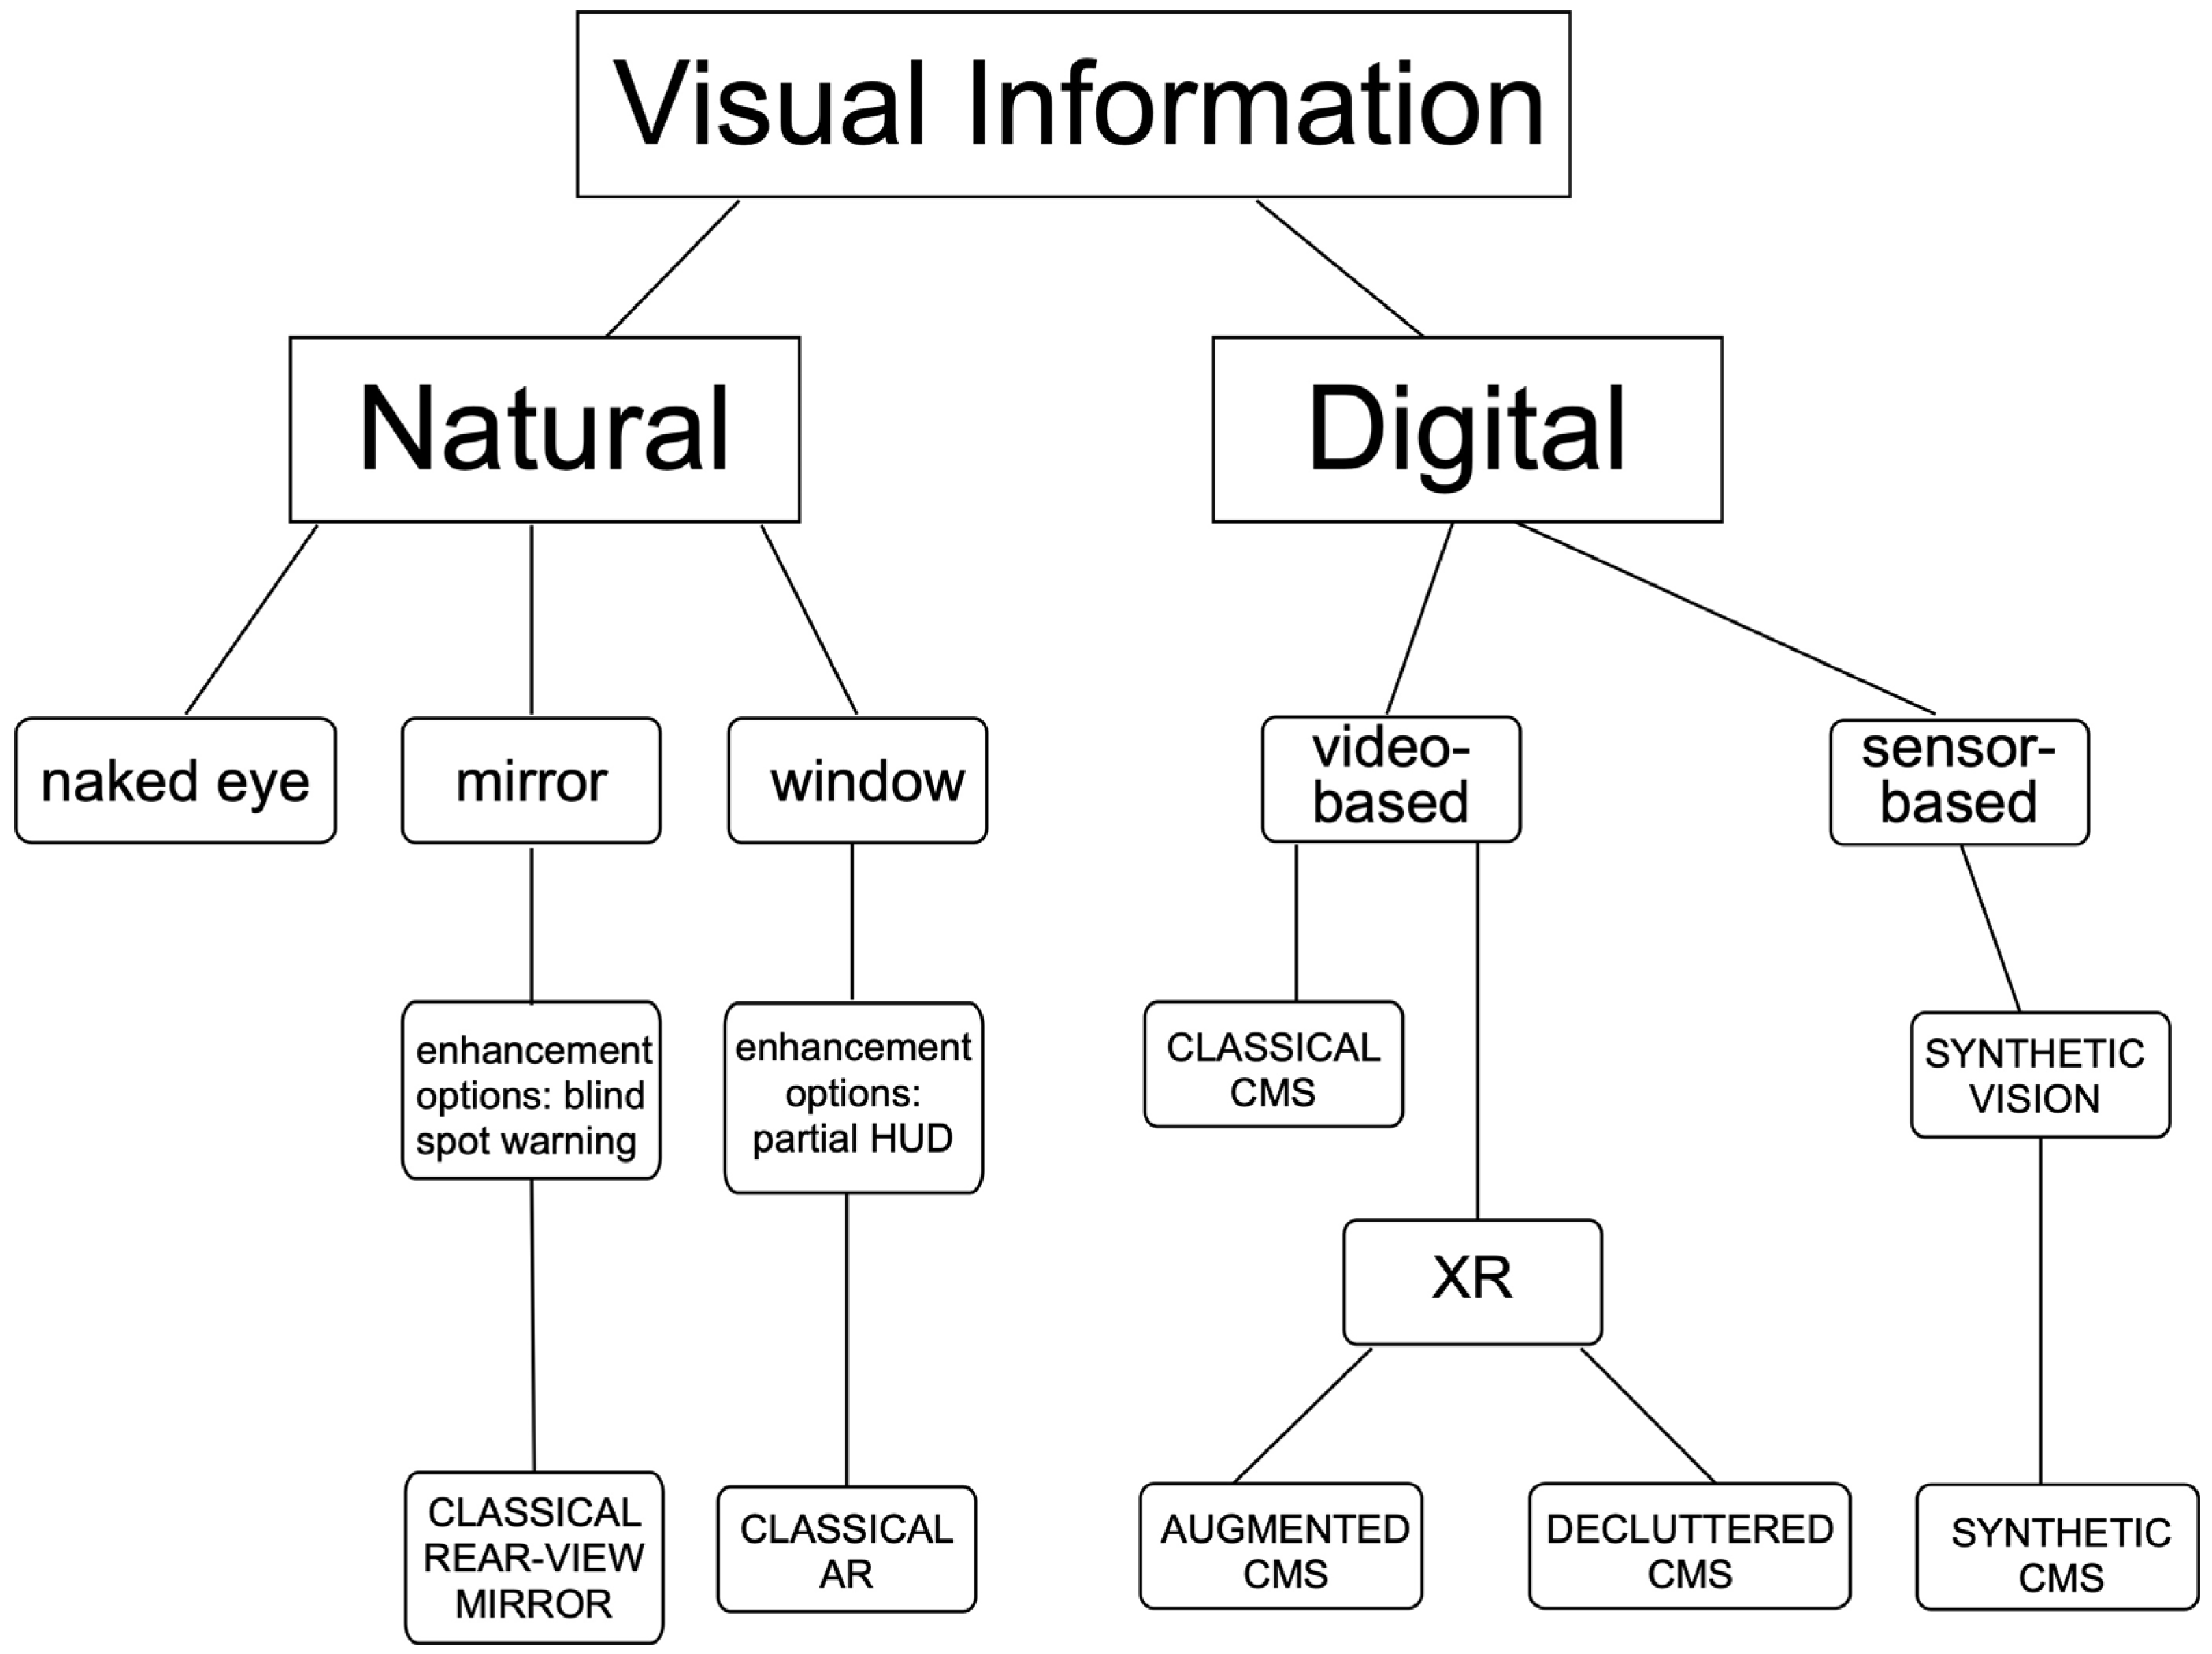
1.2. A Taxonomy of Displays
1.3. Challenges of Information Enhancement in Synthetic Displays
1.3.1. Sensor Integration
1.3.2. Information Load
1.3.3. Driver Distraction
1.4. Information Reduction in Synthetic Displays
2. Experiment: Judging TTC Based on a Simulated SVS
2.1. Methods
2.1.1. Participants
2.1.2. Apparatus
2.1.3. Procedure
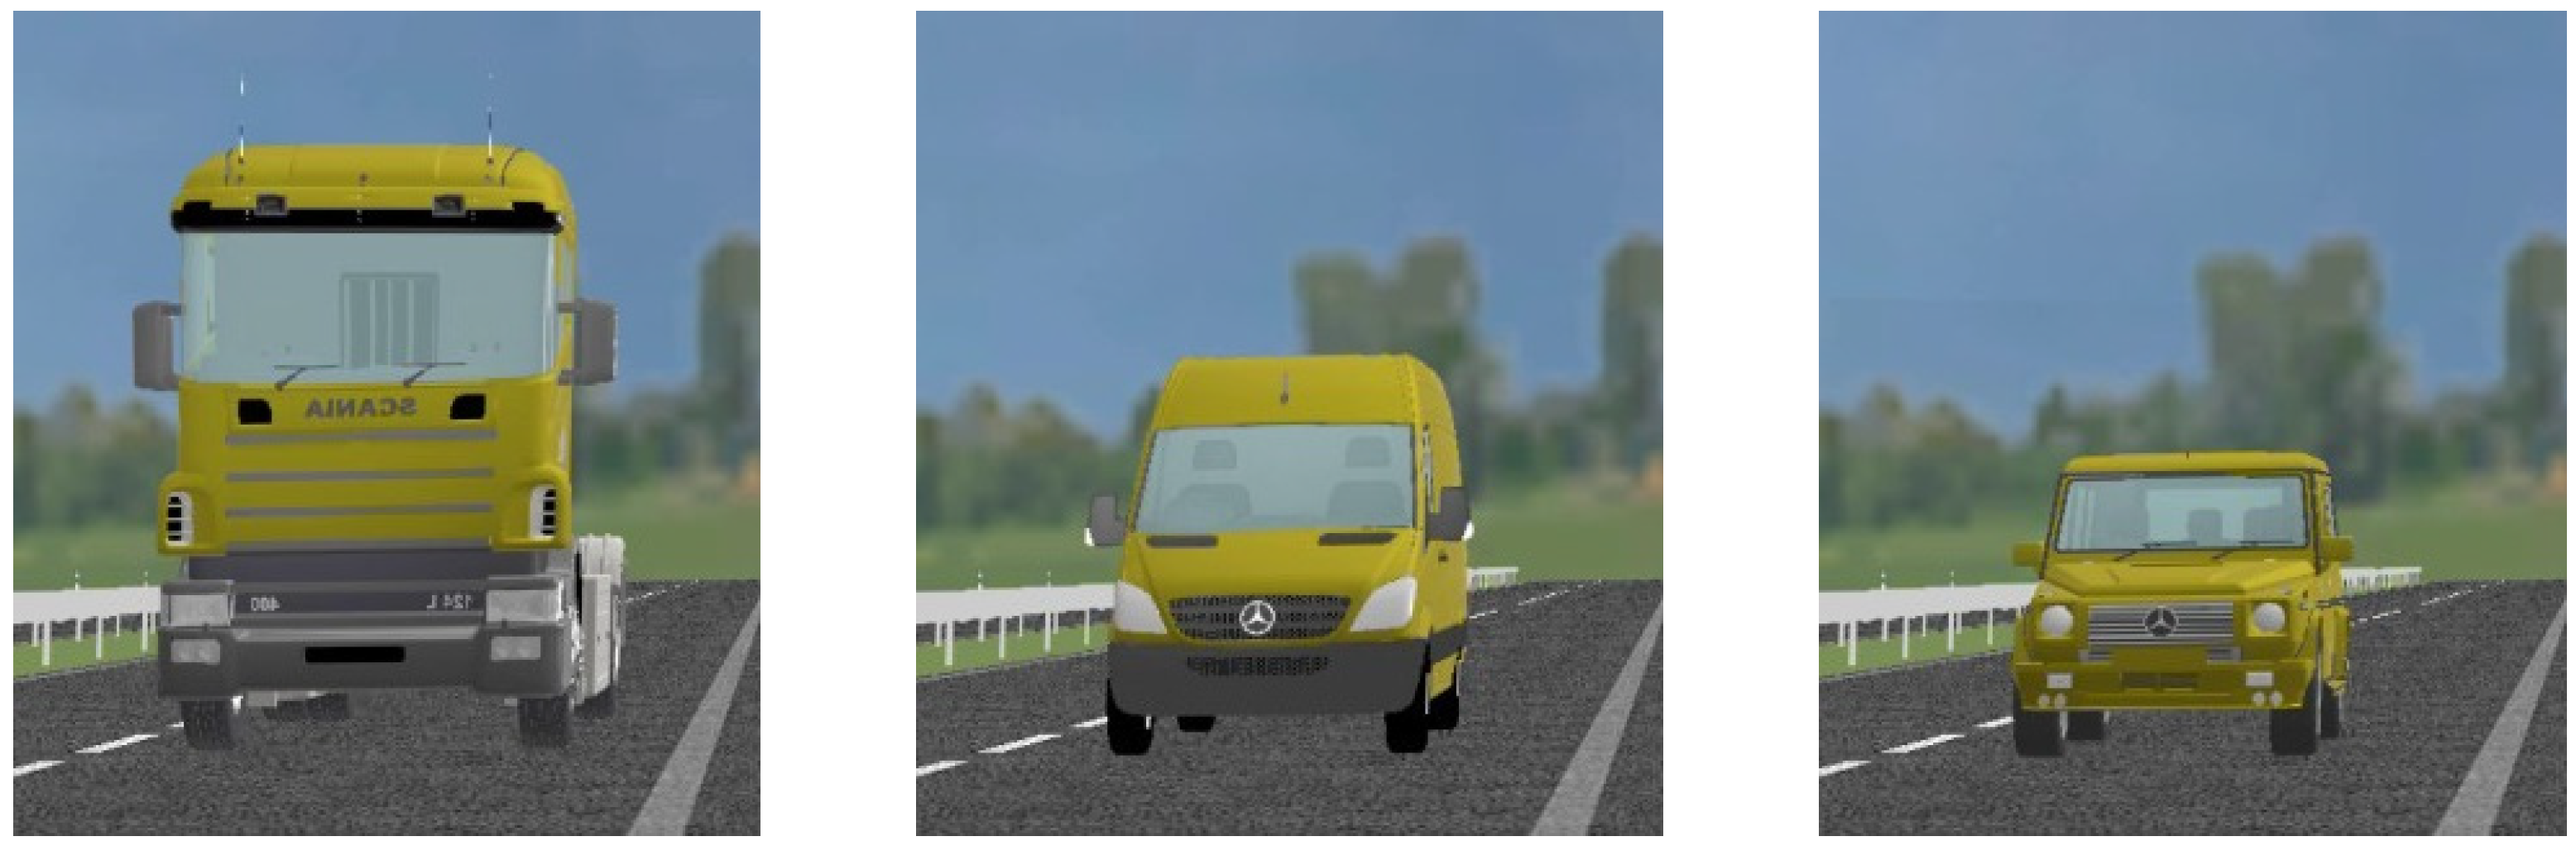
2.1.4. Design
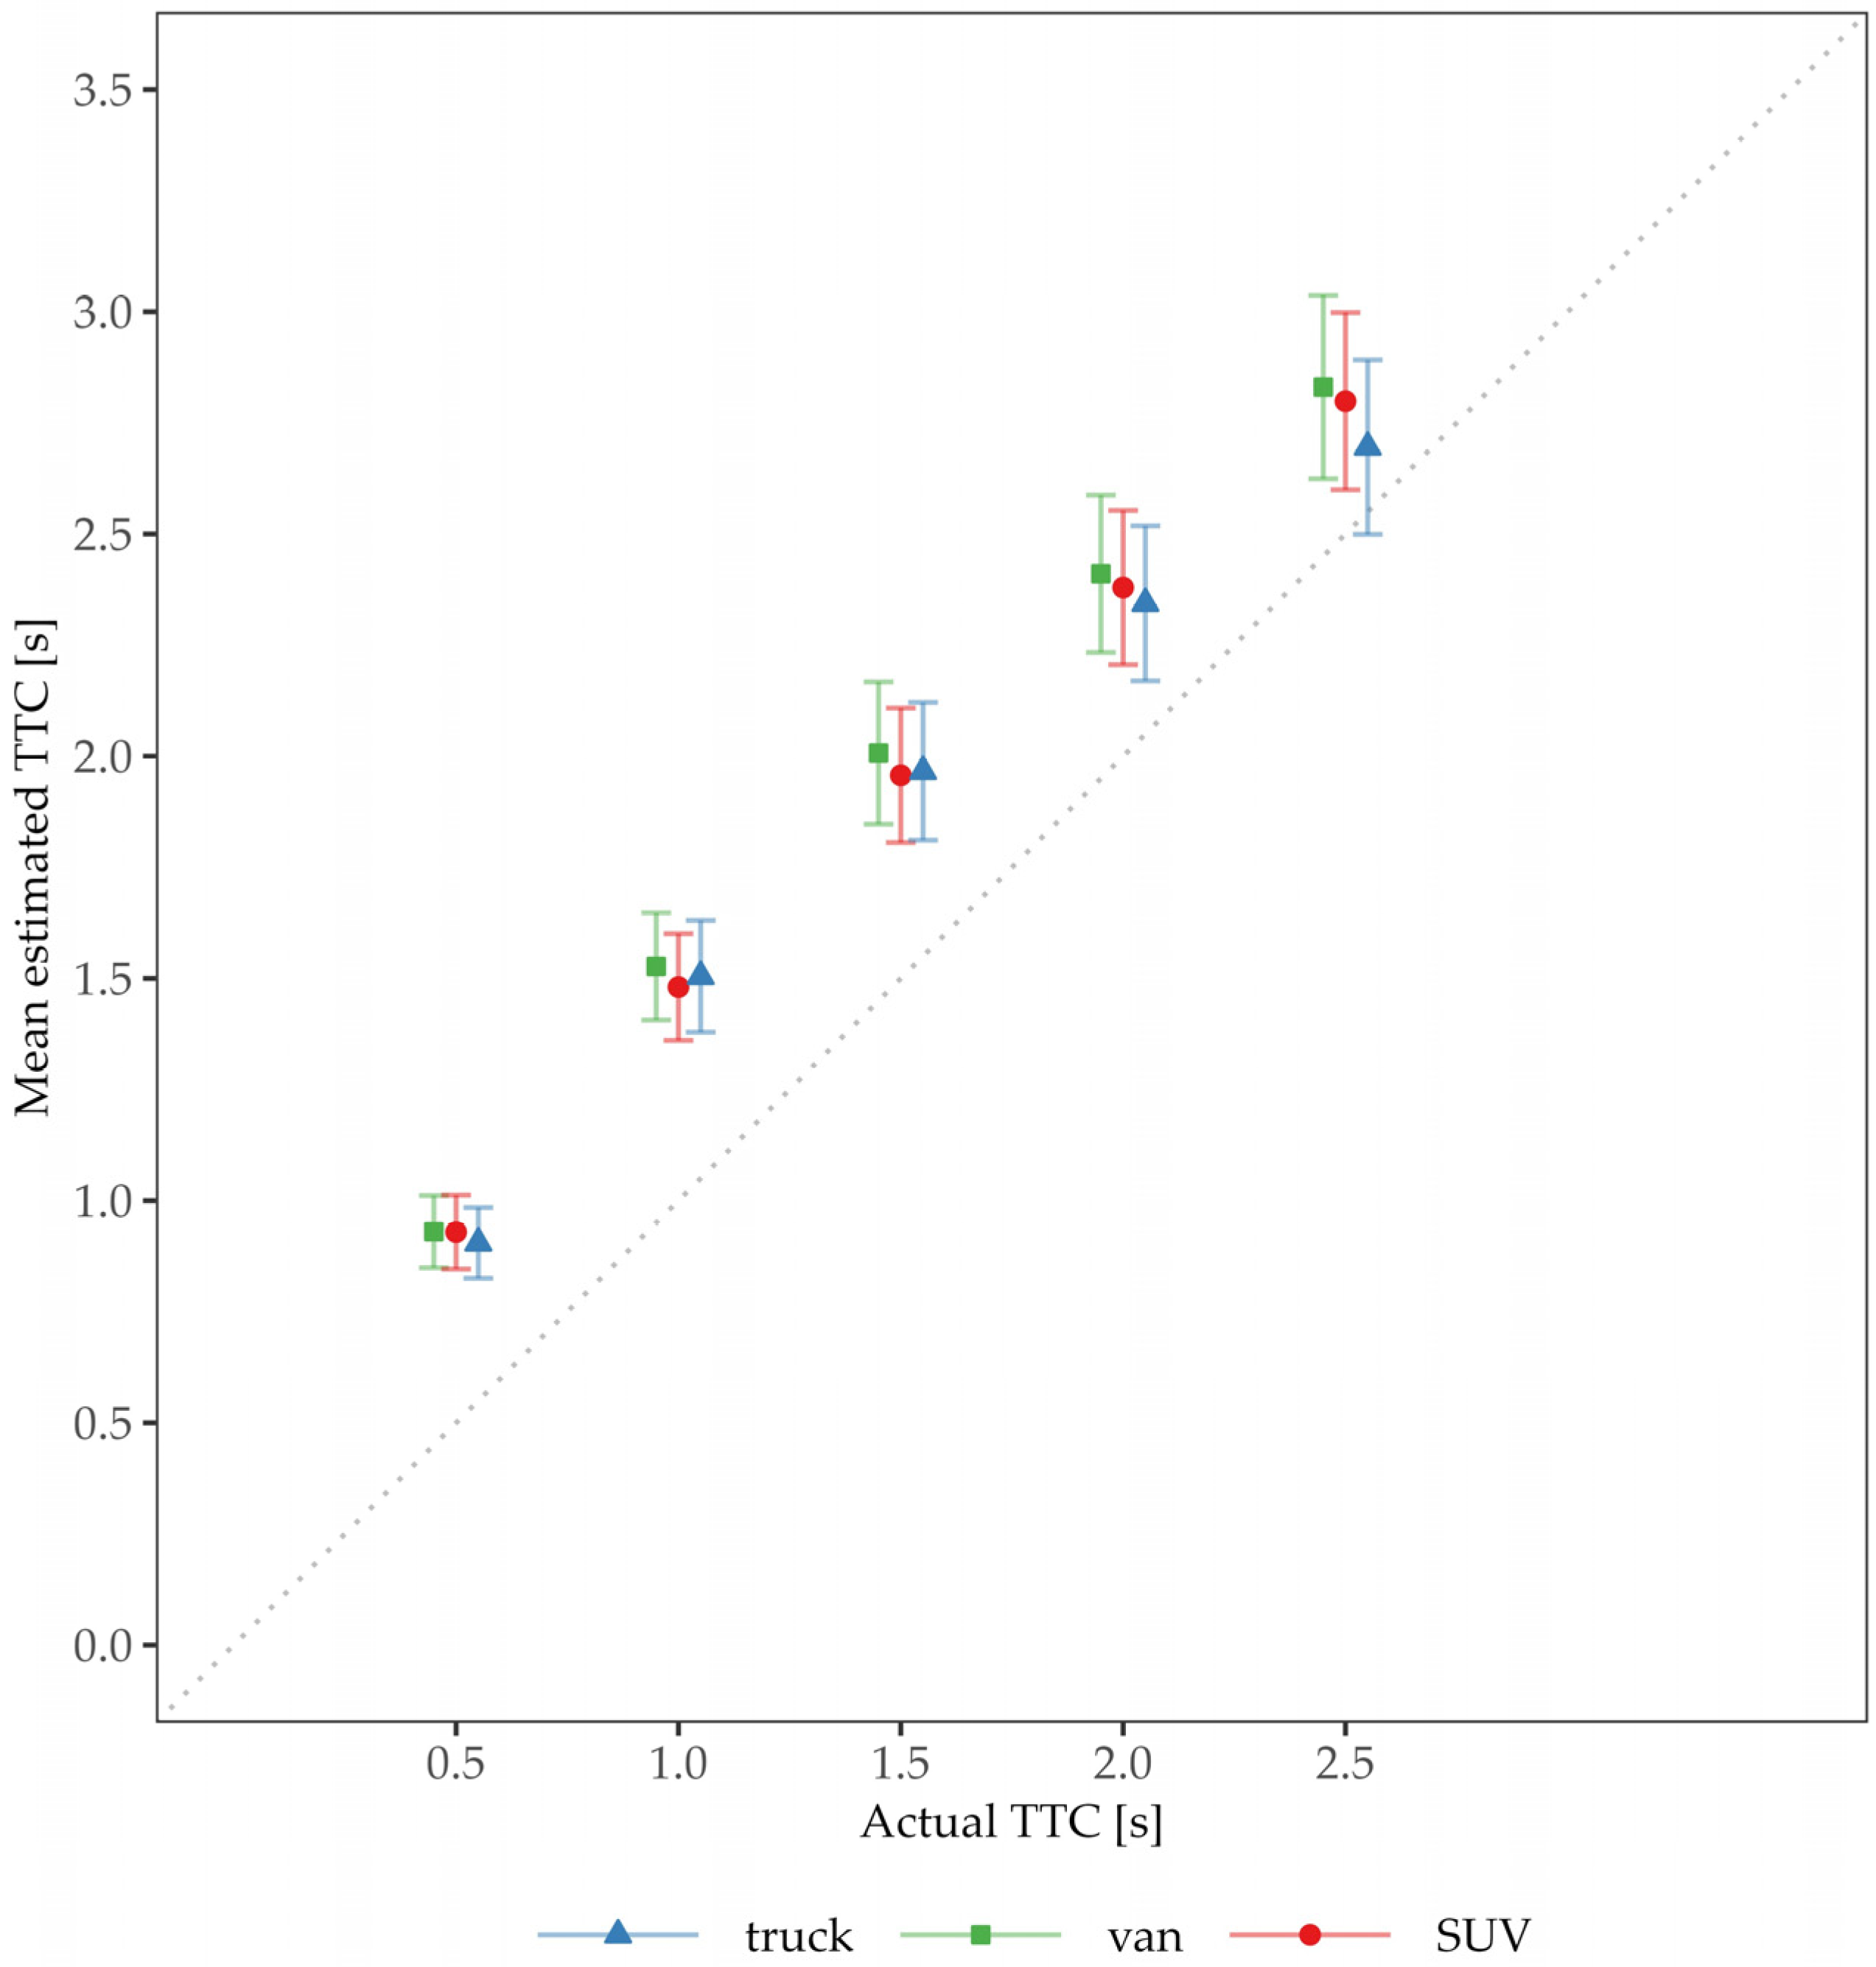
2.2. Results
3. Discussion
3.1. Limitations and Technical Challenges
3.2. Future Developments and Practical Implications
Author Contributions
Funding
Informed Consent Statement
Data Availability Statement
Acknowledgments
Conflicts of Interest
Appendix A

| dfNum | dfDen | F | p | η²p | ||
|---|---|---|---|---|---|---|
| Actual TTC | 4 | 104 | 0.28 | 2.34 | .135 | .08 |
| Velocity | 2 | 52 | 0.55 | 94.10 | <.001 | .78 |
| Vehicle type | 2 | 52 | 0.89 | 15.76 | <.001 | .38 |
| Reference visibility | 1 | 26 | 5.37 | .029 | .17 | |
| Clutter condition | 2 | 52 | 1.00 | 2.78 | .071 | .10 |
| Actual TTC × velocity | 8 | 208 | 0.74 | 29.86 | <.001 | .54 |
| Actual TTC × vehicle type | 8 | 208 | 0.77 | 3.64 | .002 | .12 |
| Velocity × vehicle type | 4 | 104 | 0.99 | 0.56 | .690 | .02 |
| Actual TTC × reference visibility | 4 | 104 | 0.54 | 0.22 | .817 | .01 |
| Velocity × reference visibility | 2 | 52 | 0.91 | 0.49 | .596 | .02 |
| Vehicle type × reference visibility | 2 | 52 | 1.00 | 0.77 | .470 | .03 |
| Actual TTC × clutter condition | 8 | 208 | 0.68 | 1.19 | .314 | .04 |
| Velocity × clutter condition | 4 | 104 | 0.83 | 1.11 | .354 | .04 |
| Vehicle type × clutter condition | 4 | 104 | 1.00 | 2.43 | .053 | .09 |
| Reference visibility × clutter condition | 2 | 52 | 0.90 | 0.51 | .587 | .02 |
| Actual TTC × velocity × vehicle type | 16 | 416 | 0.62 | 1.14 | .334 | .04 |
| Actual TTC × velocity × reference visibility | 8 | 208 | 0.71 | 0.82 | .552 | .03 |
| Actual TTC × vehicle type × reference visibility | 8 | 208 | 0.87 | 0.84 | .556 | .03 |
| Velocity × vehicle type × reference visibility | 4 | 104 | 1.00 | 0.28 | .889 | .01 |
| Actual TTC × velocity × clutter condition | 16 | 416 | 0.63 | 1.52 | .131 | .06 |
| Actual TTC × vehicle type × clutter condition | 16 | 416 | 0.94 | 0.95 | .513 | .04 |
| Velocity × vehicle type × clutter condition | 8 | 208 | 1.00 | 1.29 | .249 | .05 |
| Actual TTC × reference visibility × clutter condition | 8 | 208 | 0.62 | 0.79 | .556 | .03 |
| Velocity × reference visibility × clutter condition | 4 | 104 | 0.96 | 0.91 | .457 | .03 |
| Vehicle type × reference visibility × clutter condition | 4 | 104 | 0.86 | 1.30 | .279 | .05 |
| Actual TTC × velocity × vehicle type × reference visibility | 16 | 416 | 0.70 | 1.18 | .302 | .04 |
| Actual TTC × velocity × vehicle type × clutter condition | 32 | 832 | 1.47 | .045 | .05 | |
| Actual TTC × velocity × reference visibility × clutter condition | 16 | 416 | 0.81 | 0.97 | .479 | .04 |
| Actual TTC × vehicle type × reference visibility × clutter condition | 16 | 416 | 0.91 | 1.22 | .254 | .05 |
| Velocity × vehicle type × reference visibility × clutter condition | 8 | 208 | 0.97 | 1.42 | .193 | .05 |
| Actual TTC × velocity × vehicle type × reference visibility × clutter condition | 32 | 832 | 0.28 | 0.97 | .521 | .04 |
References
- Debernardis, S.; Fiorentino, M.; Gattullo, M.; Monno, G.; Uva, A.E. Text Readability in Head-Worn Displays: Color and Style Optimization in Video versus Optical See-Through Devices. IEEE Trans. Vis. Comput. Graph. 2014, 20, 125–139. [Google Scholar] [CrossRef]
- Moacdieh, N.; Sarter, N. Display Clutter: A Review of Definitions and Measurement Techniques. Hum. Factors J. Hum. Factors Ergon. Soc. 2015, 57, 61–100. [Google Scholar] [CrossRef]
- Kim, K.; Jacko, J.; Salvendy, G. Menu Design for Computers and Cell Phones: Review and Reappraisal. Int. J. Hum.–Comput. Interact. 2011, 27, 383–404. [Google Scholar] [CrossRef]
- Gregory, R.L. Mirrors in Mind; W.H. Freeman/Spektrum: London, UK, 1997. [Google Scholar]
- Fisher, J.A.; Galer, I.A.R. The effects of decreasing the radius of curvature of convex external rear view mirrors upon drivers’ judgements of vehicles approaching in the rearward visual field. Ergonomics 1984, 27, 1209–1224. [Google Scholar] [CrossRef] [PubMed]
- Higashiyama, A.; Shimono, K. Mirror vision: Perceived size and perceived distance of virtual images. Percept. Psychophys. 2004, 66, 679–691. [Google Scholar] [CrossRef] [PubMed]
- Flohr, L.A.; Valiyaveettil, J.S.; Krüger, A.; Wallach, D.P. Prototyping Autonomous Vehicle Windshields with AR and Real-Time Object Detection Visualization: An On-Road Wizard-of-Oz Study. In Proceedings of the 2023 ACM Designing Interactive Systems Conference, New York, NY, USA, 10–14 July 2023; ACM: Pittsburgh, PA, USA, 2023; pp. 2123–2137. [Google Scholar]
- Wu, J.; Wu, Z.; Bao, J. Study on the impact of indirect driving system on mental workload and task performance of driver. In Proceedings of the 2013 IEEE International Conference on Vehicular Electronics and Safety, Dongguan, China, 28–30 July 2013; pp. 53–56. [Google Scholar]
- Van Erp, J.B.; Padmos, P. Image parameters for driving with indirect viewing systems. Ergonomics 2003, 46, 1471–1499. [Google Scholar] [CrossRef] [PubMed]
- Bernhard, C.; Reinhard, R.; Kleer, M.; Hecht, H. A Case for Raising the Camera: A Driving Simulator Test of Camera-Monitor Systems. Hum. Factors J. Hum. Factors Ergon. Soc. 2023, 65, 321–336. [Google Scholar] [CrossRef] [PubMed]
- Prinzel, L.J.; Kramer, L.J. Synthetic vision systems. In International Encyclopedia of Ergonomics and Human Factors; Taylor & Francis: Abingdon, UK, 2006; pp. 1264–1271. [Google Scholar]
- Wögerbauer, E.M.; Hecht, H.; Wessels, M. Camera–Monitor Systems as An Opportunity to Compensate for Perceptual Errors in Time-to-Contact Estimations. Vision 2023, 7, 65. [Google Scholar] [CrossRef] [PubMed]
- Livatino, S.; Guastella, D.C.; Muscato, G.; Rinaldi, V.; Cantelli, L.; Melita, C.D.; Caniglia, A.; Mazza, R.; Padula, G. Intuitive Robot Teleoperation through Multi-Sensor Informed Mixed Reality Visual Aids. IEEE Access 2021, 9, 25795–25808. [Google Scholar] [CrossRef]
- Traub, J.; Sielhorst, T.; Heining, S.-M.; Navab, N. Advanced Display and Visualization Concepts for Image Guided Surgery. J. Disp. Technol. 2008, 4, 483–490. [Google Scholar] [CrossRef]
- Schnell, T.; Kwon, Y.; Merchant, S.; Etherington, T. Improved Flight Technical Performance in Flight Decks Equipped with Synthetic Vision Information System Displays. Int. J. Aviat. Psychol. 2004, 14, 79–102. [Google Scholar] [CrossRef]
- Hong, Z.; Zhang, Q.; Su, X.; Zhang, H. Effect of virtual annotation on performance of construction equipment teleoperation under adverse visual conditions. Autom. Constr. 2020, 118, 103296. [Google Scholar] [CrossRef]
- Lorenz, S. Design of a teleoperation user interface for shared control of highly automated agricultural machines. Proc. Des. Soc. 2023, 3, 1277–1286. [Google Scholar] [CrossRef]
- Hoskere, V.; Narazaki, Y.; Spencer, B.F. Physics-Based Graphics Models in 3D Synthetic Environments as Autonomous Vision-Based Inspection Testbeds. Sensors 2022, 22, 532. [Google Scholar] [CrossRef]
- Lee, S.C.; Kim, Y.W.; Ji, Y.G. Effects of visual complexity of in-vehicle information display: Age-related differences in visual search task in the driving context. Appl. Ergon. 2019, 81, 102888. [Google Scholar] [CrossRef] [PubMed]
- Treisman, A.M.; Gelade, G. A feature-integration theory of attention. Cogn. Psychol. 1980, 12, 97–136. [Google Scholar] [CrossRef]
- Ellis, G.; Dix, A. A Taxonomy of Clutter Reduction for Information Visualisation. IEEE Trans. Vis. Comput. Graph. 2007, 13, 1216–1223. [Google Scholar] [CrossRef]
- Wickens, C.D. Multiple resources and performance prediction. Theor. Issues Ergon. Sci. 2002, 3, 159–177. [Google Scholar] [CrossRef]
- Ziakopoulos, A.; Theofilatos, A.; Papadimitriou, E.; Yannis, G. A meta-analysis of the impacts of operating in-vehicle information systems on road safety. IATSS Res. 2019, 43, 185–194. [Google Scholar] [CrossRef]
- Edquist, J. The Effects of Visual Clutter on Driving Performance. Ph.D. Thesis, Monash University, Melbourne, Australia, 2008. [Google Scholar]
- Lee, D.N. A Theory of Visual Control of Braking Based on Information about Time-to-Collision. Perception 1976, 5, 437–459. [Google Scholar] [CrossRef]
- DeLucia, P.R. Chapter 11 Multiple sources of information influence time-to-contact judgments: Do heuristics accommodate limits in sensory and cognitive processes? In Advances in Psychology; Elsevier: Amsterdam, The Netherlands, 2004; pp. 243–285. [Google Scholar]
- Keshavarz, B.; Campos, J.L.; DeLucia, P.R.; Oberfeld, D. Estimating the relative weights of visual and auditory tau versus heuristic-based cues for time-to-contact judgments in realistic, familiar scenes by older and younger adults. Atten. Percept. Psychophys. 2017, 79, 929–944. [Google Scholar] [CrossRef] [PubMed]
- Kim, N.-G.; Grocki, M.J. Multiple sources of information and time-to-contact judgments. Vis. Res. 2006, 46, 1946–1958. [Google Scholar] [CrossRef] [PubMed]
- Gray, R.; Regan, D. Simulated self-motion alters perceived time to collision. Curr. Biol. 2000, 10, 587–590. [Google Scholar] [CrossRef] [PubMed]
- Franke, T.; Attig, C.; Wessel, D. A Personal Resource for Technology Interaction: Development and Validation of the Affinity for Technology Interaction (ATI) Scale. Int. J. Hum.–Comput. Interact. 2019, 35, 456–467. [Google Scholar] [CrossRef]
- Kothgassner, O.D.; Felnhofer, A.; Hauk, N.; Kastenhofer, E.; Gomm, J.; Kryspin-Exner, I. TUI (Technology Usage Inventory) Manual; ICARUS: Vienna, Austria, 2012. [Google Scholar]
- Röckel, C.; Hecht, H. Regular looks out the window do not maintain situation awareness in highly automated driving. Transp. Res. Part F Traffic Psychol. Behav. 2023, 98, 368–381. [Google Scholar] [CrossRef]


| Clutter Condition | Description | Example Picture |
|---|---|---|
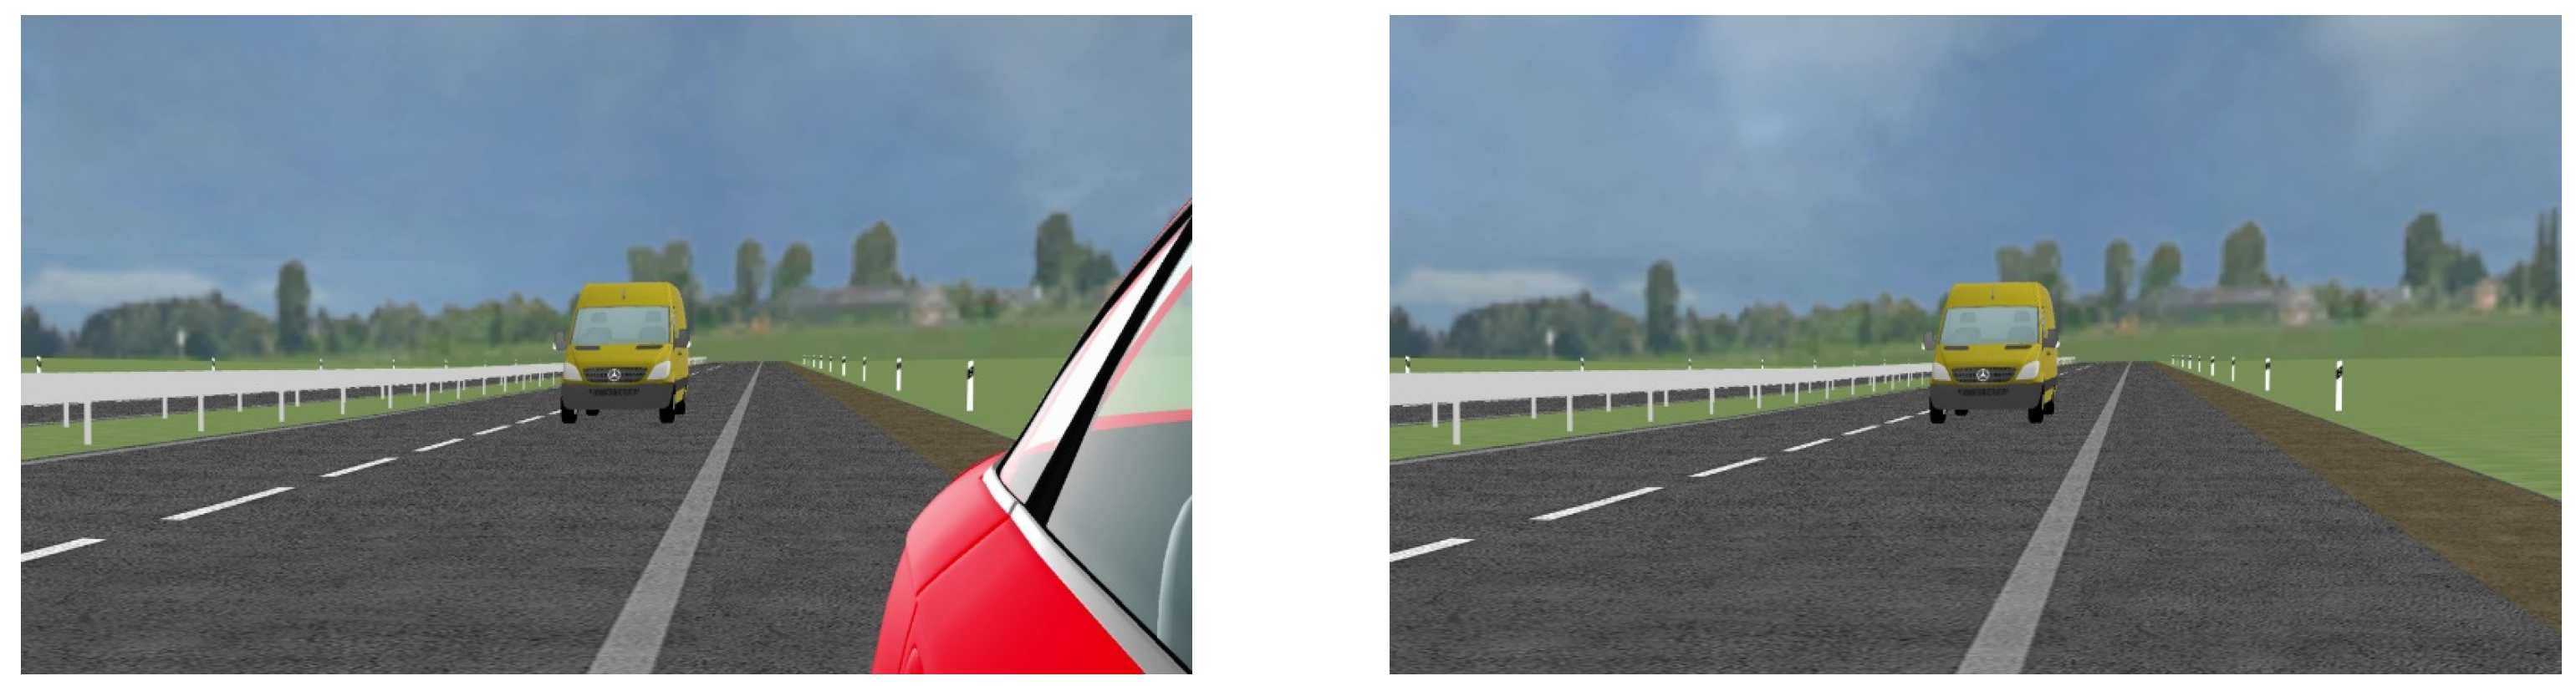
| Full cues | A realistic representation with all details of the surroundings (identical to the forward view) is shown. |  |
| Reduced clutter | Irrelevant objects in the environment (such as guardrails, shrubberies, and clouds) are removed, whereas other elements of the environment (such as the road, markings, and the sky) are depicted with uniform colors without texture. |  |
| Isolated target | Only a uniform gray background is shown, as well as the information of the presented target vehicle itself (such as its optical expansion). |  |
| dfNum | dfDen | F | p | η²p | ||
|---|---|---|---|---|---|---|
| Vehicle type | 2 | 52 | 0.89 | 15.76 | <0.001 | 0.38 |
| Reference visibility | 1 | 26 | 5.37 | 0.029 | 0.17 | |
| Clutter condition | 2 | 52 | 1.00 | 2.78 | 0.071 | 0.10 |
| Vehicle type × reference visibility | 2 | 52 | 1.00 | 0.77 | 0.470 | 0.03 |
| Vehicle type × clutter condition | 4 | 104 | 1.00 | 2.43 | 0.053 | 0.09 |
| Reference visibility × clutter condition | 2 | 52 | 0.90 | 0.51 | 0.587 | 0.02 |
| Vehicle type × reference visibility × clutter condition | 4 | 104 | 0.86 | 1.30 | 0.279 | 0.05 |
Disclaimer/Publisher’s Note: The statements, opinions and data contained in all publications are solely those of the individual author(s) and contributor(s) and not of MDPI and/or the editor(s). MDPI and/or the editor(s) disclaim responsibility for any injury to people or property resulting from any ideas, methods, instructions or products referred to in the content. |
© 2024 by the authors. Licensee MDPI, Basel, Switzerland. This article is an open access article distributed under the terms and conditions of the Creative Commons Attribution (CC BY) license (https://creativecommons.org/licenses/by/4.0/).
Share and Cite
Wögerbauer, E.M.; Bernhard, C.; Hecht, H. Synthetic Displays and Their Potential for Driver Assistance Systems. Information 2024, 15, 177. https://doi.org/10.3390/info15040177
Wögerbauer EM, Bernhard C, Hecht H. Synthetic Displays and Their Potential for Driver Assistance Systems. Information. 2024; 15(4):177. https://doi.org/10.3390/info15040177
Chicago/Turabian StyleWögerbauer, Elisabeth Maria, Christoph Bernhard, and Heiko Hecht. 2024. "Synthetic Displays and Their Potential for Driver Assistance Systems" Information 15, no. 4: 177. https://doi.org/10.3390/info15040177