

Unveiling the Confirmation Factors of Information System Quality on Continuance Intention towards Online Cryptocurrency Exchanges: The Extension of the Expectation Confirmation Model

Abstract
:1. Introduction
2. Literature Review
2.1. Information System Quality of Online Cryptocurrency Exchanges
2.2. Expectation Confirmation Model
- Perceived Usefulness (PU): It refers to users’ subjective evaluation of the functionality and value of a product or service. PU indicates that users perceive that the product or service can satisfy their needs and provide practical benefits [31,32,33]. This construct concerns users’ perceptions of the product or service’s value, including whether they think the product or service will help them achieve their goals or solve their problems.
- Confirmation: Confirmation refers to the user’s evaluation of whether the actual experience meets their expectations. It involves users comparing the actual experience with their expectations of the product or service to determine consistency or discrepancy [34]. When users’ actual experience matches their expectations, they feel validated that the product or service has met their expectations. If the actual experience exceeds expectations, there is a positive confirmation; conversely, if the actual experience is lower than expectations, there is a negative confirmation.
- Satisfaction: Satisfaction indicates the user’s overall evaluation of the actual experience. It reflects users’ feelings about the product or service, including satisfaction and preference levels. When users’ actual experience meets or exceeds their expectations, they usually feel satisfied and positively evaluate the product or service [31,35,36]. Satisfaction is one of the important indicators of consumer behavior and loyalty, which is important for companies to understand consumer feedback and provide better products or services.
3. Methodology
3.1. Operational Definitions and Measurement Items Development

| Construct | Definition | Source |
|---|---|---|
| Confirmation of information quality | The content of the information provided by the online cryptocurrency exchange is compared to the user’s expectations of the quality of the information after using the system. | McKinney et al. [40]; Lee et al. [45] |
| Confirmation of system quality | The system operation, functions, and interface arrangement provided by the online cryptocurrency exchange are compared with the users’ expectations of the system quality after using the system. | McKinney et al. [40]; Lee et al. [45] |
| Confirmation of service quality | The part of the service provided by the online cryptocurrency exchange is compared with the user’s expectations of the quality of the service after using the system. | Lee et al. [45] |
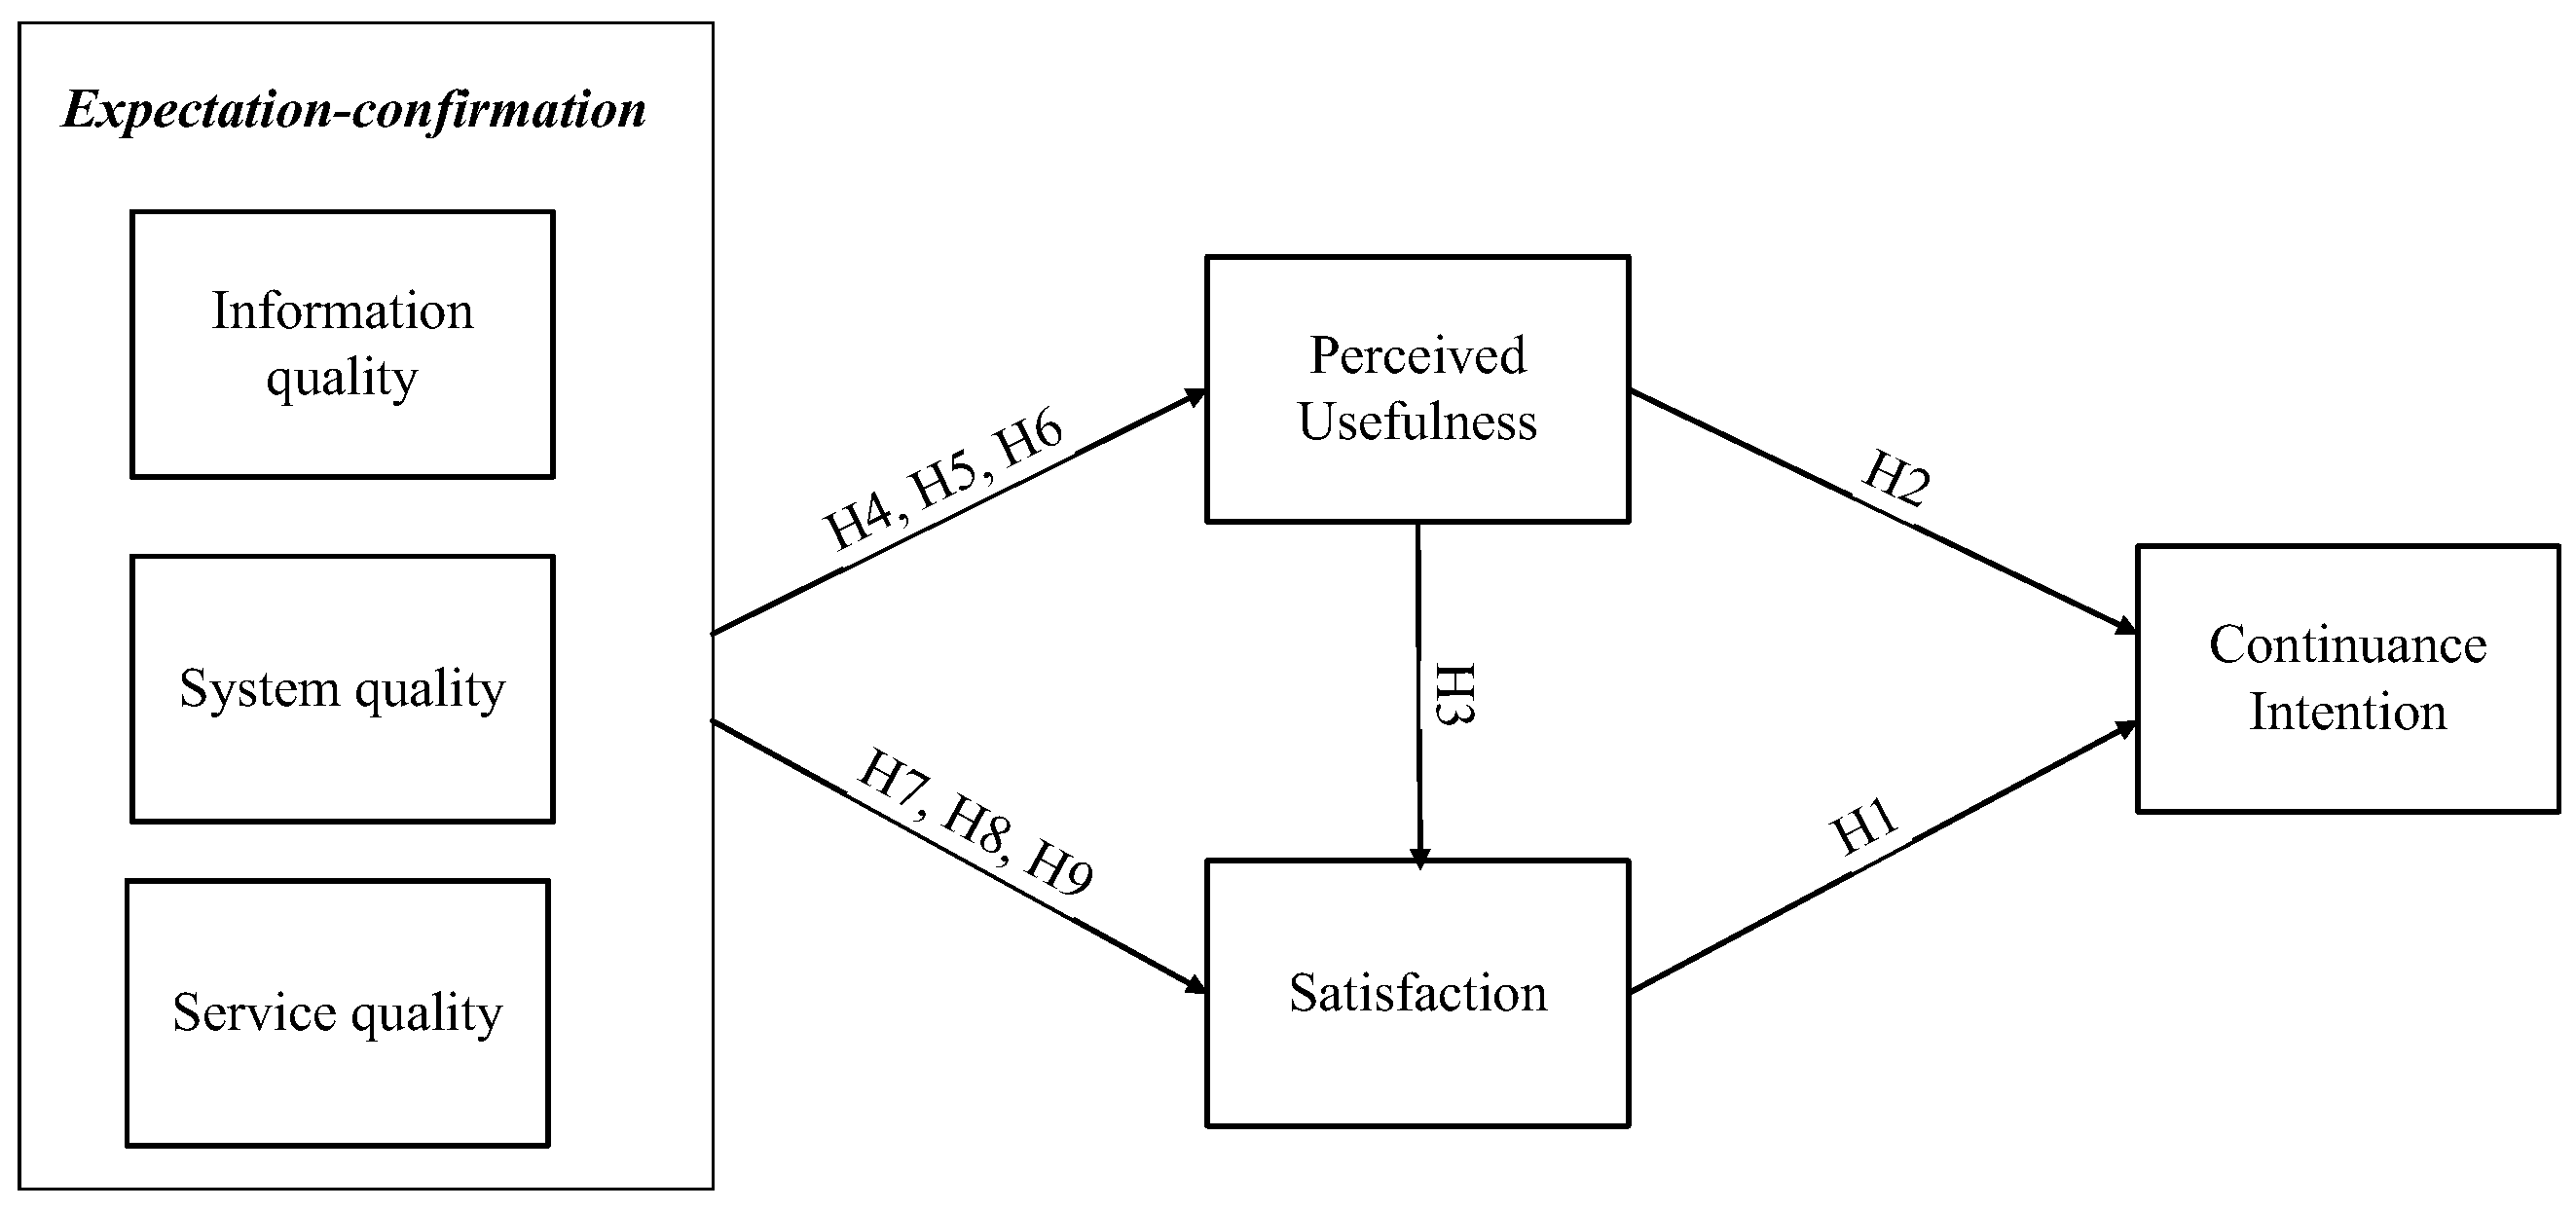
3.2. Hypotheses Development and Research Framework
4. Empirical Data Analysis
4.1. Outer Model
4.2. Inner Model
5. Discussion and Conclusions
6. Research Limitations and Future Research Directions
Author Contributions
Funding
Data Availability Statement
Conflicts of Interest
References
- Ante, L. Non-fungible token (NFT) markets on the Ethereum blockchain: Temporal development, cointegration and interrelations. Econ. Innov. New Technol. 2022, 1–19. [Google Scholar] [CrossRef]
- Hammi, M.T.; Hammi, B.; Bellot, P.; Serhrouchni, A. Bubbles of Trust: A decentralized blockchain-based authentication system for IoT. Comput. Secur. 2018, 78, 126–142. [Google Scholar] [CrossRef]
- Zhao, J.L.; Fan, S.; Yan, J. Overview of business innovations and research opportunities in blockchain and introduction to the special issue. Financ. Innov. 2016, 2, 28. [Google Scholar] [CrossRef]
- Połap, D.; Srivastava, G.; Yu, K. Agent architecture of an intelligent medical system based on federated learning and blockchain technology. J. Inf. Secur. Appl. 2021, 58, 102748. [Google Scholar] [CrossRef]
- Krishnan, L.P.; Vakilinia, I.; Reddivari, S.; Ahuja, S. Scams and Solutions in Cryptocurrencies—A Survey Analyzing Existing Machine Learning Models. Information 2023, 14, 171. [Google Scholar] [CrossRef]
- Zhang, L.; Xie, Y.; Zheng, Y.; Xue, W.; Zheng, X.; Xu, X. The challenges and countermeasures of blockchain in finance and economics. Syst. Res. Behav. Sci. 2020, 37, 691–698. [Google Scholar] [CrossRef]
- Cunha, P.R.; Melo, P.; Sebastião, H. From bitcoin to central bank digital currencies: Making sense of the digital money revolution. Future Internet 2021, 13, 165. [Google Scholar] [CrossRef]
- Bhimani, A.; Hausken, K.; Arif, S. Do national development factors affect cryptocurrency adoption? Technol. Forecast. Soc. Chang. 2022, 181, 121739. [Google Scholar] [CrossRef]
- Anser, M.K.; Zaigham, G.H.K.; Imran Rasheed, M.; Pitafi, A.H.; Iqbal, J.; Luqman, A. Social media usage and individuals’ intentions toward adopting Bitcoin: The role of the theory of planned behavior and perceived risk. Int. J. Commun. Syst. 2020, 33, e4590. [Google Scholar] [CrossRef]
- Jariyapan, P.; Mattayaphutron, S.; Gillani, S.N.; Shafique, O. Factors influencing the behavioural intention to use cryptocurrency in emerging economies during the COVID-19 pandemic: Based on technology acceptance model 3, perceived risk, and financial literacy. Front. Psychol. 2022, 12, 5935. [Google Scholar] [CrossRef] [PubMed]
- Sukumaran, S.; Bee, T.S.; Wasiuzzaman, S. Cryptocurrency as an investment: The Malaysian context. Risks 2022, 10, 86. [Google Scholar] [CrossRef]
- Johnson, B.; Sun, T.; Stjepanović, D.; Vu, G.; Chan, G.C.K. “Buy High, Sell Low”: A Qualitative Study of Cryptocurrency Traders Who Experience Harm. Int. J. Environ. Res. Public Health 2023, 20, 5833. [Google Scholar] [CrossRef]
- Alekseenko, A.P. Model Framework for Consumer Protection and Crypto-Exchanges Regulation. J. Risk Financ. Manag. 2023, 16, 305. [Google Scholar] [CrossRef]
- Sakas, D.P.; Giannakopoulos, N.T.; Nasiopoulos, D.K.; Kanellos, N.; Tsoulfas, G.T. Assessing the Efficacy of Cryptocurrency Applications’ Affiliate Marketing Process on Supply Chain Firms’ Website Visibility. Sustainability 2023, 15, 7326. [Google Scholar] [CrossRef]
- Masri, N.W.; You, J.-J.; Ruangkanjanases, A.; Chen, S.-C.; Pan, C.-I. Assessing the effects of information system quality and relationship quality on continuance intention in e-tourism. Int. J. Environ. Res. Public Health 2020, 17, 174. [Google Scholar] [CrossRef] [PubMed]
- Kim, J.; Kim, J. An integrated analysis of value-based adoption model and information systems success model for proptech service platform. Sustainability 2021, 13, 12974. [Google Scholar] [CrossRef]
- Parasuraman, A.; Zeithaml, V.A.; Berry, L.L. A conceptual model of service quality and its implications for future research. J. Mark. 1985, 49, 41–50. [Google Scholar] [CrossRef]
- Parasuraman, A.; Zeithaml, V.A.; Berry, L. SERVQUAL: A multiple-item scale for measuring consumer perceptions of service quality. J. Retail. 1988, 64, 12–40. [Google Scholar]
- Brady, M.K.; Cronin, J.J., Jr. Some new thoughts on conceptualizing perceived service quality: A hierarchical approach. J. Mark. 2001, 65, 34–49. [Google Scholar] [CrossRef]
- Bhat, M.A. Tourism service quality: A dimension-specific assessment of SERVQUAL. Glob. Bus. Rev. 2012, 13, 327–337. [Google Scholar] [CrossRef]
- Koc, E.; Yazici Ayyildiz, A. An overview of tourism and hospitality scales: Discussion and recommendations. J. Hosp. Tour. Insights 2022, 5, 927–949. [Google Scholar] [CrossRef]
- Van Dyke, T.P.; Kappelman, L.A.; Prybutok, V.R. Measuring information systems service quality: Concerns on the use of the SERVQUAL questionnaire. MIS Q. 1997, 21, 195–208. [Google Scholar] [CrossRef]
- Barnes, S.J.; Vidgen, R. Interactive e-government: Evaluating the web site of the UK Inland Revenue. J. Electron. Commer. Organ. JECO 2004, 2, 42–63. [Google Scholar] [CrossRef]
- Parasuraman, A.; Zeithaml, V.A.; Malhotra, A. ES-QUAL: A multiple-item scale for assessing electronic service quality. J. Serv. Res. 2005, 7, 213–233. [Google Scholar] [CrossRef]
- DeLone, W.H.; McLean, E.R. Information systems success: The quest for the dependent variable. Inf. Syst. Res. 1992, 3, 60–95. [Google Scholar] [CrossRef]
- DeLone, W.H.; McLean, E.R. The DeLone and McLean model of information systems success: A ten-year update. J. Manag. Inf. Syst. 2003, 19, 9–30. [Google Scholar]
- Tseng, S.-M.; Wu, P.-H. The impact of customer knowledge and customer relationship management on service quality. Int. J. Qual. Serv. Sci. 2014, 6, 77–96. [Google Scholar] [CrossRef]
- Barnes, J.G. Establishing meaningful customer relationships: Why some companies and brands mean more to their customers. Manag. Serv. Qual. Int. J. 2003, 13, 178–186. [Google Scholar] [CrossRef]
- Ryu, M.H.; Kim, J.; Kim, S. Factors affecting application developers’ loyalty to mobile platforms. Comput. Hum. Behav. 2014, 40, 78–85. [Google Scholar] [CrossRef]
- Bhattacherjee, A. Understanding information systems continuance: An expectation-confirmation model. MIS Q. 2001, 25, 351–370. [Google Scholar] [CrossRef]
- Chen, S.-C.; Liu, M.-L.; Lin, C.-P. Integrating technology readiness into the expectation–confirmation model: An empirical study of mobile services. Cyberpsychol. Behav. Soc. Netw. 2013, 16, 604–612. [Google Scholar] [CrossRef] [PubMed]
- Zhao, H.; Khan, A. The Students’ Flow Experience With the Continuous Intention of Using Online English Platforms. Front. Psychol. 2021, 12, 807084. [Google Scholar] [CrossRef] [PubMed]
- Xu, Y.; Wang, Y.; Khan, A.; Zhao, R. Consumer Flow Experience of Senior Citizens in Using Social Media for Online Shopping. Front. Psychol. 2021, 12, 732104. [Google Scholar] [CrossRef] [PubMed]
- Bhattacherjee, A.; Lin, C.-P. A unified model of IT continuance: Three complementary perspectives and crossover effects. Eur. J. Inf. Syst. 2015, 24, 364–373. [Google Scholar] [CrossRef]
- Chen, H.; Chiang, R.H.; Storey, V.C. Business intelligence and analytics: From big data to big impact. MIS Q. 2012, 36, 1165–1188. [Google Scholar] [CrossRef]
- Chen, S.-C.; Lin, C.-P. The impact of customer experience and perceived value on sustainable social relationship in blogs: An empirical study. Technol. Forecast. Soc. Chang. 2015, 96, 40–50. [Google Scholar] [CrossRef]
- Lee, M.-C. Explaining and predicting users’ continuance intention toward e-learning: An extension of the expectation–confirmation model. Comput. Educ. 2010, 54, 506–516. [Google Scholar] [CrossRef]
- Brown, S.A.; Venkatesh, V.; Goyal, S. Expectation confirmation in technology use. Inf. Syst. Res. 2012, 23, 474–487. [Google Scholar] [CrossRef]
- Park, E.S.; Park, M.S. Factors of the technology acceptance model for construction IT. Appl. Sci. 2020, 10, 8299. [Google Scholar] [CrossRef]
- McKinney, V.; Yoon, K.; Zahedi, F.M. The measurement of web-customer satisfaction: An expectation and disconfirmation approach. Inf. Syst. Res. 2002, 13, 296–315. [Google Scholar] [CrossRef]
- Pitt, L.F.; Watson, R.T.; Kavan, C.B. Service quality: A measure of information systems effectiveness. MIS Q. 1995, 19, 173–187. [Google Scholar] [CrossRef]
- Kettinger, W.J.; Lee, C.C. Pragmatic perspectives on the measurement of information systems service quality. MIS Q. 1997, 21, 223–240. [Google Scholar] [CrossRef]
- Hair, J.F.; Risher, J.J.; Sarstedt, M.; Ringle, C.M. When to use and how to report the results of PLS-SEM. Eur. Bus. Rev. 2019, 31, 2–24. [Google Scholar] [CrossRef]
- Shmueli, G.; Ray, S.; Estrada, J.M.V.; Chatla, S.B. The elephant in the room: Predictive performance of PLS models. J. Bus. Res. 2016, 69, 4552–4564. [Google Scholar] [CrossRef]
- Lee, H.; Kim, J.; Kim, J. Determinants of success for application service provider: An empirical test in small businesses. Int. J. Hum.-Comput. Stud. 2007, 65, 796–815. [Google Scholar] [CrossRef]
- Olsen, S.O. Comparative evaluation and the relationship between quality, satisfaction, and repurchase loyalty. J. Acad. Mark. Sci. 2002, 30, 240–249. [Google Scholar] [CrossRef]
- Chen, M.-F.; Lee, C.-L. The impacts of green claims on coffee consumers’ purchase intention. Br. Food J. 2015, 117, 195–209. [Google Scholar] [CrossRef]
- Chen, S.-C.; Lin, C.-P. Understanding the effect of social media marketing activities: The mediation of social identification, perceived value, and satisfaction. Technol. Forecast. Soc. Chang. 2019, 140, 22–32. [Google Scholar] [CrossRef]
- Ashfaq, M.; Yun, J.; Yu, S.; Loureiro, S.M.C. I, Chatbot: Modeling the determinants of users’ satisfaction and continuance intention of AI-powered service agents. Telemat. Inform. 2020, 54, 101473. [Google Scholar] [CrossRef]
- Chen, S.C.; Chen, H.H.; Chen, M.F. Determinants of satisfaction and continuance intention towards self-service technologies. Ind. Manag. Data Syst. 2009, 109, 1248–1263. [Google Scholar] [CrossRef]
- Cheng, S.-I.; Chen, S.-C.; Yen, D.C. Continuance intention of E-portfolio system: A confirmatory and multigroup invariance analysis of technology acceptance model. Comput. Stand. Interfaces 2015, 42, 17–23. [Google Scholar] [CrossRef]
- Chen, S.-C.; Yen, D.C.; Peng, S.-C. Assessing the impact of determinants in e-magazines acceptance: An empirical study. Comput. Stand. Interfaces 2018, 57, 49–58. [Google Scholar] [CrossRef]
- Oertzen, A.-S.; Odekerken-Schröder, G. Achieving continued usage in online banking: A post-adoption study. Int. J. Bank Mark. 2019, 37, 1394–1418. [Google Scholar] [CrossRef]
- Gao, L.; Bai, X. A unified perspective on the factors influencing consumer acceptance of internet of things technology. Asia Pac. J. Mark. Logist. 2014, 26, 211–231. [Google Scholar] [CrossRef]
- Wu, L.-Y.; Chen, K.-Y.; Chen, P.-Y.; Cheng, S.-L. Perceived value, transaction cost, and repurchase-intention in online shopping: A relational exchange perspective. J. Bus. Res. 2014, 67, 2768–2776. [Google Scholar] [CrossRef]
- Hsu, C.-L.; Lin, J.C.-C. What drives purchase intention for paid mobile apps?–An expectation confirmation model with perceived value. Electron. Commer. Res. Appl. 2015, 14, 46–57. [Google Scholar] [CrossRef]
- Aparicio, M.; Bacao, F.; Oliveira, T. Grit in the path to e-learning success. Comput. Hum. Behav. 2017, 66, 388–399. [Google Scholar] [CrossRef]
- Khan, A.; Chen, C.-C.; Suanpong, K.; Ruangkanjanases, A.; Kittikowit, S.; Chen, S.-C. The impact of CSR on sustainable innovation ambidexterity: The mediating role of sustainable supply chain management and second-order social capital. Sustainability 2021, 13, 12160. [Google Scholar] [CrossRef]
- Mutambik, I. Customer Experience in Open Banking and How It Affects Loyalty Intention: A Study from Saudi Arabia. Sustainability 2023, 15, 10867. [Google Scholar] [CrossRef]
- Ante, L.; Fiedler, F.; Steinmetz, F.; Fiedler, I. Profiling Turkish Cryptocurrency Owners: Payment Users, Crypto Investors and Crypto Traders. J. Risk Financ. Manag. 2023, 16, 239. [Google Scholar] [CrossRef]
- Anderson, J.C.; Gerbing, D.W. Structural equation modeling in practice: A review and recommended two-step approach. Psychol. Bull. 1988, 103, 411. [Google Scholar] [CrossRef]
- Xu, H.; Wang, Z.; Lian, N.; Khan, A.; Zhang, L. The Impact of Transformational Leadership on Organizational Commitment and Intention to Stay: Empirical Evidence From China’s Performing Arts Industry. Front. Psychol. 2022, 13, 874803. [Google Scholar] [CrossRef] [PubMed]
- Fornell, C.; Larcker, D.F. Structural Equation Models with Unobservable Variables and Measurement Error: Algebra and Statistics; Sage Publications: Los Angeles, CA, USA, 1981. [Google Scholar]
- Torkzadeh, G.; Koufteros, X.; Pflughoeft, K. Confirmatory analysis of computer self-efficacy. Struct. Equ. Model. 2003, 10, 263–275. [Google Scholar] [CrossRef]
- Henseler, J.; Ringle, C.M.; Sarstedt, M. A new criterion for assessing discriminant validity in variance-based structural equation modeling. J. Acad. Mark. Sci. 2015, 43, 115–135. [Google Scholar] [CrossRef]
- Rönkkö, M.; Cho, E. An updated guideline for assessing discriminant validity. Organ. Res. Methods 2022, 25, 6–14. [Google Scholar] [CrossRef]
- Akossou, A.; Palm, R. Impact of data structure on the estimators R-square and adjusted R-square in linear regression. Int. J. Math. Comput. 2013, 20, 84–93. [Google Scholar]
- Christopoulos, D. Peer Esteem Snowballing: A methodology for expert surveys. In Proceedings of the Eurostat Conference for New Techniques and Technologies for Statistics, Eurostat, Brussels, 18–20 February 2009; pp. 171–179. [Google Scholar]
- Tomczyk, Ł.; Potyrała, K.; Włoch, A.; Wnęk-Gozdek, J.; Demeshkant, N. Evaluation of the functionality of a new e-learning platform vs. Previous experiences in e-learning and the self-assessment of own digital literacy. Sustainability 2020, 12, 10219. [Google Scholar] [CrossRef]
- Lăzăroiu, G.; Neguriţă, O.; Grecu, I.; Grecu, G.; Mitran, P.C. Consumers’ decision-making process on social commerce platforms: Online trust, perceived risk, and purchase intentions. Front. Psychol. 2020, 11, 890. [Google Scholar] [CrossRef]


| Construct | Range of Factor Loading | Composite Reliability | Average Variance Extracted |
|---|---|---|---|
| Information Quality | 0.892~0.955 (3 items) | 0.949 | 0.861 |
| System quality | 0.770~0.860 (3 items) | 0.863 | 0.678 |
| Service quality | 0.731~0.825 (3 items) | 0.829 | 0.618 |
| Perceived Usefulness | 0.819~0.847 (3 items) | 0.872 | 0.694 |
| Satisfaction | 0.776~0.857 (3 items) | 0.857 | 0.666 |
| Continuance Intention | 0.839~0.920 (3 items) | 0.920 | 0.793 |
| Relationship | Correlation Coefficient | Lower Bound | Upper Bound |
|---|---|---|---|
| INFQ <-> CI | 0.398 | 0.271 | 0.513 |
| PU <-> CI | 0.479 | 0.357 | 0.591 |
| PU <-> INFQ | 0.474 | 0.347 | 0.584 |
| SAT <-> CI | 0.581 | 0.478 | 0.673 |
| SAT <-> INFQ | 0.430 | 0.307 | 0.538 |
| SAT <-> PU | 0.503 | 0.402 | 0.598 |
| SERVQ <-> CI | 0.622 | 0.535 | 0.702 |
| SERVQ <-> INFQ | 0.335 | 0.209 | 0.452 |
| SERVQ <-> PU | 0.471 | 0.374 | 0.568 |
| SERVQ <-> SAT | 0.512 | 0.413 | 0.609 |
| SYSQ <-> CI | 0.600 | 0.504 | 0.685 |
| SYSQ <-> INFQ | 0.340 | 0.209 | 0.459 |
| SYSQ <-> PU | 0.453 | 0.332 | 0.569 |
| SYSQ <-> SAT | 0.583 | 0.484 | 0.672 |
| SYSQ <-> SERVQ | 0.510 | 0.406 | 0.610 |
| Construct | CI | INFQ | PU | SAT | SERVQ | SYSQ |
|---|---|---|---|---|---|---|
| CI | ||||||
| INFQ | 0.446 | |||||
| PU | 0.567 | 0.551 | ||||
| SAT | 0.720 | 0.517 | 0.645 | |||
| SERVQ | 0.791 | 0.420 | 0.618 | 0.698 | ||
| SYSQ | 0.742 | 0.406 | 0.567 | 0.770 | 0.687 |
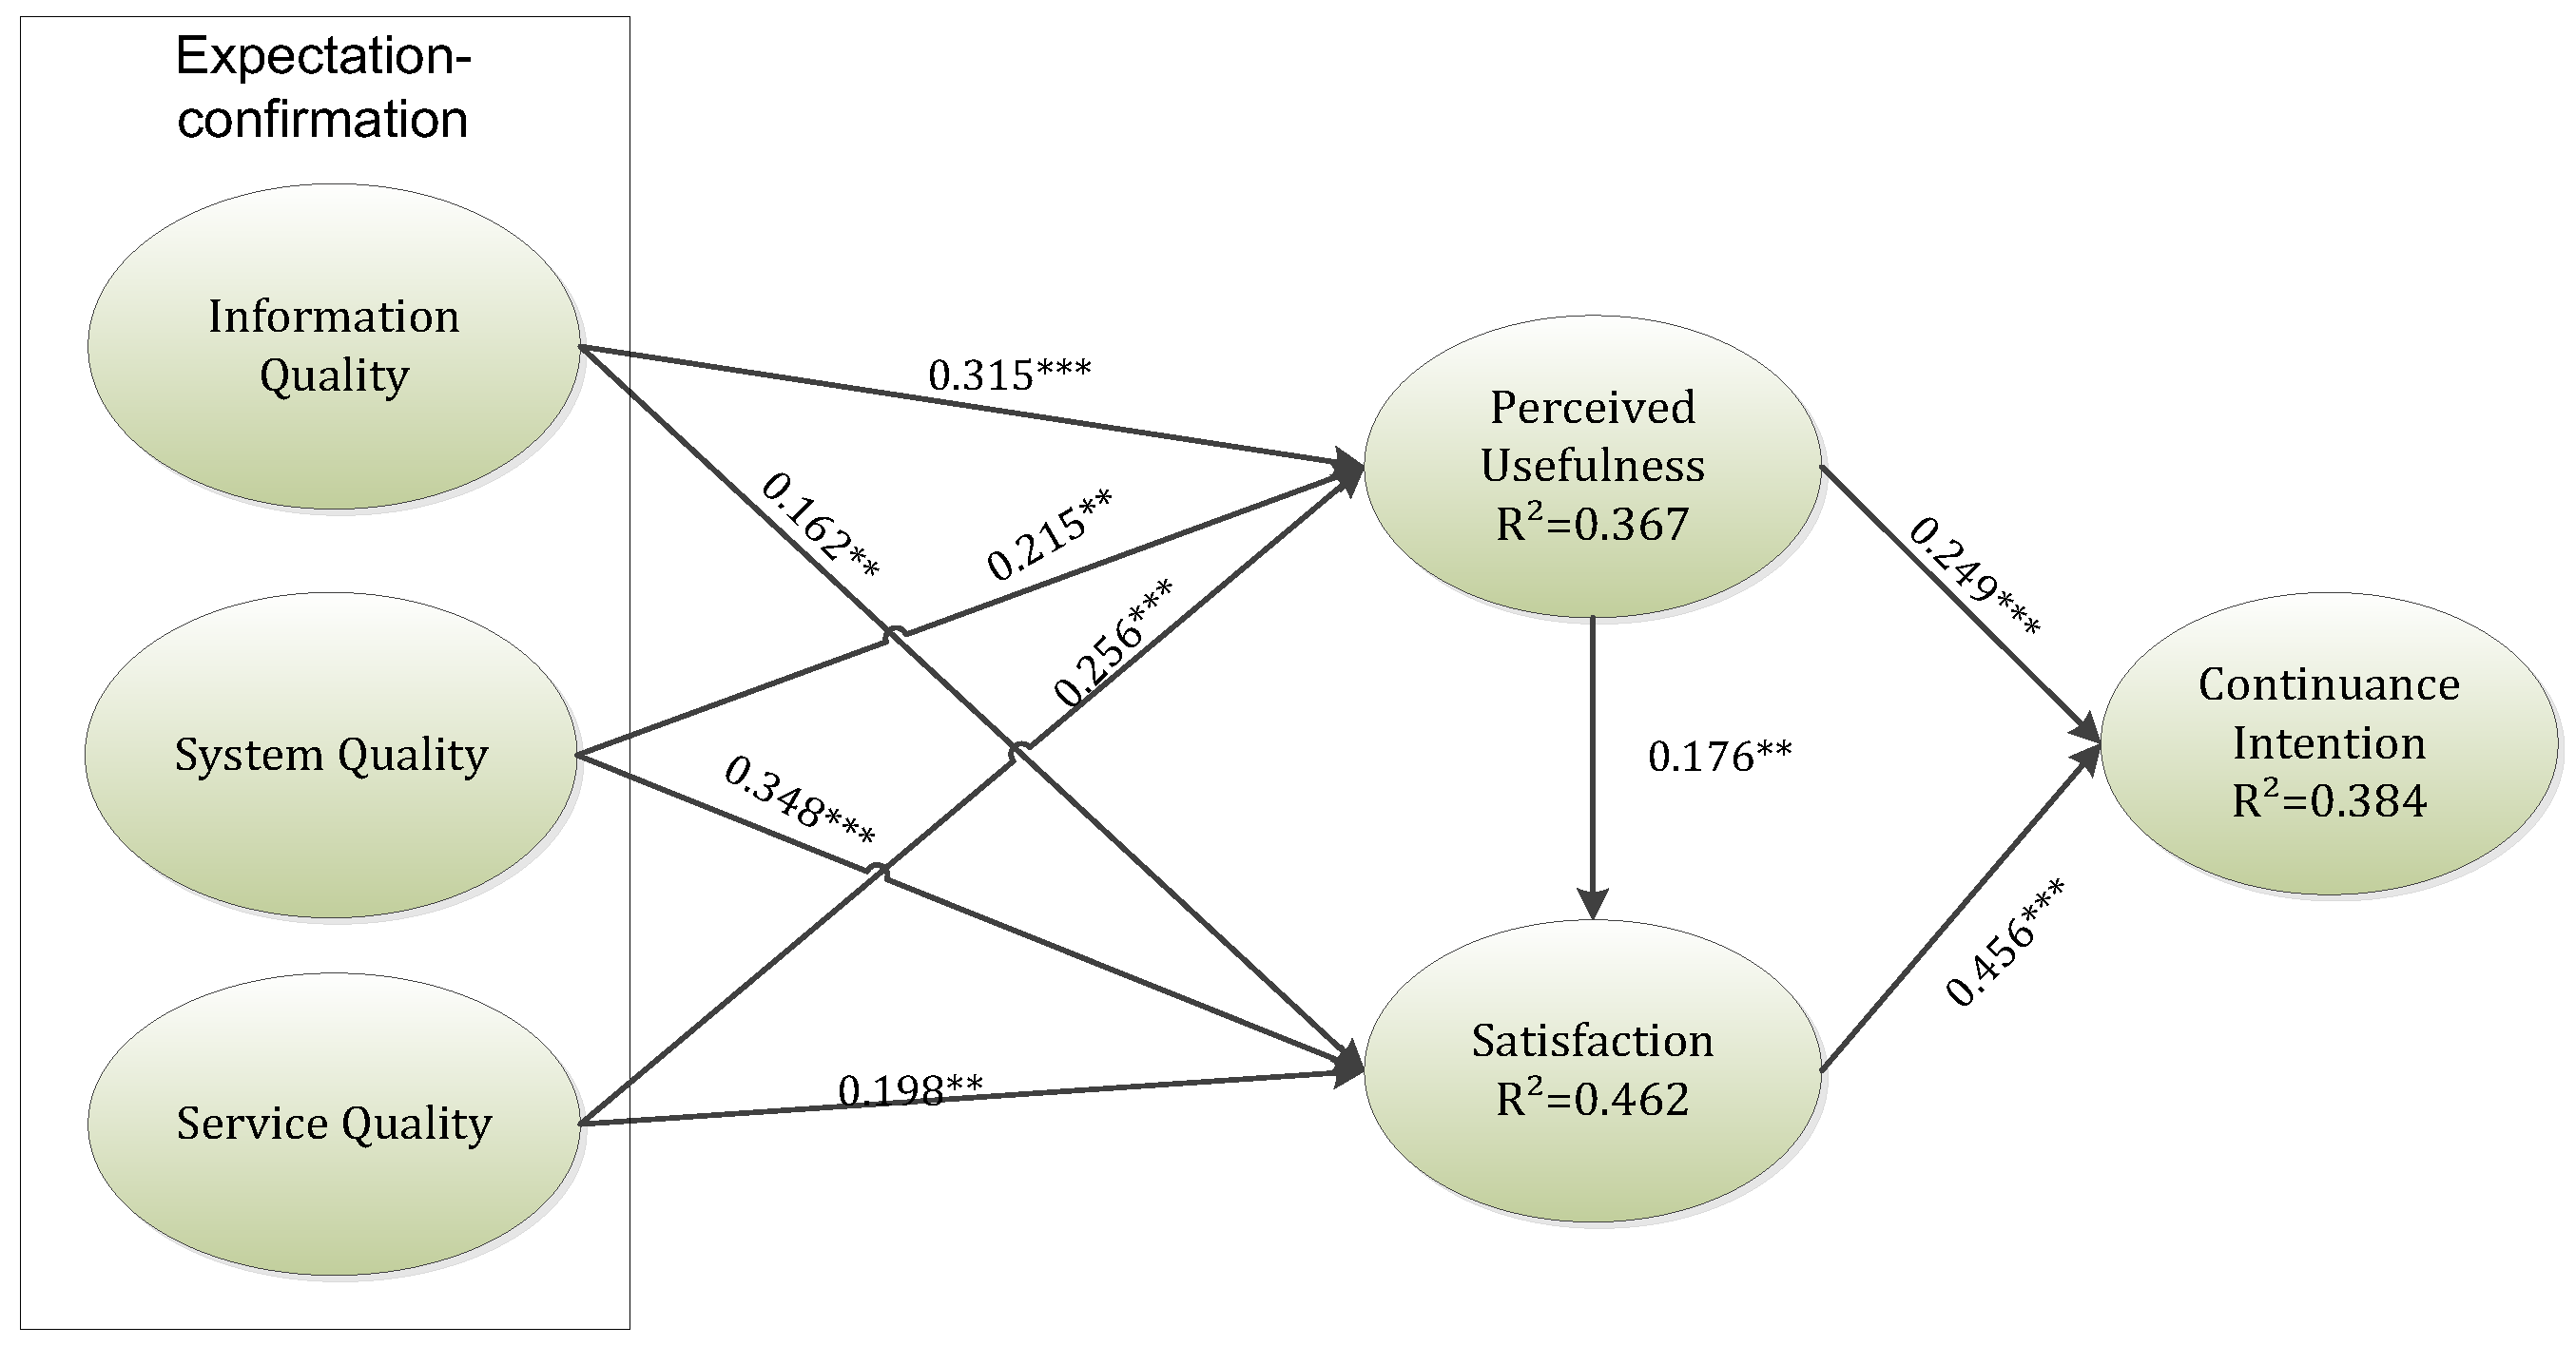
| Path | Standardized Path Coefficient | Standard Deviation | t-Value | p-Value |
|---|---|---|---|---|
| INFQ -> PU | 0.315 *** | 0.063 | 5.017 | 0.000 |
| INFQ -> SAT | 0.162 ** | 0.053 | 3.028 | 0.002 |
| SYSQ -> PU | 0.215 ** | 0.072 | 2.981 | 0.003 |
| SYSQ -> SAT | 0.348 *** | 0.061 | 5.722 | 0.000 |
| SERVQ -> PU | 0.256 *** | 0.057 | 4.454 | 0.000 |
| SERVQ -> SAT | 0.198 ** | 0.061 | 3.219 | 0.001 |
| PU -> SAT | 0.176 ** | 0.057 | 3.105 | 0.002 |
| PU -> CI | 0.249 *** | 0.068 | 3.679 | 0.000 |
| SAT -> CI | 0.456 *** | 0.060 | 7.544 | 0.000 |
Disclaimer/Publisher’s Note: The statements, opinions and data contained in all publications are solely those of the individual author(s) and contributor(s) and not of MDPI and/or the editor(s). MDPI and/or the editor(s) disclaim responsibility for any injury to people or property resulting from any ideas, methods, instructions or products referred to in the content. |
© 2023 by the authors. Licensee MDPI, Basel, Switzerland. This article is an open access article distributed under the terms and conditions of the Creative Commons Attribution (CC BY) license (https://creativecommons.org/licenses/by/4.0/).
Share and Cite
Lee, H.-H.; Sung, H.-C. Unveiling the Confirmation Factors of Information System Quality on Continuance Intention towards Online Cryptocurrency Exchanges: The Extension of the Expectation Confirmation Model. Information 2023, 14, 482. https://doi.org/10.3390/info14090482
Lee H-H, Sung H-C. Unveiling the Confirmation Factors of Information System Quality on Continuance Intention towards Online Cryptocurrency Exchanges: The Extension of the Expectation Confirmation Model. Information. 2023; 14(9):482. https://doi.org/10.3390/info14090482
Chicago/Turabian StyleLee, Hsu-Hua, and Hui-Chun Sung. 2023. "Unveiling the Confirmation Factors of Information System Quality on Continuance Intention towards Online Cryptocurrency Exchanges: The Extension of the Expectation Confirmation Model" Information 14, no. 9: 482. https://doi.org/10.3390/info14090482