Article

Image-Based Insect Counting Embedded in E-Traps That Learn without Manual Image Annotation and Self-Dispose Captured Insects

by
Ioannis Saradopoulos
1,
Ilyas Potamitis
2,*,
Antonios I. Konstantaras
1,
Panagiotis Eliopoulos
3,
Stavros Ntalampiras
4 and
Iraklis Rigakis
5
1
Department of Electronic Engineering, Hellenic Mediterranean University, 73133 Chania, Greece
2
Department of Music Technology and Acoustics, Hellenic Mediterranean University, 74100 Rethymno, Greece
3
Department of Agrotechnology, University of Thessaly, 41500 Larissa, Greece
4
Department of Computer Science, University of Milan, 20133 Milan, Italy
5
Department of Electrical and Electronics Engineering, University of West Attica, 12244 Athens, Greece
*
Author to whom correspondence should be addressed.
Information 2023, 14(5), 267; https://doi.org/10.3390/info14050267
Submission received: 7 March 2023 / Revised: 18 April 2023 / Accepted: 27 April 2023 / Published: 30 April 2023
(This article belongs to the Special Issue Artificial Intelligence on the Edge)

Abstract

:
This study describes the development of an image-based insect trap diverging from the plug-in camera insect trap paradigm in that (a) it does not require manual annotation of images to learn how to count targeted pests, and (b) it self-disposes the captured insects, and therefore is suitable for long-term deployment. The device consists of an imaging sensor integrated with Raspberry Pi microcontroller units with embedded deep learning algorithms that count agricultural pests inside a pheromone-based funnel trap. The device also receives commands from the server, which configures its operation, while an embedded servomotor can automatically rotate the detached bottom of the bucket to dispose of dehydrated insects as they begin to pile up. Therefore, it completely overcomes a major limitation of camera-based insect traps: the inevitable overlap and occlusion caused by the decay and layering of insects during long-term operation, thus extending the autonomous operational capability. We study cases that are underrepresented in the literature such as counting in situations of congestion and significant debris using crowd counting algorithms encountered in human surveillance. Finally, we perform comparative analysis of the results from different deep learning approaches (YOLOv7/8, crowd counting, deep learning regression). Interestingly, there is no one optimal clear-cut counting approach that can cover all situations involving small and large insects with overlap. By weighting the pros and cons we suggest that YOLOv7/8 provides the best embedded solution in general. We open-source the code and a large database of Lepidopteran plant pests.

1. Introduction

It is estimated that insect pests damage 18–20% of the world’s annual crop production, which is worth more than USD 470 billion. Most of these losses (13–16%) occur in the field [1]. Many notorious pests of very important crops (cotton, tomato, potato, soybean, maize etc.) belong to the order Lepidoptera and mainly to the sub-order of moths [2], which includes more than 220,000 species. Almost every plant in the world can be infested by at least one moth species [3]. Herbivorous moths mainly act as defoliators, leaf miners, fruit or stem borers, and can also damage agricultural products during storage (grains, flours etc.) [4].
Some moth species have been thoroughly studied because of their dramatic impact on crop production. For example, the cotton bollworm Helicoverpa armigera Hübner (Lepidoptera: Noctuidae) is a highly polyphagous moth that can feed on a wide range of major crops such as cotton, tomato, maize, chickpea, alfalfa, and tobacco. It has been reported to cause at least 25–31.5% losses on tomato [5,6]. Without effective control measures, damage by H. armigera and other moth pests on cotton can be as high as 67% [7]. Similarly, another notable moth species, the tomato leaf miner Tuta absoluta Povolny (Lepidoptera: Gelechiidae), is responsible for notable losses from 11% to 43% every year but can reach 100% if control is inadequate [8].
Effective control measures (e.g., pesticide spraying) require timely applications that can only be guaranteed if a pest population monitoring protocol is in effect from the beginning till the end of crop season. Monitoring of moth populations is usually carried out by various paper or plastic traps such as the delta and the funnel that rely on sex pheromone attraction [9]. The winged male adults follow the chemical signals of the sex pheromone (the female’s synthetic odor) and either are captured on a sticky surface or, in the case of a funnel-type trap [10], land on the pheromone dispenser and, over time, get exhausted and fall into the bottom bucket. Manual assessment requires people to visit the traps and count the number of captured insects. If performed properly, manual monitoring is costly. In large plantations, traps are so widely scattered that a means of transport is required to visit them repeatedly (usually every 7–14 days). Many people such as scouters and area managers are involved; therefore, manual monitoring cannot be performed at a large scale, spatially and temporally, due to manpower and cost constraints. Moreover, manual counting of insects in traps is often compromised due to its cost and repetitive nature, and delays in reporting can lead to a situation where the infestation has escalated to a higher level than currently reported.
For these reasons, in recent years we have witnessed a significant advancement in the field of automated vision-based insect traps (also known as e-traps, see [11,12,13] for thorough reviews). In [14,15,16,17,18] the authors use cameras attached to various platforms for biodiversity assessment in the field, while in this study we are particularly interested in agricultural moth pests [19,20,21,22,23,24]. Biodiversity assessment aims to count and identify a diverse range of flying insects that are representative of the local insect fauna, preferably without eliminating the insects. Monitoring of agricultural pests usually targets a single species in a crop where traps of various designs (e.g., delta, sticky, McPhail, funnel, pitfall, Lindgren, various non-standard bait traps, etc.) and attractants (pheromones or food baits) are employed. Individuals of the targeted species are captured, counted, identified, and eliminated. Intensive research is being conducted on various aspects of automatic monitoring such as different wireless communication possibilities (Wi-Fi, GPRS, IoT, ZigBee), power supply options (solar panels, batteries, low-power electronics design, etc.) and sensing modalities [25,26]. Fully automated pest detection systems based on cameras and image processing need to detect and/or identify insects and report wirelessly to a cloud server level. The transmission of the images introduces a large bandwidth overhead that raises communication costs and power consumption and can compromise the design of the system that must use low-quality picture analysis to mitigate these costs. Therefore, the current research trend—where also our work belongs—is to embed sophisticated deep-learning-based (DL) systems in the device deployed in the field (edge computing) and transmit only the results (i.e., counts of insects, environmental variables such as ambient humidity and temperature, GPS coordinates, and timestamps) [27,
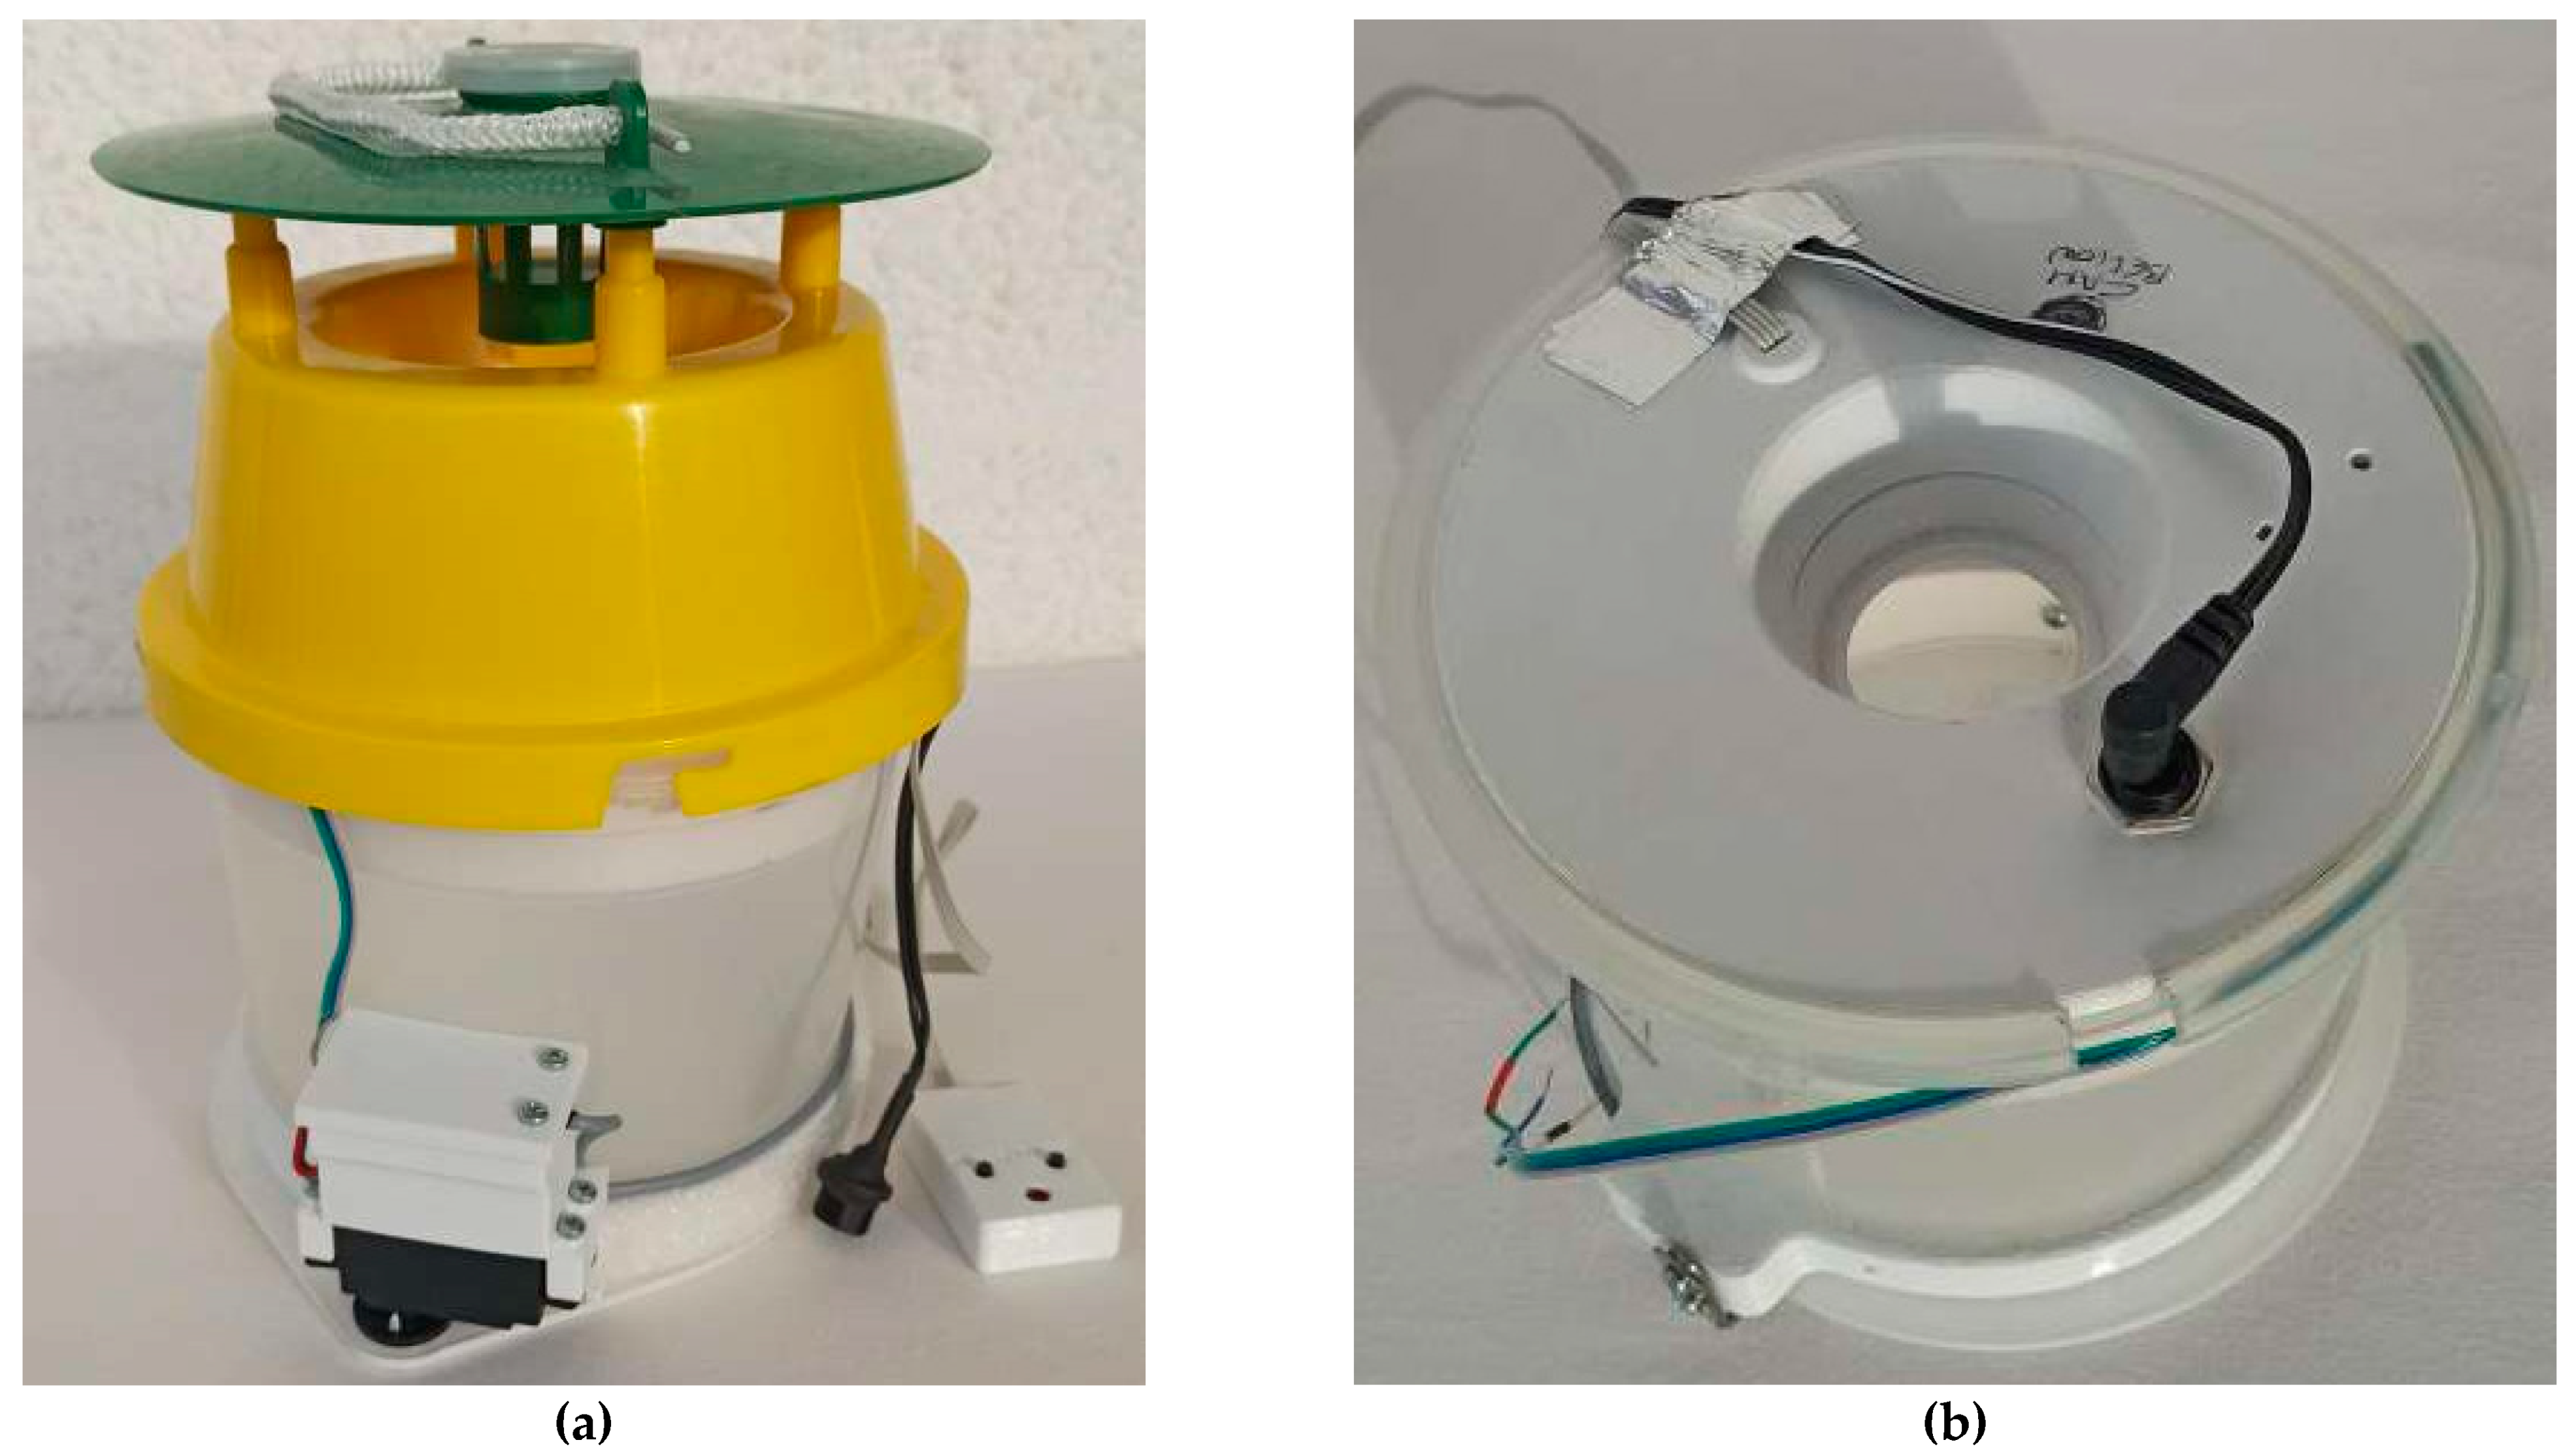
28]. Moreover, such a low-data approach allows for a network of LoRa-based nodes with a common gateway that uploads the data, further reducing communication costs. Our contribution detects and counts the trapped insects in a specific but widely used trap for all species of Lepidoptera with a known pheromone trap: the funnel trap.
The camera-based version of the funnel trap is attached to a typical, plastic funnel trap without inflicting any change in its shape and functionality. Therefore, all monitoring protocols associated with this trap remain valid even after it is transformed to a cyber-physical system. By the term ‘cyber-physical’ we mean that the trap is monitored by computer-based algorithms (in our case deep learning) running onboard (i.e., in edge platforms). Moreover, in the context of our work, the physical and software components are closely intertwined: the e-trap receives commands from and reports data to a server via wireless communication and changes its behavioral modality by removing the floor of the trap through a servomotor to dispose of the captured insects and repositioning itself after disposal.
Automatic counting of insects is an active field of research with many other approaches beyond camera-based traps [25]. Automatic counting and wireless reporting is important because then, insect monitoring can scale up to global scales. Knowing where and how serious the infestation is, allows us to prioritize and apply interventions in a timely manner without making excessive use of insecticides. Our contribution and the novelties we introduce are as follows:
(A) Deep learning classification largely depends on the availability of a large amount of training examples [29,30,31,32,33,34,35,36,37,38,39]. Construction of large image datasets from real field operation is time-consuming to collect, as it requires annotation (i.e., manually labeling insects with a bounding box using specialized software). Manual annotation is laborious as it needs to be applied to hundreds of images and requires knowledge of software tools that are not generally well-known to other research fields such as agronomy or entomology. We develop a pipeline of actions that does not require manual labeling of insects in pictures with bounding boxes to create image-based insect counters.
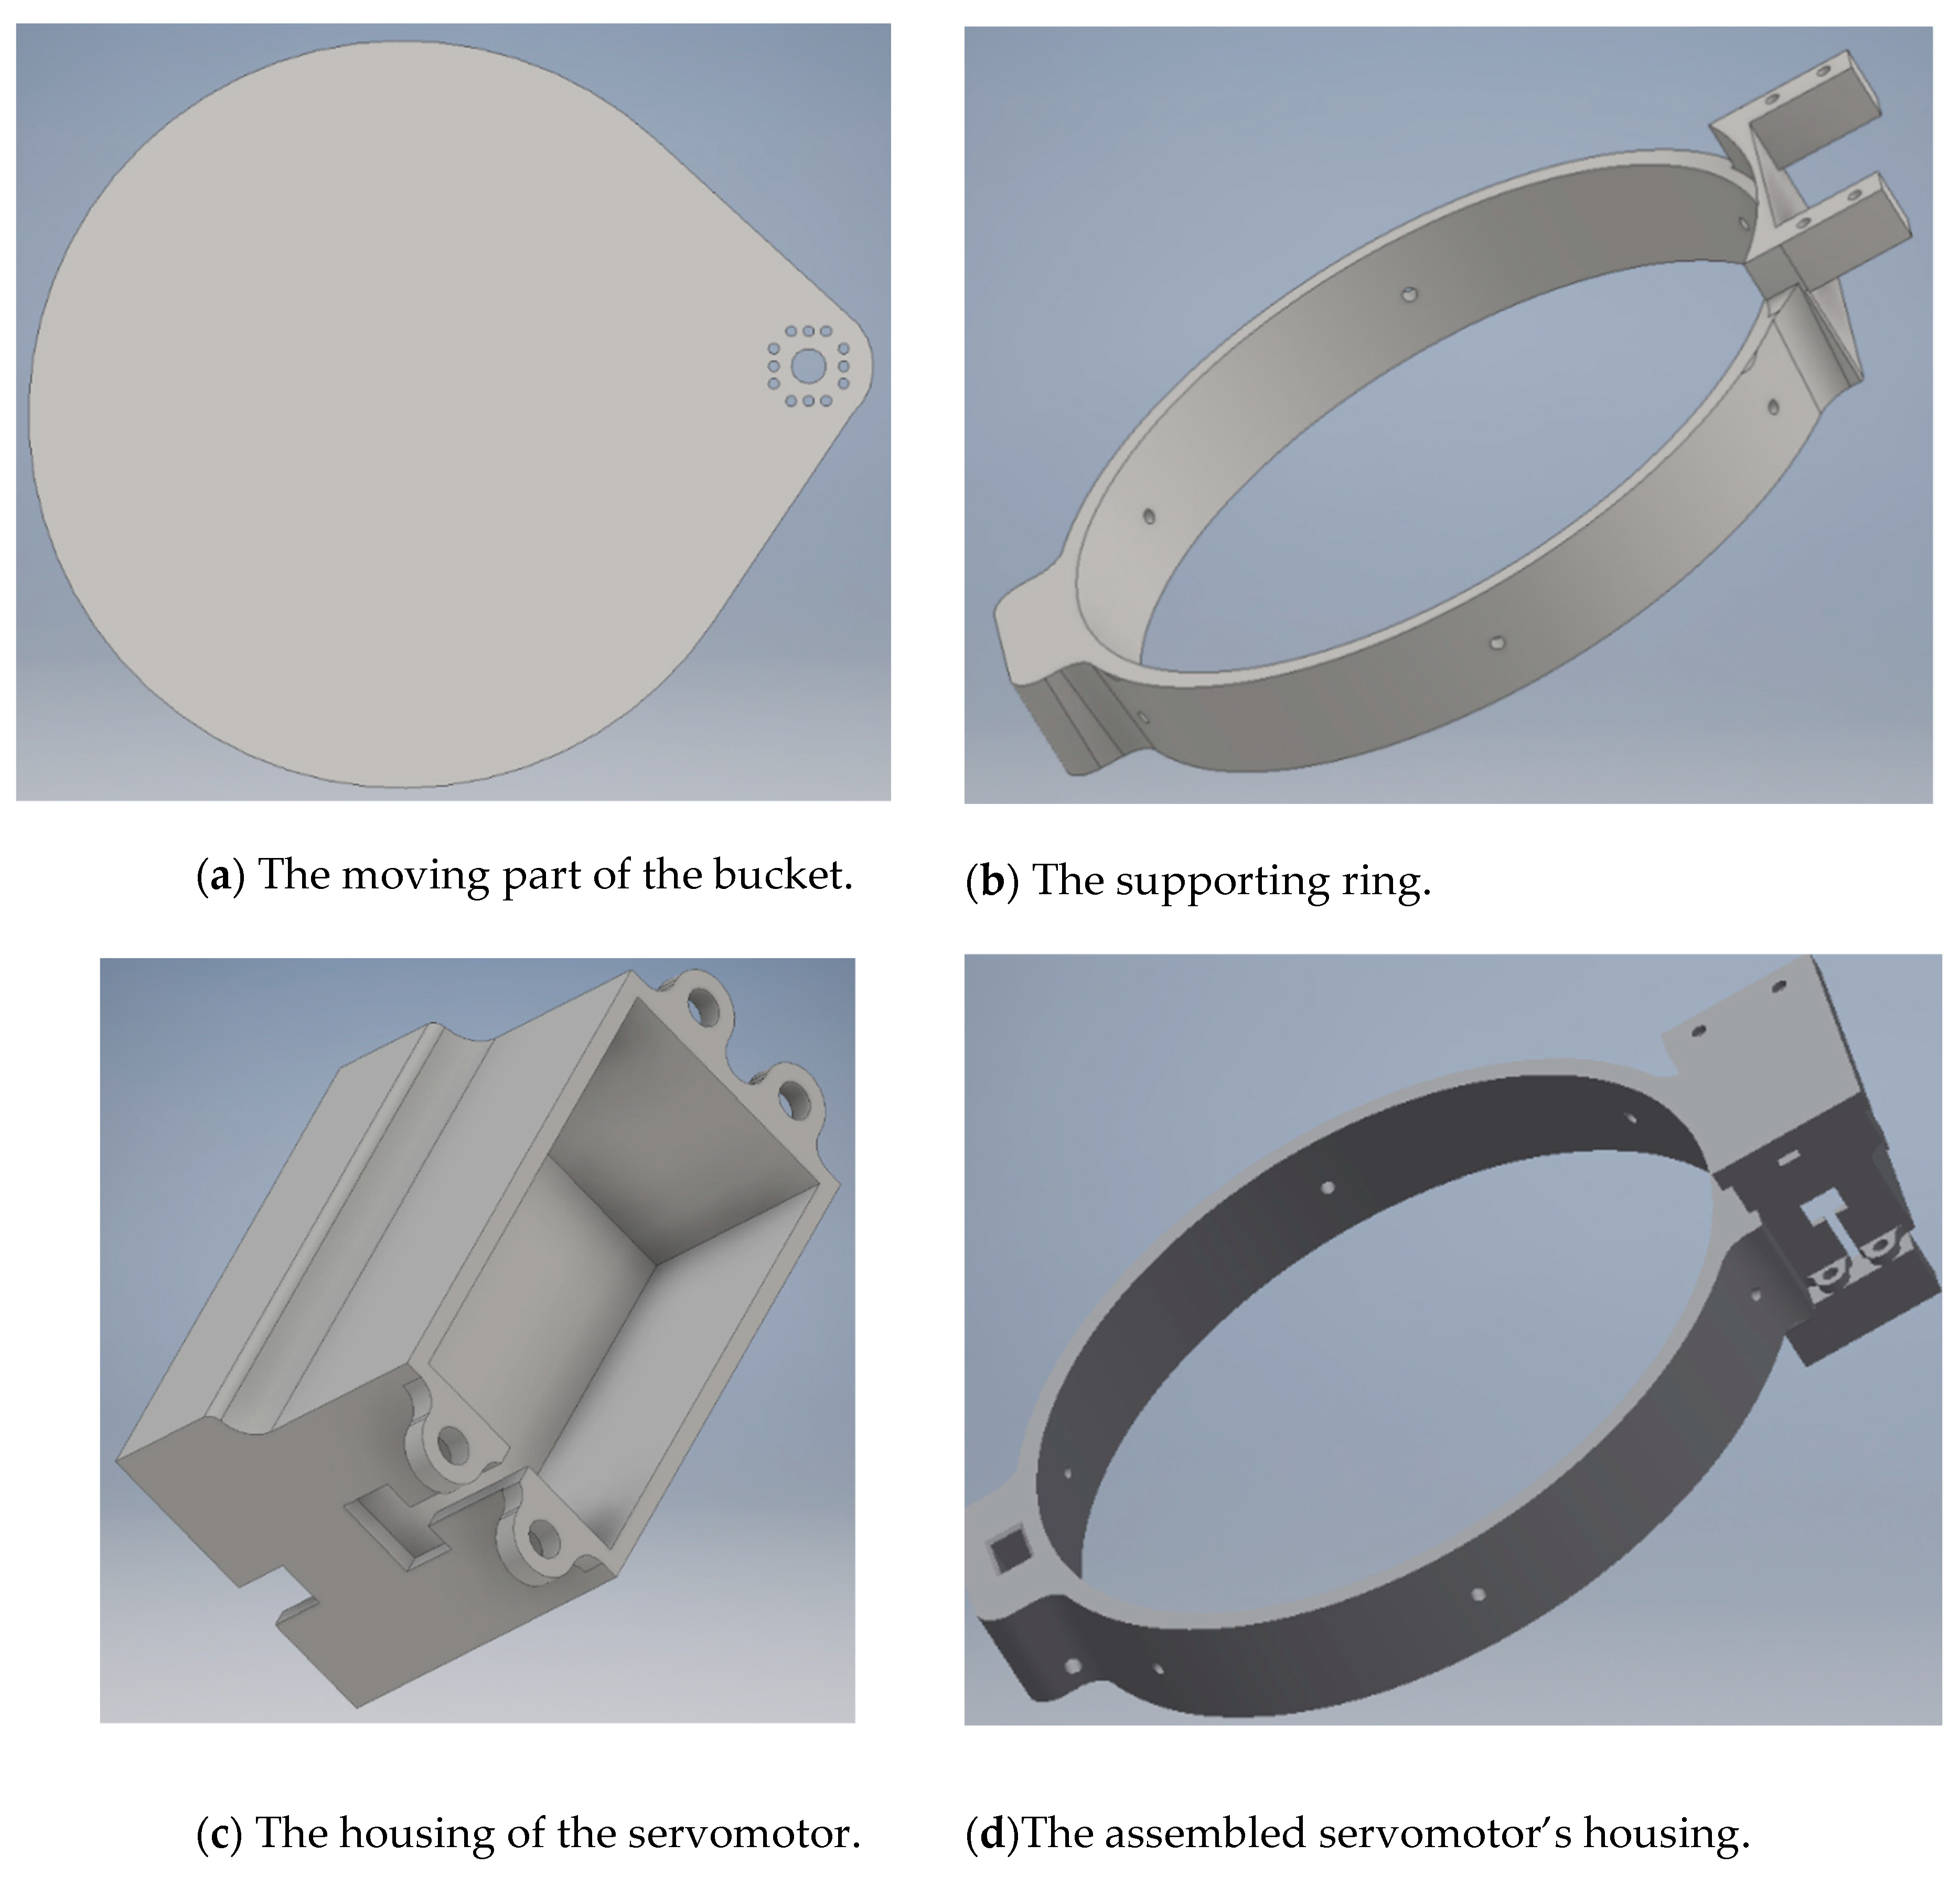
(B) E-traps must autonomously operate for months without human intervention. To face the inevitable problem of complete overlap of insects we introduce a novel, affordable mechanism (<USD 10) that completely solves this problem by attaching a servomotor to the bottom of the bucket. We detach the bottom of the bucket from the main e-funnel, and the servomotor can rotate and dispose of the trapped insects that have been dehydrated by the sun. A device with the ability to dispose of a congested scene solves the serious limitation caused by overlapping insects.
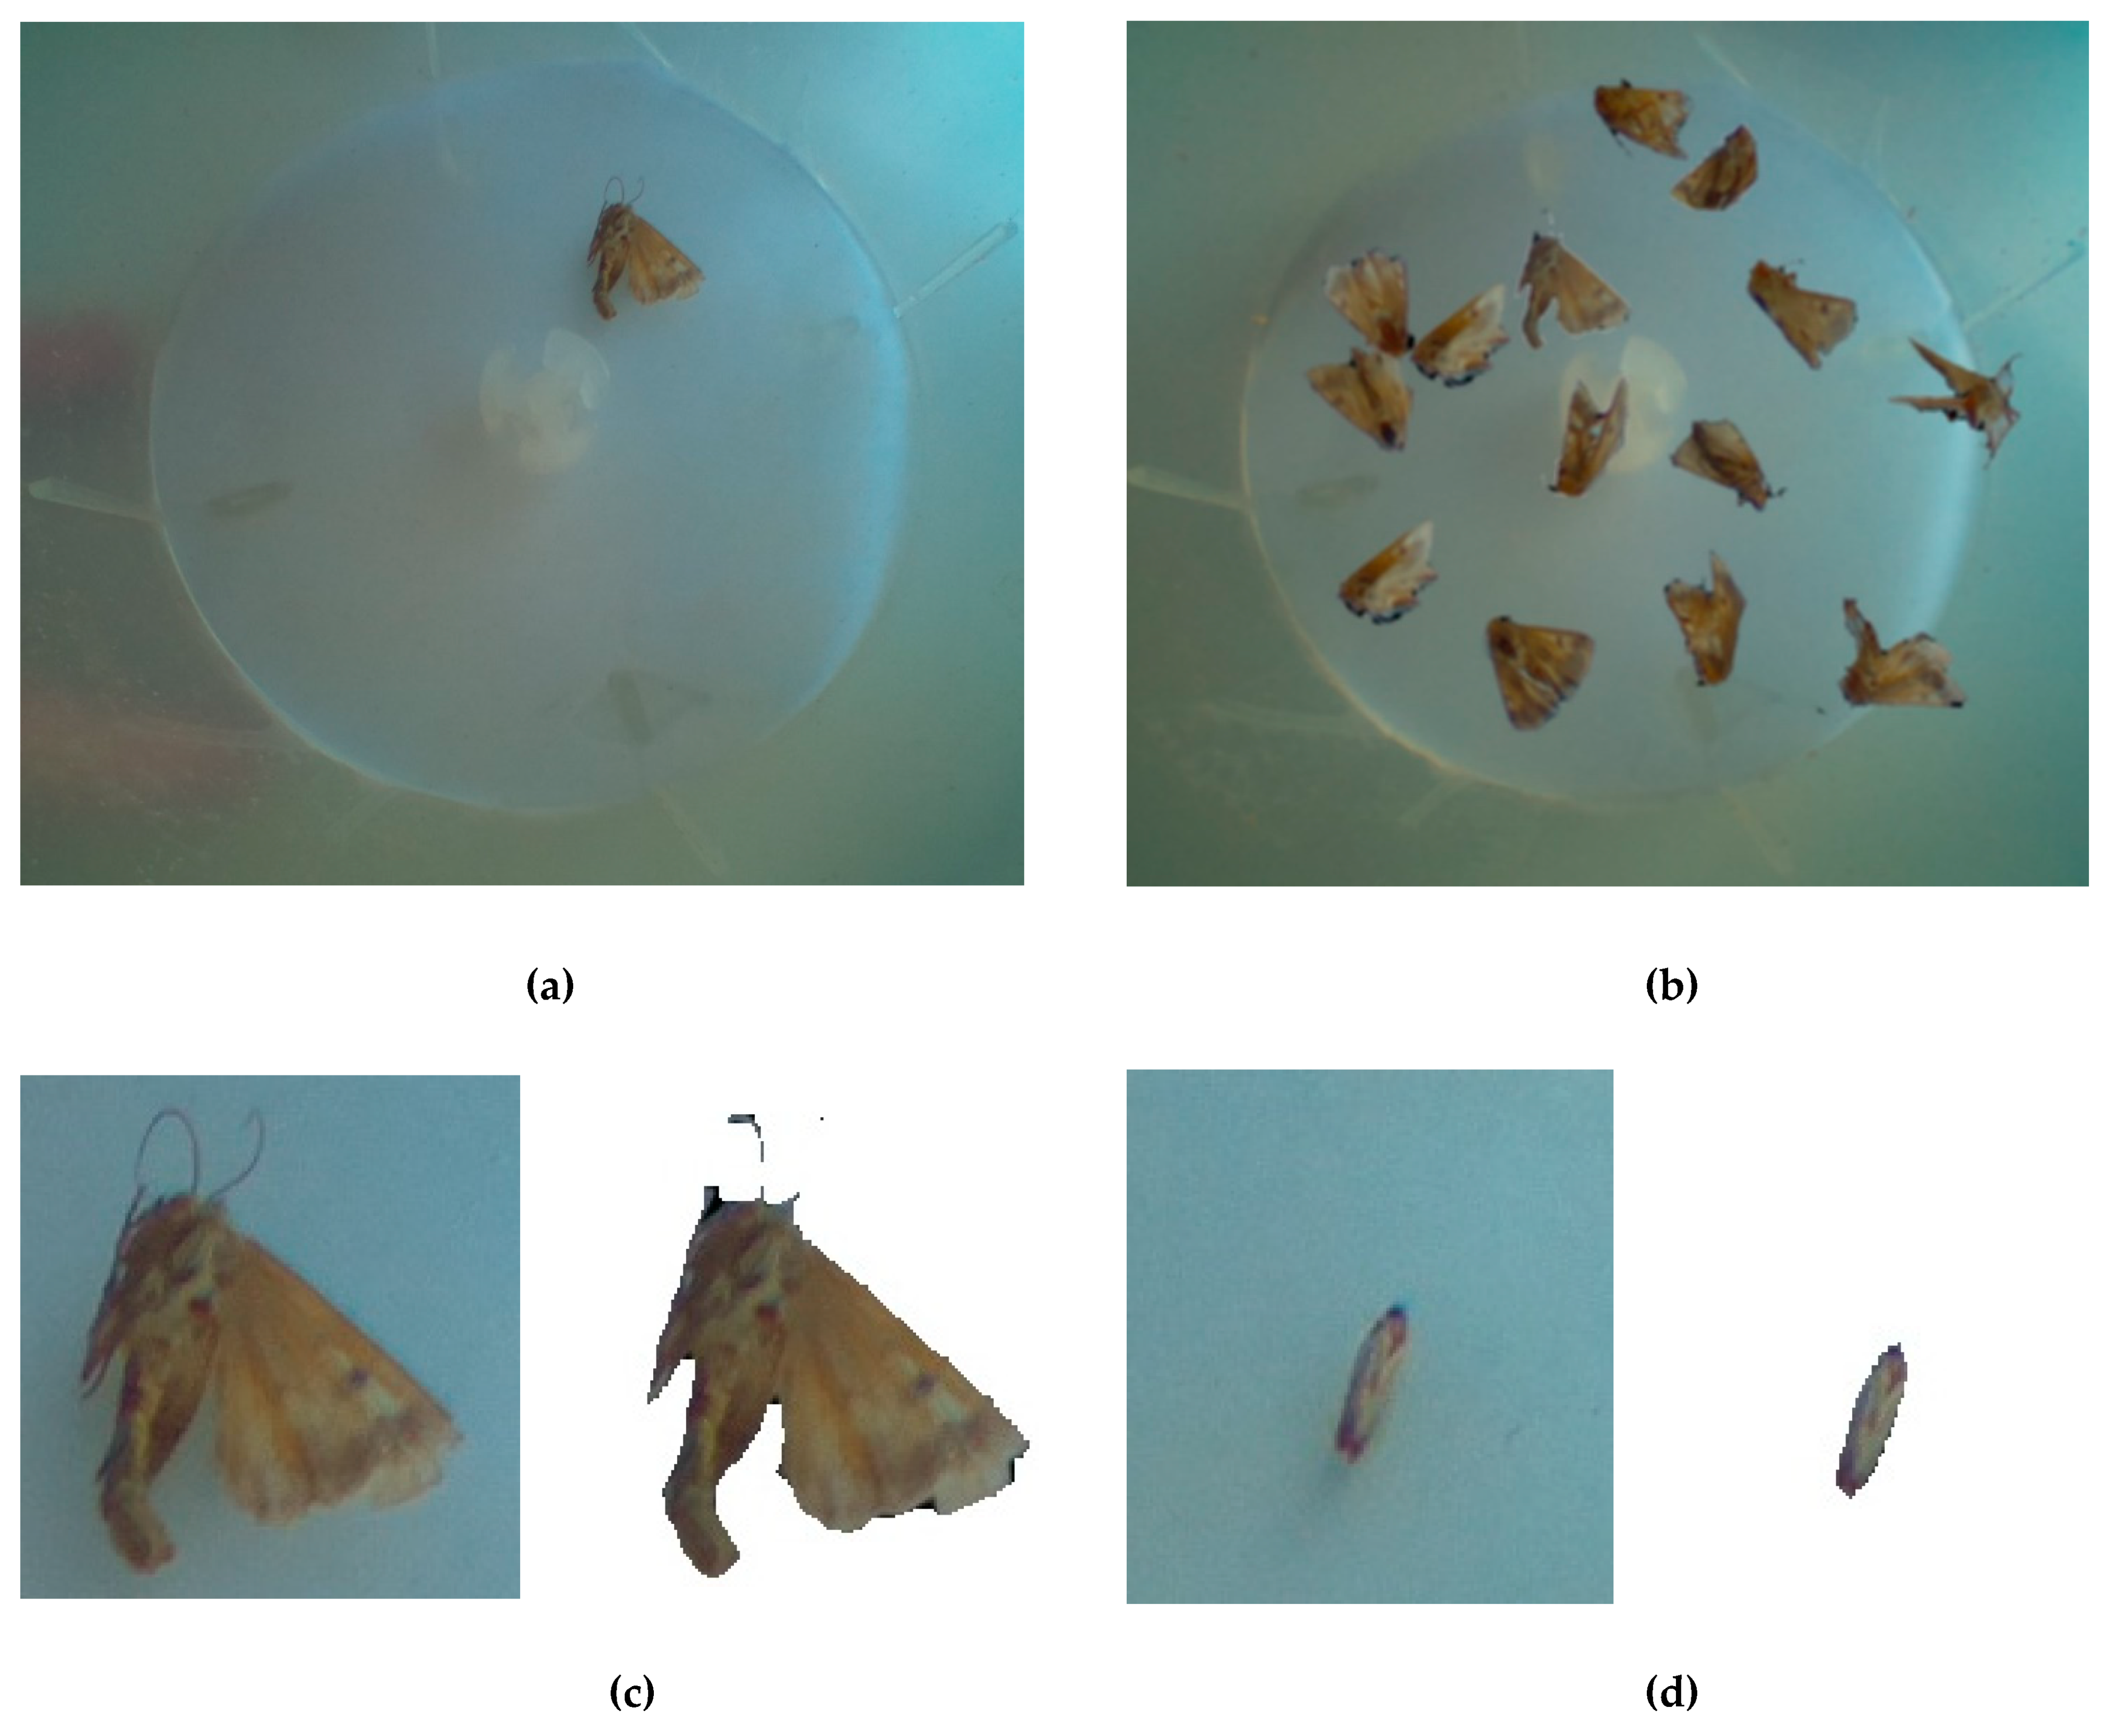
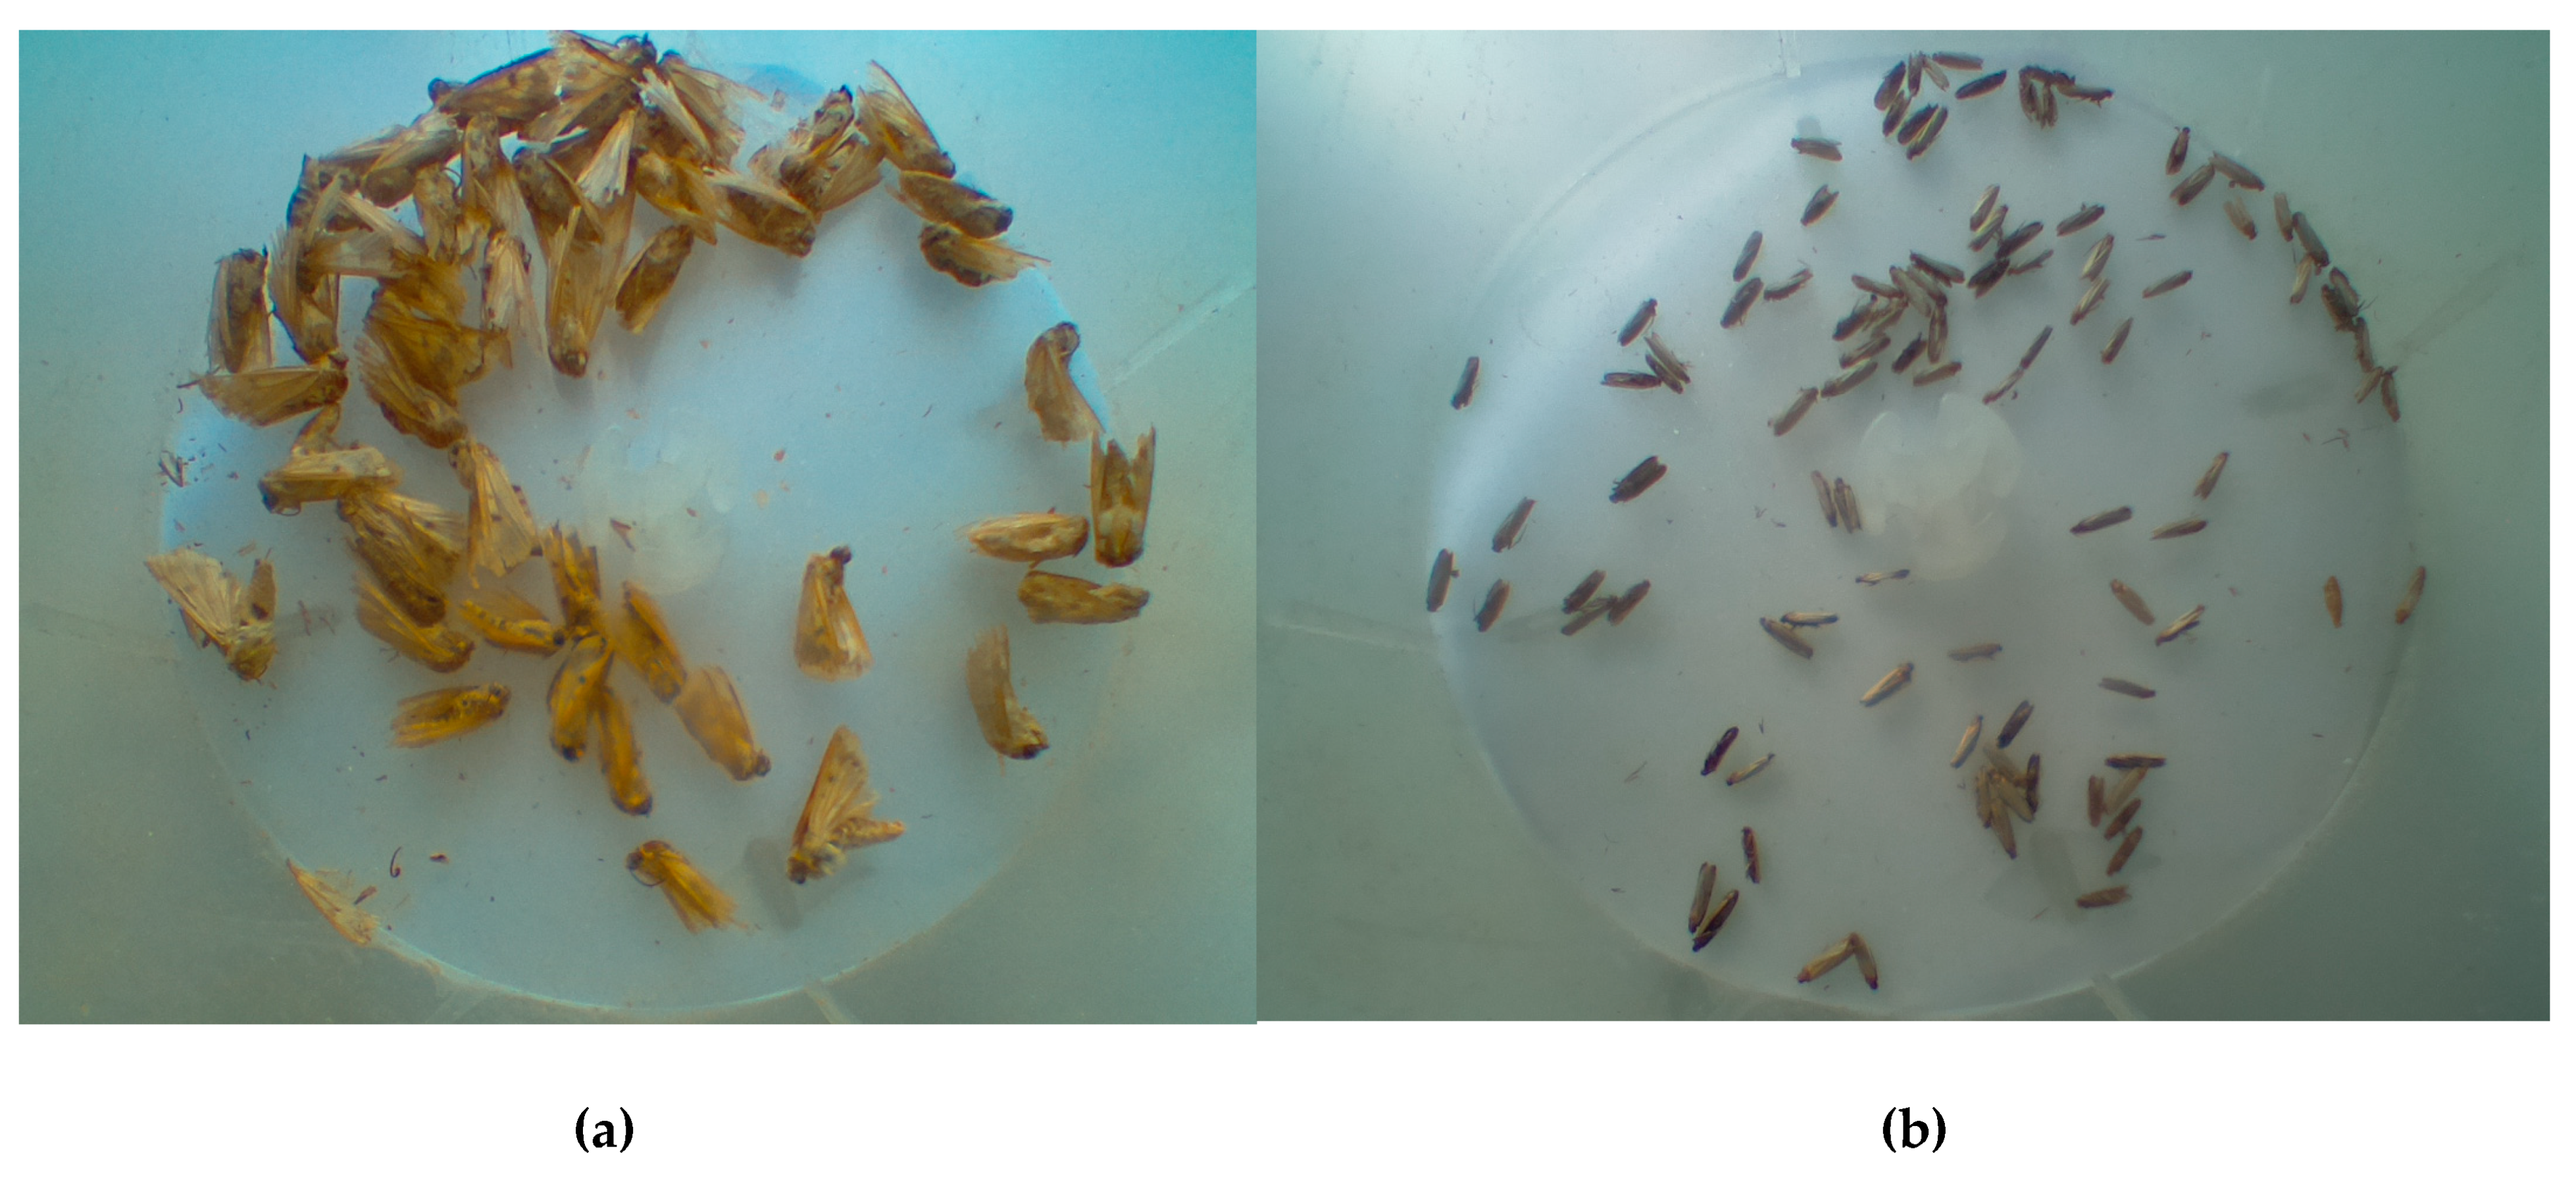
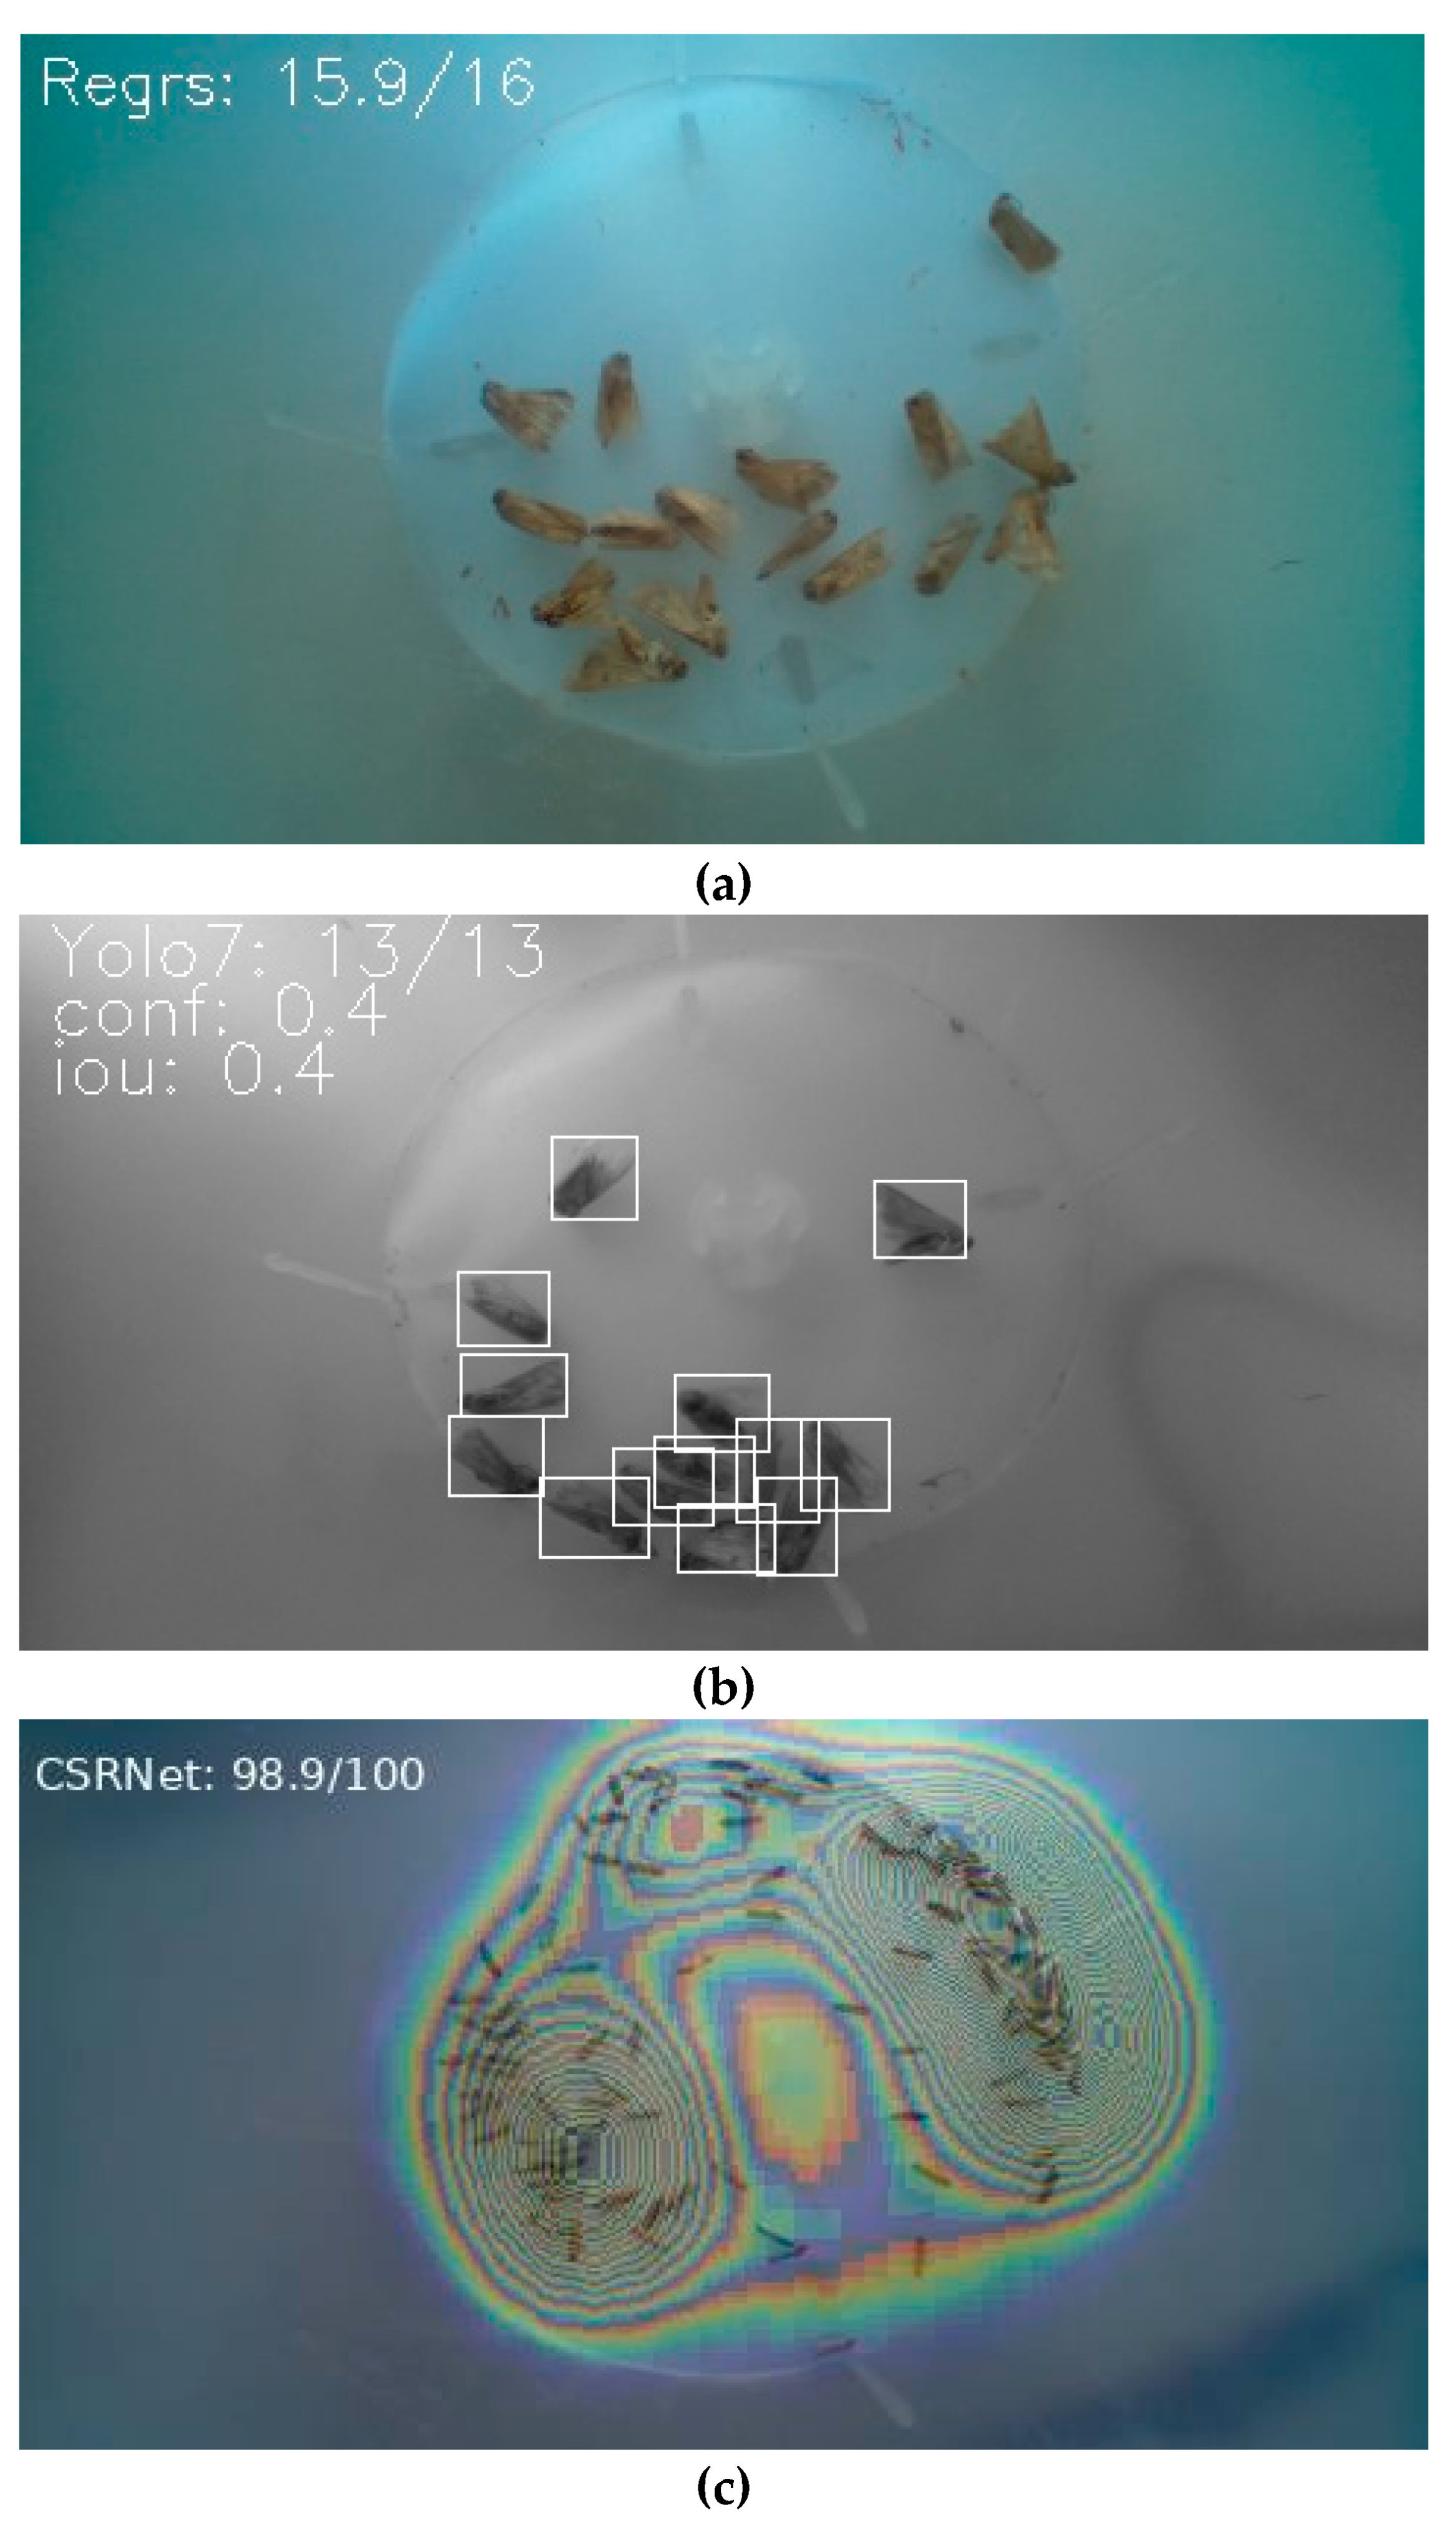
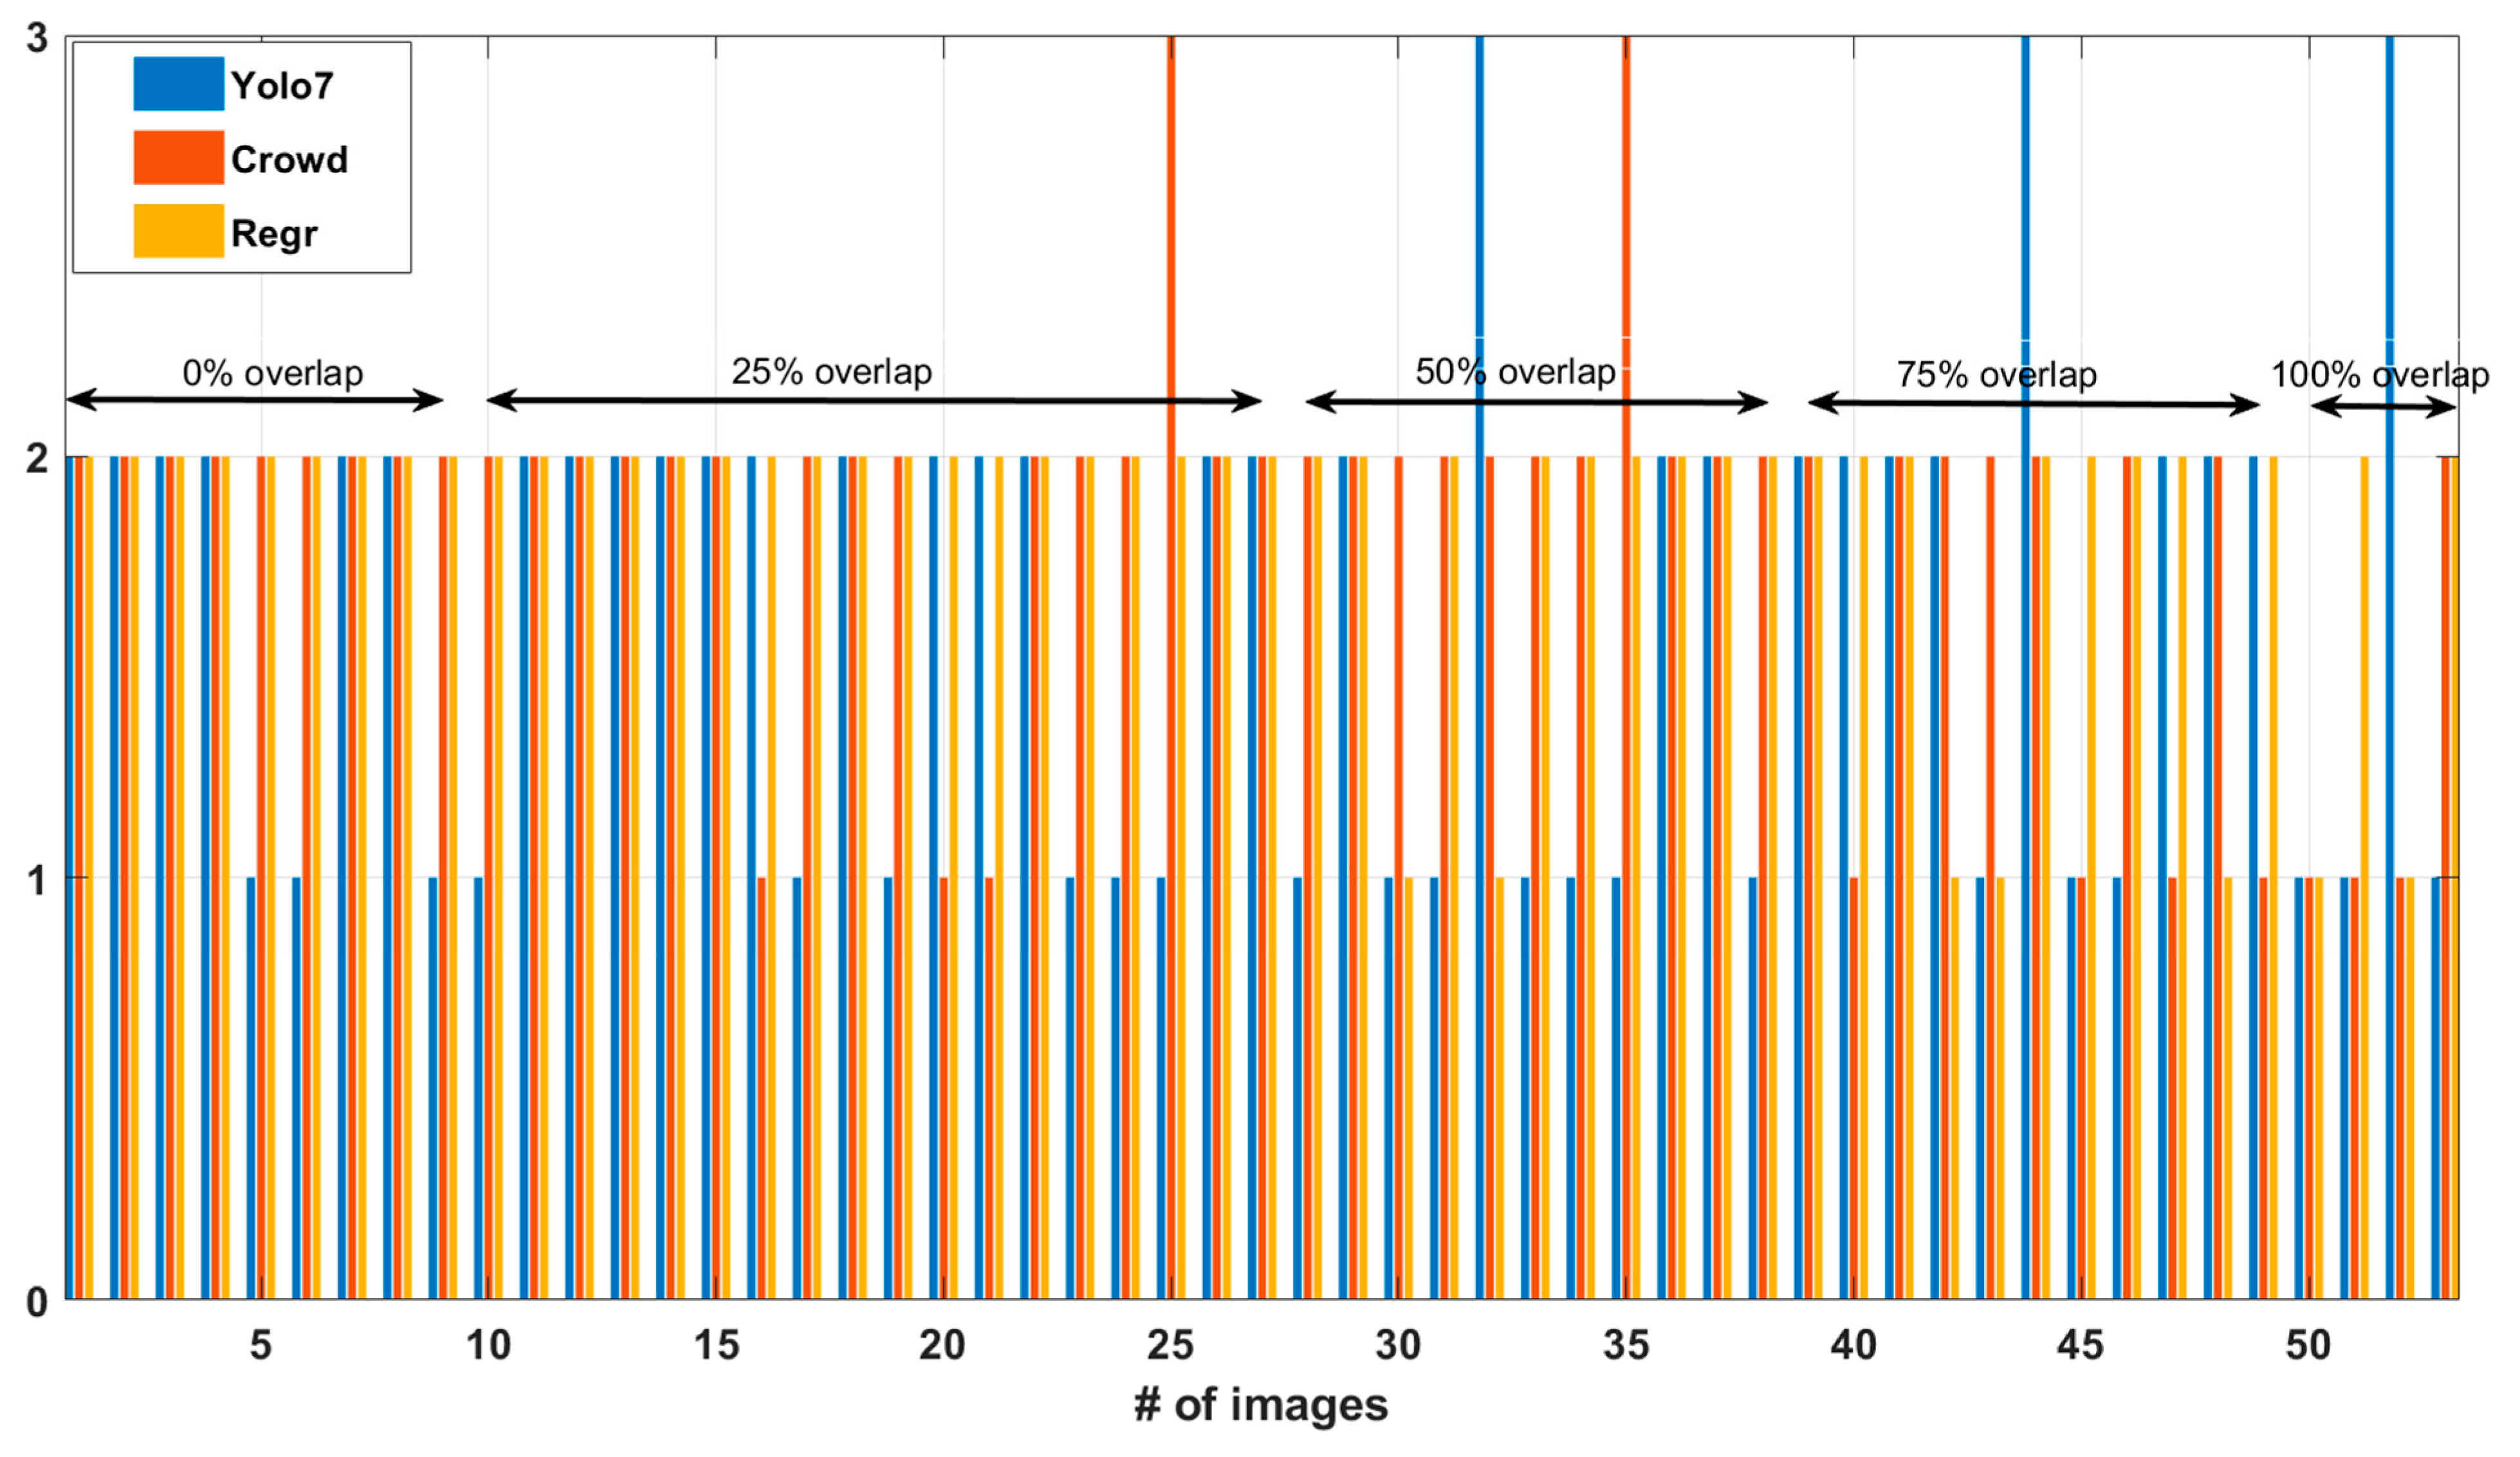
(C) We specifically investigate problematic cases such as overlapping and congestion of insects trapped in a bucket. During field operations, we observed a large number of trapped insects (30–70 per day). When the insect bodies pile up, one cannot count them reliably from a photograph of the internal space of the trap. The partial or complete occlusion of insects’ shapes as well as congregation of partially disintegrated insects and debris are common realities that prevent image processing algorithms from counting them efficiently in the long run. We studied this problematic case, and present crowd counting algorithms originally applied for counting people in surveillance applications.
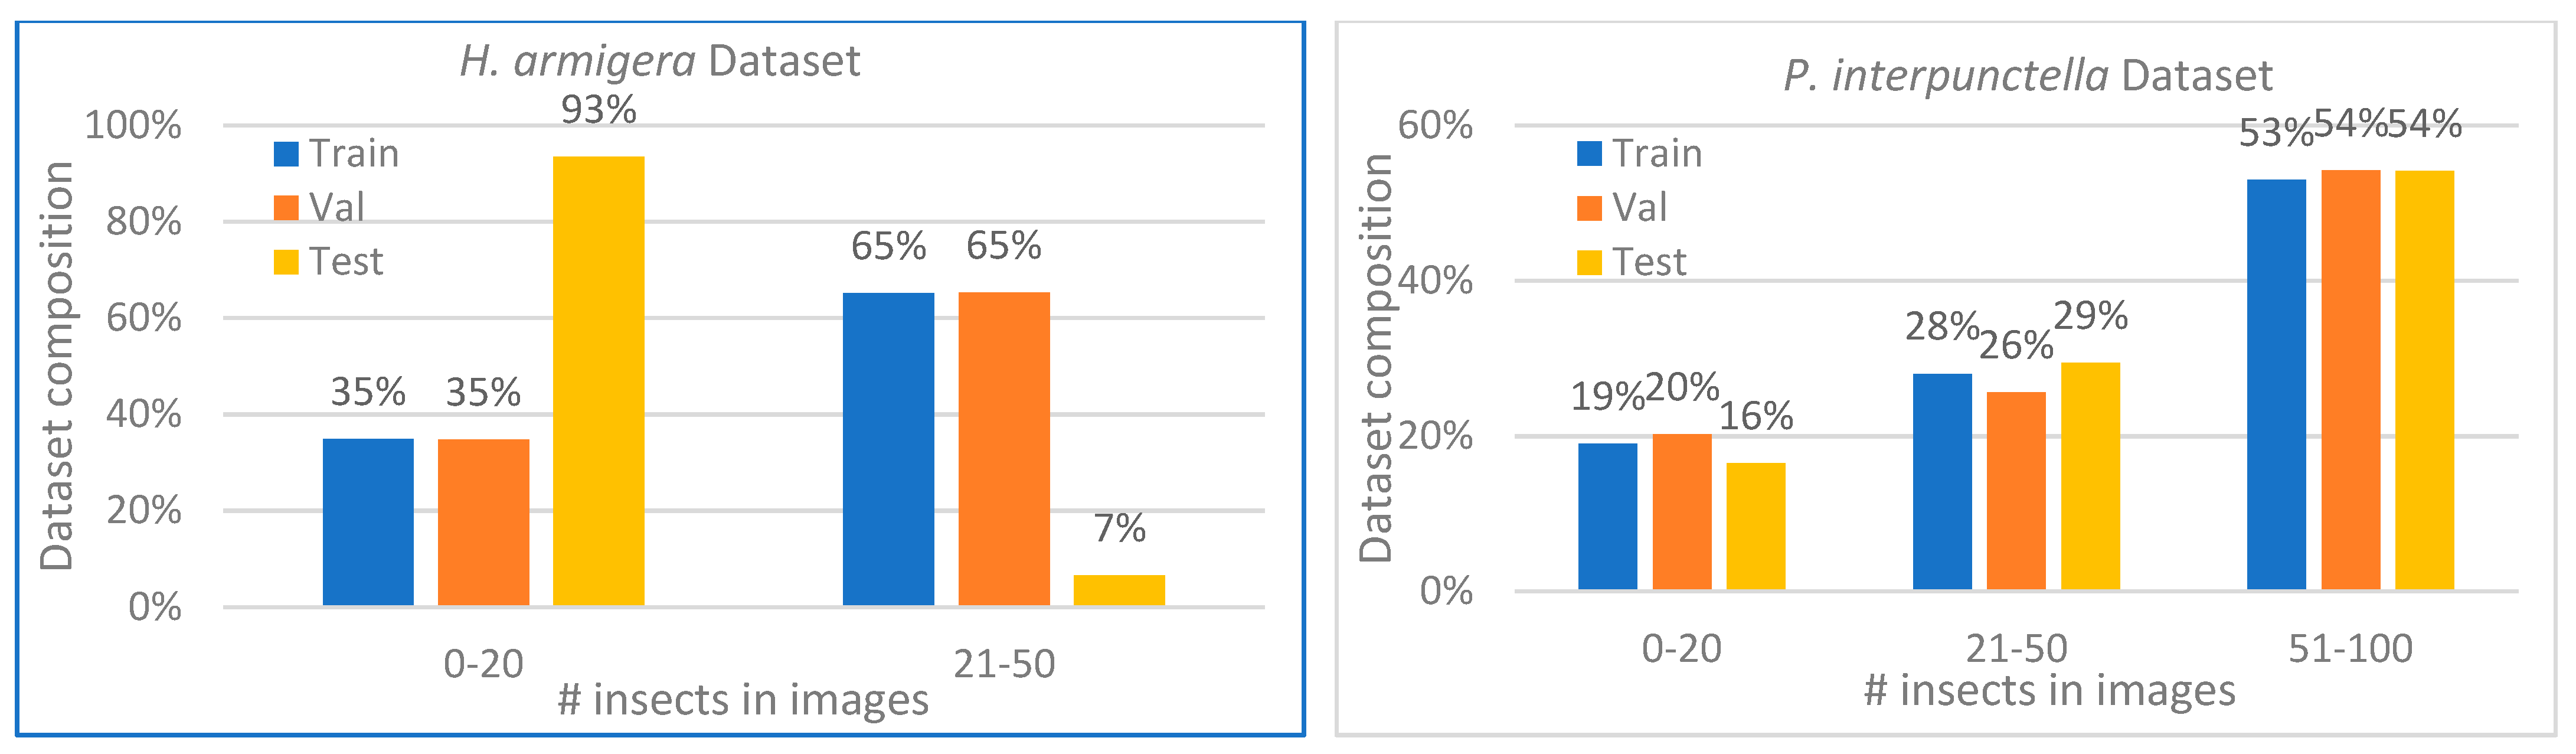
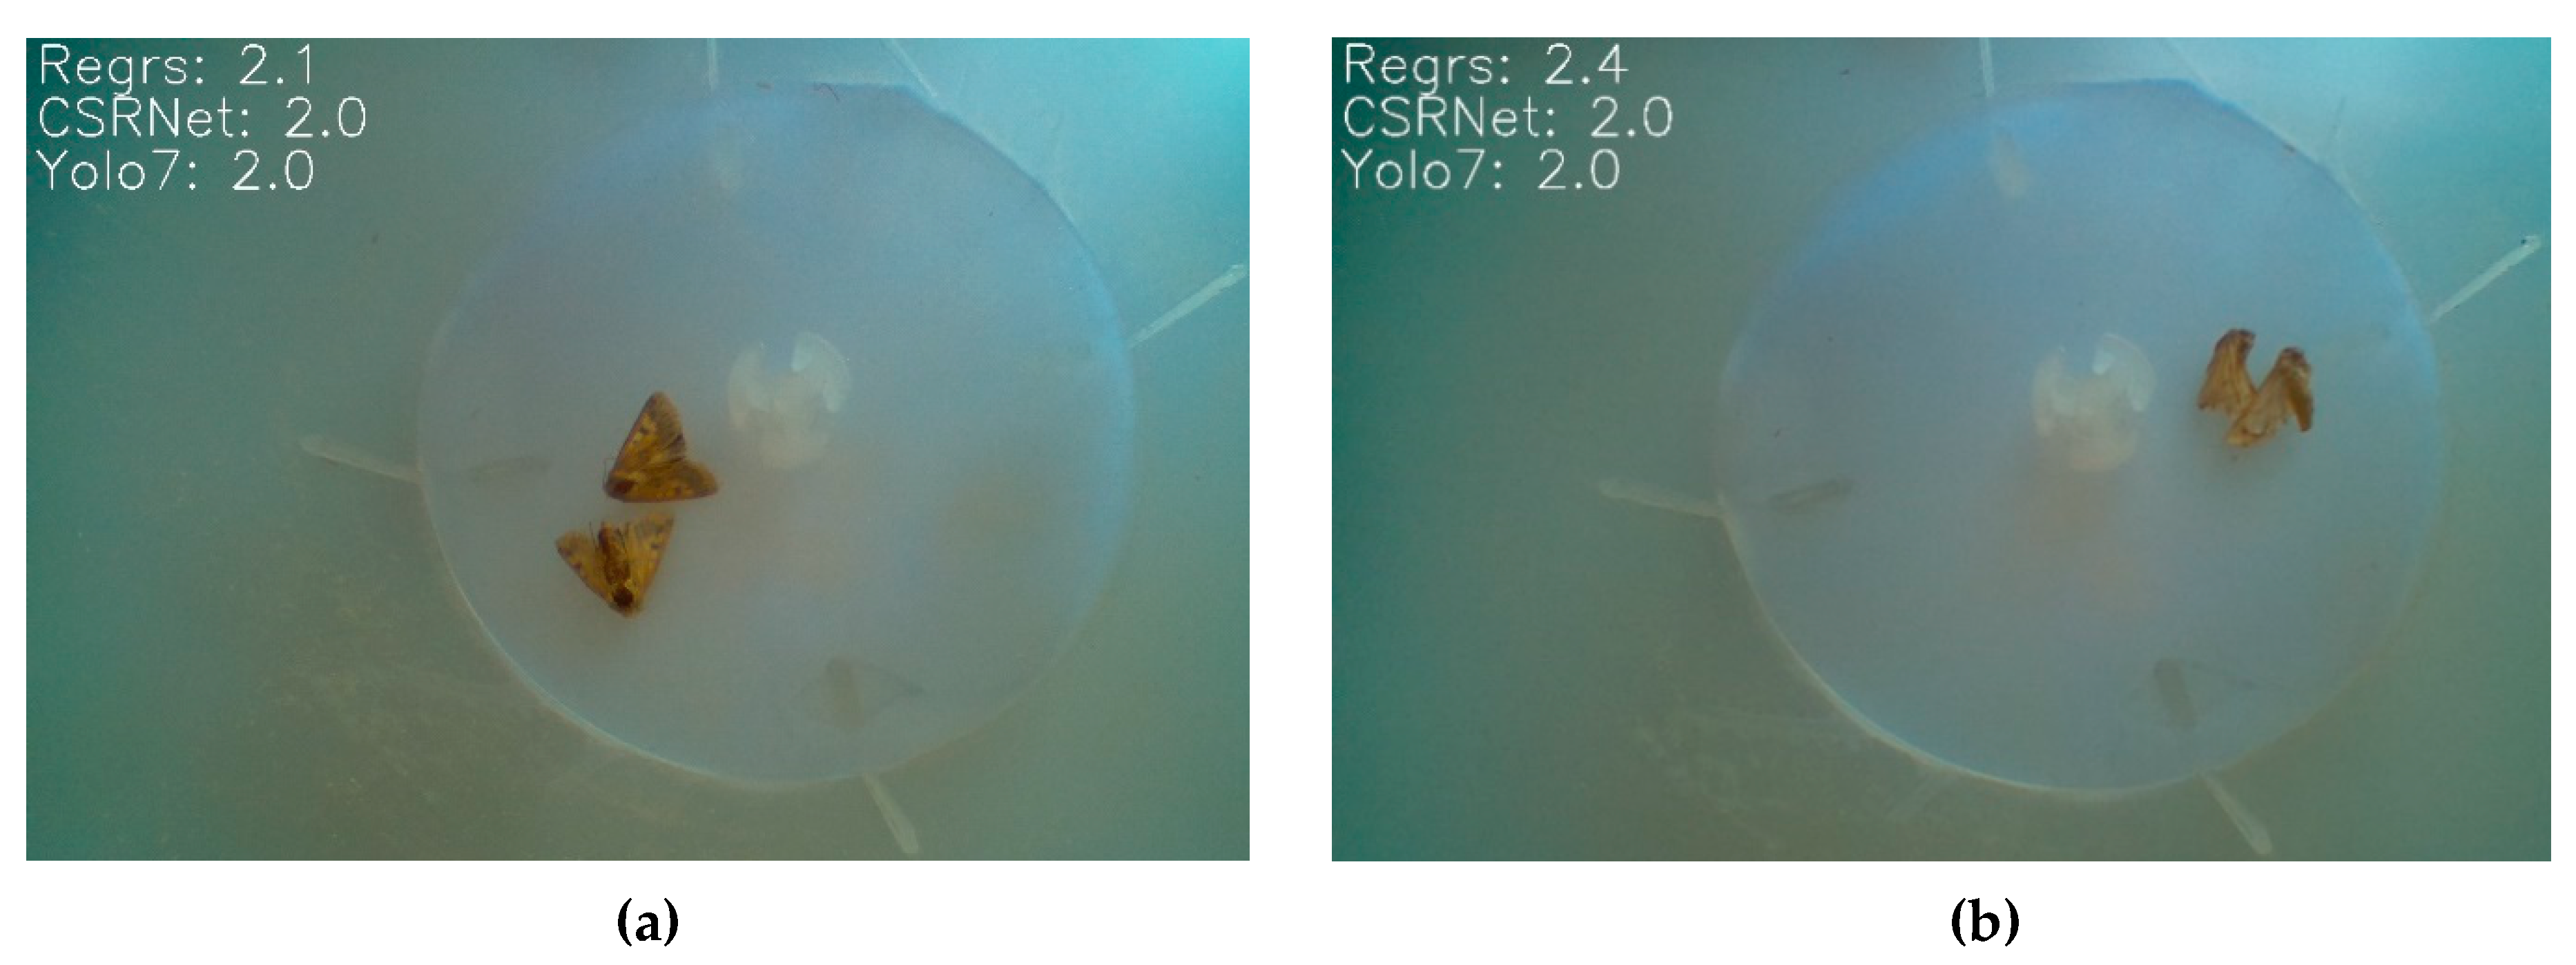
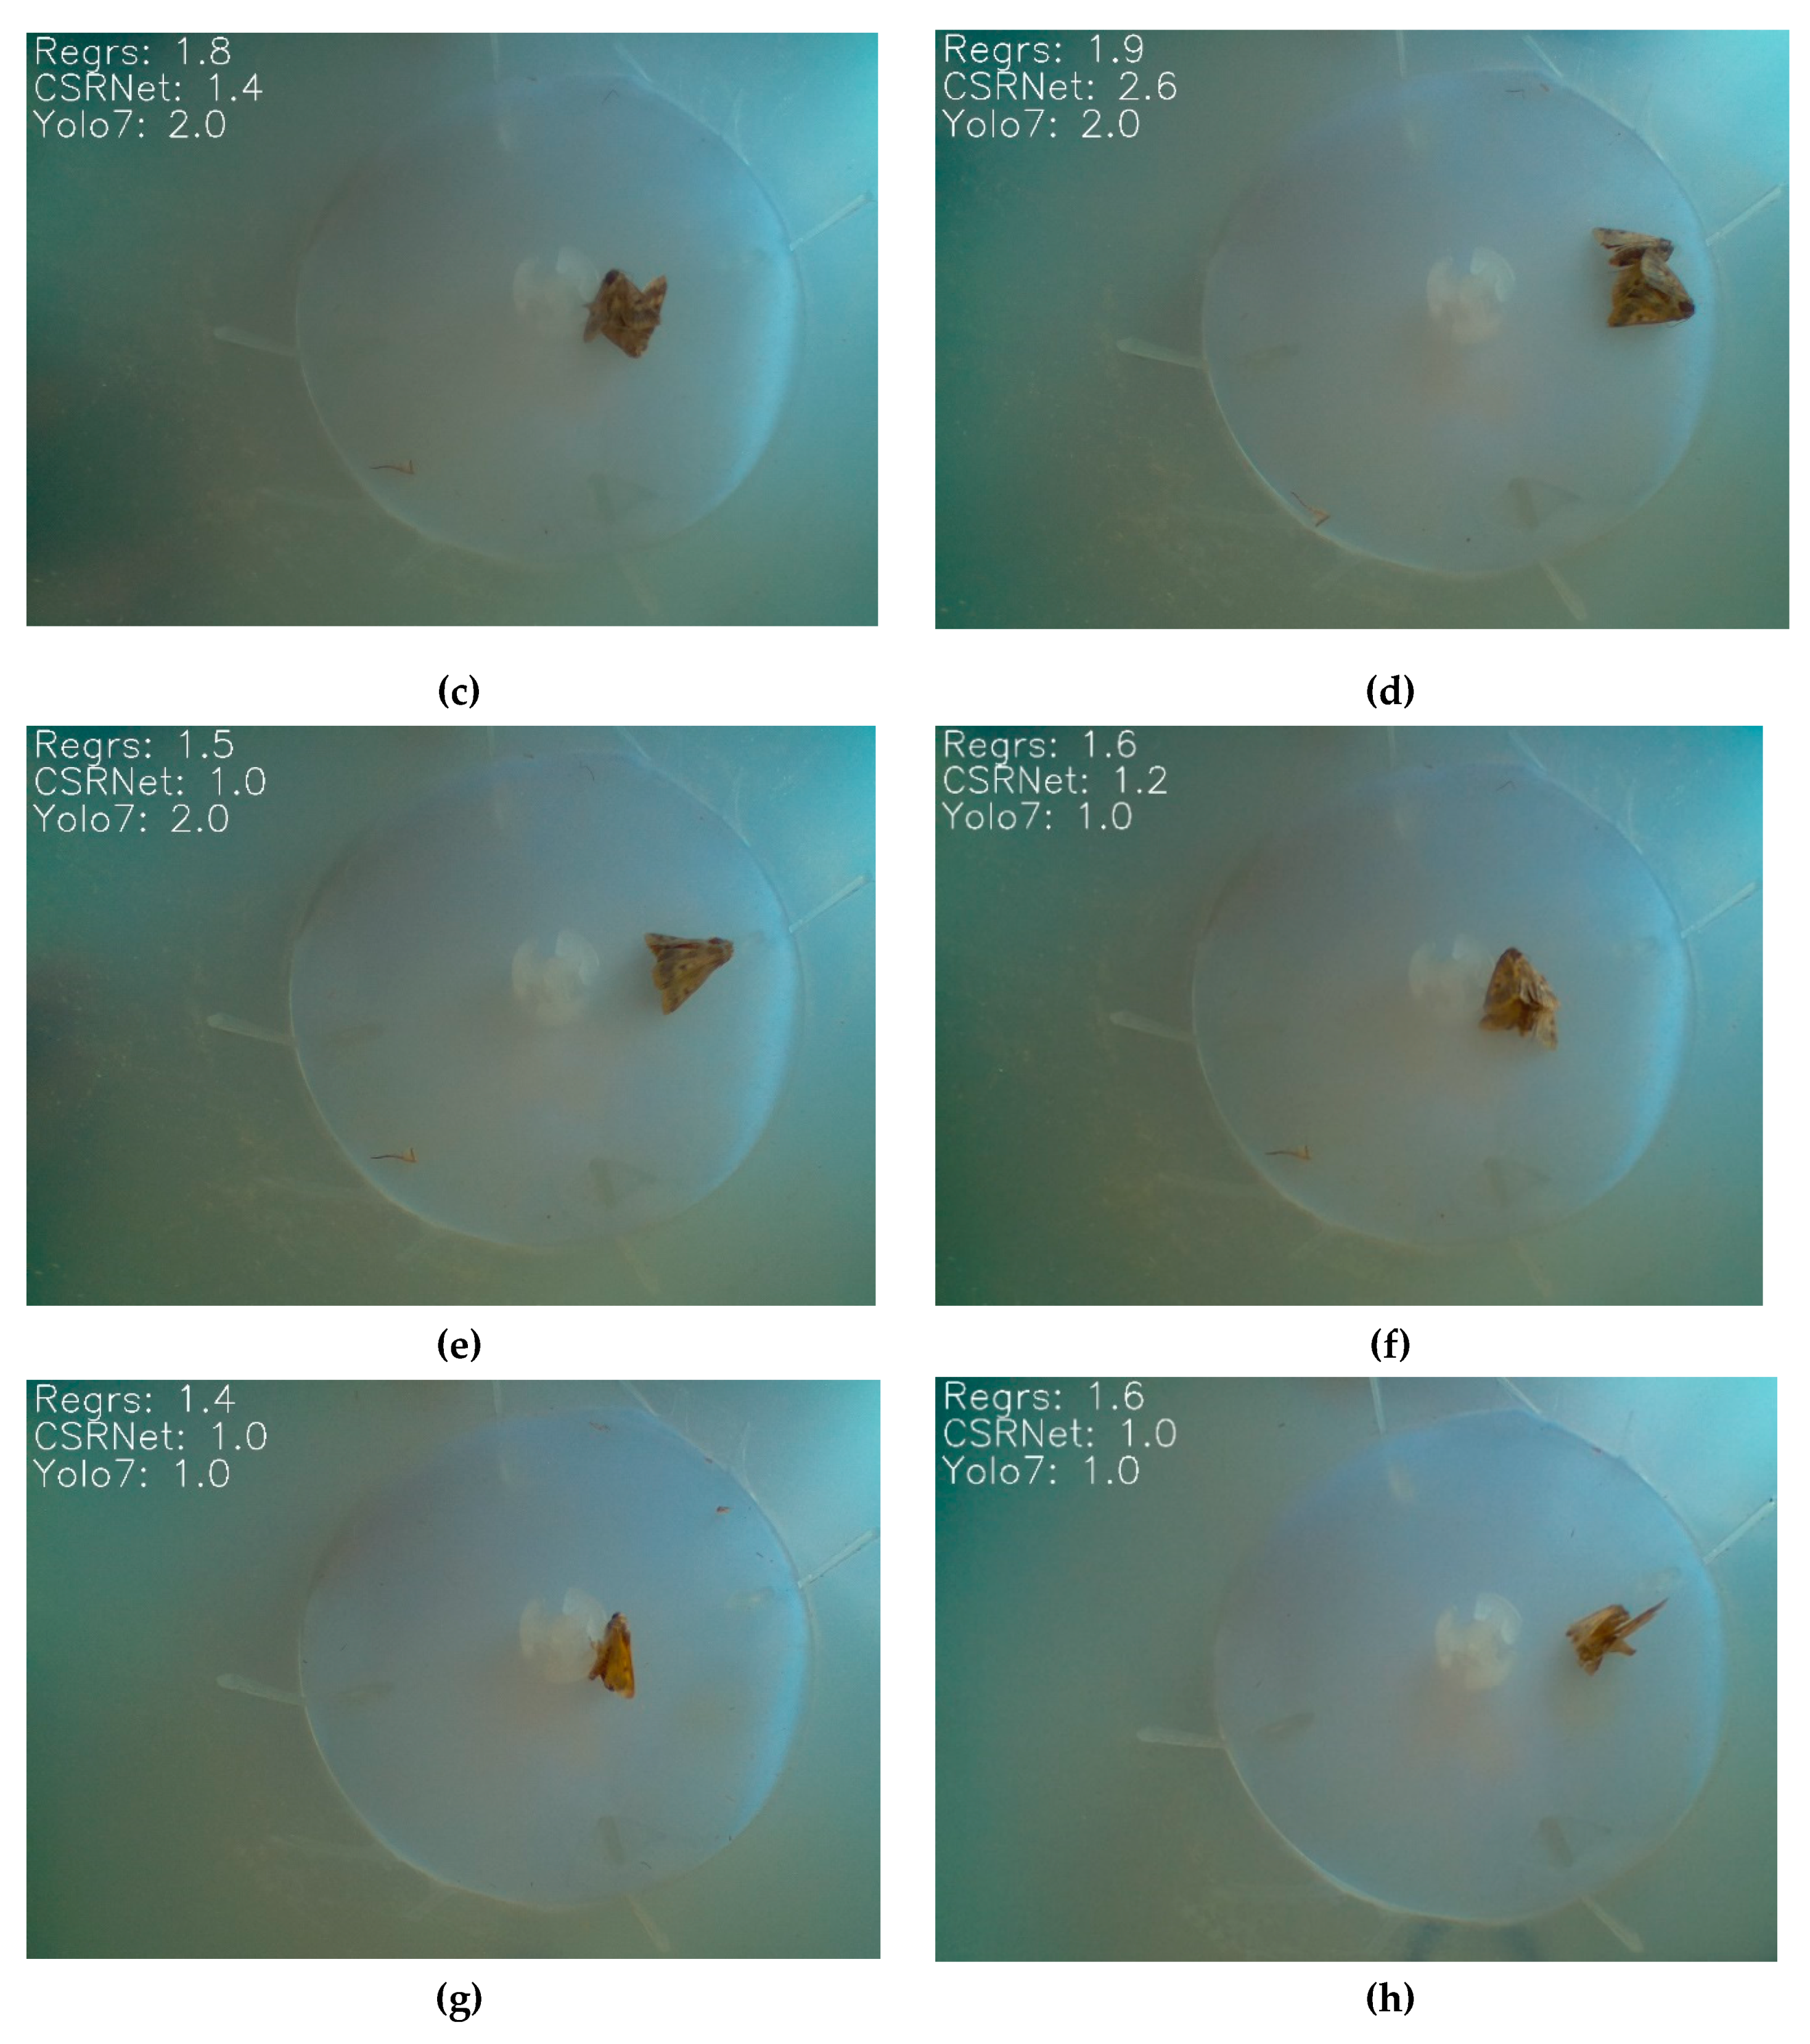
(D) We carry out a thorough study comparing three different DL approaches that can be embedded in edge devices with a view to find the most affordable ones in terms of cost and power consumption. In order for insect surveillance at large scales to become widely adopted, hardware costs must be reduced and the associated software must be made an open-source. Therefore, we open-source all the algorithms to make insect surveillance widespread and affordable for farmers. We present results for two important Lepidopteran pests, but our framework (that we open-source) can be applied to automatically count all captured Lepidoptera species with a commercially available pheromone attractant.

2. Materials and Methods

When working in the field with different crops, people rely on direct visual observation supported by accumulated experience to assess the occurrence and development of common insect pest infestations. Regular field trips by experts would be limited if one could obtain a picture of the interior of the bucket. Our goal is to replace the human eye, and this section presents the systems in detail: (a) the hardware setup to acquire, manage, and transmit data, (b) the software to handle acquired data, and (c) the interaction with a remote cloud-based platform through web services whose aim is to streamline, visualize, and store historical data.

2.1. The Hardware

2.1.1. Computational Platform and Camera

Deploying electronics in both harsh and remote environments presents its own set of challenges such as the achievement of robustness and power sufficiency. In our trap setting, the upper cup acts as an umbrella and prevents rain from entering the trap. A pheromone dispenser holder is attached to the cup. The funnel is an inverted plastic cone that makes it easy for the insects to get in while the narrow bottom makes it difficult for them to escape and queues the insects to the bucket. The semi-transparent bucket, which allows light to come in, is fastened to the funnel. The electronic part is attached to the upper part of the bucket (see Figure 1). It does not alter the shape and colors of the funnel trap, thus safeguarding its attractiveness. This is important so that all existing monitoring protocols for monitoring Lepidoptera using funnel traps are not changed. The assembled e-trap is portable and can be powered by two common embedded batteries. The device must be self-contained and easy to install, so we have printed a 3D torus that fits into the common funnel trap and contains the electronic board, protecting it from natural elements (see Figure 1 right). It consists of four main components, a Raspberry Pi platform (we report results on Pi Zero 2 W board and Pi4), a microSD card, a camera, and a communication modem. A microSD card serves as the hard drive on which the operating system programs and pictures are stored, as no images are transmitted outside the sensor nodes. The electronic part is powered through a 5 V mini-USB port. The image quality is limited by the quality of the lens, and we use a wide-angle fixed-focus lens that is set to the depth of the field range of the bucket. The camera is a 5-megapixel Raspberry Pi camera at a resolution of 1664 × 1232 pixels. We did not illuminate the scene with infrared light to reduce power consumption. We are targeting Lepidoptera, which are nocturnal insects, and we take a picture during midday so that the trapped insects in the bucket are neutralized by heat and light.

2.1.2. Self-Disposal Mechanism of Insects

E-traps must operate autonomously for a long time to justify their cost, with the result of the accumulation of many captured insects. During the peak of the infestation we observed a large number of trapped insects (30–70 per day). When the insects pile up, a camera-based device cannot count them reliably by having a photograph of the inside of the trap. The partial or complete occlusion of the insects’ shapes, the congregation of partially disintegrated insects, and the layers of insects in the bucket make it impossible for image processing algorithms to count them automatically in the long run. We modified a servomotor with an embedded metal gear MG996R. We removed the stop so that it can rotate the detached bottom of the bucket by 360 degrees. We employed a board mount Hall Effect magnetic sensor (TI DRV5023) and a magnet to stop the rotation of the motor at a certain point (i.e., its initial position after a complete rotation of the circular bottom). Its consumption is 250 mA max for 3 sec. For one rotation per day this entails the following mean consumption: (3/86400) ∗ 0.25 mA = 8.68 μA. In the Appendix A we offer the 3D printed parts and one can see a video of its operation at the following link: https://youtube.com/shorts/ymLjuv5F5vU(accessed on 26 April 2023). We chose this way to rotate the bucket’s floor among other axes of rotation (e.g., along the diameter of the base), so that the rims of the bucket sweep the surface bottom clean of any insects remains upon turning so that they do not affect a subsequent image. The automated procedure of counting and reporting insects can be reliably cross-validated when needed as the captured insects can be manually counted while in the bucket until they are disposed of via the servomotor.

2.1.3. Power Consumption

In terms of power consumption, we need to achieve autonomous operation that exceeds the duration of the pheromone, and it is more practical to avoid bulky external batteries or a solar panel. If the device is energy efficient, a long-term estimate of the population trend is possible to be implemented. We deactivated all components that are not needed for our application.

2.1.4. Cost

At the time of writing, the total cost of building one functional unit is less than EUR 50 for the restricted version (as per 23 February 2023, see Appendix A.3). The need for more spatial detail in insect counting in the field entails the placement of additional nodes, whereas temporal detail relies on power sufficiency for continuous operation in time without recharging. The cost per e-trap is important as it is a limiting factor in terms of the number of nodes that can be deployed practically simultaneously and thus affects community acceptance. Therefore, cost inserts design constraints in the implementation of automatic monitoring solutions.

2.2. The Datasets

Open-source images from insect biodiversity databases usually contain high-quality collections and, in our opinion, are not suitable for training devices operating in the field. DL classification and regression algorithms perform best when the training data distribution matches the test distribution in operational conditions. We focus on agricultural pests that are selectively attracted by pheromones. Therefore, except for the rare cases where a non-targeted insect has accidentally entered, the bucket contains the targeted insects and/or debris. The advantage of approaching automatic monitoring through counting a bucket that contains insects attracted by species-specific pheromones is that a number is uniquely and universally accepted, whereas the fact that insect biodiversity varies considerably around the globe makes the construction of a universal species identifier much harder. Our deep learning networks are trained entirely on synthetic data but tested on real cases. We emphasize that the test set is not ‘synthetic’. By the term ‘synthetic data’ we mean that a number of real insects have been photographed in a bucket, but a python program extracts their photos and rearranges them in a random configuration generating a large number of synthetic images to train the counting algorithms. We then evaluate the degree of efficient counting of real cases of insects in a bucket in the presence of partial or total occlusion, debris, and partial disintegration of the insects.

2.2.1. Constructing the Database

First, we collect insect pests from the field with typical funnel traps and subsequently eliminate them by freezing. Then we carefully position each insect at a pre-selected, marked spot in the e-funnel’s bucket. The angle does not matter as we will rotate the extracted picture later, but we make sure that either the hind wings or the abdomen is facing the camera. Then we take a picture of the single specimen using the embedded camera that is activated manually by an external button. We take one picture per insect (see Figure 2, left) and make sure that the training set contains different individuals from the test set. Since we place the insect at a certain spot in the bucket we can automatically extract from its picture a square containing the insect with almost absolute accuracy as we know its location beforehand (see Figure 2, bottom). Alternatively, we could perform blob detection and automatically extract the contour of the insect. However, we have found experimentally that the first approach is more precise in the presence of shadows. We then remove the background using the python library Rembg (https://github.com/danielgatis/rembg (accessed on 29 April 2023), which is based on a UNet (see Figure 2, bottom). This creates a subpicture that follows the contour of the insect exactly. Once we have the pictures of the insects, we can proceed with composing the training corpus for all algorithms. A python program selects randomly a picture of an empty bucket that can only contain debris, which serves as the background canvas for the synthesis that places the extracted insect subpictures in random locations by sampling them uniformly through 360 degrees and a radius matching the radius of the bucket (the bottom of the bucket is circular). Besides their random placement, the orientation of each specimen is also randomly chosen between 0 and 360 degrees before placement, and a uniformly random zoom of ±10% of its size is also applied. The number of insects is randomly chosen from a uniform probability distribution between 0 and 60 for H. armigera and 0 and 110 for P. interpunctella. We have chosen the upper limit of the distribution by noting that with more than 50 individuals of H. armigera, the layering process of insects starts, and image counting becomes by default problematic. Note that, since the e-trap self-disposes of the captured insects there is no problem in setting an upper limit other than the power consumption of the rotation process. The upper limit for P. interpunctella is larger because this insect is very small compared to H. armigera and layering, in this case, begins after 100 specimens. Since the program controls the number of insects used to synthesize a picture, it also has their locations and their bounding boxes, and, therefore, can provide the annotated text (i.e., the label) for supervised DL regressor counters as well as localization algorithms (i.e., YOLOv7) and crowd counting approaches. The original 1664 × 1232 pixels picture is resized to a resolution of 480 × 320 pixels for YOLO and crowd counting methods to achieve the lowest possible power consumption and storage needs, while not affecting the ability of the algorithms to count insects. We synthesized a corpus of 10,000 pictures for training and 500 for validation. Starting from the original pictures, it takes about 1 sec to create and fully label (counts and bounding boxes) a synthesized picture. The advantage of our approach is obvious when one compares this to the time for manual labeling of insects in pictures.

2.2.2. Test Set Composition

In this work, we test our approach in two important pests namely the cotton bollworm (Helicoverpa armigera) a pest of corn, cotton, tomato, and soybean (among others), and the Indian-meal moth (Plodia interpunctella), a stored-products pest (see Figure 3). We needed to test our approach using a large butterfly such as H. armigera and a small one such as P. interpunctella.
However, our procedure is generic and by following the steps in Section 2.2.1 and the code in Appendix A, one can make an automatic counter for any species around the globe that can be attracted by a funnel trap with a pheromone. The test set consists of three different subsets and is composed in a way that allows us to examine difficult cases that are underrepresented in the literature, such as a significant amount of real debris collected from funnel traps in the field and body–wings occlusion. The H. armigera subset is composed of pictures of specimens 16–22 mm long with a wingspan of 30–45 mm, and we test all algorithms with folders containing 10 to 20 insects with increments of 1. This test set was created by placing a certain number of insect individuals (adult moths) in the bucket and shaking the bucket so that each picture has a random configuration of the insects without being prone to counting errors (because we know a priori how many we have inserted, and the shaking relocates the insects without changing their number). For each relocation, a picture is taken, and the process is repeated according to Table 1. Folders ‘10–100’ contain scenes with the corresponding number of insects after random shuffling. The actual number was obtained by gradually inserting, one by one, the insects constructing the test set so that we have full control over its composition. In the case of H. armigera, we did not insert 100 individuals because after 50 they start forming layers of insects and their correct number is irretrievable by a simple picture. The second test subset uses P. interpunctella, which is a small moth with a length of 5–8.5 mm and a wingspan of 13–20 mm. We focused on cases of pictures with up to 20, 50, and 100 insects (see in Figure 4 the data composition).
The third and final subset of the test set that we name ‘overlap folder’ has 20 cases of progressively partial to total occlusion of 2 insects in various positions and orientations. The last subset aims to study to what extent various algorithms are prone to error when overlapping occurs.

2.3. The Counting Algorithms

2.3.1. The Approaches and Their Parameters

In the context of object detection in monitoring of agricultural pests, the goal of insect counting is to count the number of captured insects in a single image taken from inside the trap. This is a regression task. All the approaches we tried are based on DL, since insects can be viewed as deformable templates (they possess antennae, legs, abdomen, and wings that orient themselves at various angles and can also become deformed). Other measures of pattern similarity will not be applied efficiently to this problem, whereas DL excels at classifying deformable objects. We are interested in DL architectures that are embeddable in edge platforms where regression takes place (and not on the server). Embedding implies restrictions mainly on the size of the model that may lead to pruning of architectures, thus limiting their efficacy, but also on power consumption and time requirements for execution. DL includes various convolutional and pooling (subsampling) layers that resemble the visual system of mammals. In the context of our work, the input layer receives a picture of the bottom of the bucket that is progressively abstracted to features associated with the shape and texture of the insect. The output layer is a single neuron that outputs an estimate of the number of the insects in the case of the supervised regressor, or the coordinates of rectangular bounding boxes in the case of object detection algorithms, or a 2D heatmap in the crowd counting approach. In this work, we compare three different strategies: (A) The first approach is counting by DL regression. This method takes the entire image as input, passes it to a resnet18 from which we have substituted the classification layer with two layers ending in a linear one to perform regression. Therefore, it outputs a single number of insect counts without generating bounding boxes or identifying species in the process. Models of this kind are lighter than the other methods and embeddable to microprocessors (see [27]). The training of the network is performed in forward and backward stages based on the prediction output and the labeled ground-truth as provided by the image synthesis stage. In the backpropagation stage, the gradient of each parameter is computed based on a mean square error loss cost. Network learning can be stopped after sufficient iterations of forward and backward stages. (B) Crowd counting approaches are based on deriving the density of objects and mapping it to counts by integrating the heatmap during the learning process (i.e., they do not treat it as a detection task). The problem of counting a large number of animates arises mainly in crowd monitoring applications of surveillance systems [40,41,42]. It has also appeared to a lesser extent in wildlife images [43] and rarely in insects [24]. We used a well-established crowd counting method, namely, the CSRNet model [41]. In our version, CSRNet uses a fixed-size density map because all targets of the same species are nearly of comparable size. We did not initialize front-end layers and used ADAM as optimizer to make the training faster. The loss function is the mean square error for the count variable. For CSRNet, we used Raspberry 4 because we had to prune it considerably to be able to run it at Rpi0. However, pruning significantly affected its accuracy. (C) The third approach is based on the general object detector YOLO, which applies a moving window to the image and identifies the detected objects (insects, in our case). In this process, the total count is determined by the number of the final bounding boxes. The loss function is based on assessing the misplacement of the bounding boxes [44,45].
To sum up, all models have been developed using the PyTorch framework. All DL architectures running on Raspberry 4 are in PyTorch and are not quantized. All models that have been able to execute to Raspberry Zero have been transformed to TFLite. The architecture follows the ONNX framework that finally concludes to TFLite. All TFLite models are not quantized except for CSRNet. The parameters of the models can be found in Table 2.

2.3.2. Data Analysis

The test dataset is based on real data (see Section 2.2.2), with emphasis on crowded situations and without annotation boxes. To evaluate the performance of our test dataset, we compared the predicted count of all algorithms with the actual count (see Table 1).
The accuracy was calculated as in (1) for actual counts different than zero:
pa = [1 − |pcac|/|ac|]
where pa is the accuracy (%), pc is the predicted count, and ac is the actual count.
For evaluating the cases of zero counts we apply (2):
pa = 1 − |pcac|
We also report the mean absolute error (MAE): MAE in (3) measures the average magnitude of the errors in a set of predictions. It is the average over the test corpus of the absolute differences between prediction y ^ j and actual observation y j where all individual differences have equal weight.
M A E = 1 n j = 1 n | y j y ^ j |

2.4. The Edge Devices

We need to push our designs to the lowest platforms that can accommodate deep learning algorithms and run all approaches on the same platform so that they can be comparable. We have not been able to use the simplest hardware platforms ESP32, mainly because of the size of the models. The Raspberry Zero 2 W was the next candidate because it has a very low consumption (100 mA IDLE up to 230 mA max). However, computationally demanding approaches such as CSRNet could not be embedded and therefore we resorted to Raspberry Pi4. All algorithms are accommodated in Raspberry 4 in PyTorch environment. The Raspberry Pi4 has a higher consumption (575 mA IDLE up to 640 mA max). We present additional results with Raspberry Pi Zero 2 W whenever possible. To make this option as light as possible we installed only OpenCV and TFLite Runtime, and the graphs of the architectures have been transformed to TFLite.
Speed of execution is something we are willing to sacrifice because in the field we have to classify one picture per day. Each edge device is equipped with a camera and Wi-Fi communication. Camera quality is a significant factor for camera-based traps. In our case, however, the task is to count the insects, which is an easier task than identifying species or locating objects, which depend heavily on the quality of the image and allows us to choose a more cost-effective solution to reduce the cost. The device carries out the following tasks: (a) It wakes up by following a pre-stored schedule and loads the DL model weights. (b) It takes a picture once a day without flash. (c) It determines the number of insects in the picture, stores the picture in the SD card, and transmits the counts and other environmental variables to and receives commands from the server. (d) It enters into a deep sleep mode and performs steps (a)–(d) for each subsequent day throughout the monitoring period.
Figure 5 shows examples of the different approaches to tagging pictures from inside the funnel. Regrs (Figure 5a) denotes predicting the number of insects directly from a picture. YOLOv7 (Figure 5b), provides bounding boxes around the insects and the count is always an integer that corresponds to the number of boxes. CSRNet (Figure 5c) provides a 2D heatmap that, once summed over its values, provides the final prediction of the crowd-based method.

3. Results

3.1. Error Metrics

Note that there are two insect species, one fairly large (H. armigera) and one small (P. interpunctella). The large insect can demonstrate a wingspan that leads often to partial overlap. Moreover, after about 50 individuals, the members of this species start to form layers, and individual insects may not be further visible. The small insects do not overlap that easily and more than 100 of them can be in the bucket without forming layers. However, small insects tend to form compact groups where individuality may not be discerned. The test set is organized in two subsets: low number and high number of insects. This is deliberate, otherwise errors in high numbers (e.g., around 100) will dominate the total error and will not give a correct idea of the accuracy of the system. Results are organized in Table 3, Table 4, Table 5, Table 6, Table 7, Table 8, Table 9 and Table 10. The main approach relies on Raspberry Pi4 (Table 3, Table 4, Table 5 and Table 6) that can accommodate all approaches. We also present some results for Raspberry Zero 2 W (Table 7, Table 8, Table 9 and Table 10) for the models that can function using such a small platform. Time (ms) in all tables refers to the time needed for processing a single image.
It is evident from the tables that there does not exist a single optimal architecture for all cases. For large number of insects, crowd counting methods show an advantage because they are made for counting in congestive scenes. They do not count individuals one by one, but they form density maps that add up to the total sum. However, they are computationally heavy models and far slower than any other architecture (see, e.g., Table 4 and Table 10). The deep regression models may work surprisingly well for a small number of insects in the bucket (i.e., <10) (see Table 3) but this success does not escalate to numbers of the order of 80–100 individuals (see Table 4 and Table 6). This is evident in the case of small insects where this approach collapses (Table 10). YOLOv7/8 demonstrates a stable efficacy in low and high numbers of insects (see Table 3, Table 4, Table 5 and Table 6) but struggles in the case of significant occlusion (see Section 3.2). All architectures are sensitive to shadow and illumination variation. In Section 4, we tally the pros and cons of each approach and we suggest the best solution.
Raspberry Pi4, PyTorch, Low number of insects (0 to 20)
H. armigera
Table 3. Testing on a non-synthesized corpus of pictures containing 0–20 H. armigera. In the case of a few large insects, counting by regression, which is far simpler, performs best followed by the YOLO approach. The best performing model in bold.
Model NamepaMAETime (ms)
Yolov7_Helicoverpal CONF 0.3 IOU 0.50.694.71535.4
Yolov8_Helicoverpal CONF 0.3 IOU 0.40.724.08615.9
CSRNet_Helicoverpa_HVGA0.714.126327.1
Count_Regression_Helicoverpa_resnet180.782.89381.5
Count_Regression_Helicoverpa_resnet500.694.35699.5
P. interpunctella
Table 4. Testing on a non-synthesized corpus of pictures containing 0–20 P. interpunctella. In the case of a few small insects, crowd counting performs best followed by the YOLO approach.
Model NamepaMAETime (ms)
Yolov7 CONF 0.3 IOU 0.80.613.00548.4
Yolov8 CONF 0.3 IOU 0.850.514.07604.3
CSRNet_HVGA0.632.276229.0
Count_Regression_resnet180.338.19374.4
Count_Regression_resnet500.485.12699.2
Raspberry Pi4, high number of insects (50 to 100).
H. Armigera
Table 5. Testing on a non-synthesized corpus of pictures containing 50 and 100 H. Armigera. In the case of many large insects, crowd counting performs best, followed by the YOLO approach.
Model NamepaMAETime (ms)
Yolov8 CONF 03 IOU 0.40.7720.39624.3
CSRNet_HVGA0.886.036312.9
Count_Regression_resnet180.3731.29381.5
Count_Regression_resnet500.7213.82717.2
P. interpunctella
Table 6. Testing on a non-synthesized corpus of pictures containing 50 and 100 P. interpunctella specimens. In the case of many small insects, the YOLO approach performed best followed by crowd counting methods. Note that counting by regression collapses.
Model NamepaMAETime (ms)
Yolov7 CONF 0.3 IOU 0.80.879.83543.3
Yolov8 CONF 0.3 IOU 0.850.6926.52659.8
CSRNet _HVGA0.7621.266300.9
Count_Regression_resnet180.2761.59380.4
Count_Regression_resnet500.3655.56698.2
Raspberry Zero 2w with TFLite framework, low number of insects (0 to 20).
H. Armigera
Table 7. Testing on a non-synthesized corpus of pictures containing 0–20 H. Armigera. In the case of a few large insects, counting by regression, which is far simpler, performs best followed by the YOLO approach.
Model NamepaMAETime (ms)
Yolov7 CONF 0.3 IOU 0.40.655.4232,540.3
CSRNet _HVGA quantized0.3210.1828,337.9
Count_Regression_resnet180.782.891682.6
Count_Regression_resnet500.694.353201.8
P. interpunctella
Table 8. Testing on a non-synthesized corpus of pictures containing 0–20 P. interpunctella. In the case of a few small insects, crowd counting performs best, followed by the YOLO approach.
Model NamepaMAETime (ms)
Yolov7 CONF 0.3 IOU 0.80.583.643183.8
CSRNet_HVGA_medium0.573.727257.0
CSRNet_HVGA quantized0.642.4228,520.0
Count_Regression_resnet180.338.191674.5
Count_Regression_resnet500.485.123139.8
Raspberry Zero 2w with TFLite framework, High number of insects (50 to 100)
H. Armigera
Table 9. Testing on a non-synthesized corpus of pictures containing 50 and 100 H. Armigera. In the case of many large insects, counting by regression performs best.
Model NamepaMAETime (ms)
Yolov7 CONF 0.3 IOU 0.40.2338.203256.5
CSRNet_HVGA quantized0.2736.4628,339.3
Count_Regression_resnet180.3731.291676.6
Count_Regression_resnet500.7213.823161.4
P. interpunctella
Table 10. Testing on a non-synthesized corpus of pictures containing 50 and 100 P. interpunctella specimens. In the case of many small insects, the YOLO approach performs best followed by crowd counting methods. Note that counting by regression collapses.
Model NamepaMAETime (ms)
Yolov7 CONF 0.3 IOU 0.80.8412.303226.1
CSRNet_HVGA_medium0.6232.627257.7
CSRNet_HVGA quantized0.8810.2428442.0
Count_Regression_resnet180.2761.591757.1
Count_Regression_resnet500.3655.563446.7

3.2. Counting on the ‘Overlap’ Folder

We are very interested in studying to what extent the DL algorithms can disambiguate the overlapping situation of insects, as this is very common in e-traps in the field and the most common source of error in automatic counting. In Figure 6, we present example cases of all approaches on an overlap corpus with various degrees of overlap and occlusion. All pictures in Figure 6 contain exactly two specimens. The first row contains no overlap at all. The second row depicts cases with a partial overlap of about 25%. In the third row, the overlap is 75%, and in the fourth row, there is an almost complete overlap where only tiny details of the two individuals can be seen. Surprisingly, the most robust method in heavy overlap cases is the simple regression approach. Detection-based solutions such as YOLOv7–YOLOv8 localize all instances of the insect in question and provide the number of such detections, whereas crowd-based techniques overlay a confidence map over the image. These methods offer better interpretability, but they struggle with images that overlap (this is explicitly mentioned in [46] and we confirm it in our case as well). In Figure 7 we see the gradual collapse of counting in terms of the percentage of overlap by the three different approaches. In Table 11 we quantify these results in terms of error metrics.

4. Discussion

The database is constructed in a way that allows studying congestive scenes. In these cases, if the insects are large, their wings inevitably overlap and can create occluded scenes. Large insects have a clearer contour, though. If they are small, they form compact constellations, but generally they do not overlap much.
In small populations, all counting approaches are adequate enough. We investigated crowd-based approaches with a view to counting difficult cases with large numbers of congested insects inside the bucket of a typical entomological trap. In cases with a large number of insects (i.e., >50) crowd counting demonstrated a distinct advantage over all approaches. However, all versions of it are very computationally intensive and by far the slowest in execution. These facts together with the introduction of a novel functionality, the daily self-disposal of captured insects, make the crowd-based approach an inferior choice. Predicting counts by a Resnet18 (i.e., the Regression approach) is very robust to overlap cases of few insects and if it does not outperform YOLOv7/8 in such cases, it is very competitive. In all other cases, however, it returns inferior results compared to YOLOv7/8 and completely collapses for a large number of insects. By integrating all the results and taking into account that we will never reach a large concentration of insects in the e-trap due to the self-disposal of captures, we suggest that straight DL regression from image to numbers and the YOLO framework are the best choices for counting, although for cases with a very small number of insects (e.g., in sticky traps for urban arthropods in smart homes) direct regression may be an adequate solution with lower computational needs. Regression collapses for large number of insects. Finally, if one could pick one suggestion, this would be YOLOv7/8.

5. Conclusions

Field work is time-consuming, expensive, and always leads to delays in the decision-making process. Automatic insect counting can be used to assess the impact of a treatment in almost real time and can expand at large spatial scales. Knowing the onset of an infestation, its progress, and the response to a treatment helps farmers to make better decisions on cultivation practices and pest infestation prevention, and to achieve better crop yield. E-traps for agricultural pests that use optical counters rely on the specificity of the pheromone to attract only the desired pest. Camera traps offer a convenient replacement to human insect counting and can deliver insect counts many times per day (although we advocate that once a day is enough), directly from the field without human intervention. We note that vision-based traps are completely immune to audio interference as they do not use microphones. They are also unaffected by wind and rain, as they are protected by the top of the funnel, and the detached floor of the trap’s bucket drains possible raindrops. E-traps based on edge technology (i.e., running the deep learning classifiers in the device instead of uploading the image) are absolutely feasible. The key to their adoption as a standard means of monitoring is to lower their price while keeping them highly accurate. In this work, we aim to overcome some important technical limitations of vision-based systems, namely manual annotation and insect congestion in the bucket. The counting is based on the combination of image processing and DL networks embedded in edge devices. We found that in the case of a small number of insects, in the bucket DL regression straight from pictures to counts deserves merit as it is simple, resolves adequately the overlapping cases, and requires low resources. The YOLO is more stable for both small and large numbers of insects and, therefore, more generally applicable.

Author Contributions

Conceptualization, I.S. and I.P.; methodology, I.P.; formal analysis, S.N.; resources, I.R.; writing—original draft preparation, A.I.K.; writing—review and editing, P.E.; supervision, P.E.; project administration, A.I.K. All authors have read and agreed to the published version of the manuscript.

Funding

This research received no external funding.

Data Availability Statement

All data used in this paper can be found at https://github.com/Gsarant/Image-based-insect-counting-embedded-in-e-traps (accessed on 29 April 2023).

Conflicts of Interest

The authors declare no conflict of interest.

Appendix A

Appendix A.1

Figure A1. The servomotor housing. 3D printer files of the STP format can be found at: https://github.com/Gsarant/Image-based-insect-counting-embedded-in-e-traps (accessed on 7 March 2023).
Information 14 00267 g0a1

Appendix A.2

Full code including demos can be found at: https://github.com/Gsarant/Image-based-insect-counting-embedded-in-e-traps (accessed on 7 March 2023) in the corresponding folders.
VIDEO: www.youtube.com/shorts/ymLjuv5F5vU (accessed on 7 March 2023).

Appendix A.3

Cost calculation: Raspberry Pi Zero 2 W (EUR 15), Raspberry Pi 4 (EUR 72), Raspberry Pi Zero Camera Module 160° variable focus (EUR 18.50), funnel trap (EUR 7), servomotor (EUR 9.5), magnetic sensor TI DRV5023 (EUR 0.85), various plastic components (EUR 2) (indicative prices as of 28 February 2023).

References

  1. Sharma, S.; Kooner, R.; Arora, R. Insect pests and crop losses. In Breeding Insect Resistant Crops for Sustainable Agriculture; Springer: Singapore, 2017; pp. 45–66. [Google Scholar]
  2. Lees, D.; Zilli, A. Moths: Their Biology, Diversity and Evolution; Natural History Museum: London, UK, 2019. [Google Scholar]
  3. Wagner, D.L. Moths, in Encyclopedia of Biodiversity, 2nd ed.; Levin, S.A., Ed.; Academic Press: Cambridge, MA, USA, 2013; pp. 384–403. [Google Scholar] [CrossRef]
  4. Perveen, F.K.; Khan, A. Introductory Chapter: Moths. In Moths-Pests of Potato, Maize and Sugar Beet; IntechOpen: London, UK, 2018. [Google Scholar]
  5. Singh, N.; Dotasara, S.K.; Jat, S.M.; Naqvi, A.R. Assessment of crop losses due to tomato fruit borer, Helicoverpa armigera in tomato. J. Entomol. Zool. Stud. 2017, 5, 595–597. [Google Scholar]
  6. Sousa, N.C.M.; Michereff-Filho, M.; Moita, A.W.; Silva, K.F.A.D.S.; Silva, P.A.; Torres, J. Economic survey to support control decision for old world bollworm on processing tomatoes. Sci. Agricola 2021, 78, e20190280. [Google Scholar] [CrossRef]
  7. Schwartz, P.H. Losses in Yield of Cotton Due to Insects. In Cotton Insect Management with Special Reference to the Boll Weevil; Ridgway, R.L., Lloyd, E.P., Cross, W.H., Eds.; Agricultural Handbook 589; USDA: Washington, DC, USA, 1983. [Google Scholar]
  8. Rwomushana, I.; Beale, T.; Chipabika, G.; Day, R.; Gonzalez-Moreno, P.; Lamontagne-Godwin, J.; Makale, F.; Pratt, C.; Tambo, J. (2019) Evidence Note. Tomato leafminer (Tuta absoluta): Impacts and coping strategies for Africa. CABI Working Paper 12, 2019; 56. [Google Scholar] [CrossRef]
  9. Higley, L.G.; Peterson, R.K.; Radcliffe, E.B.; Hutchison, W.D.; Cancelado, R.E. Economic decision rules for IPM. In Integrated Pest Management: Concepts, Tactics, Strategies and Case Studies; Radcliffe, E.B., Hutchison, W.D., Cancelado, R.E., Eds.; Cambridge University Press: New York, NY, USA, 2009; pp. 25–32. [Google Scholar]
  10. Nyambo, B.T. Assessment of pheromone traps for monitoring and early warning of Heliothis armigera Hübner (Lepidoptera, Noctuidae) in the western cotton-growing areas of Tanzania. Crop. Prot. 1989, 8, 188–192. [Google Scholar] [CrossRef]
  11. Preti, M.; Verheggen, F.; Angeli, S. Insect pest monitoring with camera-equipped traps: Strengths and limitations. J. Pest Sci. 2021, 94, 203–217. [Google Scholar] [CrossRef]
  12. Lima, M.C.F.; Leandro, M.E.D.d.A.; Valero, C.; Coronel, L.C.P.; Bazzo, C.O.G. Automatic Detection and Monitoring of Insect Pests—A Review. Agriculture 2020, 10, 161. [Google Scholar] [CrossRef]
  13. Suto, J. Codling Moth Monitoring with Camera-Equipped Automated Traps: A Review. Agriculture 2022, 12, 1721. [Google Scholar] [CrossRef]
  14. Høye, T.T.; Ärje, J.; Bjerge, K.; Hansen, O.L.P.; Iosifidis, A.; Leese, F.; Mann, H.M.R.; Meissner, K.; Melvad, C.; Raitoharju, J. Deep learning and computer vision will transform entomology. Proc. Natl. Acad. Sci. USA 2021, 118, e2002545117. [Google Scholar] [CrossRef]
  15. Bjerge, K.; Nielsen, J.B.; Sepstrup, M.V.; Helsing-Nielsen, F.; Høye, T.T. An Automated Light Trap to Monitor Moths (Lepidoptera) Using Computer Vision-Based Tracking and Deep Learning. Sensors 2021, 21, 343. [Google Scholar] [CrossRef]
  16. Geissmann, Q.; Abram, P.K.; Wu, D.; Haney, C.H.; Carrillo, J. Sticky Pi is a high-frequency smart trap that enables the study of insect circadian activity under natural conditions. PLoS Biol. 2022, 20, e3001689. [Google Scholar] [CrossRef]
  17. Droissart, V.; Azandi, L.; Onguene, E.R.; Savignac, M.; Smith, T.B.; Deblauwe, V. PICT: A low-cost, modular, open-source camera trap system to study plant–insect interactions. Methods Ecol. Evol. 2021, 12, 1389–1396. [Google Scholar] [CrossRef]
  18. Klasen, M.; Ahrens, D.; Eberle, J.; Steinhage, V. Image-Based Automated Species Identification: Can Virtual Data Augmentation Overcome Problems of Insufficient Sampling? Syst. Biol. 2022, 71, 320–333. [Google Scholar] [CrossRef] [PubMed]
  19. Guarnieri, A.; Maini, S.; Molari, G.; Rondelli, V. Automatic trap for moth detection in integrated pest management. Bull. Insectol. 2011, 64, 247–251. [Google Scholar]
  20. Reynolds, J.; Williams, E.; Martin, D.; Readling, C.; Ahmmed, P.; Huseth, A.; Bozkurt, A. A Multimodal Sensing Platform for Interdisciplinary Research in Agrarian Environments. Sensors 2022, 22, 5582. [Google Scholar] [CrossRef] [PubMed]
  21. Hong, S.-J.; Kim, S.-Y.; Kim, E.; Lee, C.-H.; Lee, J.-S.; Lee, D.-S.; Bang, J.; Kim, G. Moth Detection from Pheromone Trap Images Using Deep Learning Object Detectors. Agriculture 2020, 10, 170. [Google Scholar] [CrossRef]
  22. Ding, W.; Taylor, G. Automatic moth detection from trap images for pest management. Comput. Electron. Agric. 2016, 123, 17–28. [Google Scholar] [CrossRef]
  23. Kaya, Y.; Kayci, L. Application of artificial neural network for automatic detection of butterfly species using color and texture features. Vis. Comput. 2014, 30, 71–79. [Google Scholar] [CrossRef]
  24. Patel, S.; Kulkarni, A.; Mukhopadhyay, A.; Gujar, K.; de Roode, J. Using Deep Learning to Count Monarch Butterflies in Dense Clusters. bioRxiv 2021. [Google Scholar] [CrossRef]
  25. Rigakis, I.I.; Varikou, K.N.; Nikolakakis, A.E.; Skarakis, Z.D.; Tatlas, N.A.; Potamitis, I.G. The e-funnel trap: Automatic monitoring of lepidoptera; a case study of tomato leaf miner. Comput. Electron. Agric. 2021, 185, 106154. [Google Scholar] [CrossRef]
  26. Welsh, T.J.; Bentall, D.; Kwon, C.; Mas, F. Automated Surveillance of Lepidopteran Pests with Smart Optoelectronic Sensor Traps. Sustainability 2022, 14, 9577. [Google Scholar] [CrossRef]
  27. Saradopoulos, I.; Potamitis, I.; Ntalampiras, S.; Konstantaras, A.I.; Antonidakis, E.N. Edge Computing for Vision-Based, Urban-Insects Traps in the Context of Smart Cities. Sensors 2022, 22, 2006. [Google Scholar] [CrossRef]
  28. Hong, S.-J.; Nam, I.; Kim, S.-Y.; Kim, E.; Lee, C.-H.; Ahn, S.; Park, I.-K.; Kim, G. Automatic Pest Counting from Pheromone Trap Images Using Deep Learning Object Detectors for Matsucoccus thunbergianae Monitoring. Insects 2021, 12, 342. [Google Scholar] [CrossRef] [PubMed]
  29. Zhong, Y.; Gao, J.; Lei, Q.; Zhou, Y. A Vision-Based Counting and Recognition System for Flying Insects in Intelligent Agriculture. Sensors 2018, 18, 1489. [Google Scholar] [CrossRef] [PubMed]
  30. Kalamatianos, R.; Karydis, I.; Doukakis, D.; Avlonitis, M. DIRT: The Dacus Image Recognition Toolkit. J. Imaging 2018, 4, 129. [Google Scholar] [CrossRef]
  31. Xia, D.; Chen, P.; Wang, B.; Zhang, J.; Xie, C. Insect Detection and Classification Based on an Improved Convolutional Neural Network. Sensors 2018, 18, 4169. [Google Scholar] [CrossRef] [PubMed]
  32. Doitsidis, L.; Fouskitakis, G.N.; Varikou, K.N.; Rigakis, I.I.; Chatzichristofis, S.A.; Papafilippaki, A.K.; Birouraki, A.E. Remote monitoring of the Bactrocera oleae (Gmelin) (Diptera: Tephritidae) population using an automated McPhail trap. Comput. Electron. Agric. 2017, 137, 69–78. [Google Scholar] [CrossRef]
  33. Tirelli, P.; Borghese, N.A.; Pedersini, F.; Galassi, G.; Oberti, R. Automatic monitoring of pest insects traps by Zigbee-based wireless networking of image sensors. In Proceedings of the 2011 IEEE International Instrumentation and Measurement Technology Conference, Binjiang, China, 10–12 May 2011; pp. 1–5. [Google Scholar]
  34. Sun, C.; Flemons, P.; Gao, Y.; Wang, D.; Fisher, N.; La Salle, J. Automated image analysis on insect soups. In Proceedings of the 2016 International Conference on Digital Image Computing: Techniques and Applications (DICTA), Gold Coast, QLD, Australia, 30 November–2 December 2016; pp. 1–6. [Google Scholar]
  35. Yun, W.; Kumar, J.P.; Lee, S.; Kim, D.-S.; Cho, B.-K. Deep learning-based system development for black pine bast scale detection. Sci. Rep. 2022, 12, 606. [Google Scholar] [CrossRef]
  36. Le, A.D.; Pham, D.A.; Pham, D.T.; Vo, H.B. AlertTrap: A study on object detection in remote insects trap monitoring system using on-the-edge deep learning platform. arXiv 2021. [Google Scholar] [CrossRef]
  37. Ramalingam, B.; Mohan, R.E.; Pookkuttath, S.; Gómez, B.F.; Sairam Borusu, C.S.C.; Wee Teng, T.; Tamilselvam, Y.K. Remote Insects Trap Monitoring System Using Deep Learning Framework and IoT. Sensors 2020, 20, 5280. [Google Scholar] [CrossRef]
  38. Schrader, M.J.; Smytheman, P.; Beers, E.H.; Khot, L.R. An Open-Source Low-Cost Imaging System Plug-In for Pheromone Traps Aiding Remote Insect Pest Population Monitoring in Fruit Crops. Machines 2022, 10, 52. [Google Scholar] [CrossRef]
  39. Mamdouh, N.; Khattab, A. YOLO-Based Deep Learning Framework for Olive Fruit Fly Detection and Counting. IEEE Access 2021, 9, 84252–84262. [Google Scholar] [CrossRef]
  40. Zhang, Y.; Zhou, D.; Chen, S.; Gao, S.; Ma, Y. Single-Image Crowd Counting via Multi-Column Convolutional Neural Network. In Proceedings of the 2016 IEEE Conference on Computer Vision and Pattern Recognition (CVPR), Las Vegas, NV, USA, 27–30 June 2016. [Google Scholar]
  41. Li, Y.; Zhang, X.; Chen, D. CSRNet: Dilated Convolutional Neural Networks for Understanding the Highly Congested Scenes. In Proceedings of the 2018 IEEE/CVF Conference on Computer Vision and Pattern Recognition, Salt Lake City, UT, USA, 18–23 June 2018. [Google Scholar]
  42. Gao, G.; Gao, J.; Liu, Q.; Wang, Q.; Wang, Y. CNN-based Density Estimation and Crowd Counting: A Survey. arXiv 2020. [Google Scholar] [CrossRef]
  43. Del Río, J.; Aguzzi, J.; Costa, C.; Menesatti, P.; Sbragaglia, V.; Nogueras, M.; Sarda, F.; Manuèl, A. A new colorimetrically-calibrated automated video-imaging protocol for day-night fish counting at the obsea coastal cabled observatory. Sensors 2013, 13, 14740–14753. [Google Scholar] [CrossRef] [PubMed]
  44. Redmon, J.; Divvala, S.; Girshick, R.; Farhadi, A. You Only Look Once: Unified, Real-Time Object Detection. In Proceedings of the 2016 IEEE Conference on Computer Vision and Pattern Recognition (CVPR), Las Vegas, NV, USA, 27–30 June 2016; pp. 779–788. [Google Scholar]
  45. Wang, C.Y.; Bochkovskiy, A.; Liao, H.Y.M. YOLOv7: Trainable bag-of-freebies sets new state-of-the-art for real-time object detectors. arXiv 2022, arXiv:2207.02696. [Google Scholar]
  46. Ovadia, Y.; Halpern, Y.; Krishnan, D.; Livni, J.; Newburger, D.; Poplin, R.; Zha, T.; Sculley, D. Learning to Count Mosquitoes for the Sterile Insect Technique. In Proceedings of the 23rd SIGKDD Conference on Knowledge Discovery and Data Mining, Halifax, NS, Canada, 13–17 August 2017. [Google Scholar]
Figure 1. (a) The camera-based funnel trap. (b) The 3D-printed toroid housing allows the electronics and camera to sit on top of the funnel trap and does not need a customized bucket.
Information 14 00267 g001
Figure 2. (a) A typical example of a single H. armigera in the e-funnel’s bucket. (b) Synthesized picture using 14 different subpictures like the ones in the bottom row. (c) Cropped H. armigera subimage of the targeted insect and its corresponding pair after automatic background removal. (d) P. interpunctella automatically cropped and its associated sub-image after background removal.
Information 14 00267 g002
Figure 3. Typical examples of test set pictures (non-synthesized). (a) A number of 50 H. armigera specimens. (b) A number of 100 specimens of P. interpunctella. Notice the debris, congestion, and the partial or total overlap of some insects. Large numbers of insects in the bucket, disintegration of insects, and occlusion can sidetrack an image-based automatic counting process.
Information 14 00267 g003
Figure 4. Composition of the training, validation, and test sets for each insect species. Each color adds up to 100%.
Information 14 00267 g004
Figure 5. (a) Counting by regression. (b) YOLOv7 counting. (c) CSRNet heatmap.
Information 14 00267 g005
Figure 6. A study of partial or almost total occlusion of insects. All pictures contain exactly two specimens. In (a,b) there is almost no occlusion. In (c,d) we have cases with about 25% overlap (mild overlap). In (e,f), the overlap is about 75% (heavy overlap). In (g,h), we see cases with almost total occlusion.
Information 14 00267 g006aInformation 14 00267 g006b
Figure 7. Counting the cases of two H. armigera insects with partial overlap (0–100% with 25% increments). # denotes number. Three approaches: YOLOv7, CSRNet, Regression counting. Up to 25% overlap all algorithms hold strong, with YOLOv7 suffering the most. Counting by regression was found to be the most robust in overlap cases. In the range of 75% overlap, the algorithms start to err systematically, with regression having the best outcome. In the case of almost 100% overlap, all algorithms collapse.
Information 14 00267 g007
Table 1. The bold numbers in the first row indicate the total number of insects in each folder. The numbers below this row indicate the number of pictures contained in each folder. Class 0 consists of pictures of the background, which contain either a clean photo of the bucket or debris. The training set is synthesized using only the insects contained in #1. The # of individuals denotes the number of insects in the bucket of the funnel trap ranging from 0 to 100.
# of Individuals01101112131415161718192050100
H. armigera79230202333252624262528272720
P. interpunctella7920 102546
Table 2. Parameters and loss functions of counting algorithms. MSE stands for mean square error.
YOLOv7/8CSRNetRegression ResNet18
Training frameworkPyTorchPyTorchPyTorch
OptimizerSGDADAMADAM
Learning rate1 × 10−21 × 10−51 × 10−3
Loss functionLocalization loss (Lbox), confidence loss (Lobj), and classification loss (Lcls)MSEMSE
Input channels333
Table 11. Measuring the error in counting the cases of two insects with partial overlap (0–100% with 25% increments in overlap) in 53 images.
Model NamepaMAETime (ms)
Yolov7 CONF 0.4 IOU 0.40.710.86543.7
Yolov8 CONF 0.3 IOU 0.80.760.47645.0
CSRNet_HVGA0.880.226106.8
Count_Regression_resnet180.720.54383.5
Count_Regression_resnet500.930.13717.2
Disclaimer/Publisher’s Note: The statements, opinions and data contained in all publications are solely those of the individual author(s) and contributor(s) and not of MDPI and/or the editor(s). MDPI and/or the editor(s) disclaim responsibility for any injury to people or property resulting from any ideas, methods, instructions or products referred to in the content.

